Abstract
Urbanization plays a critical role in changing the urban environment. Most developed countries have almost completed urbanization. However, with more and more people moving to cities, the urban environment in developing countries is undergoing significant changes. Sustainable development cannot be achieved without significant changes in building, managing, and responding to changes in the urban environment. The classified measurement and analysis of the urban environment in developing countries and the real-time understanding of the evolution and characteristics of the urban environment are of great significance for decision-makers to manage and plan cities more effectively and maintain the sustainability of the urban environment. Hence, a method readily applicable for the state-of-the-art computational analysis can help conceive the rapidly changing urban socio-environmental dynamics that can make the policy-making process even more informative and help monitor the changes almost in real-time. Based on easily accessible data from Google Earth, this work develops and proposes a new urban environment classification method focusing on formality and informality. Firstly, the method gives a new model to scrutinize the urban environment based on the buildings and their surroundings. Secondly, the method is suited for the state-of-the-art machine learning processes that make it applicable and scalable for forecasting, analytics, or computational modeling. The paper first demonstrates the model and its applicability based on the urban environment in the developing world. The method divides the urban environment into 16 categories under four classes. Then it is used to draw the urban environment classes maps of the following emerging cities: Nairobi in Kenya, Mumbai in India, Guangzhou in China, Jakarta in Indonesia, Cairo in Egypt, and Lima in Chile. Then, we discuss the characteristics of different urban environments and the differences between the same class in different cities. We also demonstrate the agility of the proposed method by showing how this classification method can be easily augmented with other data such as population per square kilometer to aid the decision-making process. This mapping should help urban designers who are working on analyzing formality and informality in the developing world. Moreover, from the application point of view, this will provide training data sets for future deep learning algorithms and automate them, help establish databases, and significantly reduce the cost of acquiring data for urban environments that change over time. The method can become a necessary tool for decision-makers to plan sustainable urban spaces in the future to design and manage cities more effectively.
1. Introduction
Urbanization is the most critical factor in urban environmental change. Most developed countries have almost completed urbanization. In North America, Europe, the Caribbean, and Western Asia, the population living in urban areas has exceeded 68%, most of which are close to 80% [1]. The annual growth rate of urbanization in these areas is also relatively low, most of which are about 0.25% [2]. However, the cities in many developing countries, the urbanization process has started, and in some, the rate is very high. The proportion of the urban population in Northern Africa is currently slightly higher than 50% [1], and urbanization is advancing slowly at a relatively stable pace. In comparison, the urbanization rate of Eastern Asia is faster and close to that of the more developed regions.
The challenge of urban research is the rapid rate of large-scale urbanization in developing countries [3]. The number of urban residents in various countries increased from 751 million in 1950 to 4.2 billion in 2018 [4]. It is estimated that by 2050, the world’s urban population will increase by 55%, increasing by about 2.5 billion [4]. More than 60% of the world’s urban population growth occurs in cities in developing countries pursuing high-rise and compact urban development [5]. Nearly 90% of the new urban population will live in Asia and Africa [4]. Its frontiers include sub-Saharan Africa (with an urbanization rate of 40% and an annual growth rate of 1.4%), South Asia (with an urbanization rate of 36% and a yearly growth rate of 1.2%), and southeast Asia (with an urbanization rate of 49% and an annual growth rate of 1.3%) [6]. As many people move to cities, the urban environment in developing countries is undergoing significant changes. Therefore, it is necessary to understand the urban environment in these areas better to deal with socio-environmental problems that may arise.
The population growth and migration brought about by urbanization have led to the prosperity of big cities. The unprecedented dynamics and scale of migration pose a fundamental challenge to the global human society, especially in developing countries. The rapid proliferation of informal areas is becoming an essential feature of cities. Sustainable development cannot be achieved without building and managing our urban environment. The United Nations Sustainable Development Goals (Goal 11: Sustainable cities and communities) and many international efforts to solve global urbanization problems aim to understand the urban environment and accurately grasp population data [7].
The classified measurement and analysis of the urban environment in developing countries and the real-time understanding of the evolution and characteristics of the urban environment can provide a critical scientific basis for a wide range of stakeholders to allocate valuable resources and realize the sustainable development of cities. At the same time, it also constitutes the basis for the global efforts to understand, track and improve the human living environment. In the era of global urbanization, it is of central significance to create such an interdisciplinary urban environment classification method and data set. However, in most developing countries, such databases are lacking.
Based on the easily accessible data from Google Earth (https://earth.google.com/ (accessed on 22 March 2022)), this paper proposes a new urban environment classification method by improving the method proposed by Dovey and Kamalipour [8]. In this method, the urban environment is divided into buildings and access networks, from which 16 categories and four classes are generated, and the classification method is applied to mapping. Then, we combine it with population data to discuss the characteristics of different urban environments and the differences between the same classes in other cities. The primary focus of this mapping method is to provide labeled data sets for future deep learning algorithms and automate them. The method is a low-cost, fast and scalable complement to the urban mapping methods in practice, such as direct observation, visual recording, and surveys. This method can significantly reduce the expensive cost of classifying the urban environment that changes over time and can help us establish a database. These results can become a necessary tool for the decision-makers to plan sustainable urban spaces in the future to design and manage cities more effectively.
1.1. Urban Development, Socio-Cultural Context, and Informal Area
In urban development, cities in many developed countries have established more extensive residential areas around the urban area. On the contrary, cities in developing countries in Asia, Africa, and Latin America are falling far behind [9]. These cities have the most compact and dense urban core areas and apparent mixing of urban and rural land, with more complex and irregular edges. Global economic, social, political, and environmental changes also blur their boundaries in urban and rural areas. For example, cities surrounding the countryside in China form a Chinese-style informal area-"Urban villages," resulting in a complex urban environment [10]. Hence, it is not easy to define the urban environment disregarding the particular country’s socio-cultural and urban development context.
The rapid growth and dynamic changes of cities have set obstacles for policy measures and planning rules. With the population growth in the developing countries, rural populations are migrating to cities as large-scale urban migrants, resulting in the emergence of many informal settlements or slums that do not belong to the formal norms of the state in terms of land tenure, urban planning, design and construction [11].
The definition of informal settlements is mainly qualitative and depends on the environment. Although the terms "slum" and "informal settlements " are often used interchangeably in the literature, according to the definition of UN-Habitat, "informal settlements " refers to residential areas without the security of tenure for residential land or houses, ranging from squatters to informal rental housing. These communities usually lack or are cut off from essential services and urban infrastructure; their homes may not comply with current planning and building regulations and are usually located in geographically and environmentally hazardous areas [12]. In this paper, we define such settlements as "informal areas." For a long time, the disordered development of small buildings, narrow lanes, and irregular access networks have been used to identify informal areas [13,14].
1.2. Importance of Urban Environment Classification
If we want to pay attention to the development of cities, it is necessary to have tools to monitor the formation and growth of the urban environment as the cities change. The sustainable development goals of the United Nations emphasize the need for urban environmental information [15]. The classification and mapping of urban forms help to understand the characteristics and changes of the urban environment and provide an essential reference for regional form evolution and boundary division. The process also provides in-depth understanding and training for practical application fields related to urban development, planning, architecture, urban management, public policy, etc. [16]. It is essential to understand the urban environment and its complexity and link urban morphology parameters with spatial performance.
Kärrholm pointed out the importance of understanding urban morphology and classification as critical elements of sustainable urban development [17]. For example, these classifications help understand informal areas’ location and improve their infrastructure and living environment through minor interventions [18]. Urban environmental mapping helps understand how urban form constitutes the emergence and interaction of urbanization in informal areas [19].In addition, the classification of plants and residential areas in satellite images can help urban planners to build infrastructure for managing industrial waste, water, and air pollution [20]. In addition, urban renewal and redevelopment plans also need spatial databases to continuously track urban development for fund allocation and development monitoring [21]. To this end, urban environmental classification and mapping may also contribute to establishing databases that can be shared and used by different development agencies.
1.3. A Review on Urban Classification and Mapping
The urban environment refers to the main physical elements that constitute and shape the city, including green spaces, artificial or natural roads, squares (public spaces), blocks, plots, and regular, random, complex, or dense buildings [22]. Lehner et al.proposed an internationally applicable urban structure [23]. The urban environment can be described according to its architectural layout, road pattern, land use, and green spaces [24]. The most extensive is the dichotomy between built-up areas and non built-up areas.
Since the 1990s, with the development of Geographic Information Systems (GIS), more and more researchers have tried to determine the complexity of the urban environment from a more comprehensive perspective. City classification comprises the three core elements of streets, plots, and buildings in a complex urban environment [25]. Generally, the types and conditions of individual buildings [26,27], and the spatial layout of these buildings [28,29], constitute the urban environment [25].
The spatial structure and pattern of cities are diverse and complex [30]. However, most of the early studies on urban classification are relatively simple. They only distinguish the types and conditions of individual buildings [10,31] and take the density, height, scale, or physical characteristics of the site of buildings as typical indicators [32,33,34].
Many classification studies are devoted to the analysis of urban spatial scale. Haklay et al. used satellite images and urban spatial scale to simulate urban development and land-use change [35]. Fumega et al. established ten indicators to classify Lisbon cities and analyze the evolution of urban morphology [36]. Taubenbóck et al. calculated seven spatial scales using satellite images of 77 cities, obtained five different urban morphology dimensions (complexity, centrality, compactness, porosity, and density), and compared typical urban morphology through cluster analysis to compare different urban cases [25,37]. They used high-resolution satellite data and auxiliary data sources to generate three-dimensional (3D) models in Lod-1. The building density, building direction, heterogeneity index, building size, and height of 44 cities are grouped in a square chart. Deebank Verma et al. divided cities into four categories: slums, built slums (excluding slums), green spaces, and water, and then drew a map of Mumbai [38,39]. In addition, these studies are presented in the form of digital data or three-dimensional models, which may not be intuitive to understanding the urban environment. There are no consistent available data and standards, and there are limitations in the global comparison of urban environments.
Kamalipour developed a non-dichotomy typology through direct observation and visual recording and applied it to the urban environmental mapping of informal areas [40,41,42]. Moreover, Dovey and Kamalipour argue that the urban environment should have multi-scale types and be organized according to the differences between architecture and urban design and architecture and street/block layout. The urban environment is divided into two scale types: architectural form and urban design based on Google Earth images. These two scale types can be divided into "informal," "formal/informal mixed," and "formal" conditions according to their degree of mixing, respectively, and combined into a (3×3) grid - nine categories of the urban environment [8]. The classification method of Dovey and Kamalipour is not based on the binary distinction of a single benchmark but based on the form of architecture and urban design. It classifies the urban form from multiple dimensions and can obtain a visual map close to reality. This method is more intuitive and easier to understand for nonprofessionals than other methods.
Dovey and Kamalipour derived the classification method of the urban environment by estimating the degree of informality/formality. However, due to the complexity of the urban environment, the architectural structure is often closely related to its surrounding architectural environment, formation process, and geographical conditions. The three urban classifications of "informal," "formal/informal mixed," and "formal" may not be sufficient either to represent the inherent characteristics of buildings in cities in developing countries or to better observe the changing trends among them. Therefore, from the perspective of urban environmental characteristics, the formal/mixed/informal classification method has limitations.
In addition, although these visual recognition methods based on remote sensing images have high recognition accuracy in a small range, they need more time and professional knowledge in many cases. Intensive labor is required if we want to scale up to cover many cities. As a result, the process may become tedious and inefficient. Hence, a more conducive methodology may be required to make the classification process scalable, context-dependent, and readily usable for computational analysis.
This paper improves the urban classification method proposed by Dovey and Kamalipour and offers a novel urban classification method that is scalable, cost-effective, and ready for computational analysis. The method divides the urban environment into two indicators based on different features of buildings and access networks. The process divides the urban environment into 16 categories that are combined to constitute four urban classes to indicate formality and informality. The method is different from most of the classification methods based on the binary elements of the urban environment. Here the classes are done according to the development of forms and building characteristics of the urban environment from multiple perspectives considering the complexity and inherent characteristics of the urban environment. Compared with other classification methods, it is visually more intuitive to understand and grasp the actual state of urban development and better observe the possible Spatio-temporal changes. We also demonstrate the agility of the proposed method by showing how this classification method can be easily augmented with other data such as population per square kilometer to aid the decision-making process.
The rest of the paper is structured as follows: Section 2 introduces the methodology of urban environment classification. Section 3 hosts the mapping results and discusses the application of this method in different urban environments. Finally, in the concluding Section 4, we discuss the future possibilities of this method.
2. Methodology of the Proposed Urban Environment Classification
Urban areas and buildings are the basic features of the urban environment. Frey et al. point out that the structure and form of traditional cities develop slowly, and there is no formal planning and design [43]. Marshall argues that the physical characteristics of streets, plots, and buildings are different [44]. An essential part of understanding how cities develop and evolve is identifying specific combinations of these elements.
In ordinary residential planning, roads and blocks are planned first, and buildings are built according to the blocks. Another way is to plan the building in the unplanned area and then plan the street according to the outer contour of the building. However, the formation of towns is not limited to these two models. In addition, there are two mixed modes: the construction of unplanned buildings in the planned road network, and then the road naturally appears amongst the unplanned buildings and the construction of planned buildings in areas without a planned road network. Among the types of buildings, there are planned buildings, historical buildings or old buildings, low-cost buildings, self-built buildings, etc.
To internalize the abovementioned views, we divide the urban natural environment into two indicators: buildings and access networks. The diversity of structures is shown in the building architecture, and categories of access networks are reflected in urban planning.
2.1. Buildings
Kohli et al. discuss the varied architecture of buildings in their slum ontology research of image classification [45]. Based on their study, we have formulated the following evaluation criteria:
Orientation: The evaluation is based on whether the orientation of the building is consistent or inconsistent (compared with the surrounding buildings. Moreover, whether it is arranged arbitrarily due to the lack of a plan, we divided "orientation" into planned and no planning in building indicators.
Shape: whether the geometry of a building is regular. Regular figures include: square, rectangle, sector, circle, etc.; irregular shapes include: irregular polygon, unequal square, irregular circle, etc. In building indicators, we divided "shape" into regular and irregular.
Size: In assessing the standard size of buildings, we divided buildings into residential buildings (residential buildings for living in) and non-residential buildings (referring to service buildings, including office buildings, hospitals, schools, airports, and factories, according to the data of CBECS [46].) We can know the average construction area of each country and region. Among residential buildings, the middle size of residential buildings in Hong Kong is the lowest, 45 square meters.
In general, houses in developing countries are often smaller than those in developed countries, and rural homes are smaller than urban houses on average. The middle area of non-residential buildings is about 465 square meters among non-residential buildings [46]. We, therefore, divide "size" into three building indicators: small, medium, and large. We define structures below the average area of residential buildings as small (about less than 50 square meters), buildings above the middle area of residential buildings and below the average size of non-residential buildings as medium (about 50–500 square meters), and buildings more significant than the average area of non-residential buildings as large (more than 500 square meters).
Materials and colors: This refers to the materials used for construction, such as concrete; brick; tile; corrugated paper; metal plate; rubber; plastic, etc., and the color of materials, such as grey; brown; red, and blue. We divide "materials and colors" into ’different’ and ’identical.’
Height: the height of a building can be estimated from its image and shadow, with three features: low level (1–2 floors), middle level (2–10 floors), and high level (above 10 floors). We divide "height" into low, medium, and high in the building indicators.
Density: we divide "density" into low density, medium density, and high density. The types of building density mainly depend on our professional experience and the density perception of urban space. We take the building conditions, vegetation, and open space around the identified object as the reference and take the easily identified high-density and low-density buildings as the benchmark to determine the medium-density buildings.
Location and neighborhood characteristics: Buildings in flood-prone areas, swamps, or situated near farmlands and along roads; self-built houses in the suburbs; cheap houses or self-built houses in urban or suburban locations within a chaotic environment; old houses in cities; buildings in historical blocks; factories; and high-rise office buildings; newly planned or developed urban buildings or residential buildings. Based on this urbanization and characteristics of the architectural environment, we divide "positioning and characteristics" into "self-built houses or rural buildings in the suburbs,"; "low-cost houses or self-built houses within a chaotic environment in cities or suburbs,"; "old blockhouses, historical block buildings, factory buildings, commercial buildings, and office buildings in cities"; "urban buildings or residential buildings newly planned or developed."
Then, using these indicators, we divide the buildings into four types: (1) Type "None," (2) Type "limited," (3) Type "unwritten," (4) Type " coded." (Table 1)

Table 1.
Proposed building types based on features discussed in Section 2.1.
The first type is "None." This kind of building has not been planned. Its architecture is usually irregular in shape, of medium-scale, and primarily medium height buildings. These buildings are made from different types and quality of materials, such as brick; concrete; iron and wood; corrugated paper; metal plate; rubber; plastic, etc. Therefore, the quality and colors of the buildings are different. These buildings are diversified and have no construction restrictions. It is usually manifested as self-built houses and rural buildings in the suburbs, which are defined as "None" and marked with a number (1);
The second is "Limited." This kind of building has not yet been planned. However, they are built-in specific areas near factories, riversides, railways, etc. These buildings are usually made of cheap materials, such as iron sheets; cardboard; wood; or low-quality concrete, so the building surface presents a variety of colors. These buildings are usually irregular in shape and minor in the area. They are generally low-cost houses in cities or suburbs or self-built places with unclean living environments, no planning, and low quality. These buildings are defined as "limited" and marked with a number (2);
The similarity between the types "None" and "Limited" is that most of their buildings are Self-built. The most significant difference between them is that the buildings in the type "None" are usually located in suburban or rural areas and are not limited by geographical location, economic conditions, or construction technology, such as privately built villas built in rural areas. In contrast, buildings within the "Limited" types are usually located in cities or suburbs, limited by geographical location building material, such as high-density informal areas in cities.
The third type is "Unwritten." This kind of building is not fully planned. The shape of the building is usually more regular, large scale, medium building height, and building materials are generally red brick; green brick; concrete; glass; tiles, etc. As time goes on, these buildings are usually represented as old blockhouses, historical block buildings, factory buildings, commercial buildings, and office buildings. These buildings are defined as "Unwritten" and numbered (3);
The fourth type is "Coded." This kind of building is thoroughly planned. These buildings are usually regular in shape, large in area, and constructed of the same materials (such as concrete). Most of these buildings are high height. They are usually urban buildings or residential buildings newly planned or developed. These buildings are planned and have significant similarities with adjacent buildings. So, it is defined as " Code" and numbered (4).
It is easy to distinguish the various building types represented by code (3) "Unwritten" and (4) "Code." However, it is difficult to differentiate between the code (2) "Limited" building types. Most are not planned; they are usually cheap houses or self-built houses within a chaotic urban or suburban environment. Many of them are temporary buildings, and the size and materials of the buildings are constantly changing. It is an area of mixed styles with other types of architecture. Most of these buildings are located on slopes, lowlands, rivers, and industrial areas with land risks. Type (1) "None" is primarily located in suburban or rural areas.
2.2. Access Network
Another indicator, the access network, is divided into four types according to the regularity (natural generation or planned) of the access networks inside and outside the building (Table 2). Whether the identified object is inside or outside depends on the range of the smallest unit of our visual recognition (400 m × 400 m).
Table 2.
Different types of Access networks based on features described in Section 2.2.
The critical criterion for distinguishing between "natural generation" and "planned" is whether the formation mechanism of the access network is top-down planning (after the implementation of the overall plan, the lower level stakeholders will implement the construction) or bottom-up planning (after the construction by the grass-roots users or stakeholders will be incorporated into the overall plan).
Planned: The street network is formed from top to bottom. After planning, these streets usually have complete pavement, with consistent straight lines, constant curves, the same street width, and neatly divided plots.
Natural generation: It is self-organized and gradually formed from bottom to top. Streets of different widths bend irregularly and are connected in a rhizomatous form. Although there is usually a potential order, its form may be variable and mixed. For example, due to the high degree of self-construction and the formation of roads with the outline of buildings, informal areas usually form a naturally generated very complex and chaotic roadway network and typically have no pavement.
We define the inside and outside roads generated over time as natural. as "natural generation." We mark them with the letter (A);
In terms of the access network, another type of road network is defined as "planned outside + natural generation inside," marked with the letter (B);
The third type is called "natural generation outside + planned inside," The road networks outside the urban buildings are naturally generated, but the roads inside the urban area are planned. We marke them with a letter (C).
Finally, we define the street networks as "planned," as they are planned both inside and outside of the urban areas, and we mark them with a letter (D);
2.3. Two Axes and 16 Categories
The described four indicators of "building diversity" (marked with numbers 1, 2, 3, 4) are mapped on the vertical axis, and the four indicators of "access network" (marked by the letters A, B, C, and D) are mapped on the horizontal axis. In combination, the two indicators form 16 categories (Table 3).
Table 3.
Sixteen urban environment categories are based on buildings and urban patterns.
We have selected Dhaka, Bangladesh, as a case study. The satellite images and street views of the 16 categories are shown in (Figure 1).
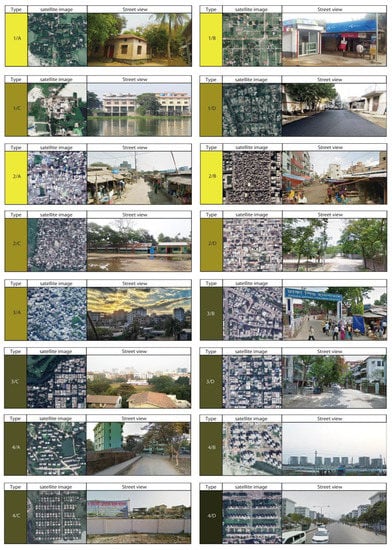
Figure 1.
Sixteen urban environmental categories. (Dhaka, Bangladesh). Satellite Image: Google Earth; Image: Google Street View.
Based on the square area of 400 m × 400 m, we introduce 16 categories of Urban environmental:
1A: both internal and external roads are natural, and buildings are unrestricted. This category of the building is all over the suburbs and countryside;
1B: external road planning, internal road natural generation, and restricted buildings;
1C: generate external roads are naturally generated, planned internal routes, and planned buildings without restrictions. Most of these buildings are built on suburban or rural planning land;
1D: external and internal roads are well planned, and public buildings;
2A: internal and external roads are naturally generated by low-quality buildings. This category exists in large, high-density residential areas in the suburbs and downtown. There may be no streets in the area at all;
2B: external roads are planned, internal roads are generated naturally, and many low-quality buildings are built. From the transition from rural to urban areas, we can see this category; the original low-quality buildings have become denser and denser;
2C: external roads are naturally generated, internal streets are planned, and many low-quality buildings. This area has no clear boundary, so it is easy to expand. It can be found in factories and residential areas in the suburbs;
2D: the planning of both external and internal roads is of low quality. The government’s low-cost housing is of this category;
3A: both internal and external roads are naturally generated, and the buildings do not have recorded written plans. This category occurs in old residential areas in the suburbs;
3B: external roads are planned, internal roads are generated naturally, and buildings constructed by unwritten rules are built;
3C: external roads are naturally generated, and internal routes are planned. Buildings constructed by unwritten rules;
3D: refers to buildings with well-planned internal and external roads and unwritten construction rules. This category is common in public buildings or high-end residential areas in urban areas;
4A: internal and external roads are natural. Streets between buildings have not yet been planned. The appearance of these buildings is the same. This category is rare in urban areas but is often found in prefabricated houses in the suburbs;
4B: external roads are planned, and internal roads are naturally generated. The appearance of these buildings is the same. This category can be seen everywhere in the city center’s high-end residential and villa areas;
4C: external roads are naturally generated, and internal routes are planned. The appearance of these buildings is the same. This can be seen in the urban development of suburbs and open areas;
4D: Internal and external roads are planned, and the appearance of these buildings is the same, usually new urban planning or extensive town development;
In comparison with the classification methods of Dovey and Kamalipour [8], our method differs in two distinct ways. First, the mapping range of Dovey and Kamalipour is (30 km × 30 km). However, we mapped the city on a consistent scale of (50 km × 50 km). Our study indicates that informal urbanization tends to spread from the urban center to the city’s periphery, often beyond the framework of (30 km × 30 km). The scope of (50 km × 50 km) can cover most cities. Our goal is to establish an appropriate framework that can compare multiple cities. Second, we develop Dovey and Kamalipour’s nine categories of the (3 × 3) method into a framework of 16 categories (4 × 4) method. In the indicator of the vertical axis - single building, we developed the three types of "informal / mix / formal" in the (3 × 3) method into four types of “none / Limited/unwritten/coded.” We think that a single building is not only distinguished by the simple two-dimensional gradient method of formal or informal but also classified according to its different urban morphological characteristics. This helps to clearly understand how the 16 categories in the (4 × 4) method change compared with each other and what kind of change trend they have over time.
For example, when the type is changed from "None" to "limited," we know that the region may have experienced urbanization and population migration, turning the originally rural area into an informal settlement with high population density. However, this is not easy to read from the (3 × 3) method. This research on the urban environment change can also be one of our future topics; In the indicator of the vertical axis - road network access, we also develop the three types of "informal / mix / formal" in the (3 × 3) method into four types based on the internal form and external form so that we can clearly understand whether the road is formed before the building or the building is formed before the road in a classification object. This method allows us to understand the informality of the target area and the formation mechanism of urban morphology in a specific area from satellite images.
3. Discussion on Using the Proposed Method in Varied Urban Contexts
3.1. Urban Environmental Classification
The proposed method is used to classify the urban environment of six cities in six regions of the developing world: Nairobi, Kenya in Central Africa; Mumbai, India in South Asia; Guangzhou, China in East Asia; Jakarta, Indonesia in Southeast Asia; Cairo, Egypt in North Africa; Lima, Peru in South America. (Figure 2)
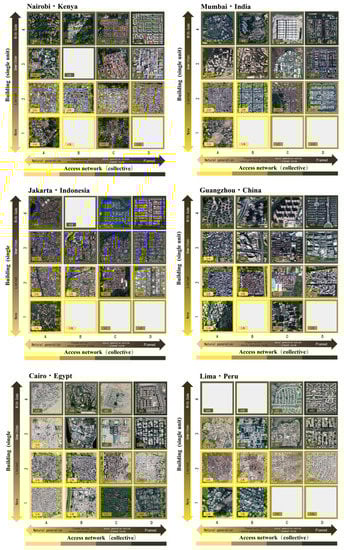
Figure 2.
Urban environmental classification method of six cities. Satellite Image: Google Earth.
Although we used the same classification standard to classify all six cities, there are still significant differences in the urban environment in the different regions (Figure 3). These differences are mainly reflected in the geographical characteristics; building materials; building size; building shape; building height, etc.
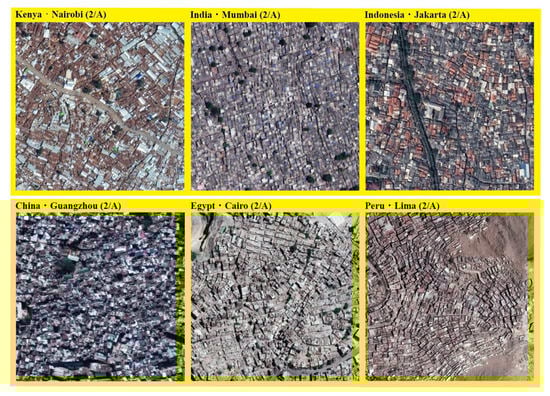
Figure 3.
Satellite image of the same urban environment category (2/A) for six cities. Satellite Image: Google Earth.
The cities we chose included tropical, subtropical, Mediterranean, arid (such as Cairo in Egypt), and continental climates, as well as flat, low-lying areas (such as Mumbai in India) and steep plateau cities (such as Lima in Peru). For example, we did not find a 4/B house in Jakarta, Indonesia, which indicates that there may be few high-end residential areas and villas in the center of Jakarta. In addition, we could not find category 3/B in Nairobi, categories 1/B, 1/C, and 1/D in Mumbai, or categories 4/A and 4/B in Lima.
Although the classification rules are unified, and the density and morphological trend of the same category are the same, we will find subtle differences after careful observation. Let us take category 2/A as an example. From the perspective of color variation in the satellite image data, each of the six cities uses different building materials. More visible rusty metal plates are used in buildings in Nairobi, Kenya. Red bricks and tiles are widely used in Jakarta, Indonesia. In Guangzhou, China, concrete and blue roofing materials are used. The building materials in Cairo, Egypt, and Lima, Peru are closer to the color of the land. Secondly, Mumbai in India has a smaller building area and higher density, while Nairobi in Kenya has larger and broader roads. The shape of buildings in each city is also different. The buildings in Lima, Peru are narrow and winding; But in Nairobi, Kenya, it is rectangular; In Guangzhou, China, Jakarta, Indonesia, and Mumbai, India, the buildings are square; Many buildings in Cairo, Egypt, are a mixture of rectangles and squares. In addition, from the perspective of building height, from the projection of buildings, it can be seen that the buildings in Nairobi, Mumbai, Jakarta, and Lima are the same height, i.e., relatively low; the height of buildings in Guangzhou is the highest, followed by Cairo.
Hence, the elaboration of the global view of the urban environmental classification method needs to adapt to local conditions. Fortunately, the 16 categories methods in this study scale well with all the cities we have scrutinized, indicating their widespread adaptability.
In the cities of developing countries, it is usually possible to distinguish between formal areas characterized by appropriate spatial planning and facilities (buildings, green spaces, road infrastructure) and Informal areas with imperfect urban development. Informal areas are usually irregular and have restricted buildings near dangerous land; industry; garbage; swamps; and flood-prone areas [47].
Analyzing the relationship between the category of the urban environment and the degree of formality/informality, we can easily observe that the buildings of 2/A, 2/B, and 1/A, 1/B in the lower-left corner are often of low quality, high density, small building area, cheap materials, little or no green spaces. Most importantly, the internal roads are chaotic and narrow. Sometimes, there are no roads at all. We call it a highly informal area, represented by color 1. Among the five categories of 1/C; 1/D; 2/C; 2/D; and 3/D, 1/C and 2/C have a long history in the city’s suburbs. Although they have natural roads outside, they contain planned buildings inside.
On the other hand, external routes are planned in 1/D and 2/D categories. Internal buildings’ size, direction, and materials are relatively unified, but the densities are high, and the area is small. By the way, 3/D category roads and buildings are not planned. Due to these five categories, the density is high, the building area is moderately small, and the building materials are not cheaper, so there are few plants or open space. These five categories tend to develop into informal areas, and the settlements are defined by color 2. From the categories of 3/B; 3/C; 3/D; 4/A; 4/B; and 4/C, it can be seen that whether the road is planned or not, the road is wide, the urban area is with medium building area, moderate building density, and medium building area, and there are open spaces or green spaces between buildings. We define it as a moderately formal area, represented by color 3. For the 4/D category, the interior and exterior of the road are planned. The roads are wide, the building quality is high, the shape is similar, the density is moderate, the building materials are unified, and there are wide open spaces or plants between the buildings. We call it a highly formal area and use color 4 (Table 4).
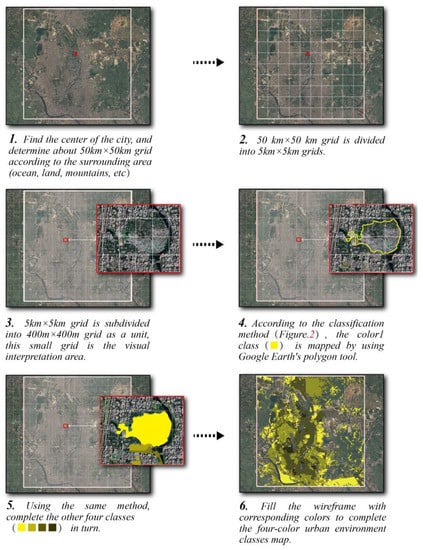
Table 4.
Selection of colors for Urban environment classes.
Figure 4.
Mapping process (Take Dhaka, Bangladesh as an example). Satellite Image: Google Earth.

3.2. Mapping Process of Six Cities
In this section, we elaborate on the mapping process of the six cities (Nairobi, Mumbai, Jakarta, Guangzhou, Cairo, and Lima) and demonstrate the process of drawing their four-color urban environmental classes map.
The mapping process is as follows (Figure 4):
1. The scale of cities varies. We determine the location of the city center according to the surrounding environment (sea, land, mountain, etc.) and draw the city on a consistent scale of 50 km × 50 km. The research finds that this scope can cover the range of most cities, but informal urbanization often extends beyond this framework. Our goal is to maintain an appropriate framework that can compare multiple cities;
2. Subdivide the (50 km × 50 km) large grid into (400 m × 400 m) small grids. In developing countries, the proliferation of informal areas has the most significant impact on sustainable urban development in the urban environment. We want to make the cell grid easier to identify informal areas. In the survey of cities with more than 1000 informal areas, Frieden et al. found that the side length of most informal areas was between 31.6 m and 316 m [48]. We set the size of the grid for unit visual interpretation as 400 m × 400 m so that the scope of our delimited unit grid can cover most of the content of a single informal area. This small grid is more conducive to our rapid visual interpretation;
3. Determine the visual interpretation area;
4. According to the proposed urban environment classification method (Figure 2), we use the polygon tool of Google Earth to draw the classes map of colour1 (■). Moreover, we mark the boundary of the area with thick lines;
5. Complete the remaining four classes (■■■■) using the same method.
6. Fill the wireframe with the corresponding color to complete the six cities’ four-color urban environment classes map (Figure 5).

Figure 5.
Ground truth map and four colors map of urban environmental classes (Six cities), Satellite Image: Google Earth.
3.3. Six Cities and Their Urban Environmental Structure
(1) Nairobi: Nairobi, the capital of Kenya, is located on the edge of the agricultural region of the central highlands. It is located on the eastern edge of the rift valley at 5889 feet (1795 meters) [49]. The Ngong Hills occupy the west of the city. Mount Kenya is north of the city, and Mount Kilimanjaro is southeast of Nairobi. The Nairobi River and its tributaries flow through Nairobi province and join the Athi river at the county’s eastern edge. Nairobi City is jointly developed by Kenya Uganda Railway (Kur), Nairobi River, and Mbugiti river [50].
Since independence, the city has grown at a fantastic rate. A total of 3.9 million people live in Nairobi, double the number since the 1986 census. Nairobi’s population density varies widely, peaking in the city’s informal areas, where about 60% of the population accounts for only 6% of the land [51]. There are five million people in nearly 200 colonies. The city reflects the contrasts of Kenyan society. Nairobi’s old and formal areas are concentrated in the middle of the town and the east and west sides. There are many large informal areas around the factories along the railway. The most common are corrugated iron roofs (98%), cement floors (68%), and tin or corrugated iron walls (45%), and it is difficult for informal area dwellers to get paid employment. About 49% of adult informal area dwellers have regular or temporary jobs, 19% of households work in micro-enterprises, but at least 26% are unemployed [51].
(2) Mumbai: Mumbai is the most populous city in India, with 13 million. It is located on Salsette Island, off the coast of Maharashtra. There are three mountains in the city parallel to the central railway line, and the Ghatkopar mountain, occupied by informal areas, is located near the Ghatkopar station. According to UN World Urbanization Prospects, Mumbai’s population in 2021 is now estimated at 20,667,656 [52]. Since 1991, Mumbai’s population has more than doubled. The growth of informal structure is a feature of Mumbai’s urbanization. Ford District in the south of the city is a financial district, while the south (near Colaba) and west are residential areas along the Deep Bay coast and Malabar mountain. Further north, there are more residential areas, and newer industrial and informal areas are beyond them. There are many factories in Mumbai, and the growing traffic and nearby refineries have produced an alarming amount of air and water pollution. Many of its residents live in informal urban settlements to cope with Mumbai’s expanding population. These informal and other settlements are mainly located along traffic lines and in environmentally vulnerable areas. According to the Pranab Sen Committee report, in Mumbai, 41.3% of the population lives in informal areas, which means nine million people live in these areas. Dharavi is Mumbai’s largest informal area. These informal areas are generally made of corrugated metal and other recycled materials. People often work in dangerous occupations or dangerous conditions in these informal areas. These jobs include collecting cloth; breaking down and recycling old electronic products; recycling waste; making pottery; selling things on the street, etc. Many of these jobs use simple tools and are labor-intensive [53].
(3) Jakarta: Jakarta is the largest city and capital of Indonesia. Jakarta is located on the northwest coast of Java Island, at the mouth of the Jakarta River, on a flat low alluvial plain. It was once a vast swamp in history. Like other big cities, Jakarta has air and noise pollution. The city’s commercial and financial center is located in the south of Kota, mainly along the Jenderal Sudirman and Mohammad Husni Thamrin highways in central Jakarta. The population growth in the Jakarta Metropolitan area is the main reason for informal areas. According to the Indonesia 2020 census, the Jakarta Metropolitan area has an area of 6343 km2 and a population of 31.24 million, the most populous area in Indonesia. Informal areas account for more than 11% of the total population in northern Jakarta [54]. Some informal areas are located near the Ciliwung estuary north of Jakarta, Balu, Jakarta, and Mangga Dua. These include older Kampung or semi-formal villages integrated with modern formal regions. Over time, these villages have become informal. Most of these houses are made of wood or bamboo mats, and the building materials are wood, bamboo, cardboard, and plastic. The residents of Kampung are generally engaged in the city’s total cheap labor [55]. From the urban environment map, Jakarta is probably the most challenging city to draw a line between the formal and informal cities.
(4) Guangzhou: Guangzhou is located in the south of China. Its center is close to the upper reaches of the Pearl River Delta, with a total area of 7434 km2. According to the census, there will be 18.6766 million permanent residents in 2020 [56]. Because of its location at the intersection of inland rivers and oceans, it has long been one of China’s major commercial and trade centers. The central part of Guangzhou extends along the south of the Yangtze River and then eastward along the Pearl River. The old urban area, Liwan District in the west and Tianhe District in the east, is located on the north bank. On the south bank is Haizhu District, which used to be mainly an industrial zone. It is mainly allocated to business offices, financial institutions, and other service-related activities. Now, all of these areas form the core of the city.
Due to the rapid urbanization process since China’s reform and opening up, the scale of cities has expanded rapidly in the past 20 years. Due to China’s "urban-rural dual" system, some villagers’ cultivated land is gradually surrounded by new cities but not appropriated and developed, forming the residential low-income informal area "Urban village" [57].
At present, there are 288 "Urban villages" within the urban built-up area of Guangzhou, mainly distributed in Panyu, Baiyun, Tianhe, Huangpu, and other districts, covering an area of 534.63 square kilometers, which are distributed in the formal area of the city [58]. There are local rural populations and urban residents and many migrant workers in such urban villages, so public security is incomplete. It is widespread for villagers to build or add to the reserved land without approval and rent it. As a result, the building density of "Urban villages" has increased, and the chaotic situation of construction has intensified. These buildings are mainly made of low-quality brick and concrete.
(5) Cairo: Cairo, the capital of Egypt, is one of the largest cities in Africa. According to the Statistics Bureau, there are 20,901,000 people in Greater Cairo [59]; It covers an area of 1709 square kilometers. Cairo is the gateway to the Nile Delta. Cairo is fan-shaped, with the narrowest valley in the south sandwiched between desert cliffs and the most expansive valley in the north converging with the delta. Since the 1970s, urban development has increasingly occupied agricultural land and extended to the edge of the desert. The three oldest regions, the medieval city, Būlāq, and Miṣral-Qadīmah, a densely populated low-income community, surround the city center. Legal, residential and financial buildings are located in the heart of New Cairo and Giza. At the same time, as the river recedes, the city expands westward to protect the land from floods. However, to meet the growing demand, the urban area of Cairo has expanded to the north and south, and many buildings have been expanded on the West Bank of the Nile River. Cairo has formal areas in the west and north. A relatively new site has also been developed in the east. There are still rural residents in the northernmost part of Cairo and the lower reaches of the Nile. Informal buildings, represented by the illegal informal areas in the highlands around Cairo, usually adapt to the spatial structure of farmland in the narrow strip. These houses are typically made of concrete, clay, or sintered brick, gray, or beige and are often unfinished outside. In most areas, commercial and industrial workshops are scattered in residential buildings.
(6) Lima: Lima is the capital and largest city of Peru. According to the statistics of the United Nations, Lima has a population of 10,883,000 and an area of 2672.28 km2. Lima’s population growth has increased tenfold in the half-century since 1940 [60]. The main urban area of Lima is located in the valley of the Chillon, on the central coastal plainón, plain, Rímac, and Lurí. The city slopes slowly from the Pacific coast into valleys and hillsides of 1550 meters. In the city, there are isolated hills that are not connected with the surrounding mountain chain. Due to the complex geographical characteristics of the ocean, mountains, and desert, Lima’s urban development is mainly concentrated in mountainous areas. Informal areas grow in their periphery. Most informal regions are located in steep hills, foothills, and riverbanks, extending north and east from the city center [61]. The informal areas mainly include commas, Villa El Salvador, San Juan de Lurigancho, and Conosur. Most of the houses in these areas are made of wood and corrugated iron, and most of the residents work as guards, handymen, plumbers, or nannies.
3.4. Population and Area of the Urban Environment
This section demonstrates how the urban classification method can be augmented with other datasets to derive new insights into the urban environment. It shows the area of each urban class and the population distribution in the areas. In six cities in developing countries, the four-color urban boundary map based on this method matches the population data of the 250 m grid in GHSL(Global Human Settlement Layer-European Commission) [62]. The population and area are divided into four classes: highly informal (color 1), moderately informal (color 2), somewhat formal (color 3), and highly formal (color 4). In addition, we marked the unfinished areas (including waters, mountains, deserts, and open spaces) as ’Others’ areas.
Since the collection time of population data is 2015, we can only get general results for reference.
Table 5 introduces the corresponding areas of four urban environment classes in six cities and indicates their percentage in the whole study area.
Table 5.
Area of urban environment classes of six cities (map data of 2019) (km2).
In Figure 6, we represent the percentage of the four corresponding urban environment classes of the six cities in the whole study area with a histogram to see the differences between them.
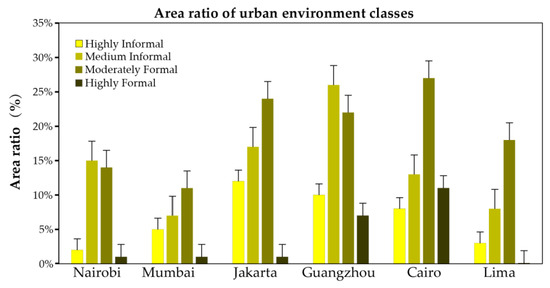
Figure 6.
The area ratio distribution of the urban environment classes of six cities.
Table 6 presents the corresponding population of four urban environment classes in six towns and indicates the percentage of the people in the whole study area.
Table 6.
The population (data of 2015) distribution in urban environment classes of six cities (data of 2019).
In Figure 7, we use a histogram to clearly show the population percentage of the four corresponding urban environment classes of the six cities in the study area to differences between them.
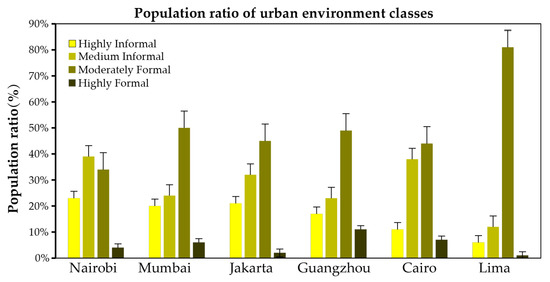
Figure 7.
Population ratio of urban environment classes of six cities.
Table 7 introduces the population density of the corresponding urban environment classes in four of the six cities.
Table 7.
Population density (data of 2015) of urban environment classes of six cities (data of 2019)(Pop. per km2).
In Figure 8, we use a histogram to show the population percentage of four corresponding urban environment classes in six cities and the average population percentage of the whole study area to see the difference between them.

Figure 8.
Population density of urban environment classes of six cities.
In Nairobi, Kenya, the highly informal (color1) population is about 1.03 million, accounting for 23% of the total urban population. The medium informal (color2) population is about 1.76 million, accounting for 39% of the total urban population. The people of these two informal areas exceed the entire population’s average. The highly informal population density (color1) (27,079 pop. per km2) is much higher than other classes of population density, which is 15 times the average population density. The population density of highly formal (color4) (11,627 pop. per km2) is also much higher than that of medium informal (color2) (4651 pop. per km2) and medium formal (color3) (4288 pop. per km2). It can be inferred that this is because the population of informal areas is very dense. In contrast, the population density of the highly formal (color4) class is high, likely due to high-rise buildings’ construction.
In Mumbai, India, the highly informal (color1) (22,760 pop. per km2) is about 2.94 million, accounting for 20% of the total urban population. The medium informal (color2) (19,835 pop. per km2) has a population of about 3.49 million, accounting for 24% of the total urban population. The results show no significant difference in population density among the areas of urban environmental classes in Mumbai. Still, it is about five times higher than the average population density, which shows that Mumbai’s urban population is very concentrated.
In Jakarta, Indonesia, the highly informal population is about 3.46 million (11,161 pop. per km2), accounting for 21%. The medium informal population is about 5.09 million (12,326 pop. per km2), accounting for 32%. It has exceeded 50 % of the total population. The population density of each class in Jakarta is also evenly distributed. The population density of each urban environment classes area is also relatively average.
In Guangzhou, China, the highly informal residential area has a population of 1.9 million, accounting for about 17% (7822 pop. per km2) of the total urban population. Through the observation of various classes of population density in Guangzhou, it is found that the population density of medium formal (color 3) class is the highest (9827 pop. per km2), while the population density of high informal (color1) type is the second (7105 pop. per km2). The distribution of the population in Guangzhou is relatively average.
In Cairo, Egypt, the highly informal (color1) (9129 pop. per km2) population is about 1.7 million, accounting for 11% of the total urban population. The medium informal (color2) (18,263 pop. per km2) population is about 6.06 million, accounting for 38% of the total urban population. In terms of population density in Cairo, the population density of the highly informal area (color 1) is lower than that of the medium informal area (color2) (18,263 pop. per km2), with the medium formal area (color3) (180,596 pop. per km2), ranking third. Many SRAM areas in the region are located in vast rural areas, so the population density is not very high.
In Lima, Peru, the highly informal (color 1) population is about 400,000 (4735 pop. per km2), accounting for 6% of the total urban population. The medium informal (color 2) population is back 830,000 (4281 pop. per km2), accounting for 12% of the total urban population, and the population is overall about 5.48 million. The medium formal (color 3) accounts for 81% (12,157 pop. per km2) of the urban population. In terms of the population density of each of the urban environmental classes area in Lima, the population density of highly informal (color 1) is one-third lower than that of the medium formal (color 3) and highly formal (color 4). Many informal areas in Lima are located on slopes, and houses cannot be high-rise buildings, which seems to be a factor in the low population density in highly informal areas.
3.5. Discussion
The demonstrations of the methods applied to the six emerging cities indicate their significant factors as the source of idiosyncrasy: urbanization, population growth, and regional and geographic differences. We notice an increased presence of highly informal areas in all cities. In Nairobi and Mumbai, more than 50% of the population already live in highly informal areas. Moreover, the medium formal areas occupy the central part of the city and tend to be stable. Apart from the proliferation of highly informal areas, we also notice that highly formal areas (large-scale new towns) are expanding. However, the most startling thing to notice is the proliferation and spread of highly informal regions and the mixing of formal and highly informal regions. In most cities, informal and formal areas are mixed. The edges are highly irregular, making it difficult to draw a clear line, making their urban environment more complex.
We notice an imbalance in population density in different classes of areas among the six cities. Population development is closely related to urbanization. Guangzhou, Jakarta, and Mumbai have average population density and balanced urban development among the six cities. However, Nairobi (27,079 pop. per km2) and Mumbai (22,760 pop. per km2) have incredibly high population densities. The population in these regions accounts for more than half of the total urban population but only occupies a small amount of land. These residents who also live in cities are squeezed into less land. For example, Nairobi’s highly informal area (only 2% of the land in the built-up area) accommodates 23% of the urban population. The difference between the population density of this area and its average population density is about 15 times. In Cairo, the moderate informal areas have the highest population density, suggesting that these areas are likely to shift to highly informal areas over time. Cairo’s highly formal area, which accounts for 11% of the land in the built-up area, accommodates only 7% of the total urban population, indicating that in Cairo, residents of highly formal areas enjoy more residual living space than residents of other urban environment classes. The difference in per capita land consumption shows the variability of the urban environment and indicates the presence of inequality.
Regional and geographical differences play a significant role in contributing to the uniqueness of our scrutinized cities. For example, Lima’s highly informal areas have the lowest population density. This may be related to the distribution of informal areas in Lima on hillsides or at the foot of mountains, and the expansion and diffusion are limited. Due to the deserts in the southwest and southeast of Cairo, the highly informal area can only expand to the smoother east. In contrast, the highly informal area spreads to the rural areas in the upper reaches of the Nile River. Jakarta and Guangzhou are randomly distributed between formal and informal areas because of the characteristics of the plain and many rivers. There is no significant boundary between them, and they are mixed.
4. Conclusions and Future Possibilities
This study introduces a novel urban environment classification method based on freely available satellite images. This new urban classification method focuses on formality and informality. Firstly, the method gives a new model to scrutinize the urban environment based on the buildings and their surroundings. Secondly, the method is suited for the state-of-the-art machine learning processes that make it applicable and scalable for forecasting, analytics, or computational modeling. We discuss the classification process and then demonstrate the applicability to the complex urban environment of six developing cities worldwide.
The paper develops further the method proposed by Dovey and Kamalipour [8]. Our proposed classification method is based on two indicators of the urban environment- building condition and surrounding road network access. Based on the variability of various features of these indicators, we can categorize the urban environment into 16 different categories, revealing the urban environment’s complexity and diversity. These 16 categories later can be combined into four urban classes that indicate formality and informality.
The method is then applied to draw the urban environment classes maps for the following emerging cities: Nairobi in Kenya, Mumbai in India, Guangzhou in China, Jakarta in Indonesia, Cairo in Egypt, and Lima in Chile. Then, we discuss the characteristics of different urban environments and the differences between the same class in different cities. We also demonstrate the agility of the proposed method by showing how this classification method can be easily augmented with other data such as population per square kilometer to aid the decision-making process. The method we propose is easy to replicate, low cost, scalable, and ready to be used as ground truth data for machine learning and various statistical and computational purposes. The method uses Google Earth satellite images as a data source. Compared with other global statistical data, it is comparable and easy to operate.
Due to the complexity of the urban environment, although the method of visual interpretation has high accuracy, it inevitably has a particular subjectivity. For example, some areas have large construction areas and wide roads in the same informal place, while others have small construction areas and narrow streets. Different urban environmental classes are complex and challenging to identify. Therefore, we need to adapt to local conditions in visual interpretation. In addition, the method of this study uses visual interpretation to map; it requires much labor when mapping large-area maps of multiple cities. Therefore, we used a large quantity of the high-precision urban environment annotation data generated in this study as the training data set of a deep learning model to classify and map the urban environment regularly and analyze the changes in the global urban environment in real-time and efficiently. The experiment has been completed [63]. Researchers in other fields can also quickly master and use it, promoting interdisciplinary cooperation and knowledge sharing and better social benefits.
Satellite images from Google Earth played a significant role as a data source. The easy availability of this data makes our method cost-effective and highly scalable. They can be applied worldwide and used to map the urban environment with our proposed unified standards. We have shown this scalability and applicability by drawing the urban environment classes maps of emerging cities in six developing countries on a large scale (50 km × 50 km) by Satellite Images from Google Earth. At the same time, according to the classes of the urban environment and population data, the characteristics of other cities and the differences between different cities are discussed. These results enable us to use quantitative methods to compare and study cities.
The urban environmental status of several representative developing countries shows that rapid urbanization has brought opportunities for new urban development. Still, urbanization is also accompanied by shocking urban expansion and the proliferation of informal urban areas. This makes the society and environment of the urban population more complex, and its balance is also changing. The difference in per capita land consumption and the imbalance of population density also explains the inequality of global cities to a certain extent. This inequality has led to the increasingly serious and lasting gap in the urban environment, uneven use of public space, low quality of environmental health, unstable public security, and tight housing and transportation. To deal with the disadvantages of urbanization in developing countries, we can regulate the urban environment, reduce the disorderly expansion of land around cities, improve or update the informal areas in cities and improve their infrastructure to balance the population, narrow the gap between urban environment and reduce the environmental inequality between cities and villages.
Re-examining the physical scope and characteristics of the urban environment through satellite images measurement and improving the understanding of urban sustainability is very important for understanding the mode of urban development and policy making. This helps to ascertain the degree of urban expansion and enables the management of unregulated construction. However, at the same time, we should also recognize that identifying informal areas through satellite images can make them susceptible to hasty clearance from the government and private developers. Contrarily, the presence of informal areas and their juxtaposition with the formal areas indicates the gap in formal urban planning. This can help find answers to queries like where and how the informal areas were born, what kind of growth or decline process they experienced, and what impact they have on the residents living there or on the surrounding environment and the whole city.
Through the identification of informal areas and understanding of their distribution and characteristics, we can deepen the understanding of informal areas so that local communities can better implement strategies such as environmental improvement to prevent the continuous deterioration of informal settlement areas and alleviate the uncertainties related to their living conditions in informal areas.
Overall, the proposed method should help urban designers who are working on analyzing formality and informality in the developing world. Moreover, from the application point of view, this will provide training data sets for future deep learning algorithms and automate them, help establish databases, and significantly reduce the cost of acquiring data for urban environments that change over time. The method can become a necessary tool for decision-makers to plan sustainable urban spaces in the future to design and manage cities more effectively.
The future research and application of urban environmental characteristics will focus on the following directions. Firstly we will conduct temporal analysis to ascertain how various urban environments change over time and the relationship between urban environment and topographic features. Secondly, we plan to augment the knowledge of the urban environment with urban location and information data and adopt a more systematic and consistent method to locate the global urban population in combination with the urban socio-economic parameters such as population density, income, education, and environmental data such noise or air pollution. This will make the method the basis of urban geography and poverty research. With the help of state-of-the-art machine learning algorithms to computationally scale this method, we have an ambitious plan to complete a global list of urban environments and help visualize the sustainable development goals.
Author Contributions
Conceptualization, from urban perspective, Q.C., Conceptualization from Computational social science perspective M.Z.; methodology, Q.C., M.Z. and A.M.R.; software, A.M.R. and Z.G.; validation, A.M.R. and H.Z.; formal analysis, Q.C.; resources, Q.C.; and A.M.R.; data curation, Q.C.; writing—original draft preparation, Q.C.; writing—editing, M.Z.; writing—review A.O.; R.S.; and M.Z.; and visualization, Q.C.; supervision, A.O.; M.Z.; R.S. and H.Z.; project administration, R.S.; funding acquisition, R.S. All authors have read and agreed to the published version of the manuscript.
Funding
This paper was partially funded by JST(Japan Science and Technology Agency) aXis Grant Number JPMJAS2019.This work was supported by JSPS(Japan Society for the Promotion of Science) KAKENHI Grant Number 21K14261. It was also partially funded by the “SmartEGOV: Harnessing EGOV for Smart Governance (Foundations, methods, Tools)/NORTE-01-0145-FEDER-000037”, supported by Norte Portugal Regional Operational Programme (NORTE 2020), under the PORTUGAL 2020 Partnership Agreement, through the European Regional Development Fund (EFDR).
Institutional Review Board Statement
Not applicable.
Informed Consent Statement
Not applicable.
Data Availability Statement
Publicly available datasets were analyzed in this study. This data can be found here: [Global Human Settlement-GHS-POP-European Commission Available online: https://ghsl.jrc.ec.europa.eu/ghs_pop2019.php (accessed on 22 March 2022)].
Acknowledgments
The authors wish to acknowledge the contributions of Hesam Kamalipour to the project.
Conflicts of Interest
The authors declare no conflict of interest.
References
- Ritchie, H.; Roser, M. Urbanization. Our World Data. 2018. Available online: https://ourworldindata.org/urbanization (accessed on 22 March 2022).
- World Urbanization Prospects Population Division United Nations. Available online: https://population.un.org/wup/ (accessed on 22 March 2022).
- Shane, D.G. Transcending Type: Designing for Urban Complexity. Archit. Des. 2011, 81, 128–134. [Google Scholar] [CrossRef]
- 2018 Revision of World Urbanization Prospects | Multimedia Library United Nations Department of Economic and Social Affairs. Available online: https://www.un.org/development/desa/publications/2018-revision-of-world-urbanization-prospects.html (accessed on 22 March 2022).
- Ng, E.; Ng, E. Designing High-Density Cities: For Social and Environmental Sustainability; Taylor and Francis: Hoboken, NJ, USA, 2009; ISBN 978-1-138-96744-1. [Google Scholar]
- Henderson, J.V.; Turner, M.A. Urbanization in the Developing World: Too Early or Too Slow? J. Econ. Perspect. 2020, 34, 150–173. [Google Scholar] [CrossRef]
- Cohen, B. Urbanization in Developing Countries: Current Trends, Future Projections, and Key Challenges for Sustainability. Technol. Technol. Soc. 2006, 28, 63–80. [Google Scholar] [CrossRef]
- Dovey, K.; Kamalipour, H. Informal/Formal Morphologies. In Mapping Urbanities: Morphologies, Flows, Possibilities; Dovey, K., Pafka, E., Ristic, M., Eds.; Routledge: New York, NY, USA , 2018; pp. 223–248. ISBN 978-1-315-30917-0. [Google Scholar] [CrossRef]
- Martine, G. The New Global Frontier: Urbanization, Poverty and Environment in the 21st Century; Routledge: London, England, 2008; ISBN 978-1-84977-315-7. [Google Scholar]
- Huang, J.; Lu, X.X.; Sellers, J. M A Global Comparative Analysis of Urban Form: Applying Spatial Metrics and Remote Sensing. Landsc. Urban Plan. 2007, 82, 184–197. [Google Scholar] [CrossRef]
- Westra, R. Renewing Socialist Development in the Third World. J. Contemp. Asia 2011, 41, 519–543. [Google Scholar] [CrossRef]
- Habitat III Issue Paper 22 - Informal Settlements. Available online: https://unhabitat.org/habitat-iii-issue-papers-22-informal-settlements (accessed on 22 March 2022).
- Dovey, K.; van Oostrum, M.; Chatterjee, I.; Shafique, T. Towards a Morphogenesis of Informal Settlements. Habitat Int. 2020, 104, 102240. [Google Scholar] [CrossRef]
- Brelsford, C.; Martin, T.; Hand, J.; Bettencourt, L.M.A. Toward Cities without Slums: Topology and the Spatial Evolution of Neighborhoods. Sci. Adv. 2018, 4, eaar4644. [Google Scholar] [CrossRef] [Green Version]
- Robinson, C.; Hohman, F.; Dilkina, B. A Deep Learning Approach for Population Estimation from Satellite Imagery. In Proceedings of the 1st ACM SIGSPATIAL Workshop on Geospatial Humanities, Redondo Beach, CA, USA, 7 November 2017; pp. 47–54. [Google Scholar]
- Barke, M. The Importance of Urban Form as an Object of Study. In Teaching Urban Morphology; Oliveira, V., Ed.; The Urban Book Series; Springer International Publishing: Cham, Switzerland, 2018; pp. 11–30. ISBN 978-3-319-76125-1. [Google Scholar]
- Kärrholm, M. The Territorialisation of a Pedestrian Precinct in Malmö: Materialities in the Commercialisation of Public Space. Urban Stud. 2008, 45, 1903–1924. [Google Scholar] [CrossRef] [Green Version]
- Shekhar, S. Effective Management of Slums Case Study of Kalaburagi City, Karnataka. India. J. Urban Manag. 2020, 9, 35–53. [Google Scholar] [CrossRef]
- Kamalipour, H. Forms of Informality and Adaptations in Informal Settlements. Int. J. Archit. Res. ArchNet-IJAR 2016, 10, 60–75. [Google Scholar] [CrossRef]
- Taubenböck, H.; Standfuß, I.; Klotz, M.; Wurm, M. The Physical Density of the City—Deconstruction of the Delusive Density Measure with Evidence from Two European Megacities. ISPRS. Int. J. Geo-Inf. 2016, 5, 206. [Google Scholar] [CrossRef] [Green Version]
- The Challenge of Slums: Global Report on Human Settlements; United Nations Human Settlements Programme (Ed.) Earthscan Publications: London, UK, 2003; ISBN 978-1-84407-037-4. [Google Scholar]
- Oliveira, V. Urban Morphology. In Urban Studies; Oxford University Press: Oxford, England, 2020; ISBN 978-0-19-092248-1. [Google Scholar]
- Lehner, A.; Blaschke, T. A Generic Classification Scheme for Urban Structure Types. Remote Sens. 2019, 11, 173. [Google Scholar] [CrossRef] [Green Version]
- Lau, S.S.Y. Physical Environment of Tall Residential Buildings: The Case of Hong Kong. In High-Rise Living in Asian Cities; Yuen, B., Yeh, A.G.O., Eds.; Springer: Dordrecht, The Netherlands, 2011; pp. 25–47. ISBN 978-90-481-9738-5. [Google Scholar]
- Taubenböck, H.; Kraff, N.J.; Wurm, M. The Morphology of the Arrival City - A Global Categorization Based on Literature Surveys and Remotely Sensed Data. Appl. Geogr. 2018, 92, 150–167. [Google Scholar] [CrossRef]
- Shashi, M.; Jain, K. Use of Photogrammetry In 3d Modeling and Visualization of Buildings. Undefined. 2007. Available online: http://citeseerx.ist.psu.edu/viewdoc/summary?doi=10.1.1.114.849 (accessed on 22 March 2022).
- Owen, K.K.; Wong, D.W. An Approach to Differentiate Informal Settlements Using Spectral, Texture, Geomorphology and Road Accessibility metrics. Appl. Geogr. 2013, 38, 107–118. [Google Scholar] [CrossRef]
- Gueguen, L. Classifying Compound Structures in Satellite Images: A Compressed Representation for Fast Queries. IEEE Trans. Geosci. Remote Sens. 2015, 53, 1803–1818. [Google Scholar] [CrossRef]
- Niebergall, S.; Loew, A.; Mauser, W. Integrative Assessment of Informal Settlements Using VHR Remote Sensing Data—The Delhi Case Study. IEEE J. Sel. Top. Appl. Earth Obs. Remote Sens. 2008, 1, 193–205. [Google Scholar] [CrossRef]
- Baud, I.; Kuffer, M.; Pfeffer, K.; Sliuzas, R.V. Understanding Heterogeneity in Metropolitan India: The Added Value of Remote Sensing Data for Analyzing Sub Standard Residential Areas. Int. J. Appl. Earth Obs. Geoinf. 2010, 12, 359–374. [Google Scholar] [CrossRef]
- Herold, M.; Couclelis, H.; Clarke, K.C. The Role of Spatial Metrics in the Analysis and Modeling of Urban Land Use Change. Comput. Environ. Urban Syst. 2005, 29, 369–399. [Google Scholar] [CrossRef]
- Sarkar, A.; Bardhan, R. Socio-Physical Liveability through Socio-Spatiality in Low-Income Resettlement Archetypes-A Case of Slum Rehabilitation Housing in Mumbai, India. Cities 2020, 105, 102840. [Google Scholar] [CrossRef]
- Oshri, B.; Hu, A.; Adelson, P.; Chen, X.; Dupas, P.; Weinstein, J.; Burke, M.; Lobell, D.; Ermon, S. Infrastructure Quality Assessment in Africa Using Satellite Imagery and Deep Learning. In Proceedings of the 24th ACM SIGKDD International Conference on Knowledge Discovery & Data Mining, London, UK, 19 July 2018; pp. 616–625. [Google Scholar]
- Afrobarometer Round 6 Survey Manual [PDF Document]. Available online: https://afrobarometer.org/sites/default/files/survey_manuals/ab_r6_survey_manual_en.pdf (accessed on 22 March 2022).
- Haklay, M.; Weber, P. OpenStreetMap: User-Generated Street Maps. IEEE Pervasive Comput. 2008, 7, 12–18. [Google Scholar] [CrossRef] [Green Version]
- Fumega, J.; Niza, S.; Ferrão, P. Identification Of Urban Typologies Through The Use Of Urban Form Metrics For Urban Energy And Climate Change Analysis. In Proceedings of the Urban Futures-Squaring Circles: Europe, China and the World in 2050, Lisbon, Portugal, 10–11 October 2014. [Google Scholar] [CrossRef]
- Xie, M.; Jean, N.; Burke, M.; Lobell, D.; Ermon, S. Transfer Learning from Deep Features for Remote Sensing and Poverty Mapping. Comput. Sci. 2016, arXiv:151000098. Available online: https://arxiv.org/pdf/1510.00098.pdf (accessed on 22 March 2022).
- Verma, D.; Jana, A.; Ramamritham, K. Transfer Learning Approach to Map Urban Slums Using High and Medium Resolution Satellite Imagery. Habitat Int. 2019, 88, 101981. [Google Scholar] [CrossRef]
- Albert, A.; Kaur, J.; Gonzalez, M. Using Convolutional Networks and Satellite Imagery to Identify Patterns in Urban Environments at a Large Scale. 2017. [Google Scholar] [CrossRef]
- Kamalipour, H. Urban Informalogy: The Morphologies and Incremental Transformations of Informal Settlements. Ph.D. Dissertation, University of Melbourne, Melbourne, Australia, 2017. Available online: http://hdl.handle.net/11343/197684 (accessed on 22 March 2022).
- Kamalipour, H. Urban Morphologies in Informal Settlements: A Case Study. Contour J. 2016, 1. [Google Scholar] [CrossRef]
- Kamalipour, H. Mapping Urban Interfaces: A Typology of Public/Private Interfaces in Informal Settlements. Spaces Flows Int. J. Urban ExtraUrban Stud. 2017, 8, 1–12. [Google Scholar] [CrossRef]
- Frey, H. Designing the City: Towards a More Sustainable Urban Form; Taylor & Francis: Oxfordshire, UK, 2003. [Google Scholar]
- Marshall, S. Cities Design and Evolution; Routledge: Abingdon, Oxon; New York, NY, USA, 2009; ISBN 978-0-415-42329-8. [Google Scholar]
- Kohli, D.; Sliuzas, R.; Kerle, N.; Stein, A. An Ontology of Slums for Image-Based Classification. Comput. Environ. Urban Syst. 2012, 36, 154–163. [Google Scholar] [CrossRef]
- Energy Information Administration (EIA) Commercial Buildings Energy Consumption Survey (CBECS) Data. Available online: https://www.eia.gov/consumption/commercial/data/2018/ (accessed on 22 March 2022).
- The Millennium Development Goals Report 2012 | United Nations Development Programme. Available online: https://www.un.org/millenniumgoals/pdf/MDG%20Report%202012.pdf (accessed on 22 March 2022).
- Friesen, J.; Taubenböck, H.; Wurm, M.; Pelz, P.F. The Similar Size of Slums. Habitat Int. 2018, 73, 79–88. [Google Scholar] [CrossRef]
- Kenya, N. Type and distribution of urban and peri-urban agriculture production systems in Nairobi County, Kenya. 2014, 339—343. Available online: https://www.ruforum.org/sites/default/files/Ogendi.pdf(accessed on 22 March 2022).
- The Urban Challenge in Africa: Growth and Management of Its Large Cities; Rakodi, C. (Ed.) United Nations University Press: Tokyo, Japan; New York, NY, USA, 1997; ISBN 978-92-808-0952-7. [Google Scholar]
- Urban Land Markets: Improving Land Management for Successful Urbanization; Lall, S.V. (Ed.) Springer: Dordrecht, Switzerland; London, UK; New York, NY, USA, 2009; ISBN 978-1-4020-8861-2. [Google Scholar]
- Census of India: Population Projection Report 2011–2036. Available online: https://main.mohfw.gov.in/sites/default/files/Population%20Projection%20Report%202011-2036%20-%20upload_compressed_0.pdf (accessed on 24 March 2022).
- Teotia, M.K. Urban Development in North-Western India: Emerging Trends, Concerns and Strategies. Available online: https://www.academia.edu/29115686/Urban_Development_in_North_Western_India_Emerging_Trends_Concerns_and_Strategies (accessed on 22 March 2022).
- Jakarta Population 2022 (Demographics, Maps, Graphs). Available online: https://worldpopulationreview.com/world-cities/jakarta-population (accessed on 24 March 2022).
- Paul, M. The Case of Jakarta, Indonesia. Available online: https://www.ucl.ac.uk/dpu-projects/Global_Report/pdfs/Jakarta.pdf (accessed on 22 March 2022).
- The Seventh National Census of Guangdong Province. Available online: http://www.stats.gov.cn/tjfw/dftjxmgl/dftjdczd/gd/ (accessed on 22 March 2022).
- Sun, L.; Cheng, Z.; Cun, Z.; Zhuang, X.; Qi, J.; Ju, R.; Jing, H.; Zhi, Z. Current Situation and Human Settlements Remediation of Chinese Urban Village, 1st ed.; Zhongguo Jian Zhu Gong Ye Chu Ban She: Beijing, China, 2013; ISBN 978-7-112-15234-6. [Google Scholar]
- Reply to the Proposal of the 15th Session of Guangzhou Municipal People’s Congress on Natural Resources Planning No. 20192415. Available online: http://ghzyj.gz.gov.cn/gkmlpt/content/5/5548/post_5548977.html#946 (accessed on 24 March 2022).
- Cairo Population 2022 (Demographics, Maps, Graphs). Available online: https://worldpopulationreview.com/world-cities/cairo-population (accessed on 22 March 2022).
- Lima, Peru Metro Area Population 1950–2022. Available online: https://www.macrotrends.net/cities/22078/lima/population (accessed on 24 March 2022).
- Gustavo, R. The Case of Lima, Peru. Available online: https://www.ucl.ac.uk/dpu-projects/Global_Report/pdfs/Lima.pdf (accessed on 22 March 2022).
- Global Human Settlement-GHS-POP-European Commission. Available online: https://ghsl.jrc.ec.europa.eu/ghs_pop2019.php (accessed on 22 March 2022).
- Rahman, A.K.M.; Zaber, M.; Cheng, Q.; Nayem, A.B.S.; Sarker, A.; Paul, O.; Shibasaki, R. Applying State-of-the-Art Deep-Learning Methods to Classify Urban Cities of the Developing World. Sensors 2021, 21, 7469. [Google Scholar] [CrossRef]
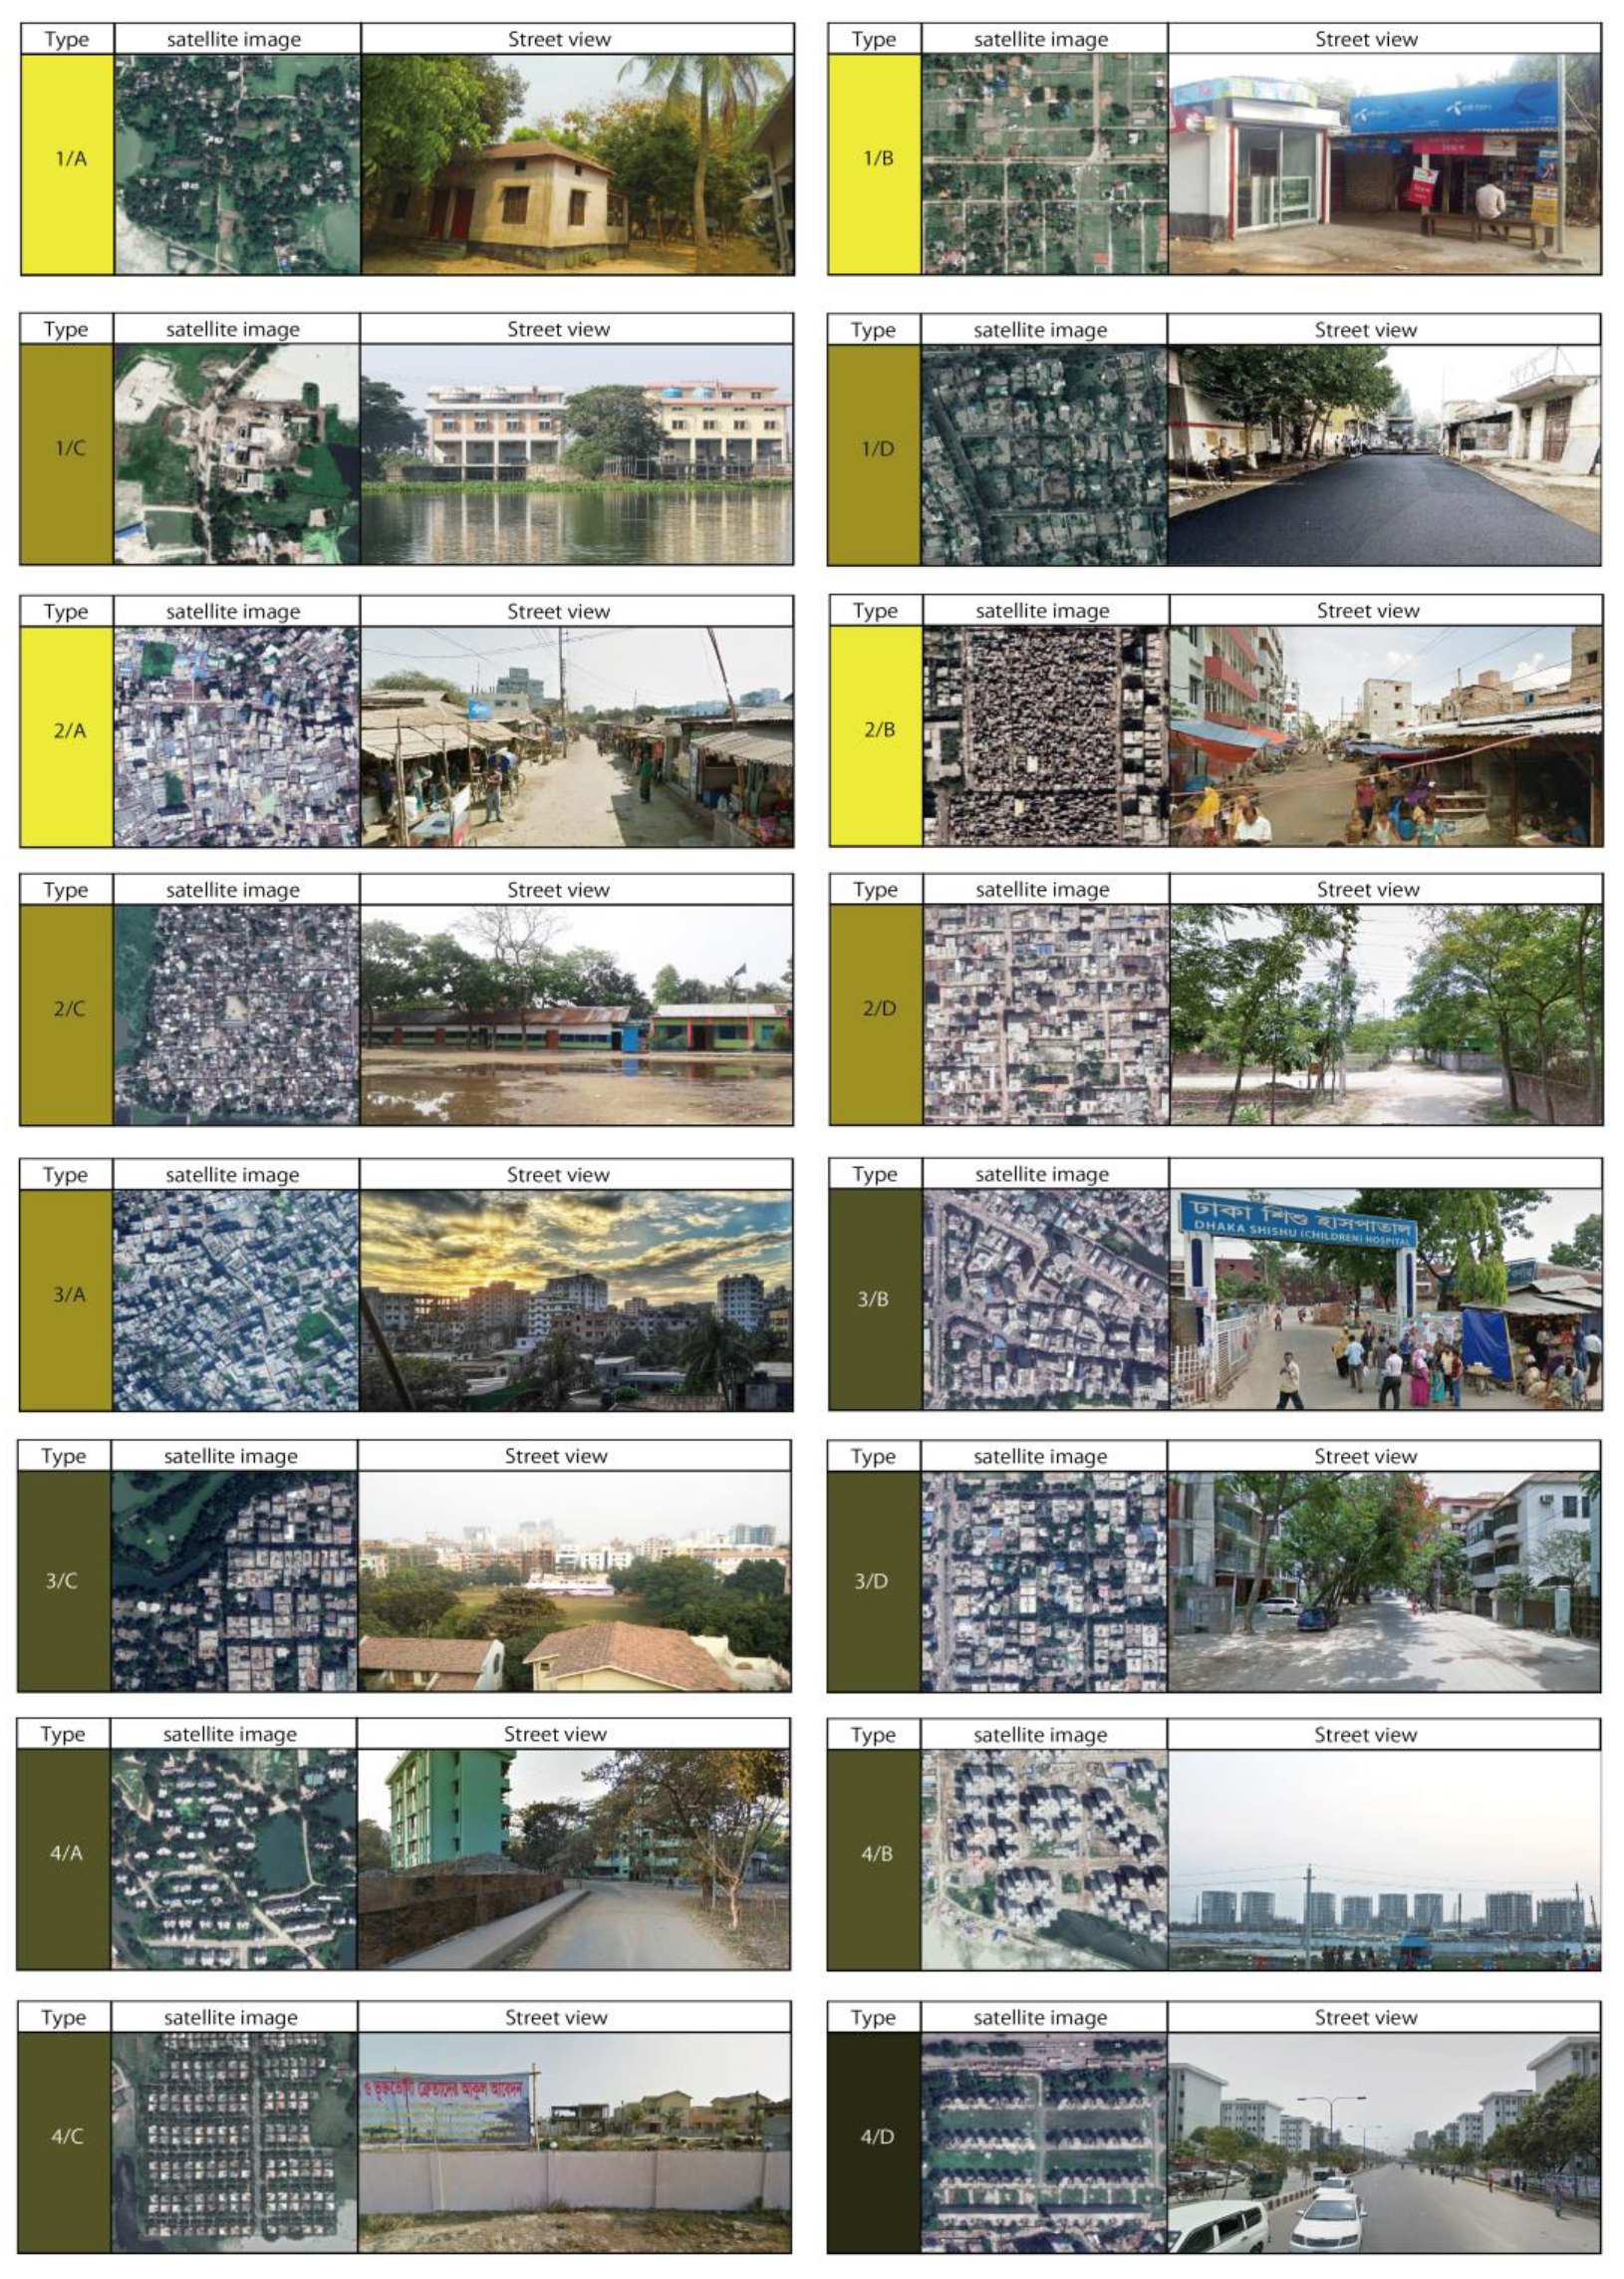
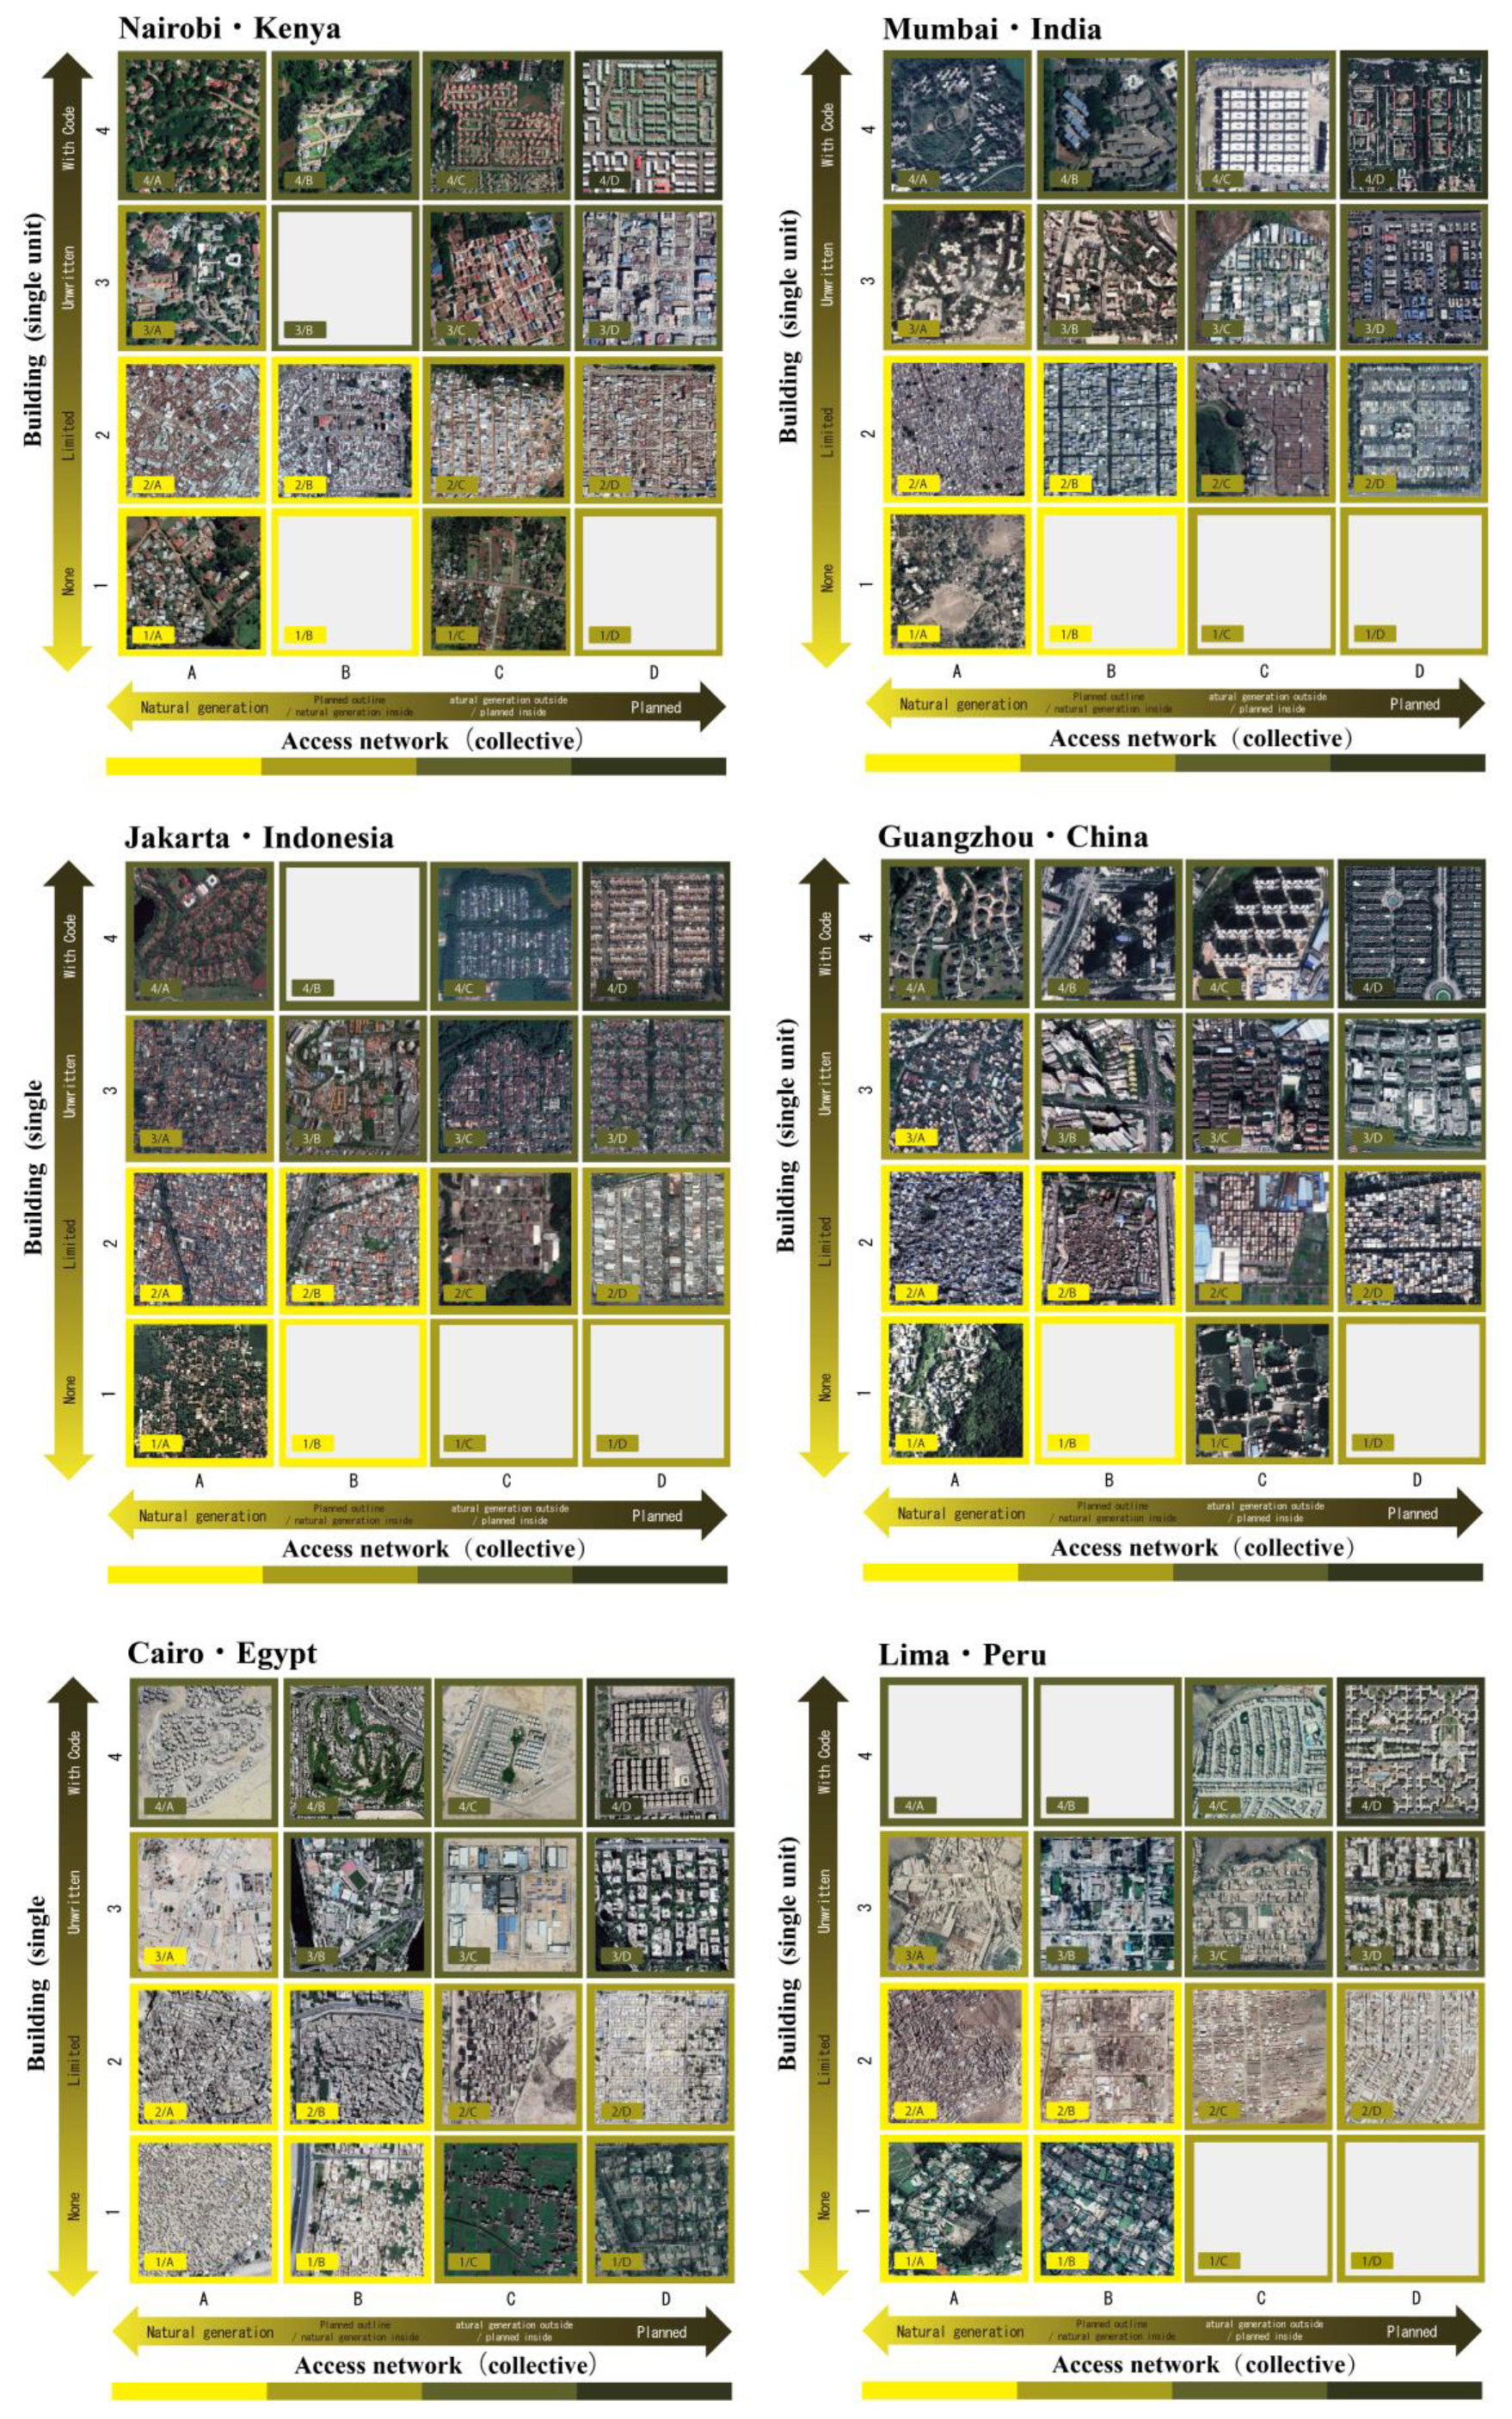

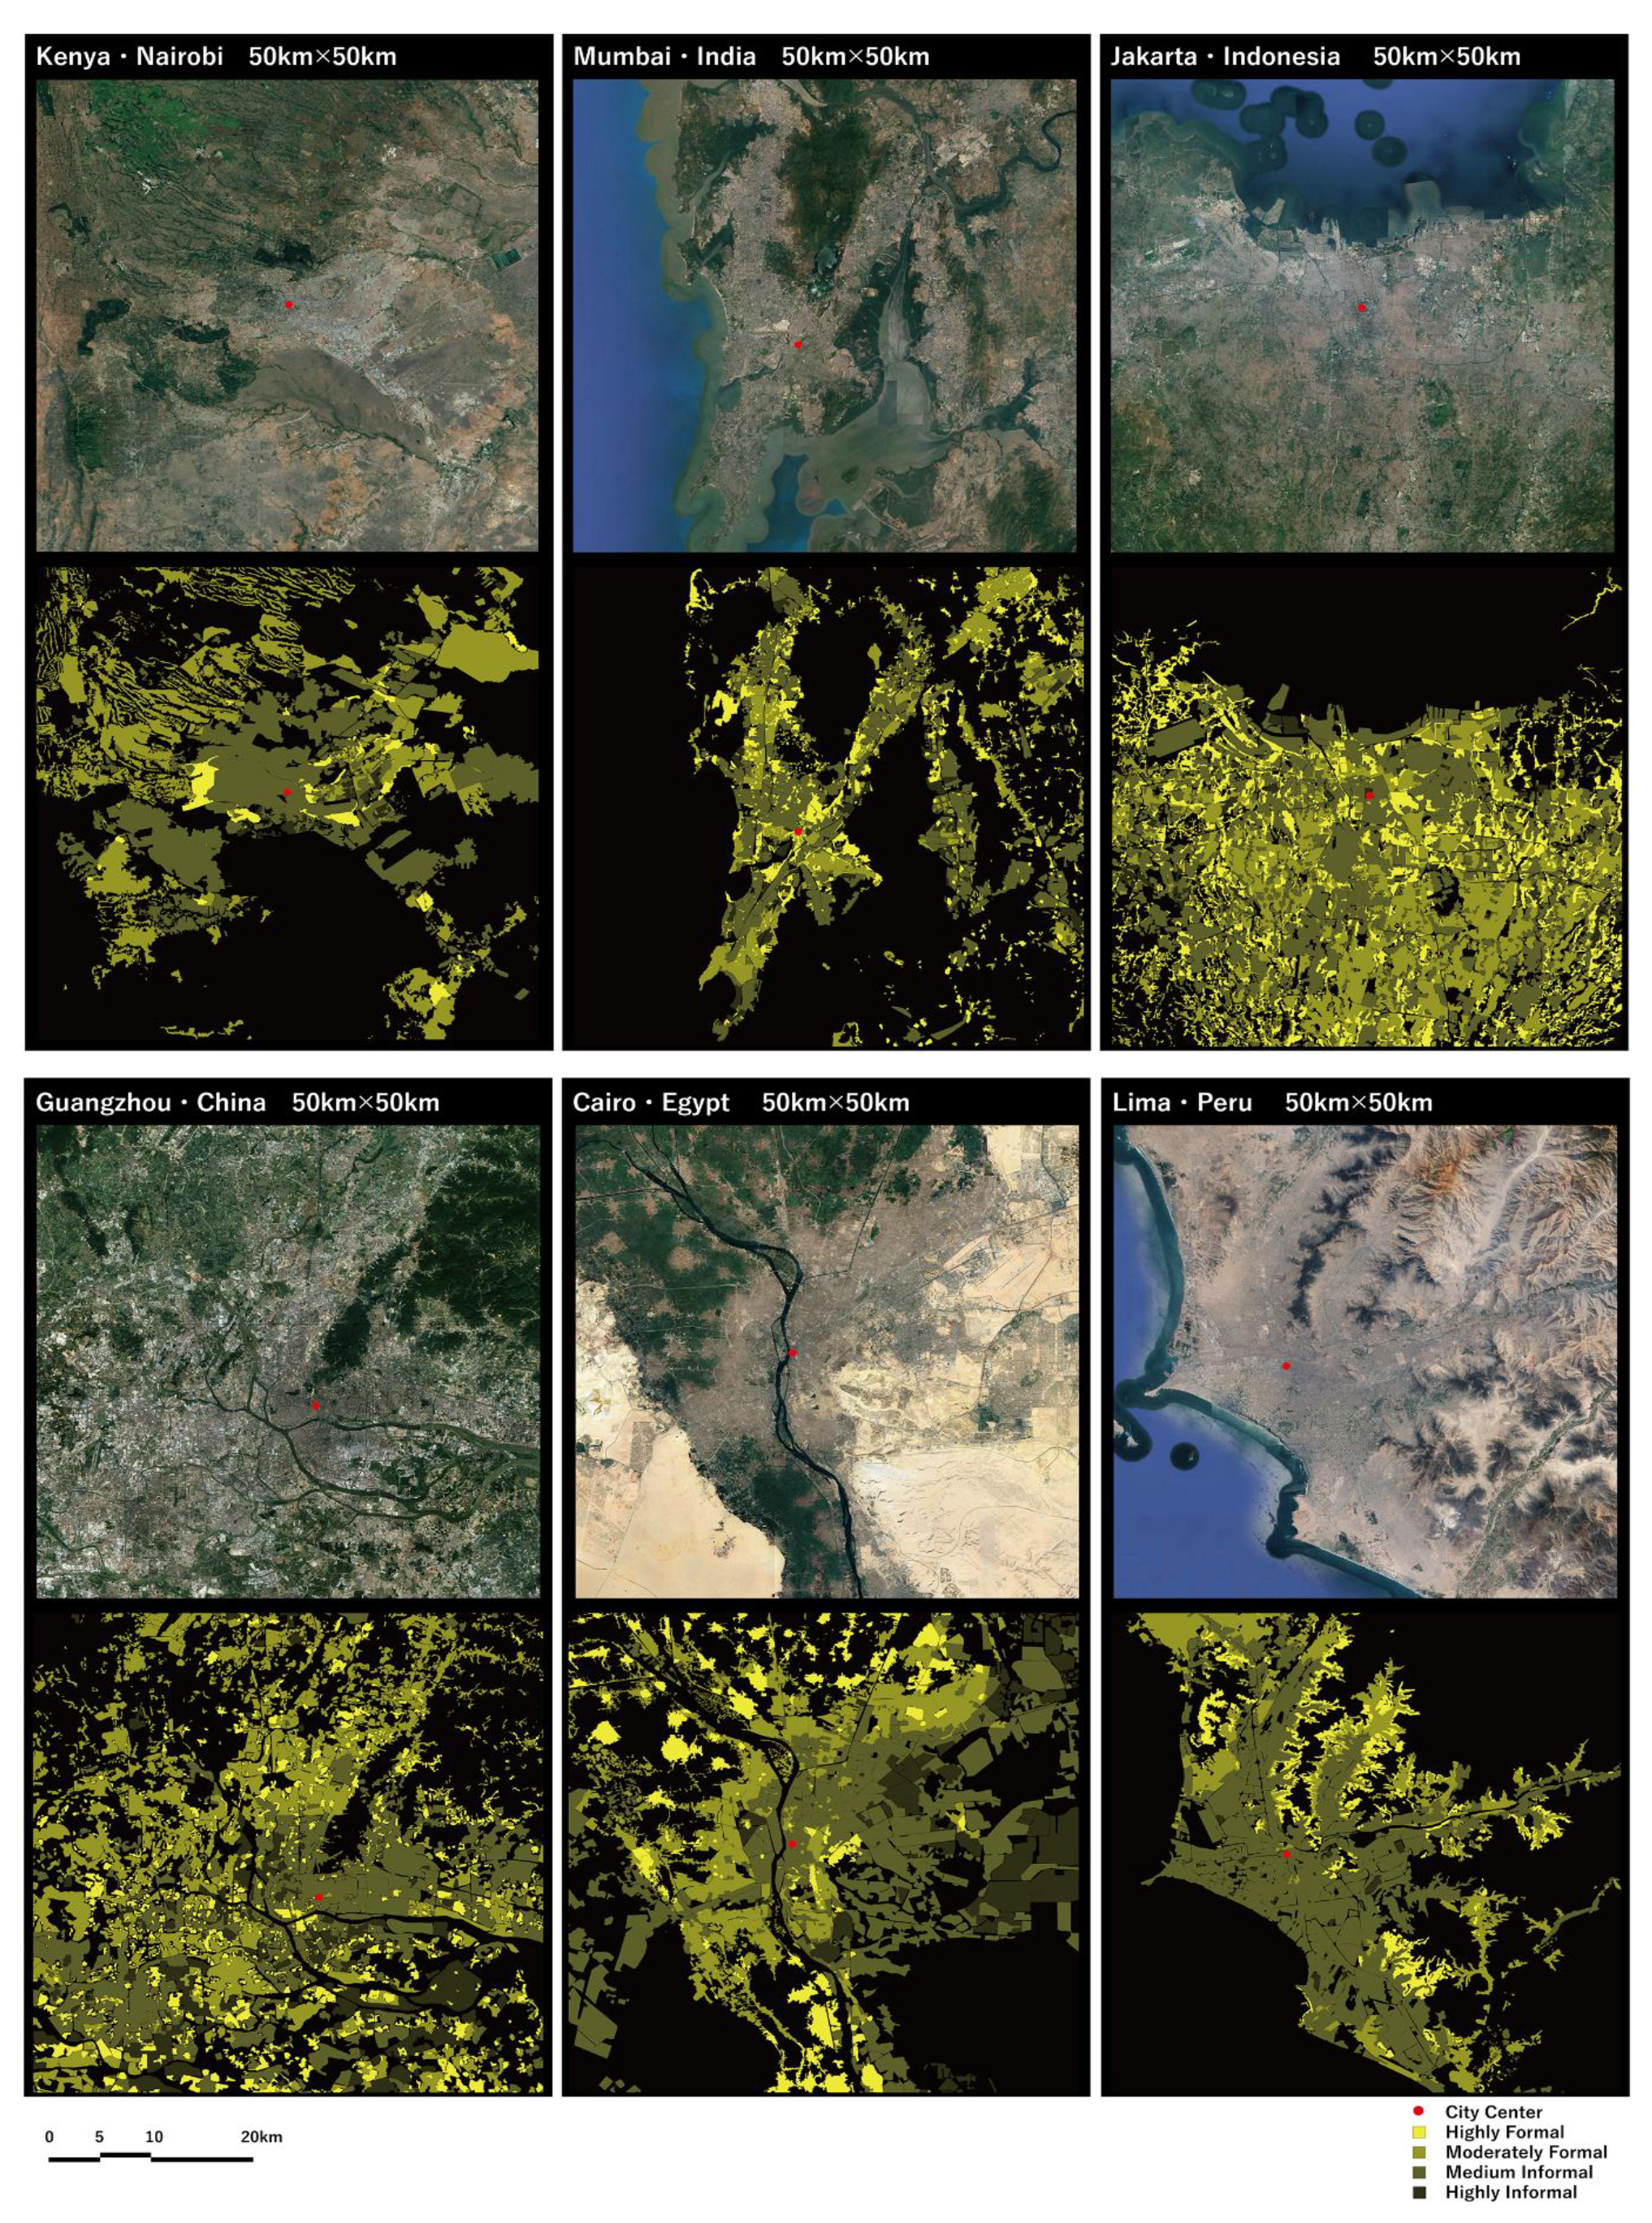
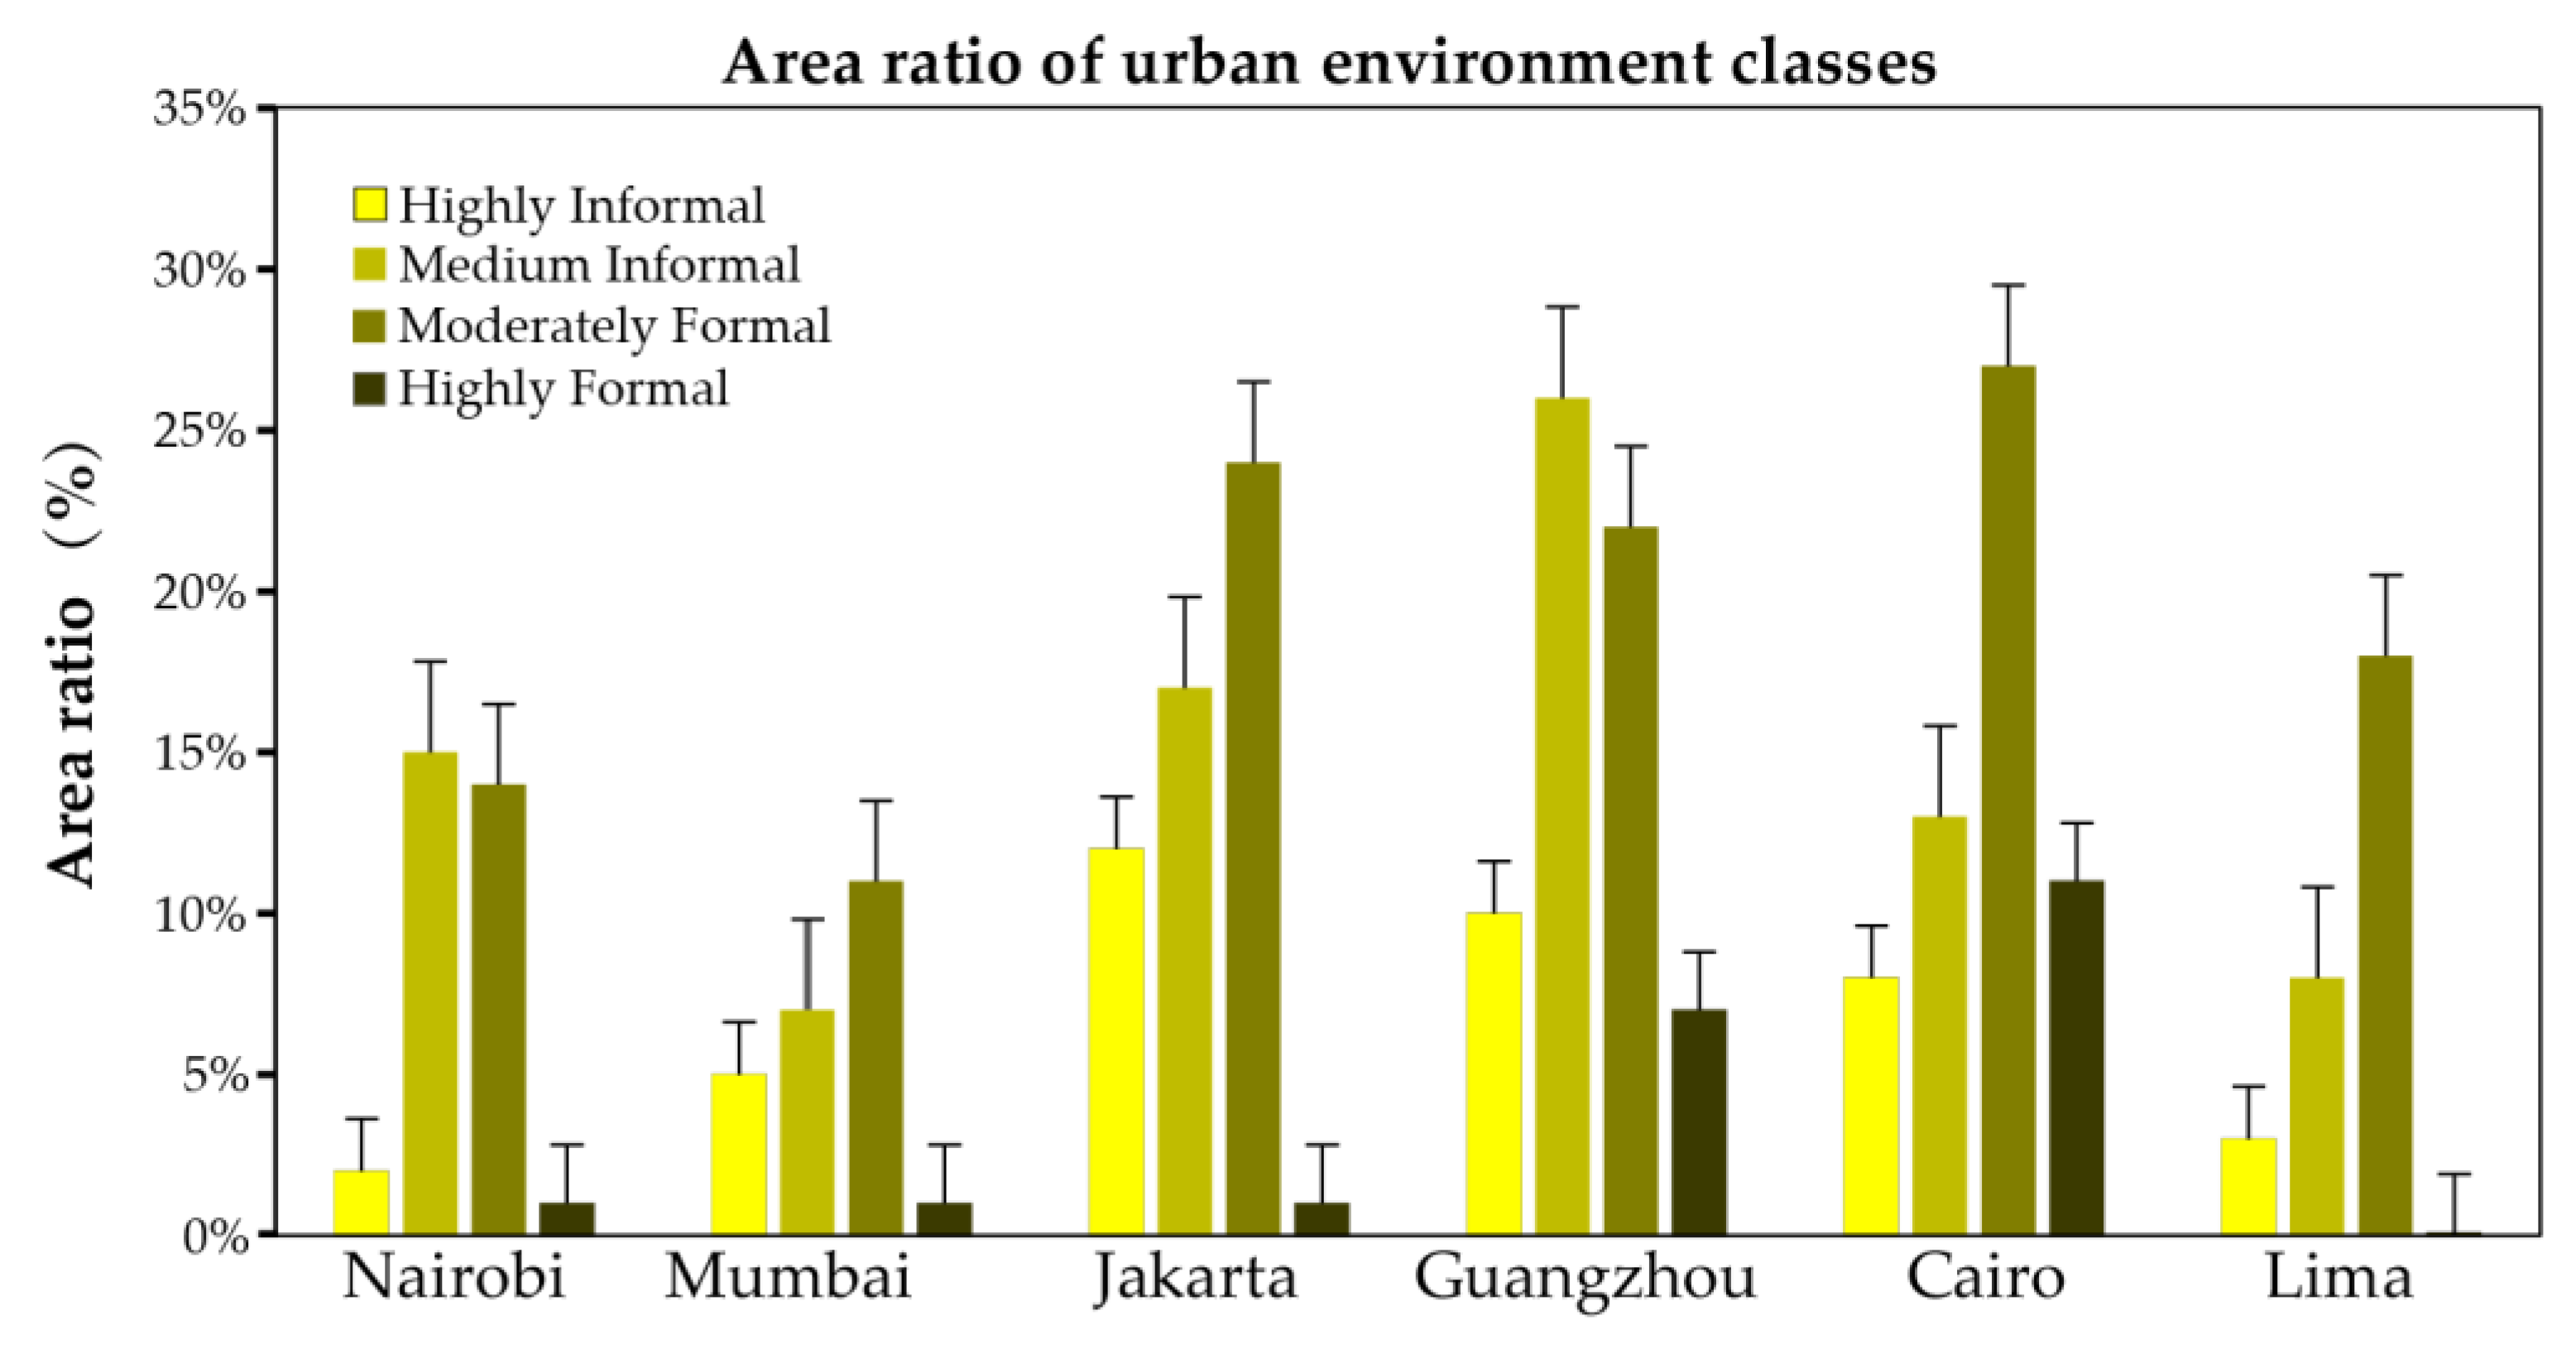
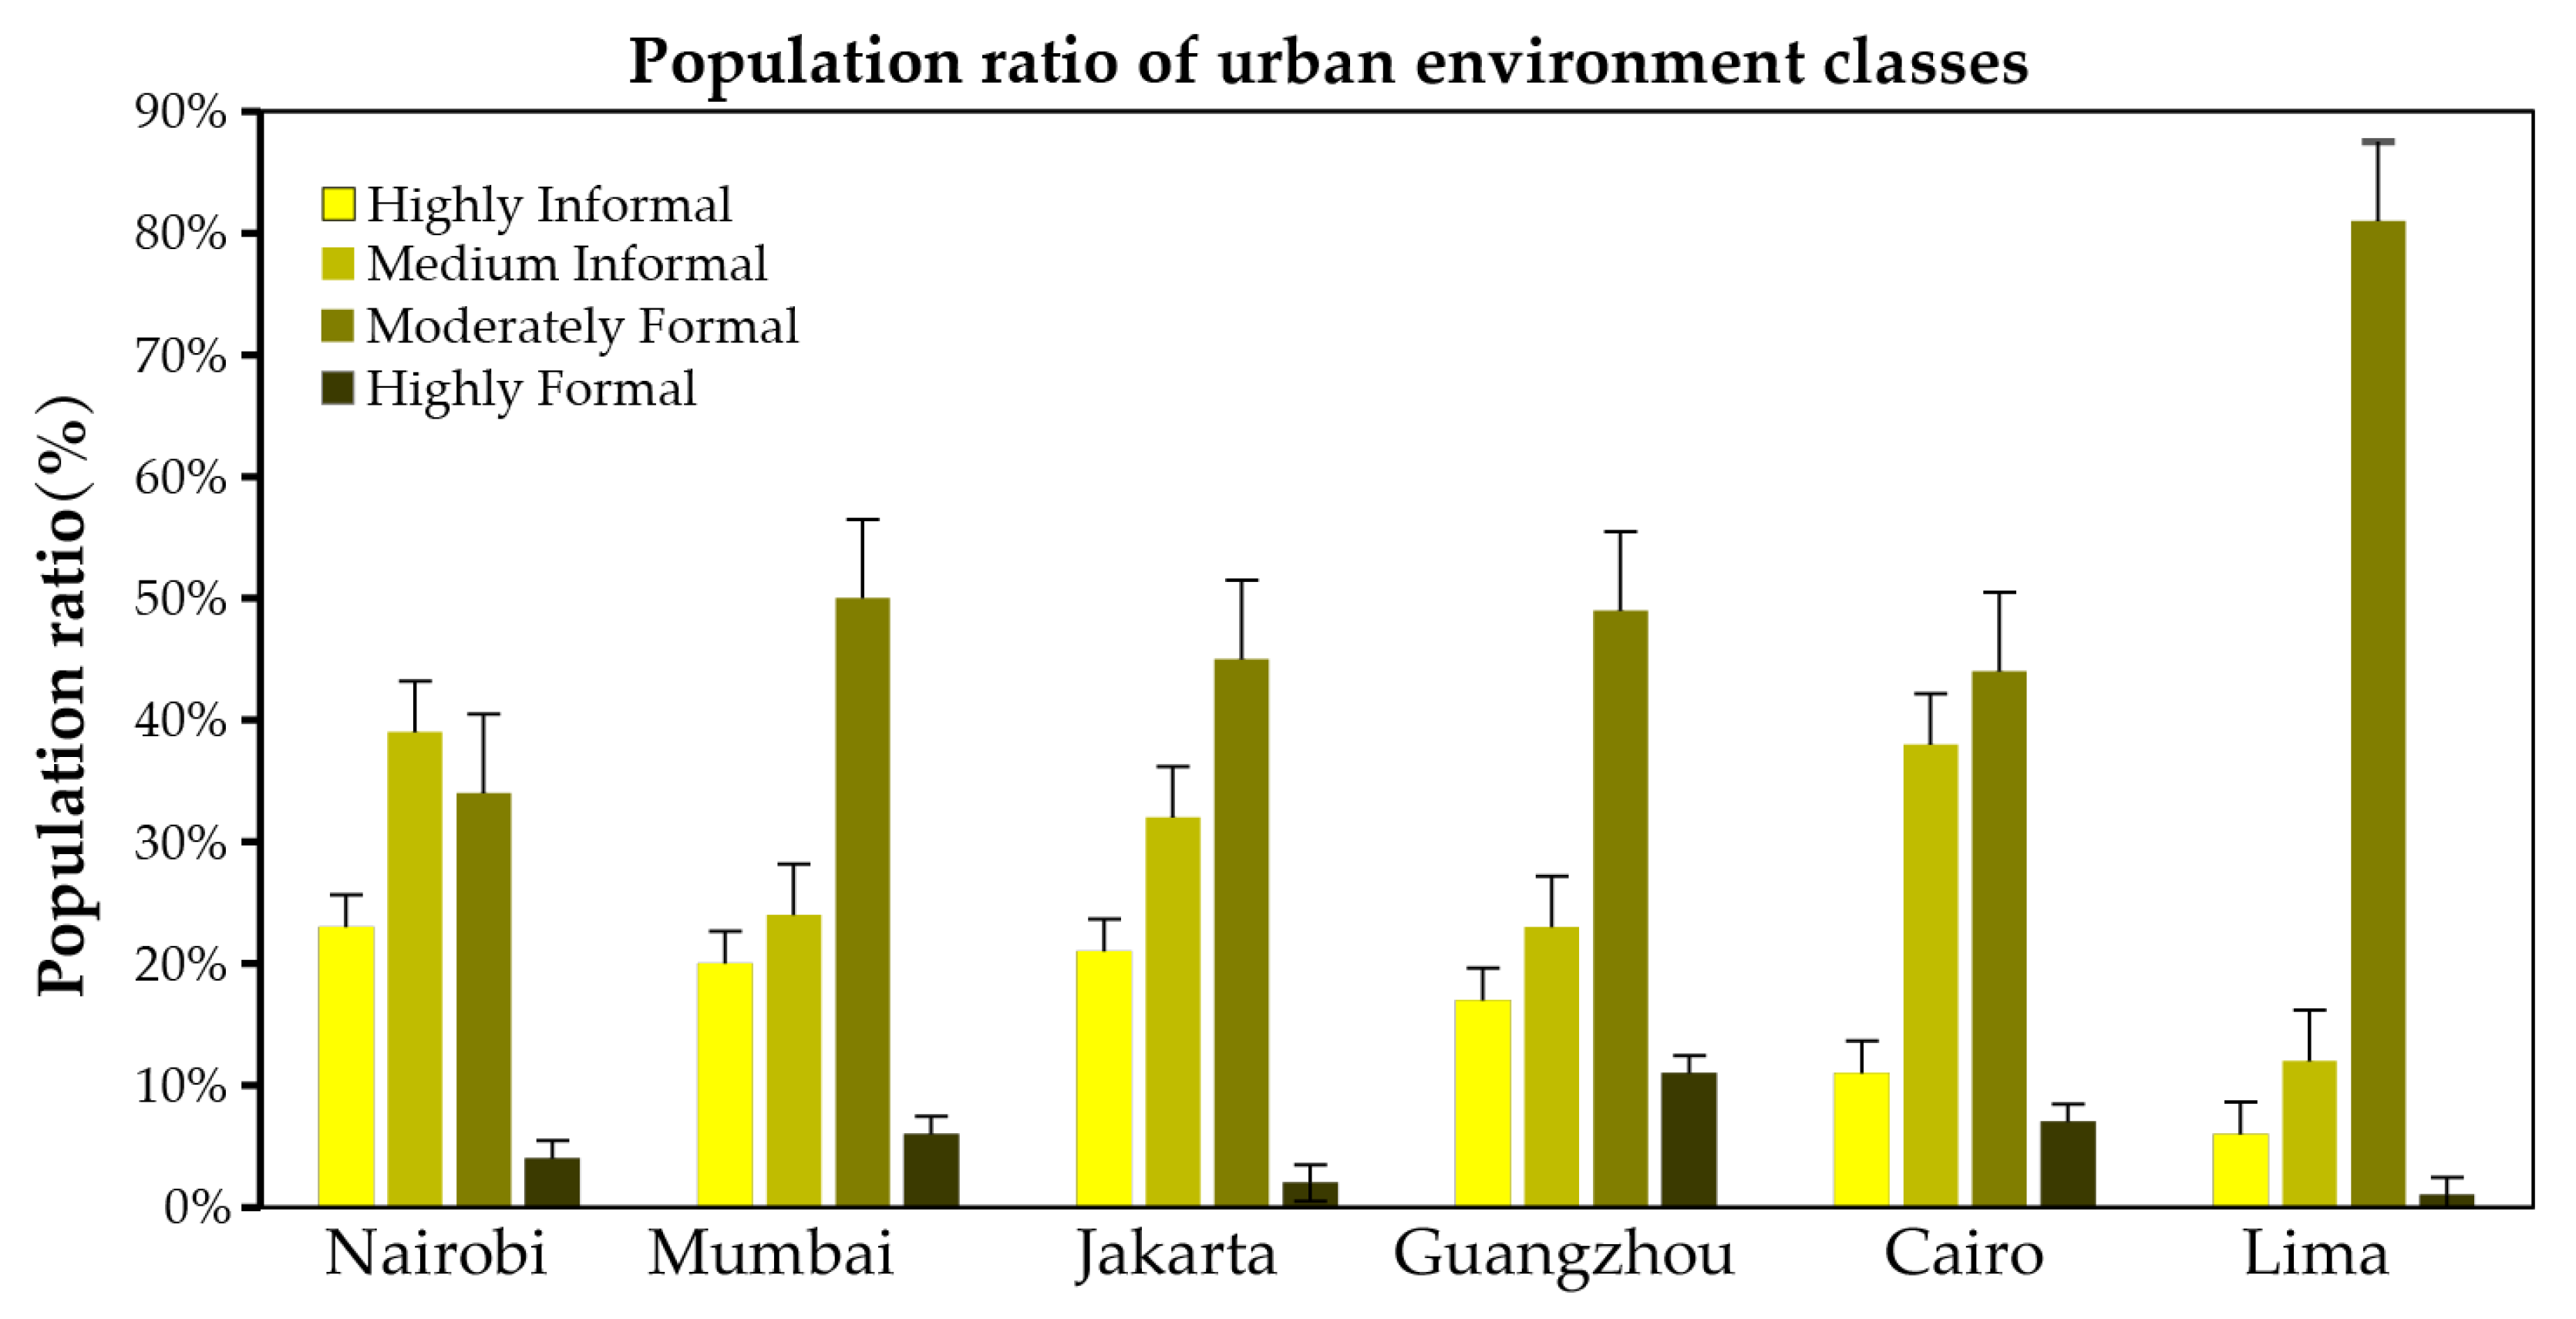
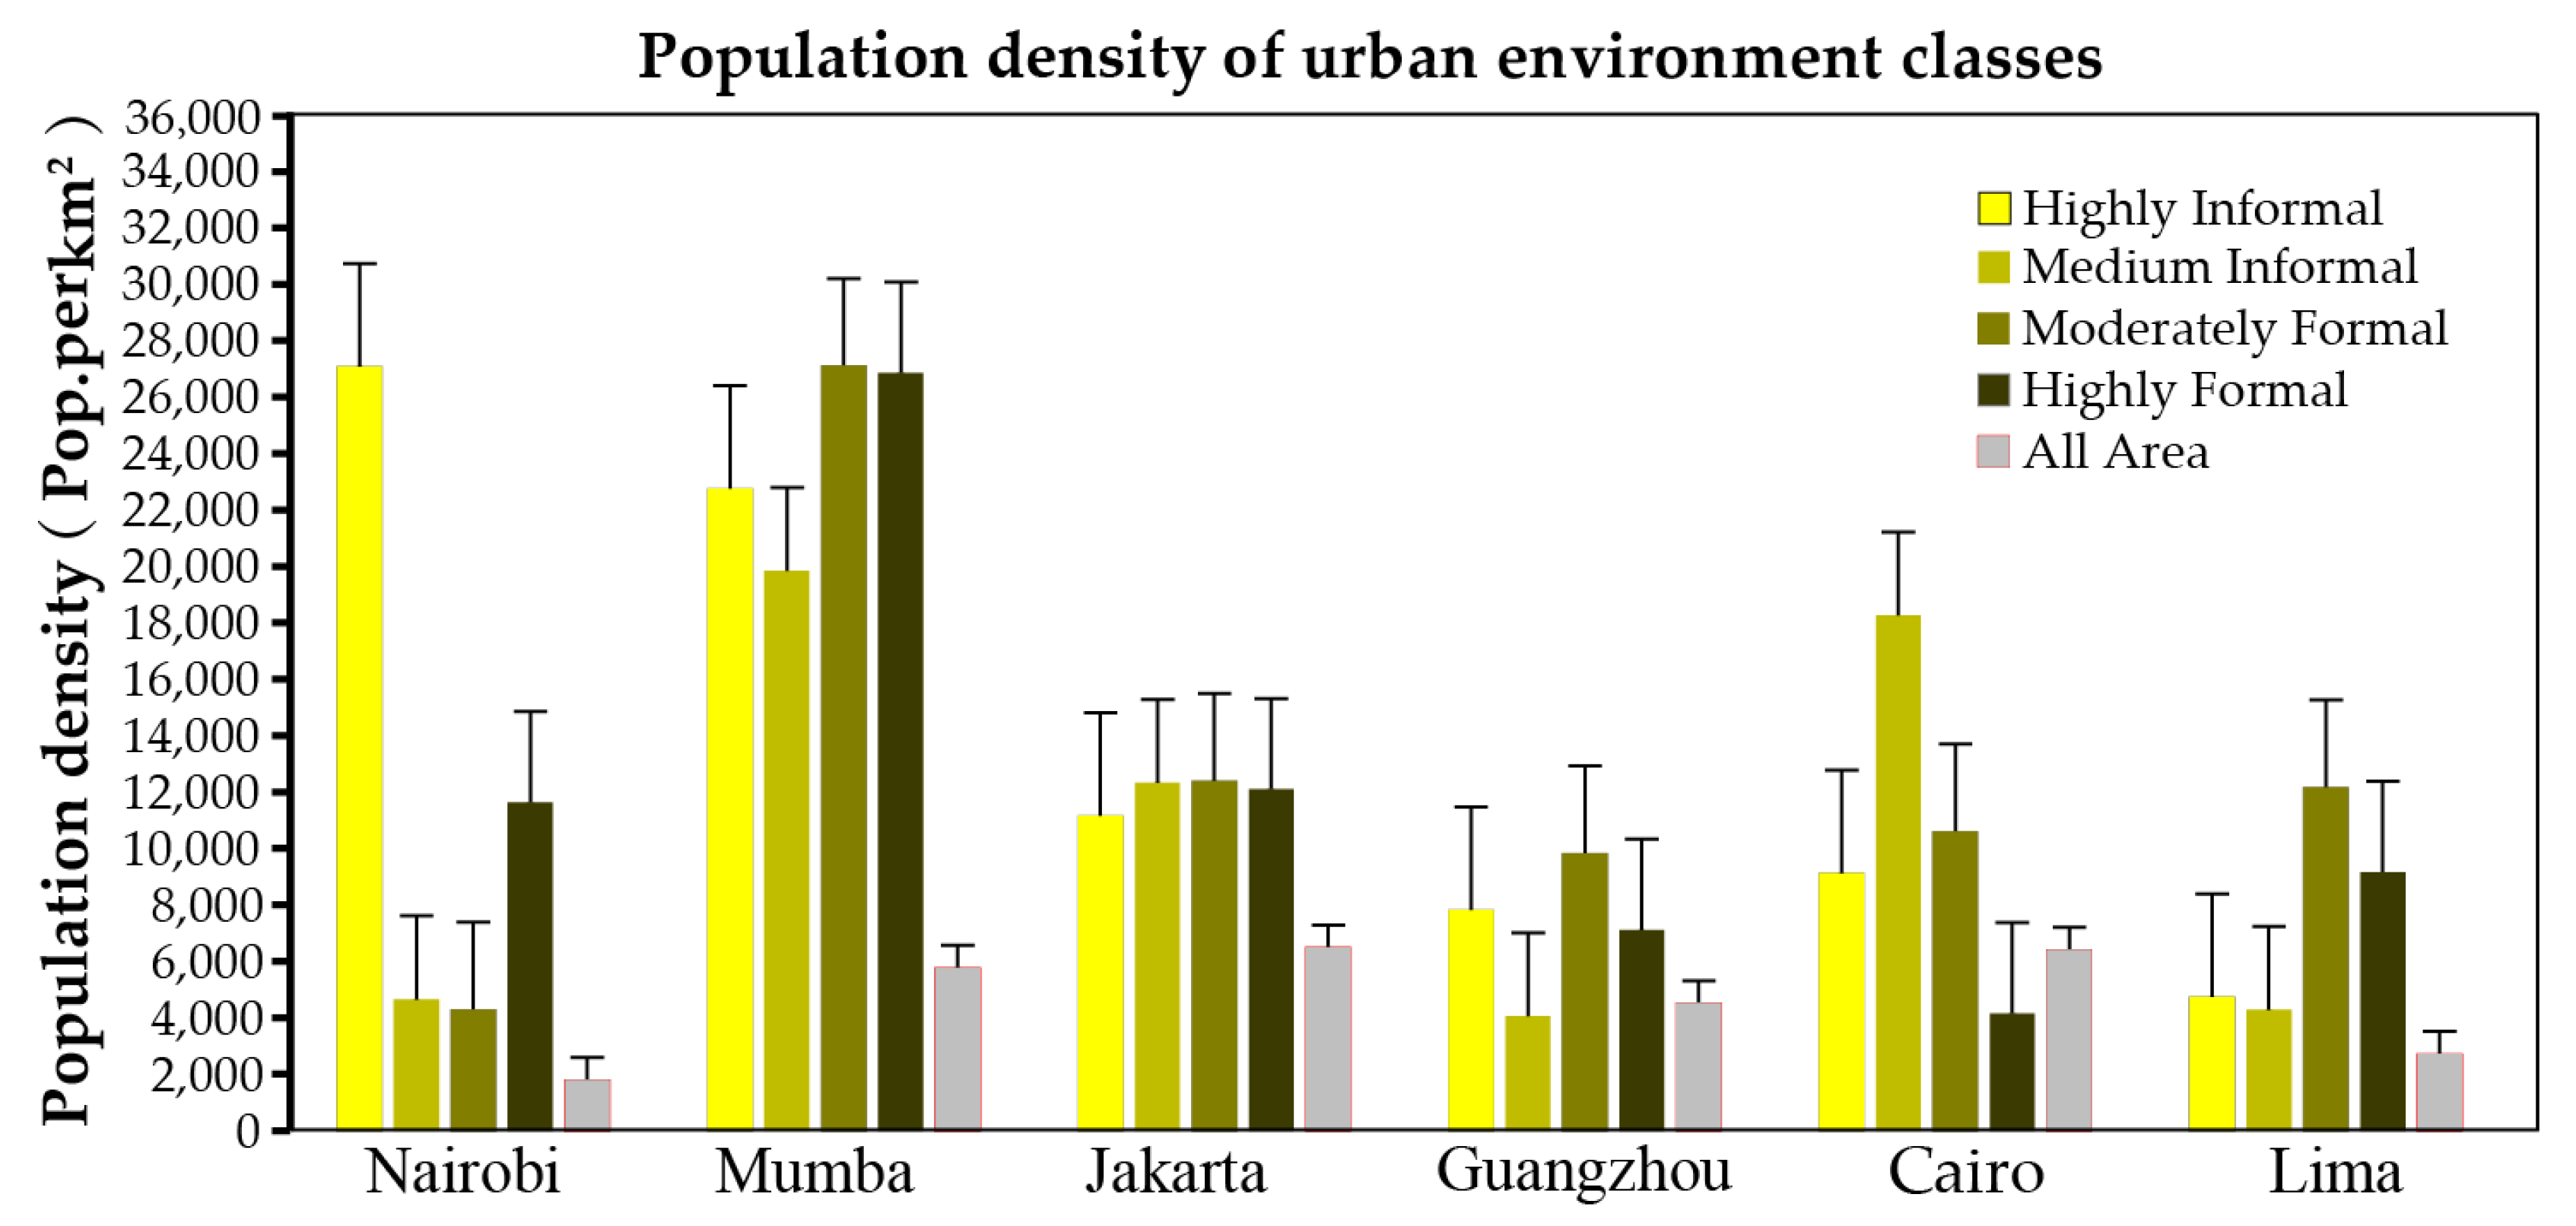
Publisher’s Note: MDPI stays neutral with regard to jurisdictional claims in published maps and institutional affiliations. |
© 2022 by the authors. Licensee MDPI, Basel, Switzerland. This article is an open access article distributed under the terms and conditions of the Creative Commons Attribution (CC BY) license (https://creativecommons.org/licenses/by/4.0/).