Article

Design Optimization of Three-Layered Metamaterial Acoustic Absorbers Based on PVC Reused Membrane and Metal Washers

by
Giuseppe Ciaburro
1,*,
Rosaria Parente
2,
Gino Iannace
1 and
Virginia Puyana-Romero
3,4
1
Department of Architecture and Industrial Design, Università degli Studi della Campania Luigi Vanvitelli, Borgo San Lorenzo, 81031 Aversa, Italy
2
Benecon University Consortium, 80138 Naples, Italy
3
Department of Sound and Acoustic Engineering, Universidad de Las Américas, Quito EC170125, Ecuador
4
Institute of Applied Linguistics, Laboratory of Phonetics and Acoustics, Universidad de Cádiz, 11002 Cádiz, Spain
*
Author to whom correspondence should be addressed.
Sustainability 2022, 14(7), 4218; https://doi.org/10.3390/su14074218
Submission received: 12 March 2022 / Revised: 23 March 2022 / Accepted: 30 March 2022 / Published: 1 April 2022
(This article belongs to the Special Issue Sustainable Materials for Thermal and Noise Insulation of Buildings)

Abstract

:
Waste management represents a critical issue that industrialized countries must necessarily deal with. Sustainable architecture involves the reuse of materials with the aim of significantly reducing the amount of waste produced. In this study, a new layered membrane metamaterial was developed based on three layers of a reused PVC membrane and reused metal washers attached. The membranes were fixed to a rigid support, leaving a cavity between the stacked layers. The samples were used to measure the sound absorption coefficient with an impedance tube. Different configurations were analyzed, changing the number of masses attached to each layer and the geometry of their position. These measurements were subsequently used to train a model based on artificial neural networks for the prediction of the sound absorption coefficient. This model was then used to identify the metamaterial configuration that returns the best absorption performance. The designed metamaterial behaves like an acoustic absorber even at low frequencies.

1. Introduction

Sustainable architecture involves saving resources, reducing polluting emissions during the architectural product life cycle, the correct management of the materials used, and the use of renewable sources. Modern society has a considerable amount of new, disposable, and low-cost objects, which does not make the reuse of materials attractive, thus accumulating waste day after day [1]. The emergency linked to waste disposal requires a radical change of perspective, starting to design according to eco-design criteria. A sustainable design minimizes the presence of toxic substances in products, uses recycled materials, and reduces the quantity and types of materials used. Furthermore, it uses compatible materials, reducing the amount of processing waste, minimizing the packaging by exploiting a reusable packaging system. Finally, it increases the energy efficiency of electrically operated products, facilitates access to parts for their replacement or maintenance, allows the recovery of components for subsequent recycling [2].
A new design perspective must envisage a different approach to existing objects, providing for a new location when they have ceased to be used. Waste is no longer a problem but a resource, finding new opportunities for creativity in its uselessness. Thus, objects are always transformed into something else without ever becoming waste, in an eternal transformation in which they are used and reused by exploiting creative solutions. A new approach to objects becomes crucial, learning to separate them from their main function and to observe them for their material potential [3].
The reuse of objects is widespread thanks to a growing ecological awareness of society. Reduction and reuse are not two alternative practices, but they can both be adopted in different areas [4]. Reuse is based on the concepts of simplicity and circular economy [5]. An object designed throughout its life cycle (Life Cycle Design) will already provide for its disposal or transformation into something else [6]. This is not only an ecological issue, preventing non-biodegradable objects from being released into the environment and reducing the use of raw materials, but also an ethical issue—reuse being an opportunity for the development of less industrialized countries, because what is waste in a capitalist society is material in a less technically advanced context [7].
Another aspect of reuse is closely linked to design. There has always been, on the part of the most curious and intelligent designers, an interest in objects created for contexts but with a hidden potential that suggests their useful application in other sectors. In this context, the creativity of the designer is solicited who identifies new forms of objects that have reached the end of their life or that for other reasons lie unused and abandoned. In this way, the object acquires new features that take advantage of the characteristics and properties inherent in the material and which may not have been initially foreseen. The new geometries envisaged by the designer exploit the characteristics of the material by providing new uses that, in some cases, can make the new object more interesting than the original one [8,9]. The reuse of materials has been widely applied in the history of art; specifically, in painting and sculpture [9,10] as well as in architecture [11,12].
Noise is one of the most common pollutants in cities, defined as a generally unpleasant sound. This depends on each person, since for some, a sound can be pleasant or tolerable, whilst for others, it can be considered annoying and even painful. In a new building’s design, a lot of attention must be reserved for the acoustics of the building [13]. The sound in a room, regardless of its characteristics, has two components: direct sound and indirect sound. Direct sound is a sound that comes directly from the sound source. Indirect sound is the result of the multiple reflections, diffractions, and absorptions that the walls, ceiling, floor, and the different objects in the room produce to direct sound [14].
Sound absorption is a fundamental element in the field of environmental acoustic design. The absorbent and reflective surfaces determine the behavior of the sound and consequently the acoustics of the environment [15]. Optimal room acoustics always consist of a combination of different absorbent and reflective surfaces. To obtain effective sound absorption, it is necessary to provide adequate characteristics for the materials used. The success in the acoustic design of any type of room, once its volume and shape have been established, lies above all in the choice of the most suitable materials to be used as cladding to obtain an optimal reverberation time.
The sound absorption depends greatly on the material, a correct choice will provide the most adequate absorption in all the frequency bands of interest [16]: Obtaining good sound absorption performance is not a simple thing; thus, several researchers are looking for new solutions to improve this performance. Recently, attention has been paid to a new category of acoustic absorbers based on metamaterials. The term metamaterial was initially used by Victor Veselago [17] around 1967 to refer to a type of material, hitherto theoretical, in which negative values would be observed for some electromagnetic parameters (permittivity and magnetic permeability), which, up to that time, they believed capable of assuming only positive values. Subsequently, the study of metamaterials was extended to acoustic systems to give rise to acoustic metamaterials [18,19,20]. An acoustic metamaterial is a structure composed of several elementary units, identical to each other and arranged in a periodic network. Based on the distance between these units, the geometry of each of them, and the properties of the medium in which they are incorporated, this system can influence the acoustic waves that propagate through it in unusual ways. Some of the characteristics identified in such materials include negative refraction [21], band gap [22], birefringence [23], and autocollimation [24]. These properties can be applied in a variety of devices covering different cases such as acoustic barriers [25], acoustic lenses [26], and acoustic absorbers [27,28,29,30].
To improve the sound-absorbing performance, we can design a new composite structure by combining materials already available to obtain a new material with properties different from the starting materials. In the new composite, the different materials collaborate in mass, size, and internal mechanical characteristics. Recently, the interest of researchers has focused on membrane metamaterials [31,32]. In these metamaterials, a thin layer of elastic material is exploited, which does not have flexural stiffness to generate resonances at low frequencies to which dipolar modes correspond; it is therefore capable of generating an effective negative density. These metamaterials are characterized by extremely small dimensions of the periodic structure and allow the setting of the resonances at the desired frequencies. Lee et al. [33] proposed a metamaterial with a periodic structure of cells coated with a thin membrane under tension. The material returns negative effective density over a wide frequency range from 0 to 735 Hz. Yang et al. [34] elaborated on a metamaterial using a membrane structure with very simple geometry. The material proposed in this study can attenuate the sound wave with a significant margin in the frequency range from 100–1000 Hz. The structure has a small elastic film with fixed boundaries defined by a rigid grid, with a small mass attached to the center of the membrane sample. The weak elastic modules of the membrane generate low-frequency oscillations regulated by the attached masses. Yang et al. [35] presented a new membrane-type metamaterial made with a thin, slightly stretched elastic membrane attached to a rigid plastic grid, with a small mass attached to the center of the grid. The unit cells were arranged in parallel to form a light and relatively thin panel capable of acoustic attenuation with an average STL (Sound Transmission Loss) of 40 dB over the frequency range of 50–1000 Hz. Mei et al. [36] elaborated a membrane-like acoustic metamaterial using a thin film with attached asymmetrical rigid platelets. The metamaterial returned an almost unitary sound absorption coefficient at frequencies in which the wavelength of the incident sound wave is three orders of magnitude greater than the thickness of the membrane. The flapping motion of the rigid plates generates a large elastic bending energy density in their perimeter regions. Ma et al. [37] made a membrane-like metamaterial with a plate attached to the center of the cell. The structure is placed at a short distance from a totally reflective rigid surface; in this way, two hybridized resonances are generated in the new structure which returns a robust impedance and perfect absorption. The width of the absorption band is very narrow but can be adjusted according to specific needs. Ciaburro et al. [38] proposed a new acoustic metamaterial structure based on the use of a thin cork membrane on which masses of different weights and shape were applied. The authors showed that the masses improve the acoustic behavior of the cork, an increase in the attached masses shifts the peak of the acoustic absorption coefficient towards the low frequencies and increases its value. Finally, an increase in the radius of the masses increases the frequency at which the absorption coefficient peak occurs.
Although this type of metamaterials has been extensively studied, many problems remain unsolved. For example, the performance of the sound absorption coefficient offered by these materials, even if concentrated at low frequencies, are narrow band. This is due to the local resonance phenomenon, which concerns the low-frequency range, while for the high frequencies, excellent performances are measured for wider frequency bands thanks to the Bragg scattering effects. A solution to this problem could be obtained by increasing the internal resonant mass but to the detriment of the lightness of the material which characterizes its competitiveness. To overcome these difficulties, Yang et al. [39] proposed an acoustic metamaterial using two coupled membranes with rigid circular masses attached. The symmetry of the structure generates monopolar and dipolar resonances returning a double negativity in the frequency range of 520–830 Hz. Lu et al. [40] created a metamaterial with a sandwich structure by inserting a thin membrane between two layers with a honeycomb geometry. The structure has a negative mass density at frequencies lower than the first natural frequency, giving excellent low-frequency acoustic insulation. Furthermore, the authors have shown that STL can be increased by modifying some characteristics of the membrane such as surface density, shape, and tension.
Based on the analysis of these works, in this study, a new membrane-type metamaterial was developed based on three reused PVC layers and attaching reused metal washers. To improve the acoustic absorption capacity at low frequencies, the internal resonances of the different layers of the material were coupled, obtaining an effectively extended absorption band. Each layer consists of a PVC membrane with attached masses mounted on a PVC frame. The specimens correctly assembled and stacked were housed in an impedance tube to measure the sound absorption coefficient. Different configurations were analyzed, changing the number of masses attached to each layer and the geometry of their position. These measurements were subsequently used to train a model based on artificial neural networks for the prediction of the sound absorption coefficient. This model was then used to predict the value of the sound absorption coefficient for all possible combinations; these values were used to evaluate the combinations which give the best absorption performance.
The rest of the paper is structured as follows: Section 2 describes in detail the preparation of the specimens, the procedure for measuring the sound absorption coefficient, and the methods applied for the analysis of the acoustic characteristics of the samples and the processing of the forecast models. Finally, the optimization procedure for finding the best specimen configuration is also described. Section 3 shows the results of the measurements of the sound absorption coefficient, of the simulation obtained with the model based on neural networks, and of the search for the optimal configuration. In Section 4, the conclusions are drawn by proposing possible practical uses of the proposed technology and possible future research ideas.

2. Materials and Methods

Sound-absorbing materials are generally used for improving room acoustics and obtaining adequate reverberation times [41,42]. Typically, these materials have many channels through which the sound wave can go into. The dissipation of energy in the form of heat occurs when the wave meets the walls of said channels. The greater the number of channels, the greater the absorption produced. This mechanism is typical of all porous materials, provided that the pores are accessible from the outside. Normally, these materials consist of fibrous or granular substances which have been given a sufficient degree of compactness by means of a pressing or weaving process [43].
The mass law correlates the sound-absorbing power with the surface mass density and with the frequency of the incident wave [44]: Sound absorption becomes low at low frequencies and often requires very massive and bulky solutions. Even porous materials are underperforming in that range: the pores are too small to trigger viscous phenomena or resonances for the wavelengths involved and are perceived as if they were homogeneous materials [45]. To increase the acoustic absorption at low frequencies, it is usually necessary to increase the energy density within the relative material, for example through resonances; the goal of metamaterials in acoustics is precisely to subvert the law of mass-frequency in the spectrum of low frequencies and allow greater control over these waves.

2.1. Membrane-Washer Acoustic Metamaterial

Membrane-type metamaterials are obtained by exploiting a thin layer of elastic material that has a low flexural stiffness. To increase the elasticity of the membrane, it is fixed to a rigid support with a slight tension, and masses are attached to it. In this way, when the sound wave hits the structure, low-frequency resonances are generated in correspondence with dipolar modes, which return an effective negative density. The dynamic mass of the structure assumes negative values in the frequency band between two modal resonances. When a sound affects this structure, the vibration of the membrane is out of phase with respect to the sound, imposing an almost total reflection of the sound. Due to the resonance and anti-resonance between incident sound waves and membrane vibration, a sound absorption effect occurs [46,47,48,49,50].
Based on these considerations, specimens were assembled using a lightweight membrane (weight of 1.8 × 10⁻⁴ g/mm2) composed of a highly impermeable and non-flammable agglomerate of PVC molecules (100% recycled), with a thickness of 0.18 mm (Figure 1a). It is an environmentally friendly material produced with phthalate-free, cadmium-free, mercury-free, and arsenic-free plasticizers. The membrane is certified by the manufacturer as B-s2,d0 according to European Standard EN 13501-1, where B means combustible materials—very limited contribution to fire, s2 means quantity/speed of emission of average intensity in smoke emission during combustion, and finally d0 means no dripping in production of flaming droplets/particles during combustion.
The membrane was fixed on a rigid frame obtained by reusing a PVC pipe (density 1.5 × 10⁻³ g/mm3) with a diameter of 100 mm and a thickness of 2 mm, commonly used for the construction of water drains at high or low temperature (Figure 1b). The tube was cut into cylindrical fragments with a length of 20 mm. The specimen was hit by a flow of hot air to stretch the membrane.
On the membrane, metal washers (Figure 1c) weighing 0.7 g and in the shape of a disc with a central hole (external diameter: 14 mm, internal diameter: 4 mm, thickness: 0.8 mm) were applied. Up to five washers were attached to the membrane according to a radial geometry, thus ensuring the periodicity typical of meta-materials (Figure 2).
Three elementary cells were assembled, consisting of the membrane fixed on the rigid structure with attached masses. Such layers will be stacked to form a layered membrane-type acoustic metamaterial. Figure 3 shows a possible configuration of the three layers of the membrane metamaterial with some washers attached and stacked to form a unit cell.
In the stacked material, the main resonant modes of the membrane in each layer are associated with out-of-plane displacements, as opposed to in-plane displacements. In this case, these out-of-plane modes of the layered membrane metamaterial can be effectively activated by propagating bending waves in the structure [51].

2.2. Measurement of the Acoustic Properties of the Metamaterial

To acoustically characterize the designed metamaterial, measurements of the sound absorption coefficient were carried out using an impedance tube according to the UNI EN ISO 10534 2 standard [52].
The impedance tube (Kundt tube) has the following measurements: Internal diameter 100 mm, length 560 mm, and distance between the two microphones equal to 50 mm (Figure 4). The dimensions of the tube (distance between the two microphones and internal diameter) limit the applicability of the measurements of the absorption coefficient of normal incidence in the frequency range between 200 Hz and 2.0 kHz.

2.3. Modeling of the Acoustic Behavior of the Metamaterial Based on Artificial Neural Networks

The measurements made with the impedance tube were collected in a database. These data will be exploited for the training of a model based on Artificial Neural Networks (ANNs) capable of predicting the measurement of the sound absorption coefficient for each configuration of the stratified metamaterial. The ability to predict the values of specific attributes represents one of the main challenges in the artificial intelligence community [53,54,55]. Since the sound absorption coefficient is a numerical attribute, it is a regression problem. Regression is a predictive modeling technique in which the target variable to be estimated is continuous [56,57]: this is the process of learning a target function that maps each attribute supplied as an input into a continuous output. The main objective of the regression is therefore to find the target function that can adapt to the input with the minimum error [58,59].
  • Artificial neural networks are quantitative models inspired by the structure and functioning of the human brain [60,61,62,63]. They are identified in non-linear regressors that express the functional relationships existing between an input vector and one or more output variables [64,65]. Specifically, each artificial neural network is composed of several elements:
  • The input layer is made up of the data that the network receives and thanks to which it is activated;
  • One or more intermediate units, called hidden layers, which process the inputs received thanks to the classification capacity for which the network has been trained;
  • The output status, which collects the results and models them up to the presentation of the definitive solution to the problem to which the network has been submitted;
  • The weights, which are the most important factors in the process of converting an input to impact the output; and
  • The bias, a parameter that is used to adjust the output together with the weighted sum of the inputs to the neuron.
Weights, like the slope in linear regression, are numerical parameters that determine how strongly each of the neurons affects the others. For a typical neuron, if the inputs are x1, x2, …, xn, the synaptic weights to be applied to them are indicated as w1, w2, …, wn and the resulting output will be defined by Equation (1).
y = f ( x ) = x i w i + b i a s
In Equation (1), f indicates the activation function, that is, mathematical functions that can convert input into an output; without them, the functioning of neural networks would be the same as linear functions [66]. The input of the next layer is the output of the neurons present in the previous layer; therefore, the greater the number of layers that make up the network, the greater its efficiency [67]. Each layer is composed of neurons, also called nodes, which intend to simulate the role of biological neurons and which perform a very simple operation which consists of becoming active if the total amount of signal it receives exceeds its activation threshold [68]. If this happens, this artificial neuron emits a signal which is transmitted along the communication channels to the other units to which it is connected. Each connection node, which simulates biological synapses, acts as a filter that transforms the received message into an inhibitory signal, at the same time increasing or decreasing its intensity according to its individual characteristics [69]. Furthermore, the nodes have the task of weighing the intensity of the transmitted signals, precisely through the synaptic weights [70].

2.4. Metamaterial Design Optimization Using Brute-Force Search

In this phase, an attempt was made to identify the optimal configuration of the stratified membrane metamaterial to obtain the best performance as an acoustic absorber. The model based on neural networks allows us to derive the value of the sound absorption coefficient for each arrangement of the three layers of the metamaterial, in the sense that for each layer, we can change the number of attached washers. Given the modest extent of the provisions with possible repetitions (216), a brute force approach was chosen [71,72].
Brute force-based research methods achieve the perfect solution to a problem by analyzing all possible solutions available. The methodology then tests all possibilities until the desired solution is found [73]. This method does not therefore require prior knowledge of the domain under analysis. A brute force approach is simple to implement and will always find a solution to the computational problem by iteratively considering all possible solutions one by one (Table 1) [74]. However, its computational cost strictly depends on the number of available solutions. Therefore, it is often a relatively slow, albeit simple, approach to practical problems with a large solution space. It follows that such an approach is advisable when the size of the problem is small.
Our goal is to find the optimal configuration of the layered metamaterial—therefore the configuration that returns the maximum value of the sound absorption coefficient for each one-third octave frequency band. Each configuration is characterized by the number of washers applied on each layer: The layers are three (k = 3) and the number of elements is equal to six (n = 6). This is because 5 are the washers; moreover, there is the condition in which no washer is applied. For such a problem, the number of arrangements with repetitions is given by Equation (2) [75].
D n , k r = n k = 6 3 = 216
Equation (2) tells us that the number of arrangements to be analyzed is very small, reasoning in terms of the computational power of a computer; therefore, the brute force approach is amply justified.
For each configuration, we will predict the sound absorption coefficient using the model based on artificial neural networks; if it represents the maximum value, it will be set as the current value. At the end of the iterative process, the algorithm will give us the optimal arrangement of the elements (Table 1).

3. Results and Discussion

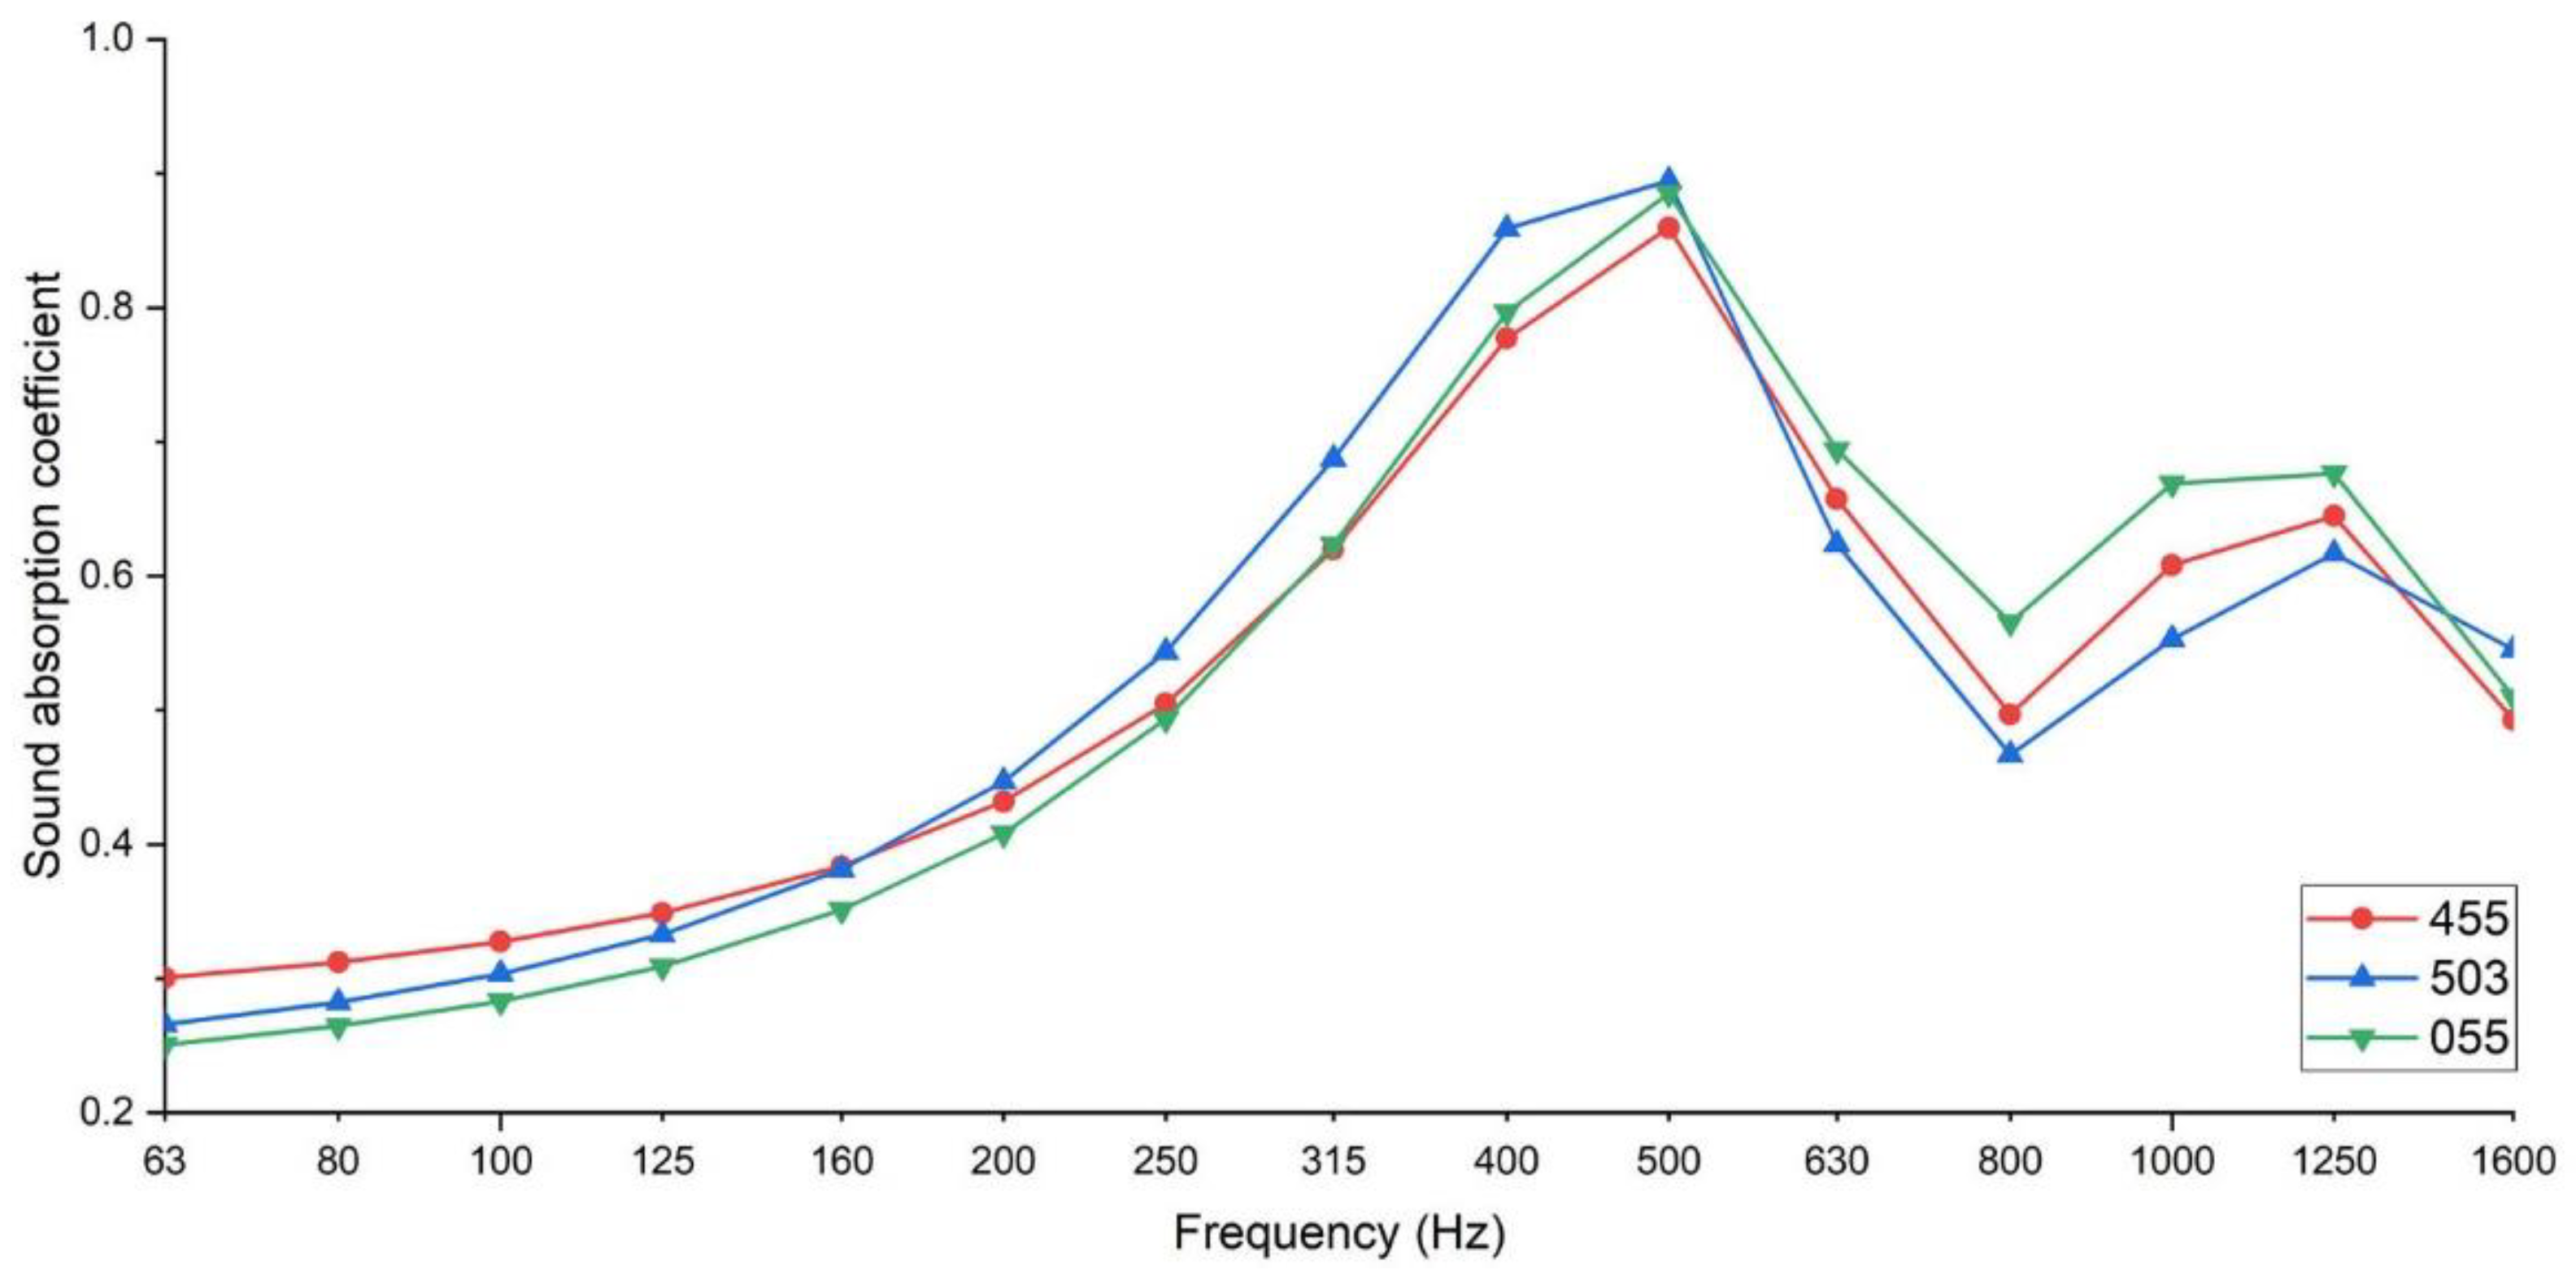
3.1. Impedance Tube Measurements

To carry out the measurements of the acoustic absorption coefficient by an impedance tube, three samples were assembled using a PVC membrane fixed to a rigid PVC frame and metal washers attached. The samples were stacked and housed in the impedance tube (Figure 4). To acoustically characterize the behavior of the material, different configurations of the stratified membrane metamaterial have been prepared, suitably modifying the number of washers attached to the membranes. At each measurement, the metamaterial unit cells were housed inside the tube, and then the measurement was carried out. Several measurements were carried out with the same configuration (about 10), to minimize measurement errors. For each repetition of the measurement, the specimen was repositioned in the tube. The results obtained were appropriately selected, taking care to discard the extreme values and making an average of the measured values [76,77].
The metamaterial unit cells were stacked inside the tube, thus obtaining a structure with a thickness of 60 mm. Each layer is formed by the membrane fixed on the rigid frame, with a thickness of 20 mm; therefore, each layer has a cavity of approximately 19.2 mm behind the membrane. The cavity behind the membrane combines the resonant absorption effect of the membrane with that of the resonant absorption of the cavity [32]. Figure 5 shows the results of the sound absorption coefficient measurements for some metamaterial configurations.
Figure 5 shows the results of measurements made with the impedance tube in one-third octave bands. Each curve refers to an arrangement of the washers on the membrane layers, the three numbers i ndicate the number of washers present on the three layers in order of stacking. Figure 5a shows the trends of the extreme sound absorption coefficient, that is, those that have shown behaviors significantly different from the others. The curve relating to arrangement 000, which corresponds to no-washers attached in all three layers and therefore only membranes and cavities, takes on a highly selective bell shape around the resonant frequency, typical of the absorption curve of cavity resonators [78,79,80,81]. For this configuration of the specimens, we observe a peak of the acoustic absorption coefficient positioned at a frequency of 400 Hz. Behavior at the opposite end can be observed for the 555 configuration, which corresponds to five washers attached in all three layers; hence, the maximum number of washers attached to the membranes. This configuration no longer shows the typical bell shape but rather shows an almost constant material behavior in almost all frequency bands. There is no longer a peak at the resonant frequency, but what is lost at this frequency (400 Hz) is largely compensated for at the lower frequencies (around 200 Hz); the sound absorption coefficient measured in the frequency range between 160 and 1600 Hz is always kept higher than 0.5.
Comparing the behavior of configurations 000 and 555, we can see a significant difference at low frequencies (160–250 Hz). In this frequency range, the presence of the masses attached to the membranes results in a considerable increase in the sound absorption coefficient (up to 0.23). On the other hand, it is possible to observe a marked reduction in the acoustic properties of the material in correspondence with the resonance frequency of the membranes; in fact, the configuration 555 does not have a peak in the sound absorption coefficient. The other three curves present in Figure 5a show an intermediate behavior between those described above. It is enough to remove a single washer from the first layer of the metamaterial to observe a reduction in the sound absorption coefficient at low frequencies (160–250 Hz) and an increase around the resonant frequency of the membranes (315–500 Hz), even if a peak is not yet present. The removal of further washers from the first layer determines a further and marked discrepancy from the behavior shown by the 555 configuration. In fact, there is now a peak even if at a frequency of 500 Hz. Furthermore, we can observe that the fewer the washers are on the first layer (with the same number of washers in the other two layers), the higher the peak value will be, demonstrating that the behavior of the material is progressively approaching that shown by the configuration 000, which corresponds only to membranes without washers.
To better characterize the acoustic behavior of the metamaterial, further configurations were compared. In Figure 5b, configuration 000 (only membranes) was compared with some configurations obtained by removing all the washers from the first layer. In all the cases shown, the behavior of the material is once again like that shown by the cavity resonators, with a bell-shaped trend around the resonant frequency. A significant worsening deviation from this behavior was detected for configuration 055 at frequencies 315–500 Hz, with a lowering of the peak and a shift towards the immediately higher frequency band (500 Hz), while an improvement deviation was detected for the 050 configuration at frequencies 160–250 Hz with an increase in the sound absorption coefficient. In Figure 5c configuration 000 (membranes only) are compared with some configurations obtained by removing all the washers from the second layer. In all the cases shown, the behavior of the material is typical of the absorption curve of cavity resonators, with a bell-like trend around the resonance frequency. A slight improvement deviation was detected for the configuration 303 at the frequencies 160–200 Hz, with a slight increase in the sound absorption coefficient. Finally, Figure 5d compares the configuration 000 (only members) with some configurations obtained by removing all the washers from the third layer. Furthermore, in this case, we can observe the typical trend of the absorption curve of cavity resonators, with a bell trend around the resonance frequency. A slight deviation was detected for the 050 configuration, which shows an improvement at the 160–250 Hz frequencies with a significant increase in the sound absorption coefficient, while the same configuration at the 400 Hz frequency shows a slight deflection of the peak. The results of the measurements tell us that the presence of the washers determines an almost constant acoustic behavior of the metamaterial in a wide range of frequencies. This behavior occurs when coupled resonance phenomena are triggered; in fact, the 555 configuration shows appreciable values of the sound absorption coefficient in a wide range of frequencies.

3.2. Artificial Neural Network Model

The data collected in the sound absorption coefficient measurements represent a wealth of information in the raw state which needs to be suitably extracted. To do this, we can take advantage of data mining (DM) methodologies to automatically extract knowledge from raw data. With data mining, trends and correlations are identified starting from raw data, extracting the necessary knowledge for the development of a forecasting model that allows the generalization of available data.
Several authors have tried to develop simulation models of the acoustic behavior of a material: Delany-Bazley [82], John-son-Champoux-Allard [83], Miki [84], and Hamet [85] represent those universally accredited by the scientific community. Several studies have exploited these models to characterize the acoustic properties of materials [86,87,88,89,90]. However, none of these can simulate the acoustic behavior of any material with sufficient generalization. To simulate the behavior of the layered membrane metamaterial, a model based on artificial neural networks was used. The input data were preprocessed by adding information on the configuration of the three layers to the results of the measurements of the sound absorption coefficient. Figure 6 shows the architecture of the prediction model of the acoustic behavior of the metamaterial object of this study.
As shown in Figure 5, the impedance tube measurements returned the sound absorption coefficient (SAC) as a function of frequency in one-third octave bands in a range from 63 Hz to 1600 Hz. Frequency represents the first input of the prediction model, and to this is added the data relating to the configuration of the stratified membrane metamaterial. It is a question of specifying the number of metal washers present in each layer; to do this, we foresaw three new variables (L1, L2, and L3) which are added to the frequency, bringing the number of input variables to four (Figure 6). The other characteristics of the metamaterial were not added as an input to the model as it does not discriminate between different configurations and does not bring any auxiliary information to the system; the indication of the physical characteristics of the membrane would not have enriched the input data with information since these characteristics are owned in a similar way by all occurrences of the dataset. The output of the forecast model will instead be the value of the sound absorption coefficient relating to the specified configuration and to that specific frequency. Analyzing the diagram of Figure 6 as a whole and noting that the output value is of a numerical type, we can conclude that it is a regression problem with four predictors and a response variable.
The data were collected in a numerical dataset with five features: four input variables (Frequency, L1, L2, L3) and one output variable (SAC). The number of records collected with the measurements was equal to 735, corresponding to 49 possible configurations (216). In preparing the dataset, particular attention was paid to the correct labeling of the data. For each configuration of the metamaterial, with an indication of the number of washers present on each membrane, and for each frequency value, the corresponding returned SAC value was obtained from the measures. This phase is fundamental in an algorithm based on Machine Learning of the supervised type. The label allows you to train the algorithm on a test sample, indicating what the output should be, so that following training, the algorithm will be able to generate the correct label on the test sample.
The acoustic absorption coefficient (SAC) prediction model is based on a feed-forward artificial neural network [91,92,93,94]. In the training phase, the SAC values returned by the model were compared with those measured and corresponding to the same configuration, as obtained from data labeling. This comparison allows you to evaluate a forecast error that will be used to update the weights.
The method used in this work for updating the weights was the back-propagation algorithm [95,96], which, through appropriate modifications of the network weights, tries to minimize, in absolute terms, a predefined performance function. The function used is the gradient rule, where the error is given by the mean square error recorded every time the partial output of the network does not coincide with the expected one. The forecast model was developed on Mathworks’ Matlab (2021) platform [97]. The parameters of the ANN-based model are shown in Table 2.
The data collected from the measurements were divided into three data sets: 70% of the data was used for training the neural network, 15% was used for model validation, and, finally, the remaining 15% was used to test the model. Figure 7 shows the trend of the parameter values during the training phase. The extreme values are shown in Table 3.
To evaluate the performance of the prediction model of the sound absorption coefficient, two metrics were adopted: mean square error (MSE) and correlation coefficient (R). MSE measures the variability between actual data and predicted data by the model. Variability is a measure of data dispersion. MSE analyzes how measures are distributed or concentrated around a central trend measure [98,99]. The mean square error (MSE) is defined by Equation (3).
M S E = 1 N   i = 1 N ( x i x ^ i ) 2
Here:
  • xi is the measured value.
  • x ^ i is the predicted value.
  • N is the number of the observations.
Another metric adopted for performance evaluation is the correlation coefficient, which returns values in a range of −1 to +1; both extreme values represent perfect relationships between variables, while 0 represents no relationship. A positive relationship indicates that records that get high values in one variable tend to have high values in the second variable. If there are low values on one variable, low values are on the second variable [100,101].
Table 4 shows the values of the metrics adopted for performance evaluation in the three processing phases of the algorithm. The results obtained clearly show that the prediction model returns values of the sound absorption coefficient very close to those obtained from the measurements. This also happens in the test phase in which the algorithm processed data that it had never seen before.
The adaptability of the model to the measured values can be visually assessed through the typical scatter diagrams in which the values obtained from the measurements are reported on the horizontal axis (target), while the corresponding values obtained from the prediction made by the model are reported on the ‘vertical axis (output) (Figure 8).
From the analysis of Figure 8, we can appreciate that the graphic descriptors of the points are positioned near the continuous line that represents the ideal situation [102,103]. This happens for all phases of model development.
To appreciate the results obtained with the model based on ANNs, we proceeded to compare these results with those obtained from a model based on traditional multiple linear regression (Table 5).
In Table 4, it is possible to note that the results obtained with the ANNs are decidedly better than those obtained with linear regression, confirming the highly non-linear nature of the acoustic behavior of the stratified membrane metamaterial.

3.3. Design Optimization Results

In the final phase of this study, the prediction model of the sound absorption coefficient was used to identify the optimal configuration of the metamaterial, that is the configuration that returns the greater value of the SAC in correspondence to each frequency band. As already mentioned in Section 2.4, given the modest entity of the possible configurations (216), a brute force approach was chosen.
For each possible configuration, the value of the sound absorption coefficient was evaluated, and for each frequency band, the number of washers for each layer that return the greater value of the SAC was identified. Table 6 shows the search results.
Analyzing the results obtained (Table 6), we can see that at low frequencies (63–125 Hz), the optimal configuration—that is, the one that gives the greatest value of the sound absorption coefficient—is obtained with the greatest number of washers attached to the membrane. In fact, all three layers show several washers equal to five, except the first, which has four—indicating that at low frequencies, due to the resonance and anti-resonance between incident sound waves and membrane vibration, an effect is determined by acoustic insulation. Resonances are then generated in correspondence of dipolar modes, which return a negative effective density. For medium frequency bands (200–400 Hz) in the range considered, the higher values of the SAC are obtained for configurations in which the intermediate layer has no washers attached. This is the frequency range in which the peak of the SAC trend is positioned with the frequency, and we have seen that the best performance is returned by the membrane alone.
In fact, we already observed by analyzing Figure 5a that the absence of washers in all three layers, with a configuration characterized only by membranes and cavities, restored a trend of the SAC with a highly selective bell shape around the resonant frequency, typical of the absorption curve of cavity resonators. Finally, for high-frequency bands (500–1250 Hz) in the range considered, the absence of washers is highlighted in the first layer: Once again, the behavior of cavity resonators seems to prevail.
To allow an appreciation of the performance of the search for the optimal metamaterial configuration, three configurations are compared (Figure 9). Figure 9 shows the results of the prediction of the sound absorption coefficient of three configurations present in Table 5. The ones that returned the highest SAC values at low, medium, and high frequencies were selected. We can see that at low frequencies (63–125 Hz) the 455 configuration returns the highest values of the SAC. For medium frequencies (200–500 Hz), it is the 503 configuration that returns the highest values of the SAC. Finally, for high frequencies (630–1250 Hz), it is the 055 configuration that returns the highest values of the SAC.

4. Conclusions

In this study, a new layered membrane metamaterial was developed based on three layers made with a reused PVC membrane and attaching reused metal washers to each layer. The membranes were fixed on a rigid support, leaving a cavity between the stacked layers. The test pieces were used to measure the sound absorption coefficient with an impedance tube. Different configurations were analyzed, changing the number of masses attached to each layer and the geometry of their position. These measures were subsequently used to train a model based on artificial neural networks for the prediction of the sound absorption coefficient. This model was then used to identify the metamaterial configuration that returns the best absorption performance.
The results of this study tell us that the designed metamaterial is capable of significantly improving the acoustic behavior of the original membrane, especially at low frequencies. The presence of washers on the membrane characterizes its acoustic behavior. No washers in all three layers returned a highly selective bell-shaped sound absorption coefficient around the resonant frequency—this behavior is typical of cavity resonators. For this configuration of the specimens, we observed a peak of the acoustic absorption coefficient positioned at a frequency of 400 Hz. The opposite behavior assumed the configuration with five washers in all three layers. This configuration no longer showed the typical bell shape but, on the contrary, it showed an almost constant behavior of the material in almost all frequency bands. The peak at the resonant frequency of the membrane was replaced by a significant improvement in performance at the lowest frequencies (around 200 Hz).
The search procedure for the optimal configuration confirmed this behavior. In fact, at low frequencies (63–125 Hz) the optimal configuration is obtained with the greater number of washers attached to the membranes of the three layers, indicating that at low frequencies, due to the resonance and anti-resonance between incident sound waves and membrane vibration, an acoustic insulation effect is determined. For medium frequency bands (200–400 Hz), the higher values of the SAC are obtained for configurations in which the intermediate layer has no washers attached. Finally, for high-frequency bands (500–1250 Hz), the optimal configuration provides for the absence of washers in the first layer: Once again the behavior of cavity resonators seems to prevail.
The aim of this work was to evaluate the unit cell performance of the stratified membrane metamaterial. This structure will be adopted for the construction of acoustic panels to be used for improving room acoustics. Acoustic panels are sound-absorbing panels which, when correctly positioned within a room, control and reduce ambient noise and reverberation. The possibility of adjusting the shape of the unit cells allows us to modulate the type of sound absorption on specific frequency bands. In this way, it is possible to design the acoustic panel according to the specific needs of the user.

Author Contributions

Conceptualization, G.C., R.P., G.I. and V.P.-R.; methodology, G.C., R.P., G.I. and V.P.-R.; software, G.C.; validation, G.C., R.P., G.I. and V.P.-R.; formal analysis, G.C., R.P., G.I. and V.P.-R.; investigation, G.C., R.P., G.I. and V.P.-R.; resources, G.C., R.P., G.I. and V.P.-R.; data curation, G.C., R.P., G.I. and V.P.-R.; writing—original draft preparation, G.C., R.P., G.I. and V.P.-R.; writing—review and editing, G.C., R.P., G.I. and V.P.-R.; visualization, G.C., R.P., G.I. and V.P.-R.; supervision, G.C., R.P., G.I. and V.P.-R.; project administration, G.C., R.P., G.I. and V.P.-R.; funding acquisition, V.P.-R. All authors have read and agreed to the published version of the manuscript.

Funding

The research leading to these results has received funding from the VII Call for Research Projects of the Universidad de Las Américas (Ecuador). Project Reference: SOA.DNS.20.02. Project name: “Acoustic metamaterials applied to duct design”.

Institutional Review Board Statement

Not applicable.

Informed Consent Statement

Not applicable.

Data Availability Statement

The data that support the findings of this study are available on request to the corresponding author.

Conflicts of Interest

The authors declare no conflict of interest.

References

  1. Bennetts, H.; Radford, A.; Williamson, T. Understanding Sustainable Architecture; Psychology Press: Oxford, UK, 2003. [Google Scholar]
  2. Guy, S.; Farmer, G. Reinterpreting sustainable architecture: The place of technology. J. Arch. Educ. 2001, 54, 140–148. [Google Scholar] [CrossRef]
  3. Bauer, M.; Mösle, P.; Schwarz, M. Green Building: Guidebook for Sustainable Architecture; Springer Science & Business Media: Berlin/Heidelberg, Germany, 2009. [Google Scholar]
  4. Park, J.; Tucker, R. Overcoming barriers to the reuse of construction waste material in Australia: A review of the literature. Int. J. Constr. Manag. 2017, 17, 228–237. [Google Scholar] [CrossRef]
  5. Grohens, Y.; Kumar, S.K.; Boudenne, A.; Weimin, Y. (Eds.) Recycling and Reuse of Materials and Their Products; CRC Press: Boca Raton, FL, USA, 2013. [Google Scholar]
  6. Alting, L. Life Cycle Engineering and Design. CIRP Ann. 1995, 44, 569–580. [Google Scholar] [CrossRef]
  7. Tingley, D.D.; Davison, B. Design for deconstruction and material reuse. Proc. Inst. Civ. Eng. Energy 2011, 164, 195–204. [Google Scholar] [CrossRef]
  8. Sivaloganathan, S.; Shahin, T.M.M. Design reuse: An overview. Proc. Inst. Mech. Eng. Part B J. Eng. Manuf. 1999, 213, 641–654. [Google Scholar] [CrossRef]
  9. Brilliant, R.; Kinney, D. (Eds.) Reuse Value: Spolia and Appropriation in Art and Architecture from Constantine to Sherrie Levine; Ashgate Publishing, Ltd.: Farnham, UK, 2011. [Google Scholar]
  10. Iannace, G.; Berardi, U.; De Rossi, F.; Mazza, S.; Trematerra, A.; Ciaburro, G. Acoustic enhancement of a modern church. Building 2019, 9, 83. [Google Scholar] [CrossRef] [Green Version]
  11. Demian, P.; Fruchter, R. An ethnographic study of design knowledge reuse in the architecture, engineering, and construction industry. Res. Eng. Des. 2006, 16, 184–195. [Google Scholar] [CrossRef]
  12. Ciaburro, G.; Iannace, G.; Lombardi, I.; Trematerra, A. Acoustic Design of Ancient Buildings: The Odea of Pompeii and Posillipo. Buildings 2020, 10, 224. [Google Scholar] [CrossRef]
  13. Shin, J.; Song, H.; Shin, Y. Analysis on the characteristic of living noise in residential buildings. J. Korea Inst. Build. Constr. 2015, 15, 123–131. [Google Scholar] [CrossRef] [Green Version]
  14. Jang, H.S.; Kim, H.J.; Jeon, J.Y. Scale-model method for measuring noise reduction in residential buildings by vegetation. Build. Environ. 2015, 86, 81–88. [Google Scholar] [CrossRef]
  15. Yang, M.; Sheng, P. Sound absorption structures: From porous media to acoustic metamaterials. Annu. Rev. Mater. Sci. 2017, 47, 83–114. [Google Scholar] [CrossRef]
  16. Ciaburro, G.; Iannace, G. Acoustic characterization of rooms using reverberation time estimation based on supervised learning algorithm. Appl. Sci. 2021, 11, 1661. [Google Scholar] [CrossRef]
  17. Veselago, V.; Braginsky, L.; Shklover, V.; Hafner, C. Negative refractive index materials. J. Comput. Theor. Nanosci. 2006, 3, 189–218. [Google Scholar] [CrossRef]
  18. Fok, L.; Ambati, M.; Zhang, X. Acoustic metamaterials. MRS Bull. 2008, 33, 931–934. [Google Scholar] [CrossRef]
  19. Cummer, S.A.; Christensen, J.; Alù, A. Controlling sound with acoustic metamaterials. Nat. Rev. Mater. 2016, 1, 16001. [Google Scholar] [CrossRef] [Green Version]
  20. Chen, S.; Fan, Y.; Fu, Q.; Wu, H.; Jin, Y.; Zheng, J.; Zhang, F. A review of tunable acoustic metamaterials. Appl. Sci. 2018, 8, 1480. [Google Scholar] [CrossRef] [Green Version]
  21. Craster, R.V.; Guenneau, S. (Eds.) Acoustic Metamaterials: Negative Refraction, Imaging, Lensing and Cloaking; Springer Science & Business Media: Berlin/Heidelberg, Germany, 2012; Volume 166. [Google Scholar]
  22. Tan, K.T.; Huang, H.H.; Sun, C.T. Optimizing the band gap of effective mass negativity in acoustic metamaterials. Appl. Phys. Lett. 2012, 101, 241902. [Google Scholar] [CrossRef]
  23. Zangeneh-Nejad, F.; Fleury, R. Acoustic birefringence via non-Eulerian metamaterials. J. Appl. Phys. 2019, 126, 034902. [Google Scholar] [CrossRef] [Green Version]
  24. Wang, H.; Lin, W.; Gu, J. Study on one-way transmission of acoustic wave based on metasurface. In Journal of Physics: Conference Series; IOP Publishing: Bristol, UK, 2021; Volume 1978, p. 012025. [Google Scholar] [CrossRef]
  25. Iannace, G.; Ciaburro, G.; Trematerra, A. Metamaterials acoustic barrier. Appl. Acoust. 2021, 181, 108172. [Google Scholar] [CrossRef]
  26. Li, Y.; Yu, G.; Liang, B.; Zou, X.-Y.; Li, G.; Cheng, S.; Cheng, J. Three-Dimensional ultrathin planar lenses by acoustic metamaterials. Sci. Rep. 2015, 4, 6830. [Google Scholar] [CrossRef] [Green Version]
  27. Mei, J.; Ma, G.; Yang, M.; Yang, Z.; Wen, W.; Sheng, P. Dark acoustic metamaterials as super absorbers for low-frequency sound. Nat. Commun. 2012, 3, 756. [Google Scholar] [CrossRef] [Green Version]
  28. Urbán, D.; Roozen, N.B.; Jandák, V.; Brothánek, M.; Jiříček, O. On the Determination of Acoustic Properties of Membrane Type Structural Skin Elements by Means of Surface Displacements. Appl. Sci. 2021, 11, 10357. [Google Scholar] [CrossRef]
  29. Pai, P.F.; Peng, H.; Jiang, S. Acoustic metamaterial beams based on multi-frequency vibration absorbers. Int. J. Mech. Sci. 2014, 79, 195–205. [Google Scholar] [CrossRef]
  30. Frenzel, T.; David Brehm, J.; Bückmann, T.; Schittny, R.; Kadic, M.; Wegener, M. Three-dimensional labyrinthine acoustic metamaterials. Appl. Phys. Lett. 2013, 103, 061907. [Google Scholar] [CrossRef]
  31. Huang, T.-Y.; Shen, C.; Jing, Y. Membrane- and plate-type acoustic metamaterials. J. Acoust. Soc. Am. 2016, 139, 3240–3250. [Google Scholar] [CrossRef] [Green Version]
  32. Ciaburro, G.; Iannace, G. Modeling acoustic metamaterials based on reused buttons using data fitting with neural network. J. Acoust. Soc. Am. 2021, 150, 51–63. [Google Scholar] [CrossRef]
  33. Lee, S.H.; Park, C.M.; Seo, Y.M.; Wang, Z.G.; Kim, C.K. Acoustic metamaterial with negative density. Phys. Lett. A 2009, 373, 4464–4469. [Google Scholar] [CrossRef]
  34. Yang, Z.; Mei, J.; Yang, M.; Chan, N.H.; Sheng, P. Membrane-Type acoustic metamaterial with negative dynamic mass. Phys. Rev. Lett. 2008, 101, 204301. [Google Scholar] [CrossRef]
  35. Yang, Z.; Dai, H.M.; Chan, N.H.; Ma, G.; Sheng, P. Acoustic metamaterial panels for sound attenuation in the 50–1000 Hz regime. Appl. Phys. Lett. 2010, 96, 041906. [Google Scholar] [CrossRef]
  36. Aravantinos-Zafiris, N.; Sigalas, M.M.; Katerelos, D.T. Phononic metamaterial for efficient sound attenuation applications. Build. Acoust. 2022, 1351010X221078937. [Google Scholar] [CrossRef]
  37. Ma, G.; Yang, M.; Xiao, S.; Yang, Z.; Sheng, P. Acoustic metasurface with hybrid resonances. Nat. Mater. 2014, 13, 873–878. [Google Scholar] [CrossRef]
  38. Ciaburro, G.; Iannace, G. Membrane-type acoustic metamaterial using cork sheets and attached masses based on reused materials. Appl. Acoust. 2022, 189, 108605. [Google Scholar] [CrossRef]
  39. Yang, M.; Ma, G.; Yang, Z.; Sheng, P. Coupled membranes with doubly negative mass density and bulk modulus. Phys. Rev. Lett. 2013, 110, 134301. [Google Scholar] [CrossRef]
  40. Lu, K.; Wu, J.H.; Guan, D.; Gao, N.; Jing, L. A lightweight low-frequency sound insulation membrane-type acoustic metamaterial. AIP Adv. 2016, 6, 025116. [Google Scholar] [CrossRef] [Green Version]
  41. Sagartzazu, X.; Hervella-Nieto, L.; Pagalday, J.M. Review in sound absorbing materials. Arch. Comput. Methods Eng. 2008, 15, 311–342. [Google Scholar] [CrossRef]
  42. Guarnaccia, C.; Tronchin, L.; Viscardi, M. Special issue on modelling, simulation and data analysis in acoustical problems. Appl. Sci. 2019, 9, 5261. [Google Scholar] [CrossRef] [Green Version]
  43. Arenas, J.P.; Crocker, M.J. Recent trends in porous sound-absorbing materials. Sound Vib. 2010, 44, 12–18. [Google Scholar]
  44. Bolt, R.H. On the design of perforated facings for acoustic materials. J. Acoust. Soc. Am. 1947, 19, 917–921. [Google Scholar] [CrossRef]
  45. Lee, C.-M.; Xu, Y. A modified transfer matrix method for prediction of transmission loss of multilayer acoustic materials. J. Sound Vib. 2009, 326, 290–301. [Google Scholar] [CrossRef]
  46. Naify, C.J.; Chang, C.-M.; McKnight, G.; Nutt, S. Transmission loss and dynamic response of membrane-type locally resonant acoustic metamaterials. J. Appl. Phys. 2010, 108, 114905. [Google Scholar] [CrossRef] [Green Version]
  47. Chen, Y.; Huang, G.; Zhou, X.; Hu, G.; Sun, C.-T. Analytical coupled vibroacoustic modeling of membrane-type acoustic metamaterials: Membrane model. J. Acoust. Soc. Am. 2014, 136, 969–979. [Google Scholar] [CrossRef] [Green Version]
  48. Ren, Z.; Cheng, Y.; Chen, M.; Yuan, X.; Fang, D. A compact multifunctional metastructure for Low-frequency broadband sound absorption and crash energy dissipation. Mater. Des. 2022, 215, 110462. [Google Scholar] [CrossRef]
  49. Zhang, Y.; Wen, J.; Xiao, Y.; Wen, X.; Wang, J. Theoretical investigation of the sound attenuation of membrane-type acoustic metamaterials. Phys. Lett. A 2012, 376, 1489–1494. [Google Scholar] [CrossRef]
  50. Naify, C.J.; Chang, C.-M.; McKnight, G.; Scheulen, F.; Nutt, S. Membrane-type metamaterials: Transmission loss of multi-celled arrays. J. Appl. Phys. 2011, 109, 104902. [Google Scholar] [CrossRef] [Green Version]
  51. Gao, C.; Halim, D.; Yi, X. Study of bandgap property of a bilayer membrane-type metamaterial applied on a thin plate. Int. J. Mech. Sci. 2020, 184, 105708. [Google Scholar] [CrossRef]
  52. UNI EN ISO 10534-2. Acoustics—Determination of Sound Absorption Coefficient and Impedance in Impedance Tubes—Part 2: Transfer-Function Method; ISO: Geneva, Switzerland, 1991. [Google Scholar]
  53. Ciaburro, G.; Iannace, G.; Ali, M.; Alabdulkarem, A.; Nuhait, A. An artificial neural network approach to modelling absorbent asphalts acoustic properties. J. King Saud Univ.-Eng. Sci. 2021, 33, 213–220. [Google Scholar] [CrossRef]
  54. Afram, A.; Janabi-Sharifi, F.; Fung, A.S.; Raahemifar, K. Artificial neural network (ANN) based model predictive control (MPC) and optimization of HVAC systems: A state of the art review and case study of a residential HVAC system. Energy Build. 2017, 141, 96–113. [Google Scholar] [CrossRef]
  55. Ciaburro, G.; Iannace, G.; Puyana-Romero, V.; Trematerra, A. A comparison between numerical simulation models for the prediction of acoustic behavior of giant reeds shredded. Appl. Sci. 2020, 10, 6881. [Google Scholar] [CrossRef]
  56. Draper, N.R.; Smith, H. Applied Regression Analysis; John Wiley & Sons: Hoboken, NJ, USA, 1998; Volume 326. [Google Scholar]
  57. Chatterjee, S.; Hadi, A.S.; Chatterjee, S.; Hadi, A.S. Regression Analysis by Example, 5th ed.; John Wiley & Sons, Inc.: Hoboken, NJ, USA, 2006. [Google Scholar]
  58. Liang, K.Y.; Zeger, S.L. Regression analysis for correlated data. Annu. Rev. Public Health 1993, 14, 43–68. [Google Scholar] [CrossRef]
  59. Allen, M.P. Understanding Regression Analysis; Springer Science & Business Media: Berlin/Heidelberg, Germany, 2004. [Google Scholar]
  60. Jain, A.; Mao, J.; Mohiuddin, K. Artificial neural networks: A tutorial. Computer 1996, 29, 31–44. [Google Scholar] [CrossRef] [Green Version]
  61. Hopfield, J.J. Artificial neural networks. IEEE Circuits Devices Mag. 1988, 4, 3–10. [Google Scholar] [CrossRef]
  62. Hassoun, M.H.; Intrator, N.; McKay, S.; Christian, W. Fundamentals of artificial neural networks. Comput. Phys. 1996, 10, 137. [Google Scholar] [CrossRef] [Green Version]
  63. Graupe, D. Principles of Artificial Neural Networks; World Scientific: Singapore, 2013; Volume 7. [Google Scholar]
  64. Mehrotra, K.; Mohan, C.; Ranka, S. Elements of Artificial Neural Networks; The MIT Press: Cambridge, MA, USA, 1996. [Google Scholar]
  65. Fabio, S.; Giovanni, D.N.; Mariano, P. Airborne sound insulation prediction of masonry walls using artificial neural networks. Build. Acoust. 2021, 28, 391–409. [Google Scholar] [CrossRef]
  66. Yang, G.R.; Wang, X.-J. Artificial neural networks for neuroscientists: A Primer. Neuron 2020, 107, 1048–1070. [Google Scholar] [CrossRef]
  67. Da Silva, I.N.; Spatti, D.H.; Flauzino, R.A.; Liboni, L.H.B.; dos Reis Alves, S.F. Artificial Neural Networks; Springer International Publishing: Cham, Switzerland, 2017; Volume 39. [Google Scholar]
  68. Walczak, S. Artificial neural networks. In Encyclopedia of Information Science and Technology, 4th ed.; IGI Global: Hershey, PA, USA, 2018; pp. 120–131. [Google Scholar]
  69. Basheer, I.; Hajmeer, M. Artificial neural networks: Fundamentals, computing, design, and application. J. Microbiol. Methods 2000, 43, 3–31. [Google Scholar] [CrossRef]
  70. Towell, G.G.; Shavlik, J.W. Knowledge-based artificial neural networks. Artif. Intell. 1994, 70, 119–165. [Google Scholar] [CrossRef]
  71. Schaeffer, J.; Lu, P.; Szafron, D.; Lake, R. A re-examination of brute-force search. In Proceedings of the AAAI Fall Symposium on Games: Planning and Learning, Edmonton, AB, Canada, 22–24 October 1993; pp. 51–58. [Google Scholar]
  72. Fellows, M.R.; Fomin, F.V.; Lokshtanov, D.; Rosamond, F.; Saurabh, S.; Villanger, Y. Local search: Is brute-force avoidable? J. Comput. Syst. Sci. 2012, 78, 707–719. [Google Scholar] [CrossRef] [Green Version]
  73. Anantharaman, T.; Campbell, M.S.; Hsu, F.-H. Singular extensions: Adding selectivity to brute-force searching. Artif. Intell. 1990, 43, 99–109. [Google Scholar] [CrossRef]
  74. Riddle, P.; Segal, R.; Etzioni, O. Representation design and brute-force induction in a Boeing manufacturing domain. Appl. Artif. Intell. 1994, 8, 125–147. [Google Scholar] [CrossRef]
  75. Rota, G.-C.; Kahaner, D.; Odlyzko, A. On the foundations of combinatorial theory. VIII. Finite operator calculus. J. Math. Anal. Appl. 1973, 42, 684–760. [Google Scholar] [CrossRef] [Green Version]
  76. Puyana-Romero, V.; Iannace, G.; Cajas-Camacho, L.G.; Garzón-Pico, C.; Ciaburro, G. Acoustic characterization and modeling of silicone-bonded cocoa crop waste using a model based on the gaussian support vector machine. Fibers 2022, 10, 25. [Google Scholar] [CrossRef]
  77. Ciaburro, G.; Puyana-Romero, V.; Iannace, G.; Jaramillo-Cevallos, W.A. Characterization and modeling of corn stalk fibers tied with clay using support vector regression algorithms. J. Nat. Fibers 2021, 1–16, 1–16. [Google Scholar] [CrossRef]
  78. Ingard, U. On the theory and design of acoustic resonators. J. Acoust. Soc. Am. 1953, 25, 1037–1061. [Google Scholar] [CrossRef]
  79. Lyapina, A.A.; Maksimov, D.N.; Pilipchuk, A.S.; Sadreev, A.F. Bound states in the continuum in open acoustic resonators. J. Fluid Mech. 2015, 780, 370–387. [Google Scholar] [CrossRef] [Green Version]
  80. Iannace, G.; Umberto, B.; Luis, B.M.; Ciaburro, G.; Puyana-Romero, V. Organic waste as absorbent materials. In INTER-NOISE and NOISE-CON Congress and Conference Proceedings, Seoul, Korea, 12 October 2020; Institute of Noise Control Engineering: Beijing, China, 2020; Volume 261, pp. 1821–1830. [Google Scholar]
  81. Miklós, A.; Hess, P.; Bozóki, Z. Application of acoustic resonators in photoacoustic trace gas analysis and metrology. Rev. Sci. Instrum. 2001, 72, 1937–1955. [Google Scholar] [CrossRef] [Green Version]
  82. Delany, M.; Bazley, E. Acoustical properties of fibrous absorbent materials. Appl. Acoust. 1970, 3, 105–116. [Google Scholar] [CrossRef]
  83. Champoux, Y.; Allard, J. Dynamic tortuosity and bulk modulus in air-saturated porous media. J. Appl. Phys. 1991, 70, 1975–1979. [Google Scholar] [CrossRef]
  84. Miki, Y. Acoustical properties of porous materials. Modifications of Delany-Bazley models. J. Acoust. Soc. Jpn. E 1990, 11, 19–24. [Google Scholar] [CrossRef]
  85. Hamet, J.F.; Berengier, M. Acoustical characteristics of porous pavements: A new phenomenological model. In Proceedings of the 1993 International Congress on Noise Control Engineering, Leuven, Belgium, 24–26 August 1993. [Google Scholar]
  86. Iannace, G.; Ali, M.; Berardi, U.; Ciaburro, G.; Alabdulkarem, A.; Nuhait, A.; Al-Salem, K. Development and characterization of sound-absorbing materials produced from agricultural wastes in Saudi Arabia. In INTER-NOISE and NOISE-CON Congress and Conference Proceedings, Seoul, Korea, 12 October 2020; Institute of Noise Control Engineering: Beijing, China, 2020; Volume 261, pp. 1806–1812. [Google Scholar]
  87. Latif, H.A.; Zaman, I.; Yahya, M.N.; Sambu, M.; Meng, Q. Analysis on sound absorber panel made of oil palm mesocarp fibre using Delany-Bazley and Johnson-Champoux-Allard models. Int. J. Nanoelectron. Mater. 2020, 13, 393–406. [Google Scholar]
  88. Akasaka, S.; Kato, T.; Azuma, K.; Konosu, Y.; Matsumoto, H.; Asai, S. Structure-sound absorption property relationships of electrospun thin silica fiber sheets: Quantitative analysis based on acoustic models. Appl. Acoust. 2019, 152, 13–20. [Google Scholar] [CrossRef]
  89. Iannace, G.; Ciaburro, G. Modelling sound absorption properties for recycled polyethylene terephthalate-based material using Gaussian regression. Build. Acoust. 2021, 28, 185–196. [Google Scholar] [CrossRef]
  90. Alber, S.; Ressel, W.; Liu, P.; Wang, D.; Oeser, M. Influence of soiling phenomena on air-void microstructure and acoustic performance of porous asphalt pavement. Constr. Build. Mater. 2018, 158, 938–948. [Google Scholar] [CrossRef]
  91. Chattopadhyay, S. Feed forward Artificial Neural Network model to predict the average summer-monsoon rainfall in India. Acta Geophys. 2007, 55, 369–382. [Google Scholar] [CrossRef]
  92. Paduszyński, K.; Domańska, U. Viscosity of Ionic liquids: An extensive database and a new group contribution model based on a feed-forward artificial neural network. J. Chem. Inf. Model. 2014, 54, 1311–1324. [Google Scholar] [CrossRef]
  93. Pani, A.K.; Amin, K.G.; Mohanta, H.K. Soft sensing of product quality in the debutanizer column with principal component analysis and feed-forward artificial neural network. Alex. Eng. J. 2016, 55, 1667–1674. [Google Scholar] [CrossRef] [Green Version]
  94. Karaboga, D.; Akay, B.; Ozturk, C. Artificial Bee Colony (ABC) optimization algorithm for training feed-forward neural networks. In International Conference on Modeling Decisions for Artificial Intelligence; Springer: Berlin/Heidelberg, Germany, 2007; pp. 318–329. [Google Scholar]
  95. Li, J.; Cheng, J.-H.; Shi, J.-Y.; Huang, F. Brief Introduction of Back Propagation (BP) Neural Network Algorithm and its Improvement. In Proceedings of the Advances in Computer Science and Information Engineering, 11 May 2012; Springer: Berlin/Heidelberg, Germany, 2012; pp. 553–558. [Google Scholar] [CrossRef]
  96. Jayalakshmi, T.; Santhakumaran, A. Statistical normalization and back propagation for classification. Int. J. Comput. Theory Eng. 2011, 3, 1793–8201. [Google Scholar]
  97. MATLAB. Available online: https://www.mathworks.com/products/matlab.html (accessed on 29 March 2022).
  98. Köksoy, O. Multiresponse robust design: Mean square error (MSE) criterion. Appl. Math. Comput. 2006, 175, 1716–1729. [Google Scholar] [CrossRef]
  99. Willmott, C.J.; Matsuura, K. Advantages of the mean absolute error (MAE) over the root mean square error (RMSE) in assessing average model performance. Clim. Res. 2005, 30, 79–82. [Google Scholar] [CrossRef]
  100. Benesty, J.; Chen, J.; Huang, Y.; Cohen, I. Pearson correlation coefficient. In Noise Reduction in Speech Processing; Springer: Berlin/Heidelberg, Germany, 2009; pp. 1–4. [Google Scholar]
  101. Mukaka, M.M. Statistics corner: A guide to appropriate use of correlation coefficient in medical research. Malawi Med. J. 2012, 24, 69–71. [Google Scholar]
  102. Chisari, C.; Guarnaccia, C.; Rizzano, G. Numerical simulation of acoustic emission activity in reinforced concrete structures by means of finite element modelling at the macroscale. Struct. Health Monit. 2019, 19, 537–551. [Google Scholar] [CrossRef] [Green Version]
  103. Di Loreto, S.; Serpilli, F.; Lori, V.; Squartini, S. Sound quality evaluation of kitchen hoods. Appl. Acoust. 2020, 168, 107415. [Google Scholar] [CrossRef]
Figure 1. Basic elements of the acoustic metamaterial: (a) Membrane; (b) Rigid support; (c) Metal washers.
Sustainability 14 04218 g001
Figure 2. Drawing of the positioning of the metal washers on the membrane.
Sustainability 14 04218 g002
Figure 3. Example of configuration of a unit cell of the stacked material. The space between the layers has been foreseen to appreciate the presence of the washers on the membranes of the hidden layers.
Sustainability 14 04218 g003
Figure 4. Impedance tube for measuring the absorption coefficient at normal incidence, with the specimen housed.
Sustainability 14 04218 g004
Figure 5. Measurement results in 1/3 octave bands. Each curve corresponds to an arrangement of the washers on the membrane layers. The three numbers indicate the number of washers present on the three layers in order of stacking. (a) Extreme sound absorption coefficient trend; (bd) sound absorption coefficient for some different configurations.
Sustainability 14 04218 g005
Figure 6. Architecture of the acoustic absorption coefficient (SAC) prediction model based on feed-forward artificial neural networks.
Sustainability 14 04218 g006
Figure 7. Parameters value progress in training phase: (a) Gradient evaluation; (b) Validation Performance (MSE).
Sustainability 14 04218 g007
Figure 8. Predicted versus actual value for training, validation, test phase, and a summary diagram are shown.
Sustainability 14 04218 g008
Figure 9. Sound absorption coefficient for three metamaterial configurations (predicted values).
Sustainability 14 04218 g009
Table 1. Brute Force algorithm.
Input: Configuration (Frequency, L1, L2, L3)
Output: Optimal Configuration (Frequency, L1, L2, L3)
max = 0
for each configuration
alpha = ANN model prediction (configuration)
if alpha > max then
   max = alpha
   conf = configuration
Table 2. Artificial Neural Network-Based Model Parameters.
Model TypeArtificial Neural Network
Number of nodes in the input layer4
Number of Hidden Layers1
Number of nodes in the Hidden Layer10
Number of nodes in the output layer1
Training algorithmLevenberg-Marquardt backpropagation
Table 3. Training parameters value progress.
Parameter Initial ValueStopped ValueTarget Value
Epoch0491000
Performance0.9030.001220
Gradient1.610.005881.00 × 10−7
Table 4. Performance of the Artificial Neural Network-based model.
ObservationsMSER
Training5150.00140.9853
Validation1100.00140.9844
Test1100.00110.9896
Table 5. Comparison between ANN-based model and Multiple Linear Regression Model.
MSER
Artificial Neural Network-based model0.00110.9896
Multiple Linear Regression Model0.19790.1712
Table 6. Metamaterial design optimization results.
Frequency (Hz)Layer OneLayer TwoLayer ThreeSAC
634550.300
804550.312
1004550.327
1254450.349
1603540.387
2003150.448
2505030.543
3155030.687
4005000.860
5001520.916
6301530.706
8000540.568
10000550.669
12500520.689
16005000.563
Publisher’s Note: MDPI stays neutral with regard to jurisdictional claims in published maps and institutional affiliations.

