Article

Nature’s Contributions to People in Vulnerability Studies When Assessing the Impact of Climate Change on Coastal Landscapes

by
Areli Nájera González
1,*,
Fátima Maciel Carrillo González
1,
Oyolsi Nájera González
2,
Rosa María Chávez-Dagostino
1,
Susana Marceleño Flores
2,
Eréndira Canales-Gómez
3 and
Jorge Téllez López
3
1
Centro Universitario de la Costa, Universidad de Guadalajara, Puerto Vallarta 48280, Mexico
2
Cuerpo Académico Recursos Naturales, Universidad Autónoma de Nayarit, Tepic 63000, Mexico
3
Laboratorio de Ecología, Paisaje y Sociedad, Centro Universitario de la Costa, Universidad de Guadalajara, Puerto Vallarta 48280, Mexico
*
Author to whom correspondence should be addressed.
Sustainability 2022, 14(7), 4200; https://doi.org/10.3390/su14074200
Submission received: 30 January 2022 / Revised: 11 March 2022 / Accepted: 25 March 2022 / Published: 1 April 2022

Abstract

:
The geographic landscape is a recurrent unit of analysis in vulnerability studies. Single descriptions are often used to show the elements exposed in these landscapes. However, the concept requires specifying the components of the landscape and its functioning as a unit. Thus, the purpose of this research was to use the analysis of Nature’s Contributions to People (NCP) to describe the global contribution of landscape elements to human activities, prioritizing the units in which the effects of climate change may imply greater impacts on the human population. For this, we analyzed six categories of nature’s contributions applied to the landscape units in a fragment of the Mexican Pacific coast. The units with mangrove cover had the highest nature contributions. It is expected that the application of this approach in the exposure component of vulnerability studies will allow a better understanding of the non-return relationship and the search for adaptive nature-based solutions.

Graphical Abstract

1. Introduction

As mentioned by the Intergovernmental Panel on Climate Change (IPCC), climate change, resulting from both human actions and climate variation, is one of the main threats to ecosystems, biodiversity, and human populations [1]. One way to understand the impacts of climate change on socio-ecological systems is through vulnerability assessment studies [2].
Vulnerability is the propensity of a system to be damaged by a threat as a function of the system’s ability to recover from the damage [3]. To assess the vulnerability, it is composed of three components: exposure (elements of the system exposed to a hazard), sensitivity (processes and phenomena that can damage the system), and adaptive capacity (characteristics of the system to deal with the damage) [4]. The main objective of vulnerability studies is to provide sufficient contextual information and analysis to design climate change adaptation strategies [2,3,4].
According to national and international reviews [5,6], territories as a category of geographic analysis are one of the most recurrent subjects in climate change vulnerability studies (e.g., towns, cities, municipalities, countries, watersheds, physiographic regions, and natural protected areas).
These studies evaluate how the different elements in the territory (e.g., physical, biotic, human, and cultural) may be affected by climate change, in order to propose territorial action strategies that minimize damage [7]. Describing the exposure component is one of the challenges of vulnerability studies, especially in studies of territories where the exposed system is the geographic landscape [6].
The geographic landscape refers to the unit of convergence between abiotic factors (physical factors such as relief and soil) and biotic factors (such as ecosystems) and their anthropogenic use (social and cultural processes) [8]. The landscape as a unit of analysis is used to associate the impact of human activity on the natural environment and facilitates intervention for territorial management and planning [9]. The landscape assumes spatial limits that can be mapped (derived from physical, cultural, or political territorial characteristics) and society–natural environment relationships that can be measured and compared between different periods [10].
To assess the vulnerability of geographic landscapes, the surface magnitude of the landscape units is usually taken as the indicator that responds to the exposure component [5,6]. However, the complexity of the geographic landscape concept demands analysis of the elements of the landscape as well as revealing their functioning as a unit. To solve this problem, the analysis of ecosystem services has been suggested as an appropriate tool to describe the interactions of the landscape elements, mainly the contribution of the natural environment to human activities [11], and to highlight those landscape units where exposure to the effects of climate change may be more perceptible to the population, in terms of a direct impact on their daily subsistence, economic, and recreational activities.
In ecosystem services research, the Nature’s Contributions to People (NCP) approach, described by Diaz et al. [12], focuses on defining all contributions (positive and negative) provided by nature (and its associated processes) to people’s quality of life. The contributions are in three board groups: material, non-material, and regulating contributions.
Material contributions are elements of nature that are directly transformed into food, energy, or other material assets of people. Non-material contributions are elements of nature that contribute to the quality of life of people at a psychological level, such as recreation. Regulating contributions are elements and processes of nature that regulate the generation of material and non-material contributions, such as the regulation of biogeochemical cycles [13].
NCP emerges as a conceptual framework contrary to the idea of capitalizing on the ecological functions of nature as services that can be monetized, with the impacts on these functions compensated in the same way [12]. This philosophy is useful in climate change issues, as both are based on the idea of no return, meaning that there is no way to remedy human-caused impacts on nature. Therefore, actions should be directed to find new ways to manage natural systems in an effective, equitable, and sustainable way [13].
In this sense, the idea of evidencing the importance of a geographic landscape through the contributions of nature can be incorporated into the exposure component of climate change vulnerability studies, as a way to understand what humans lose by impacting the surface of the landscape unit [8].
Based on the above reflections, the objective of this research was to demonstrate that the analysis of Nature’s Contributions to People (NCP) can be a useful tool to describe the exposure component in vulnerability assessment studies of geographic landscapes to climate change. For this purpose, we use a fragment of the Pacific Coastal Plain in Mexico as a case study. It is an area dominated by coastal lagoon landscapes, wetlands, mangrove cover, and agricultural and tourism uses.
We found that the landscape units with mangrove cover had the highest number of contributions; therefore, they were the units with the highest exposure value to climate change, and the impact on them would result in a direct impact on human subsistence. However, this does not mean that it is the most vulnerable ecosystem. Further research is needed to continue to analyze the sensitivity and adaptive capacity component to assess the vulnerability of geographic landscapes.

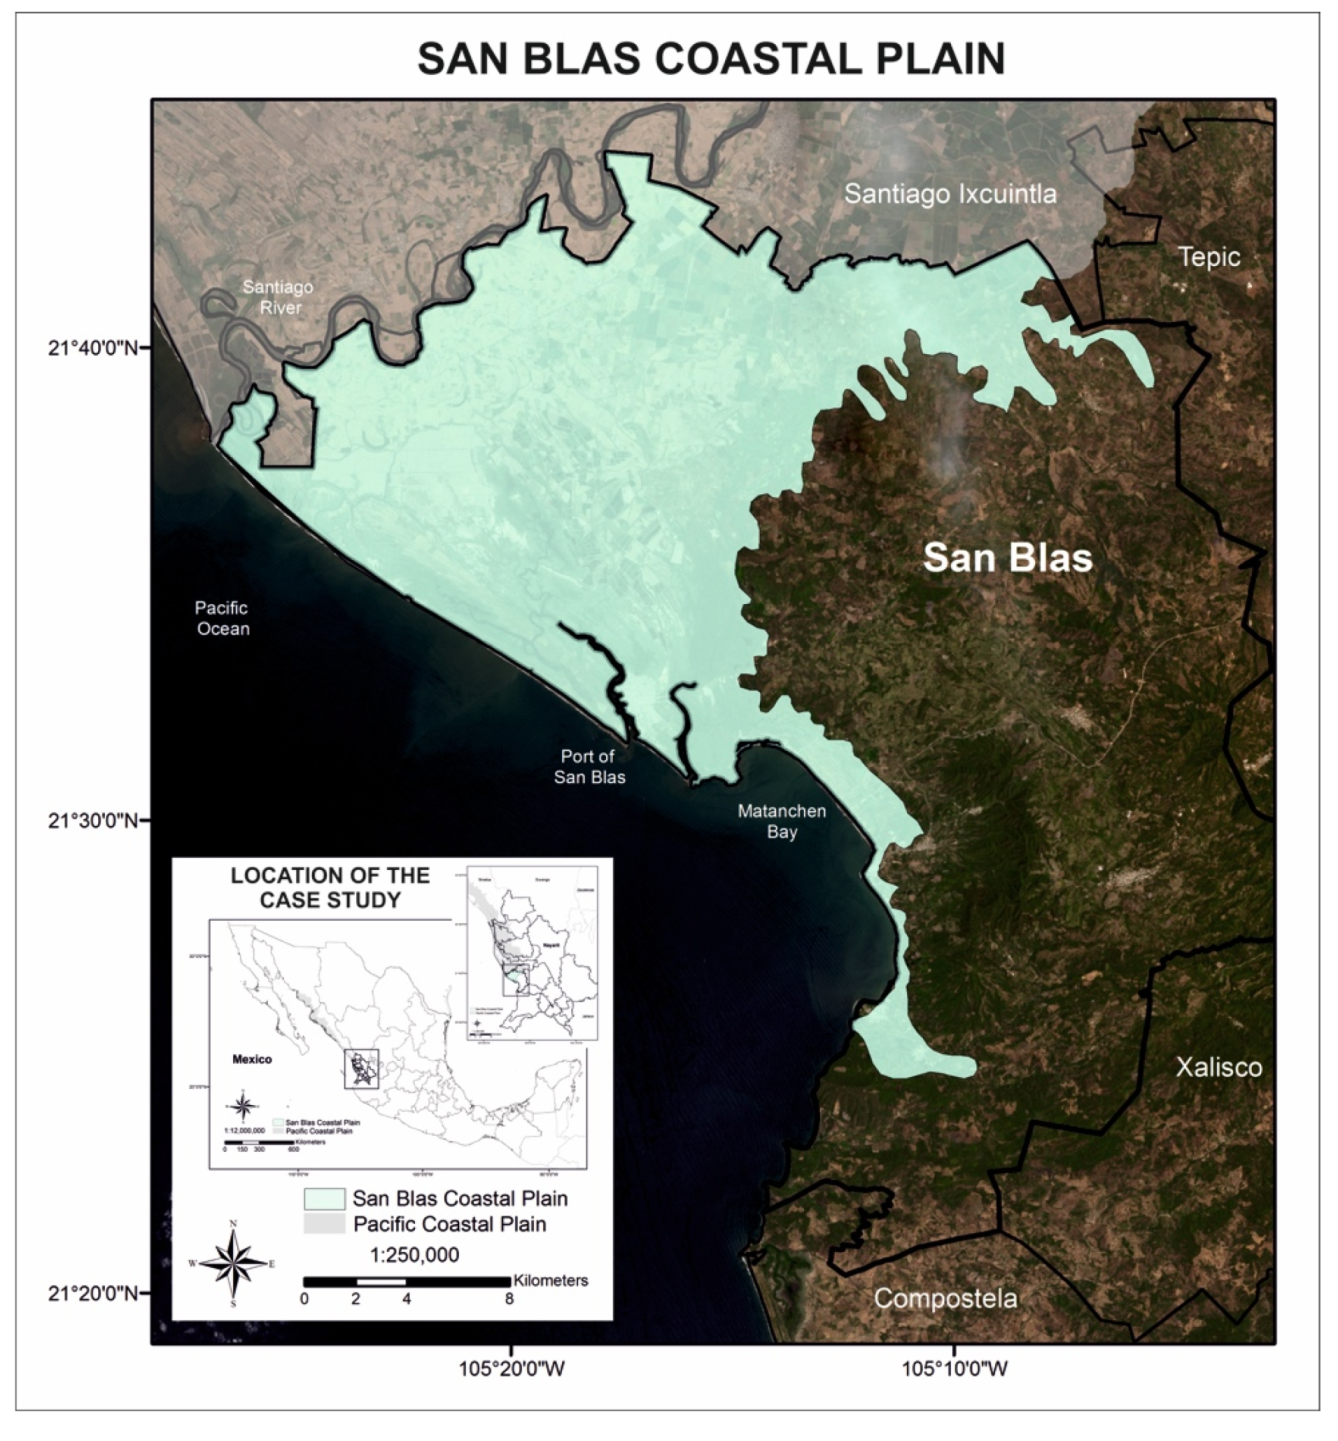
Context of the Case Study

According to data from the National Institute of Statistics and Geography (INEGI), the Pacific Coastal Plain is a physiographic region located on the northwestern coast of Mexico, in the states of Nayarit, Sinaloa, and Sonora [14]. This region is composed of marine dynamics and river flow, with a predominance of alluvial plains, wetlands, mangroves, coastal lagoons, and estuaries [15,16]. Due to these characteristics, it is an important reservoir of biodiversity, as well as a fertile area for agriculture and fishing. Consequently, it also faces various conflicts over the management of natural resources and the marginalization of the rural communities that live there, contributing to its vulnerability to climate change [17].
We chose as a case study a fragment in the southern zone of the Pacific Coastal Plain, where the physiographic region begins. This fragment corresponds to the state of Nayarit and is delimited within the limits of the municipality of San Blas; it is known as the San Blas Coastal Plain (Figure 1). This small fragment contains a diversity of landscapes and social problems that is present in the entire Pacific Coastal Plain; therefore, we consider its study as a sample of the region.
The San Blas Coastal Plain is a rural area where more than 45% of the municipality’s population lives, and it includes the municipal capital [18]. Most of these rural communities live in precarious socioeconomic conditions, and in their attempt to escape this condition, they have caused changes in land use to expand aquaculture and tourism activities [19]. These practices compromise the natural resources and ecosystems associated with the original coverage, such as mangrove forests.
As explained by the IPCC [1], the socioeconomic deficiencies of the communities have repercussions on actions that make the territory more vulnerable, in addition to contributing to climate change through loss of vegetation cover and greenhouse gas emissions. Thus, communities are involved in an endless cycle of anthropogenic extractive activities, and human populations are unprepared for the impacts of climate change on the ecosystems on which their livelihood activities depend.
The problem of the case study is a constant in other coastal regions of Mexico and underdeveloped countries. The mangrove-covered areas, their associated ecosystem services, and the communities that depend on them, are among the areas most vulnerable to climate change [20].

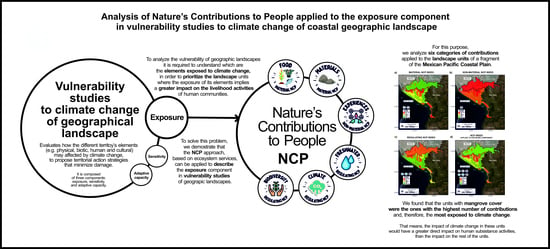
2. Materials and Methods

The method was divided into three sections:
(1)
Delimitation of landscape units, carried out through an ecological regionalization.
(2)
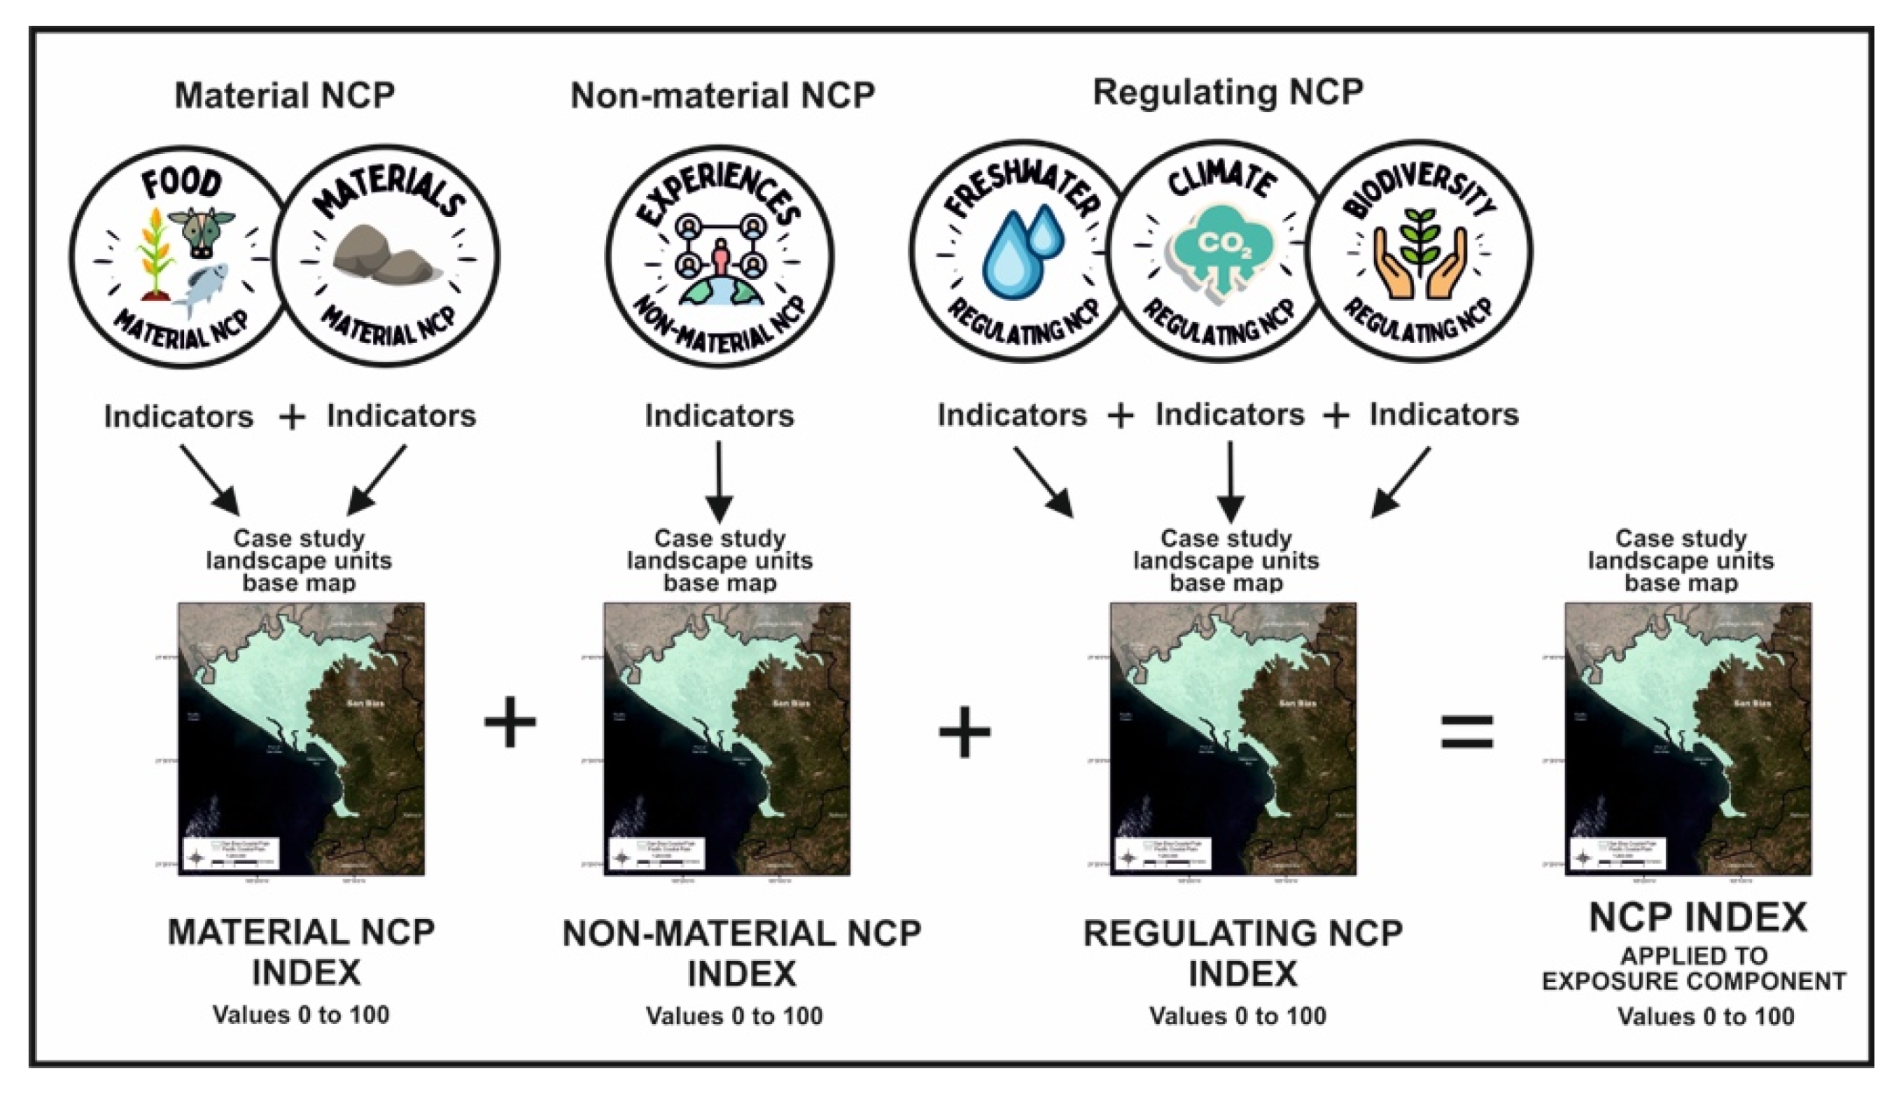
NCP analysis process: selection of contributions per board group, design of indicators to evaluate the contributions, and calculation of each contribution board group index in the landscape units.
(3)
Analysis of total NCP index as a description of the exposure component, assuming that the units with the highest contributions are units with the highest exposure value, in a range from 0 to 100.

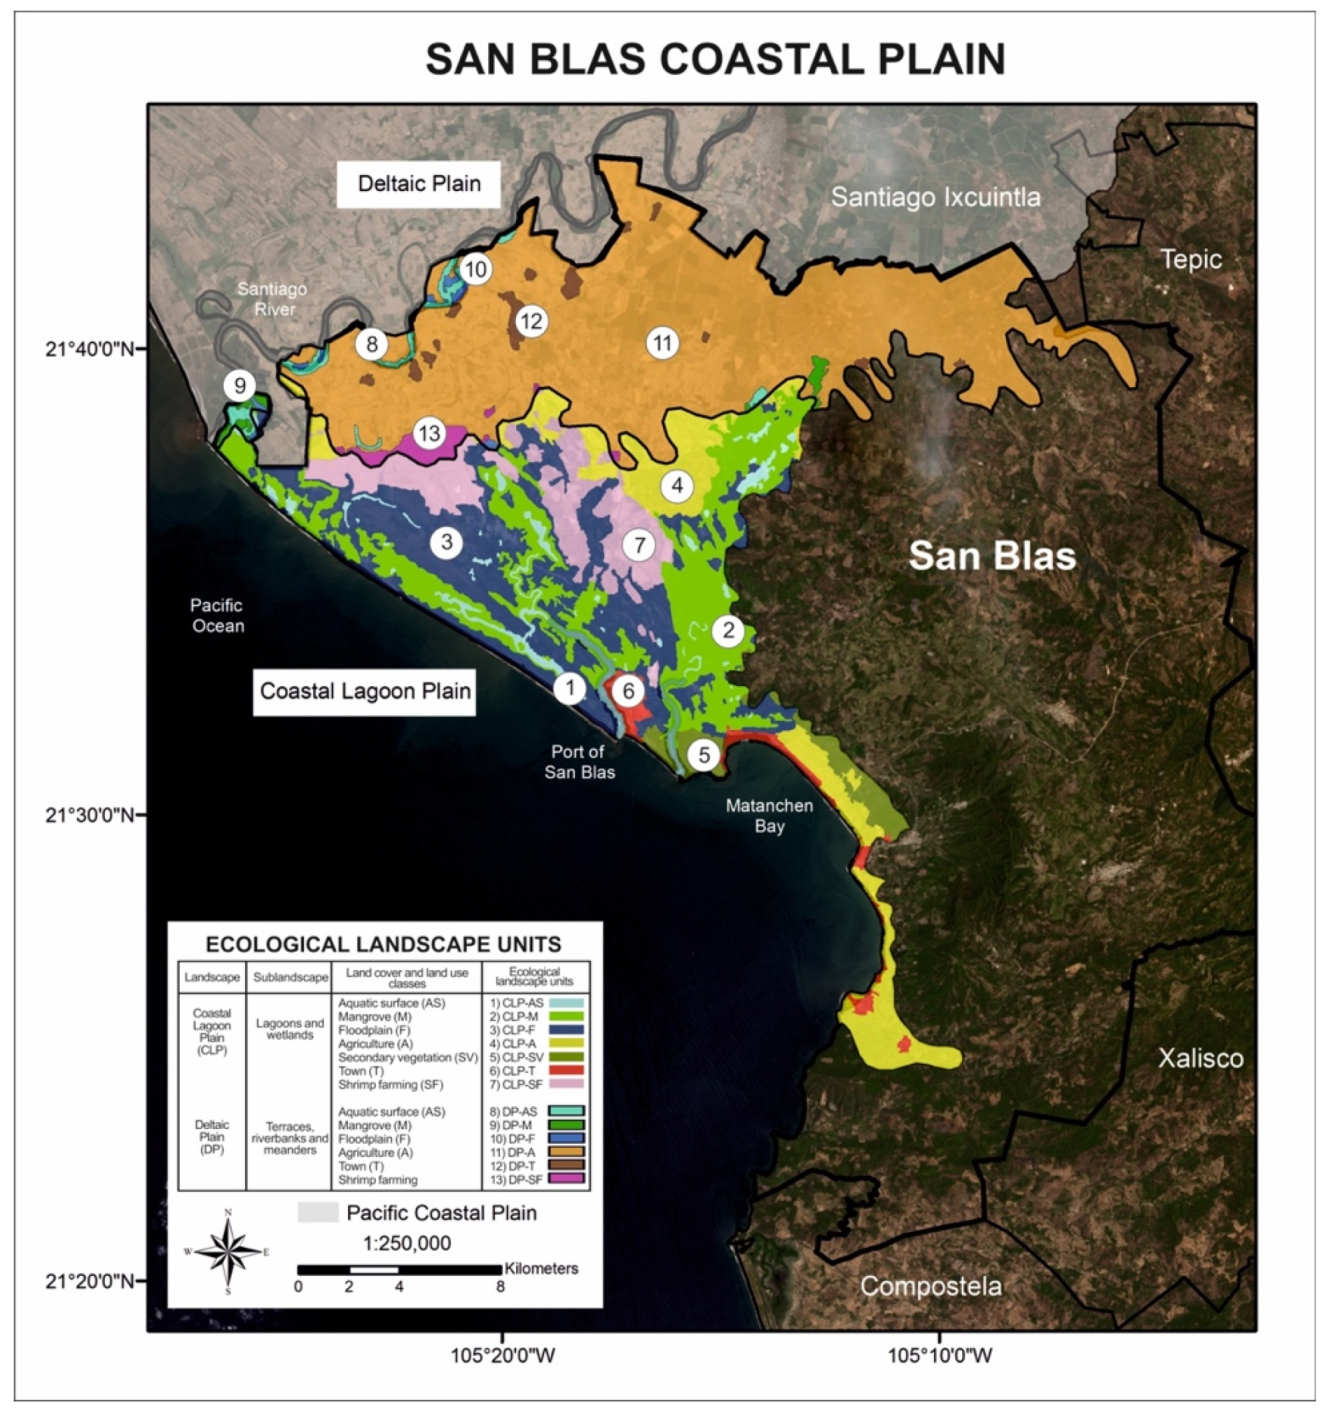
2.1. Delimitation of Landscape Units

We use the ecological regionalization method to delimit the landscape units, as has been used in other research in the study area [16]. According to the review by Bocco et al. [9], ecological regionalization is one of the tools used in territorial planning and management; its objective is to organize the spatial distribution of human activities to promote sustainability. Its main advantage is that it is a georeferenced framework that facilitates the application of policies and decision making for environmental management.
Ecological regionalization is based on geographic landscape theory [10]. Therefore, for its elaboration, it is necessary to know the interactions that exist between the natural components and human actions that compose the landscape through a regionalization model and organize the terrain into units with similar characteristics [22].
As explained by Bocco et al. [9], although there are different regionalization models, they all agree that relief characteristics are the main delimiting factor. In the case of ecological regionalization, in addition to relief, land cover and land use are considered as the final delimiting factor. Thus, information on geomorphological and edaphological aspects is linked to biotic aspects and anthropic activity. For this reason, the regionalization model is called the postfix ecological model. As a result of the hierarchical categorization of these thematic layers of information, we obtain ecological landscape units.
Following the above, the method consisted of defining ecological landscape units based on a hierarchical classification derived from the combination and analysis of two thematic maps: (1) geomorphoedaphological (genesis, relief characteristics, and soil types), and (2) land cover and land use. The first map was obtained from the research of González et al. [16], with reference to soil types by Bojórquez et al. [15], and we included the updated information described in Herrera et al. [23]. The second map was taken from the research of Nájera et al. [19], a product of a supervised classification of satellite images from 2019 concerning the classification proposed for the area by Berlanga and Ruiz [24].
Both maps were integrated into a GIS (ArcGIS 10.3). The geomorphological landscape and geomorphological sub-landscape levels were delimited from the first, and the land cover and land use group from the second. Finally, we defined ecological landscape units with associated geomorphological and edaphological attributes, as well as land cover and land use.

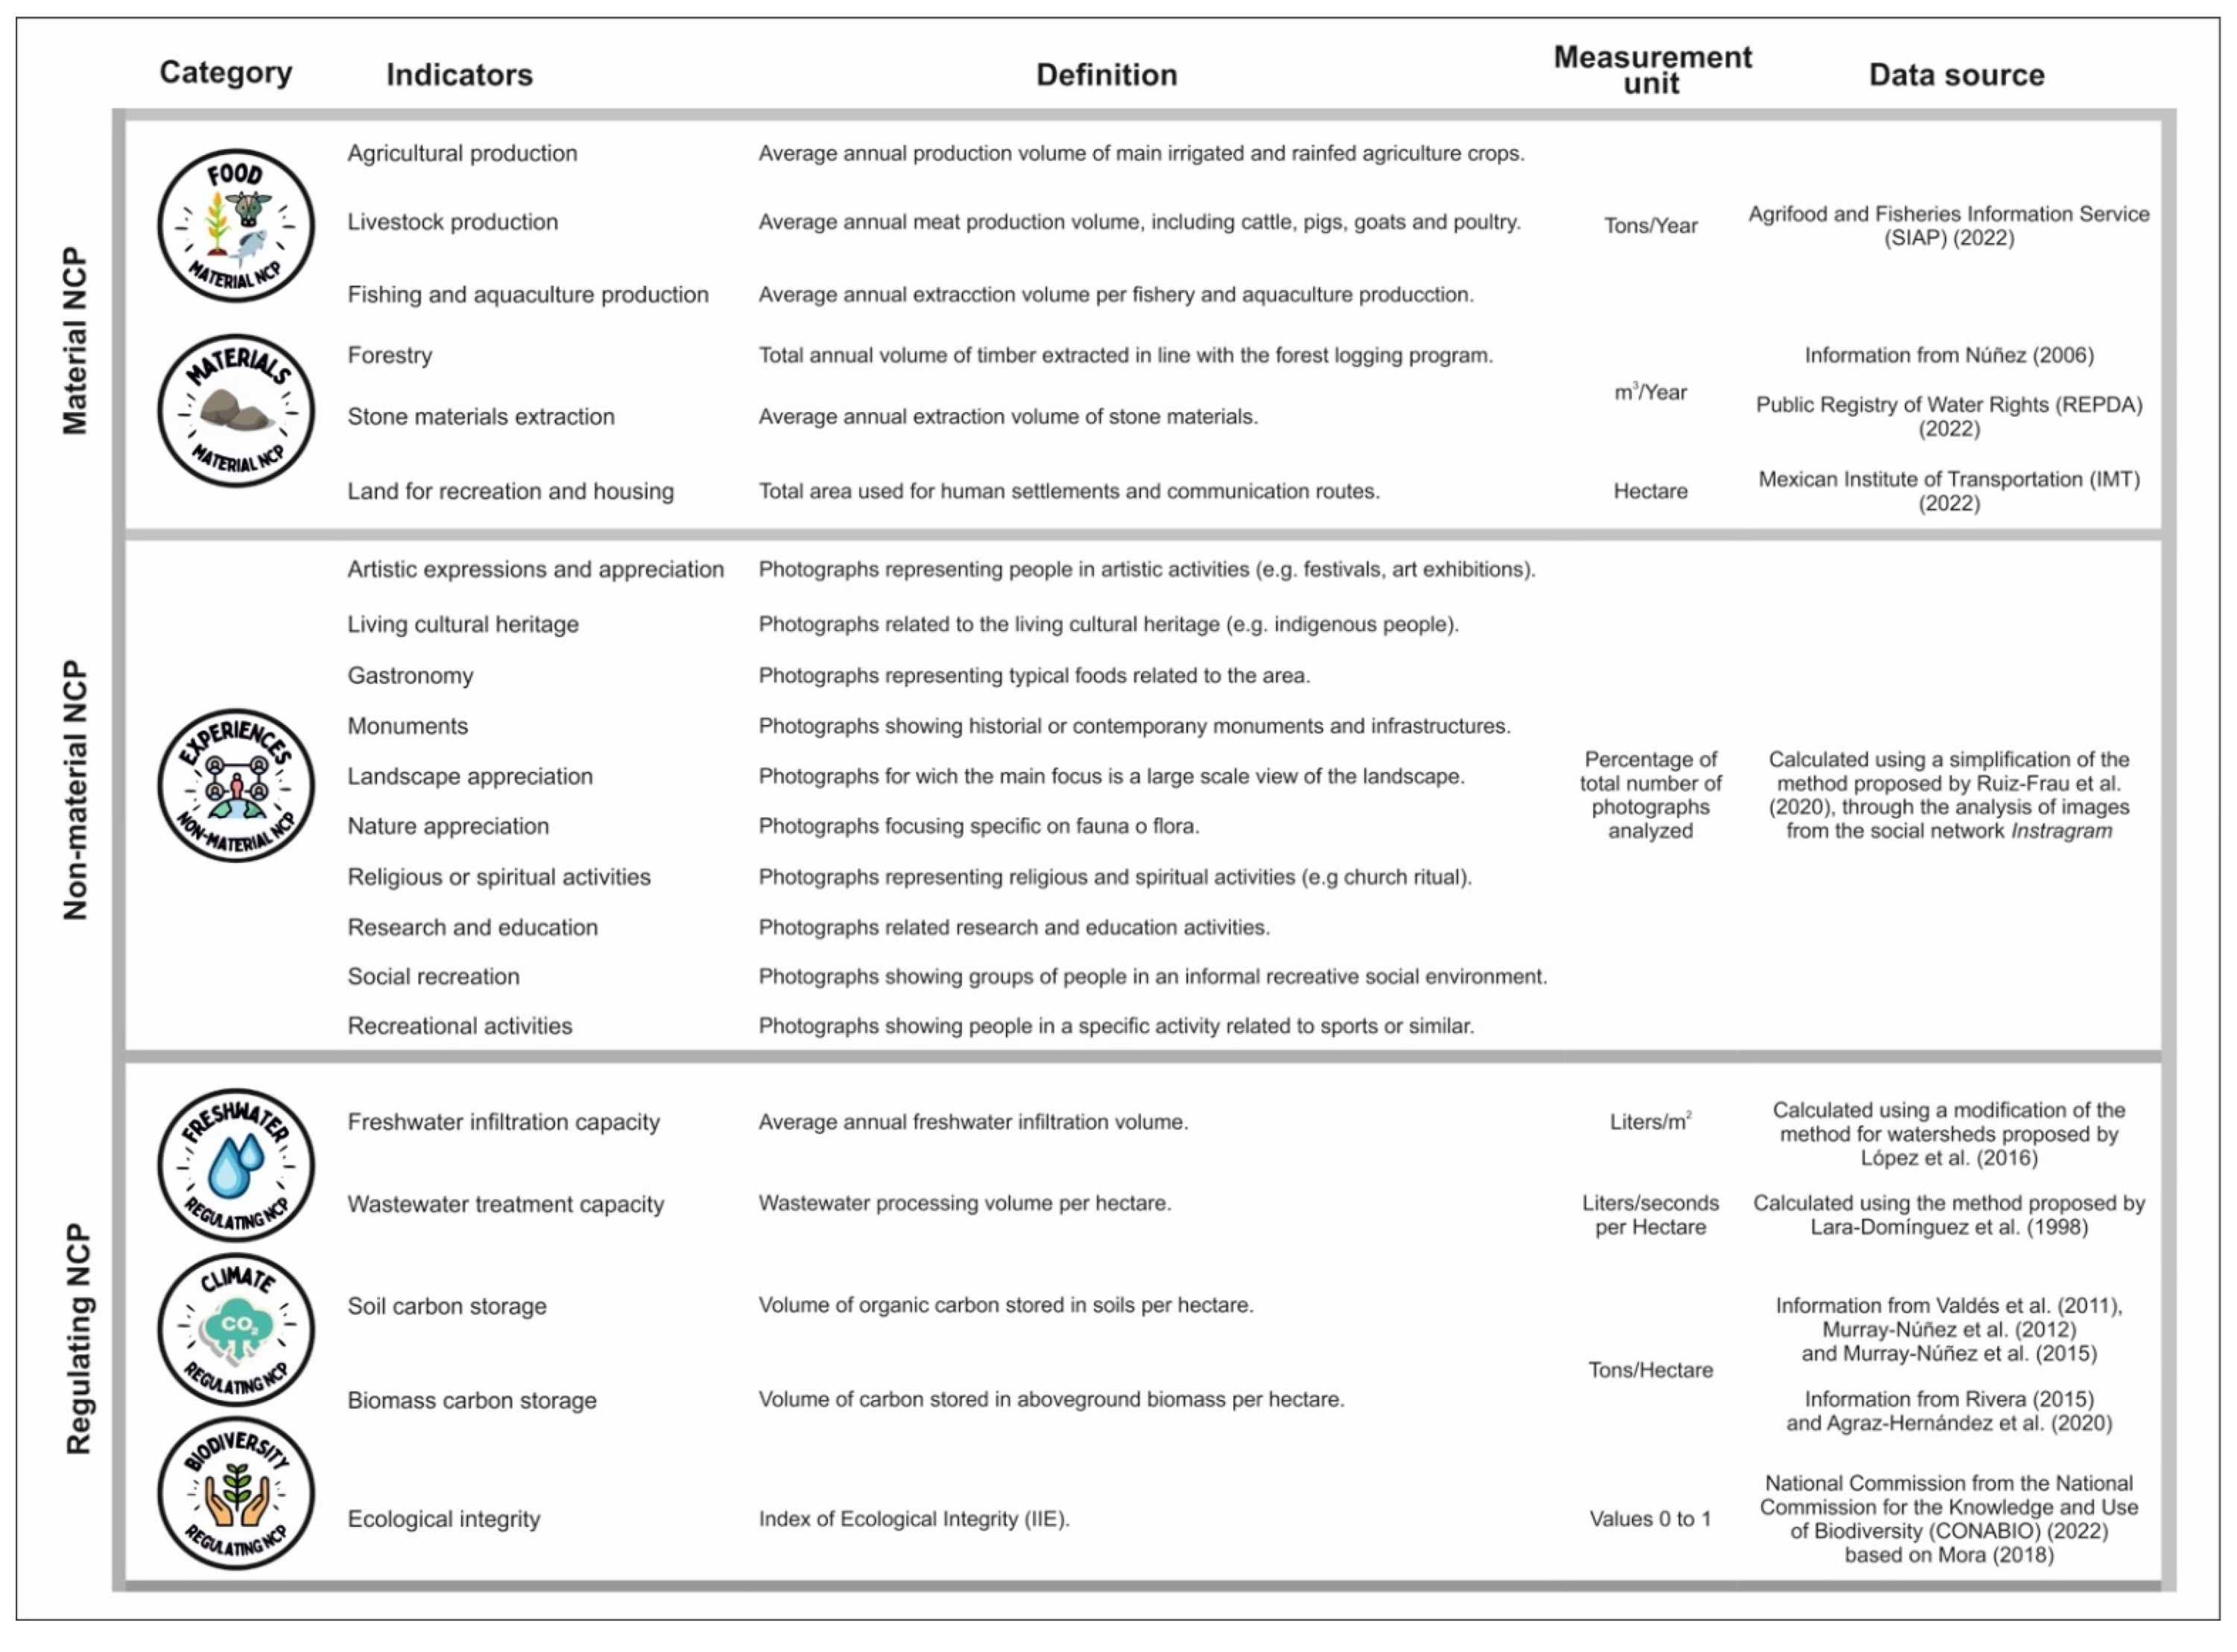
2.2. NCP Analysis Process

Based on research done by the Intergovernmental Science-Policy Platform on Biodiversity and Ecosystem Services (IPBES), the NCP framework proposes 18 categories of analysis to map nature’s contributions into the three initial broad groups: material contributions, non-material contributions, and regulating contributions [12]. The categories are stated by the authors as a guide. These are flexible to be regrouped or renamed according to the context of each case study, respecting the three initial broad groups of contributions in other research [13,25,26].
Knowing the characteristics of the coastal plain, we decided to analyze six categories: food and materials (material contributions), experiences (non-material contributions), freshwater regulation, climate regulation, and biodiversity (regulatory contributions).
To design the indicators to evaluate the contributions, we followed a guide for the design of composite indicators of sustainable development [27]. As described in the guide, an indicator is a technical instrument whose function is to measure one (simple indicators) or more attributes (composite indicators) of a subject. Composite indicators can summarize numerous attributes of the subject in a single simplified value, facilitating the analysis of the attributes of complex systems such as the landscape and issues such as sustainable development. Indicators have proven to be effective for public policy advocacy, due to the synthesized and simplified way of presenting the information. Therefore, the implementation of indicators in research that can be considered by decision makers is recommended.
The design of a composite indicator is based on two assumptions: the definition of what is to be measured, and the existence of reliable methods and information to measure it [27]. For the first, we resorted to the support of a theoretical-conceptual reference: in this case, the NCP framework. For the second, we resorted to identifying the indicators used in others research with the NCP framework for the categories of contributions previously selected (research compiled in Díaz et al. [12] and Brauman et al. [13]).
We determined the feasibility to implement the reference indicators according to the available information on the case study. The search for information was conducted through academic search engines, specialized databases, institutional repositories, the open data platform of the Government of Mexico, INEGI, and national and global estimation research, among others. On that basis, we defined the indicators to measure the six categories of contributions in each landscape unit (Figure 2).
Subsequently, the individual indicators of the contribution categories were aggregated to obtain three indexes for each broad group: the material contribution index, non-material contribution index, and regulating contribution index. To do this, it was necessary to eliminate scale conflicts by standardizing the data with the z-score formula, and normalizing their values from 0 to 100 according to the normalization formula by maximums and minimums. This formula also makes it possible to contrast the information between observations, highlighting the values of the indicators:
I p = o b s e r v a t i o n s I m i n i m u m I m a x i m a I m i n i m u m I × 100
I is the indicator of the variable p , i.e., the indicator of a contribution category. M i n i m u m I is the minimum observed value of the set of values of   l p . And m a x i m a I is the maximum observed value of the set of values of l p .
The indicators of the contribution categories food and materials (Material NCP) and climate and biodiversity (Regulating NCP) were calculated by extrapolating the data obtained directly from the data source to the study area. The information on the food category was obtained from the Agrifood and Fisheries Information Service (SIAP) [28]. For the materials category, it was obtained from Núñez [29], the Public Registry of Water Rights (REPDA) [30], and the Mexican Institute of Transportation (IMT) [31]. For the climate category, from Valdés et al. [32], Murray-Núñez et al. [33], Murray-Núñez et al. [34], Rivera [35] and Agraz et al. [36]. And the information for the biodiversity category, it was obtained from the National Commision for the Knowledge and Use of Biodiversity (CONABIO) [37] based on Mora [38].
The indicators of the experience (Non-material NCP) and freshwater (Regulating NCP) contribution categories were calculated using specific methods.
For the experiences contribution category (Non-material NCP), we used a social media network analysis to understand the experiences of people in the ecological landscape units. We adapted the method described in Ruiz-Frau et al. [39]. They and other authors have recently demonstrated how social media data (e.g., photographs, videos, tags) can be used to understand the interaction between people, the environment, and nature, especially with respect to ecosystem services. This method is based on analyzing the photograph publications by users in social networks, assuming that the elements shown in the photos are an important part of the experiences lived by people in that place, whether they are inhabitants or visitors. The method is informed by the fact that social networks are mostly used to share travel photos; therefore, we used approach to the non-material contributions of landscape elements associated with tourism.
Following the method, we extracted the photographs published by users of public accounts of the social network Instagram that were tagged with the keywords (hashtag) #sanblasnayarit in the period 2015–2019. To do this, we used the online tool PhantomBuster. A total of 1697 photos were obtained. From this value, we removed a sample by simple random sampling by applying the sample size formula for finite population with a 95% confidence level, obtaining 321 photos. The photos selected in the sample were classified by two reviewers into 10 classes previously defined by type of experience (Figure 2).
The classes were defined following the classification proposed in Ruiz-Frau et al. [39], and we added an extra exclusion class for photos alluding to advertising or information irrelevant to the analysis. To verify the consistency of the classification and the level of agreement among reviewers, we calculated the Kappa coefficient [40], obtaining 80.1%, which corresponds to high accuracy according to Landis and Koch [41]. Subsequently, the photos classified with concordance between both reviewers (271 photos) were compiled, and those classified in the exclusion class were excluded (14 photos). Finally, the 257 resulting photos were associated with each landscape unit using as reference the description, location, and additional hashtags mentioned by the authors in the original publications.
For the freshwater contribution category (Regulating NCP), to measure freshwater infiltration capacity, we used the method described in López et al. [42]. The formula was adapted according to the average annual precipitation that falls on 1 m 2 of each landscape unit; therefore, runoff from the upper watershed and extractions by uses were not considered. Thus, the potential net recharge volume was estimated by means of the formula I n = P E S E T , where I n is the infiltrated volume, P the average annual precipitation, E S the average volume that can runoff, and E T the evapotranspiration volume, each calculated in l / m 2 due to the adequacy of the formula for precipitation.
The mean annual precipitation data ( P ) were extracted from the analysis of Nájera et al. [43] for the period 2010–2015. The E S value was calculated using the formula E S = ( 1 C ) P A U , where P corresponds to precipitation, C to the runoff coefficient obtained from the type and land use of the unit and its permeability value (formula and parameters described in the normative appendix of NOM-011-CNA-2000 [44], and A U to the area of the unit (1 m 2 for the adequacy of the formula). The   E T value was calculated using the unit area data (1 m 2 ) and the annual evapotranspiration obtained by Turc’s method, with the formula as a function of precipitation and temperature for each landscape unit.
In the same contribution category, to assess the wastewater processing capacity, we calculated the difference between the total of wastewater generated in the study area and the total water treated by the existing treatment plants. It was assumed that the remaining wastewater is processed by the ecosystems, specifically the estuarine ecosystems of the mangrove cover units and flood marshes. This method is based on the proposal by Lara-Domínguez et al. [45] to calculate the natural water filtration service by mangrove ecosystems.
The amount of wastewater generated was estimated following the potable water, sewerage, and sanitation manual [46]. The calculation was made based on the estimated use of water per habitant, determining that approximately 80% be converted into wastewater. The manual indicates the approximate number of liters consumed according to the size of the population, which was adapted to the study area according to data from INEGI [18].

2.3. Analysis of Total NCP Index as a Description of the Exposure Component

To consolidate the information from the three board groups of contributions into a single value, the indices obtained were summed into a total NCP index (standardizing and normalizing their values as in the previous procedure) (Figure 3).
Following the objective of our research, we describe the exposure component using the total NCP index calculated for each landscape ecological unit, understood as the contributions of nature to people who are exposed to climate change. The results are shown in five ranges (five groups by geometric distribution of their frequencies): very low (values from 0 to 20), low (from 21 to 40), medium (from 41 to 60), high (from 61 to 80), and very high (values from 81 to 100). This range format is one of the most commonly used to express the vulnerability components [6]. The lowest exposure values represent the units with the fewest NCP, while, the highest exposure values represent the units with the most NCP.

3. Results and Discussion

3.1. Description of the Ecological Landscape Units

Two geomorphological landscapes were identified in the San Blas Coastal Plain, differentiated by their geodynamic style and origin of relief formation, as explained in González et al. [16]: the coastal lagoon plain and deltaic plain. The coastal lagoon plain covered 52.3% of the surface of the study area, with altitudes of up to 35 mamsl (meters above mean sea level). Its structure is originated and controlled by fluvial-marine processes derived from seawater intrusion by tides, seasonal rainfall, and runoff from the El Palillo river (Río Huicicila hydrological basin), and to a lesser extent from the Santiago river (Lerma-Santiago hydrological basin) [47]. In contrast, the deltaic plain is mostly originated and controlled by fluvial processes, mainly from the Santiago river and some other streams secondary to the El Palillo river, covering 47.7% of the study area, with altitudes up to 15 mamsl.
The geomorphological sub-landscapes were generalized and simplified according to the dominant topographic structures and associated edaphological characteristics detailed previously [15,16,23]. Thus, the coastal lagoon plain was characterized by the sub-landscapes of lagoons and wetlands, with prevalence of sodic Solonchaks soils, with fine texture, hydromorphism, and low fertility and erodibility, in combination with sub-aqueous Fluvisols and sodic Arenosols, and to a lesser extent Luvisols without salts. On the other hand, the deltaic plain (DP) was characterized by the sub-landscapes of terraces, riverbanks, and meanders, with the prevalence of Cambisols and neutral Fluvisols, without salts, with a sandy loam texture and medium fertility and erodibility, in combination with Feozems, and to a lesser extent Solonchacks.
According to Nájera et al. [19], there are seven land cover and land use types in the case study: aquatic surfaces (AS), mangrove (M), floodplain (F), agriculture (A), secondary vegetation (SV), towns (T), and shrimp farming (SF). As a final result of the regionalization, by merging the geomorphological landscapes and sub-landscapes with the land cover and land use groups, we obtained 13 ecological landscape units (Figure 4).
Seven ecological units were identified from the coastal lagoon plain (CLP): (1) CLP-AS: coastal lagoons, river channels, canals, and estuaries that contain water for most of the year; (2) CLP-M: marshes with periods of flooding due to tidal and alluvial conditions, covered by mangrove species that include black mangrove (Avicennia germinans), white mangrove (Laguncularia racemosa), and red mangrove (Rhizophora mangle), in association with other species of hydrophilic vegetation; (3) CLP-F: marshes with periods of flooding due to tidal and alluvial conditions, with cover of mangrove species, mostly button mangrove (Conocarpus erectus), in association with hydrophilic vegetation, or without vegetation cover; (4) CLP-A: cultivated land with fruit trees such as mango, banana, yaca, and coconut, and to a lesser extent, livestock grazing areas; (5) CLP-SV: modified cover of low and medium subcaducifolia rainforest in association with shrub vegetation; (6) CLP-T: human settlements with a population greater than 1200 inhabitants, including the municipal capital of San Blas, with a population greater than 10,000 inhabitants; (7) CLP-SF: aquaculture ponds, mostly for shrimp production, both in use and abandoned.
Derived from the deltaic plain (DP), six ecological units were identified: (8) DP-AS: canals derived from the Santiago river that contain water for most of the year; (9) DP-M: marshes with periods of flooding due to tidal and alluvial conditions, with coverage of mangrove species that include black mangrove (A. germinans), white mangrove (L. racemosa), and red mangrove (R. mangle), in association with other species of hydrophilic vegetation at the end of the Santiago river; (10) DP-F: marshes with periods of flooding due to tidal and alluvial conditions, with coverage of mangrove species, mostly button mangrove (C. erectus), in association with hydrophilic vegetation, or without vegetation cover; (11) DP-A: land cultivated with pasture, forage grains, rice and beans, areas for livestock grazing use, and to a lesser extent, mango and banana trees; (12) DP-T: human settlements with a population of less than 1200 habitants, with the exception of the localities of Aután and Guadalupe Victoria, with a population between 2000 and 3000 inhabitants; (13) DP-SF: ponds in disuse, with previous aquaculture activity of shrimp production.
It should be noted that the regionalization process implemented was a simplified process, based on regionalizations in the area carried out by other research and designed for land use planning. Therefore, we formed units that were as homogeneous as possible in definition, and heterogeneous among themselves but generalized (e.g., coastal dunes, crop types, and other specific coverages were excluded). This was decided considering that fragmenting the land to specify units would also require more specific information to describe them [10,22].
In addition, we used the municipal political divisions as the main delimitation factor, thinking that it would be appropriate for the implementation of adaptation strategies derived from the vulnerability study. However, a regionalization approach based on hydrographic basins might have worked better, so that adaptation strategies would be designed in synergy with sectoral watershed management programs at the municipal, state, and national levels [8].

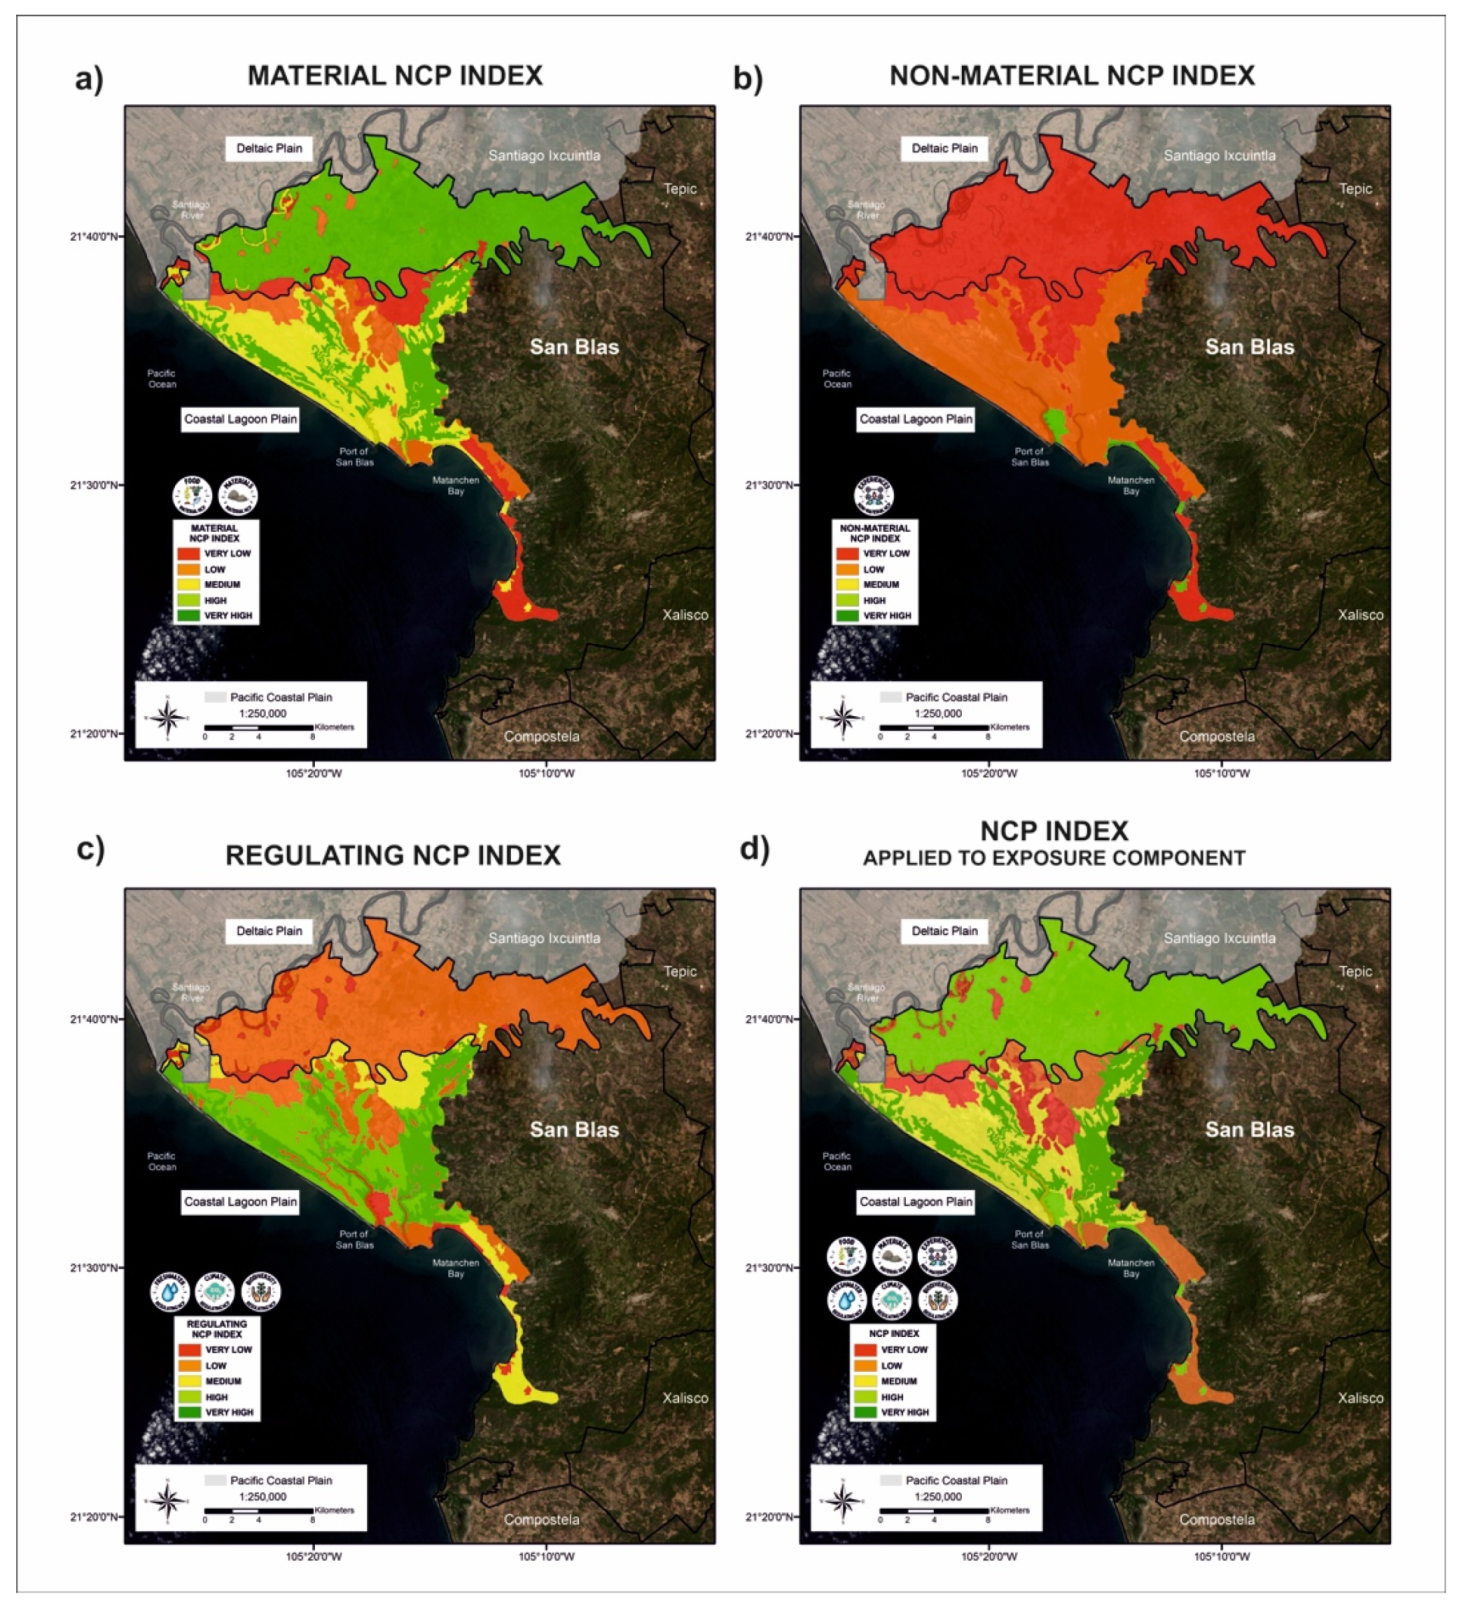
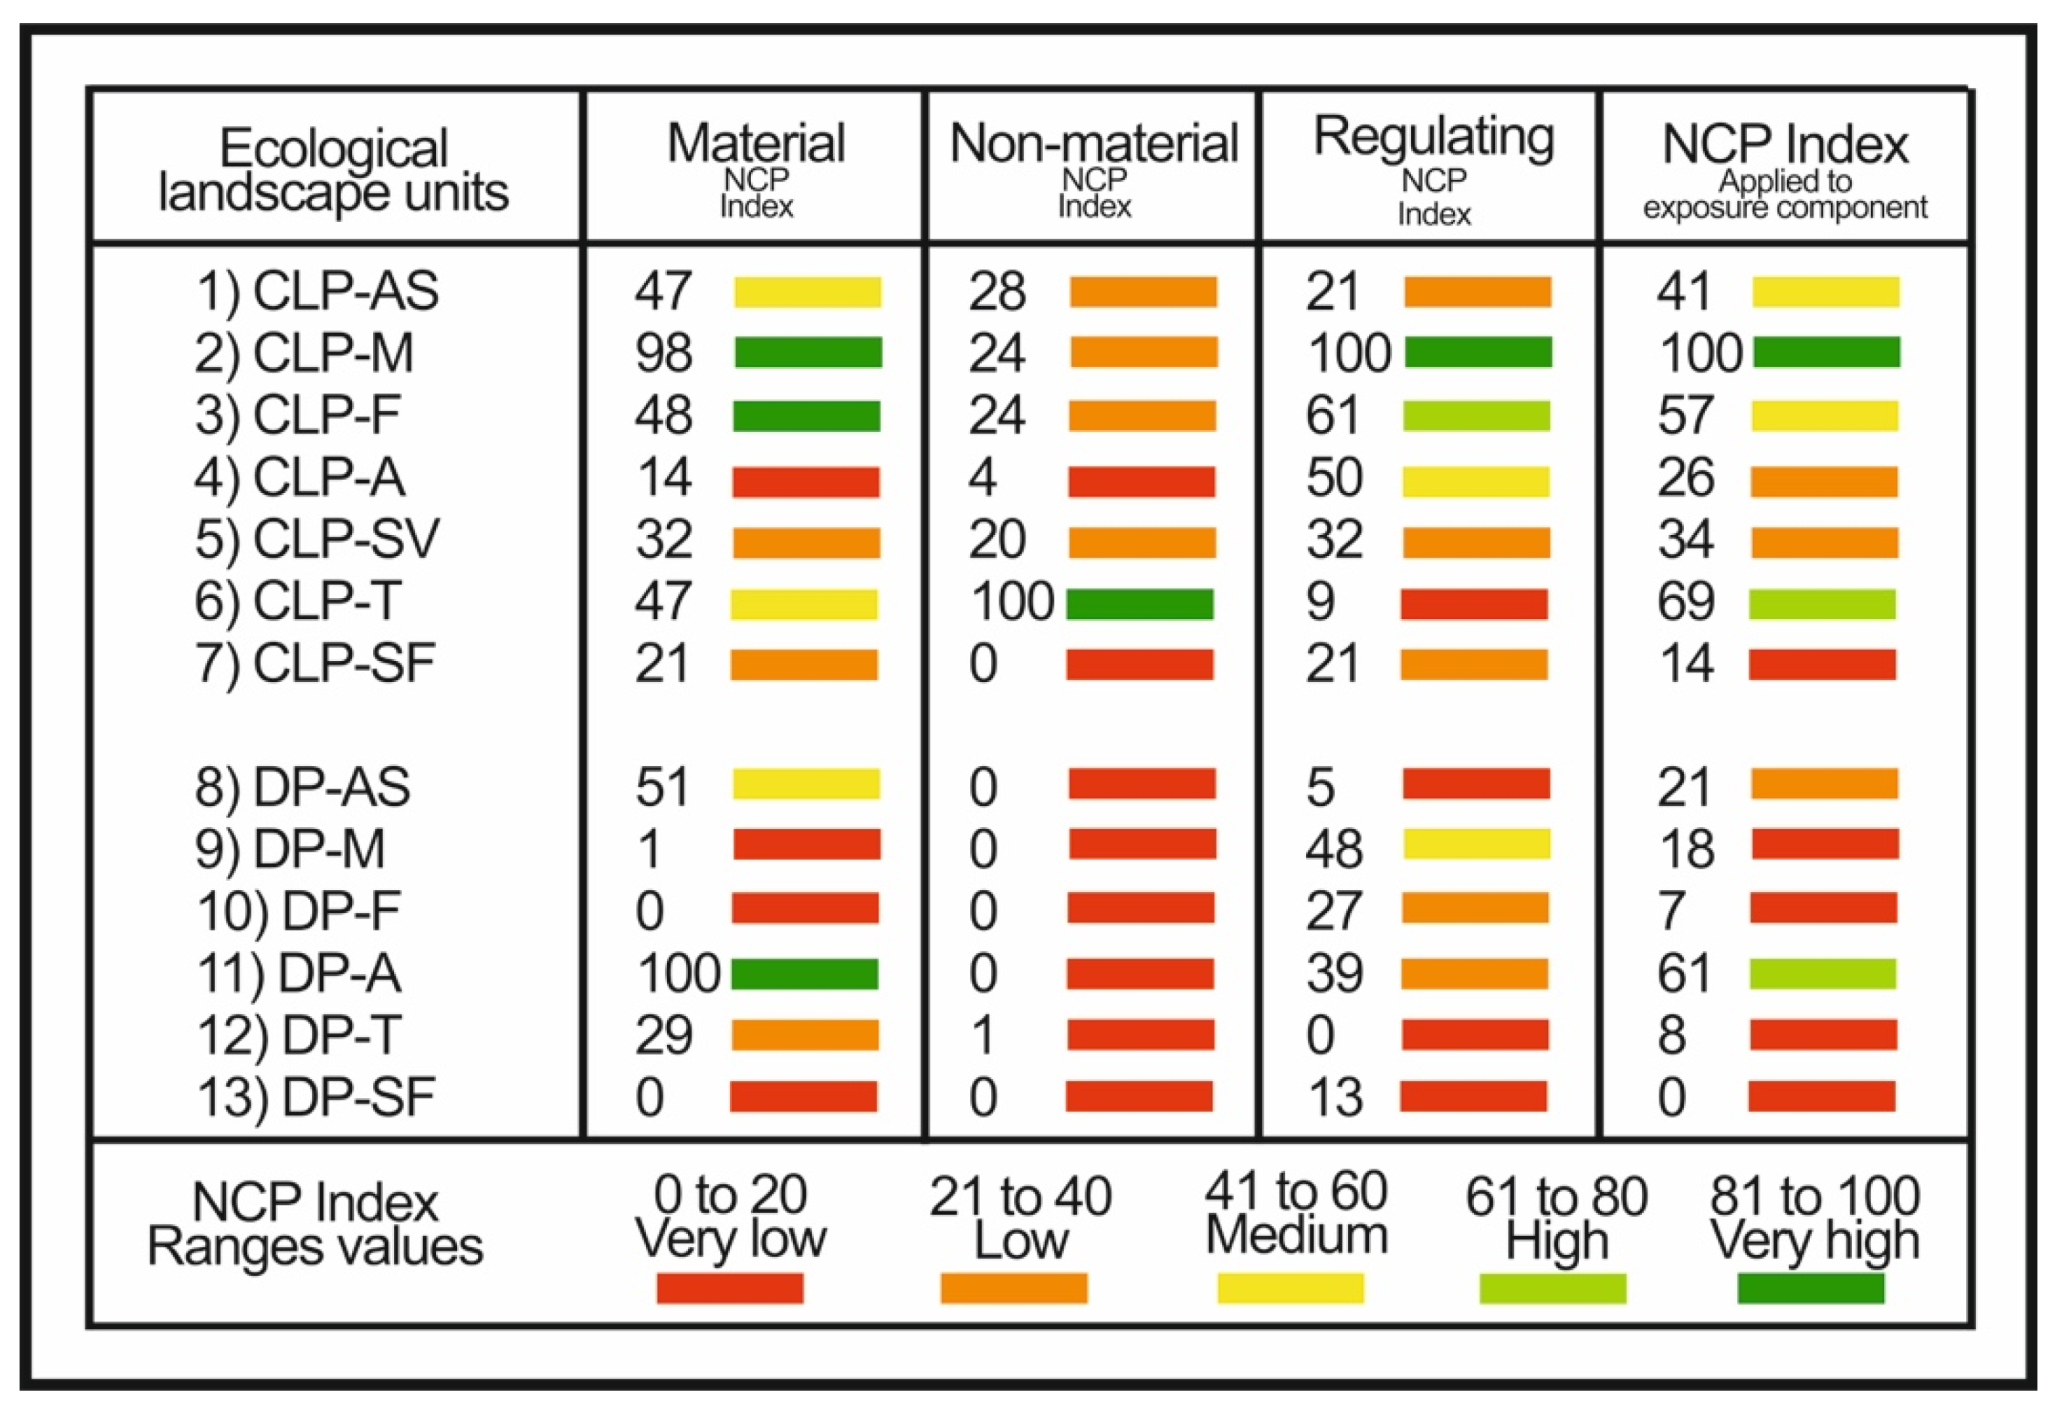
3.2. Analysis of NCP Index Board Groups

3.2.1. Material Contributions

As a result of the values obtained in the food and material categories, the DP-A and CLP-M units obtained the highest values in the material contributions index (Figure 5a). The DP-A unit led in food contributions, while the CLP-M unit obtained high values in both food and material contributions, due to fishing and white mangrove extraction. The results by indicator can be found in Supplementary Material Figure S1.

Food

Agricultural and livestock production in the area is concentrated in the DP-A unit. According to the data (average 2015–2019), it is estimated that 57,884.5 tons of agricultural food are produced annually in the unit, mostly pasture and forage grains (55.4%), mango (23%), rice (7.2%), beans (6.3%), banana (5.1%), and to a lesser extent, corn (1.2%) and tobacco (0.7%). There are 2270.1 tons of livestock production annually, mostly cattle meat (65.3%), pork (20.8%), and poultry (12.4%).
The CLP-M, CLP-AS, and CLP-F units were associated with fish extraction. Most of the commercial species extracted depend on coastal lagoons and mangroves [48]. According to the data (average 2015–2019), it is estimated that 23,658.2 tons of live weight of marine species for consumption are extracted annually in the port of San Blas. More than 40 species of fish (64.6%) are present, mostly red snapper (Lutjanus peru), catfish (Ictalurus punctatus), Mexican lookdown (Selene brevoortii), silvergrey grunt (Anisotremus caesius), croaker fish (Menticirrhus undulatus), pacific porgy (Calamus brachysomus), Mexican barracuda (Sphyraena ensis), and black snook (Centropomus nigrescens). Twenty one species of sharks (17.2%) are present, mostly scalloped hammerhead (Sphyrna lewini) and silky shark (Carcharhinus falciformis). There are mollusks such as clams and oysters (10.5%) and estuary and high seas shrimp (7.2%), as well as other species in smaller volumes, such as rays and lobsters (0.5%).

Materials

Units CLP-M, CLP-T, and DP-AS obtained the highest values for their contributions of forest extraction, land for recreation and housing, and stone materials, respectively.
Under the guidelines of a sustainable forest management program [49], approximately 15% of the CLP-M unit could be an extraction zone for white mangrove (L. racemosa), the only species of mangrove that can be extracted according to Mexican regulations. Of this area, 10.05 m 3 / ha could be destined for cutting. However, there is currently no forest management program, so cutting permits are limited to 1.9 m 3 / ha . White mangrove wood is used in the construction of ramadas for restaurants and hotels, for tobacco drying sheds, and as fuel or firewood.
The CLP-T unit was found to concentrate 58.1% of the recreational and housing land in the study area. This unit includes the municipal capital (San Blas) and coastal communities (Aticama, Bahía de Matanchén, and Santa Cruz), which are part of the Riviera Nayarit tourism corridor [50]. These communities are home to 51.3% of the habitants of the area, and 42% of the total population of the municipality. Therefore, they together provide the services of assistance and social security of the study area, such as hospitals, schools, transportation, and supplies. In addition, being a tourist area, this is one of the main spaces of mercantile exchange for agricultural, livestock, aquaculture, and fisheries in the region.
The DP-AS unit obtained the largest contribution from stone materials, including extraction of sand and gravel from the riverbanks of the El Palillo river. According to the data records, 13,066.4 tons of material have been extracted annually since 2006.

3.2.2. Non-Material Contributions

Experiences

A total of 257 photos were analyzed. Results by indicator and examples of photos by class can be found in Supplementary Material Figure S2. The majority of the photos represented landscape appreciation (40.6%), followed by nature appreciation (17%), social recreation (15.1%), and monuments (11.8%). Gastronomy, recreational activities, and research and education represented less than 5%. Artistic expressions and appreciation, living cultural heritage, and religious or spiritual activities were not shown in the pictures analyzed.
According to the results of the index of non-material contributions (Figure 5b), the CLP-T unit had the highest value, leading in the experiences in gastronomy, monuments, landscape appreciation, and social recreation. The landscape appreciation category prevailed, with 41.3% of the records, most of which were associated with tourist beach areas. This result is related to the characteristics of the unit, which is a tourist area with restaurant services and infrastructure for social recreation facing the sea, in addition to being an historic port with national heritage monuments [50].
With lower values, the CLP-AS, CLP-M, and CLP-F units led the classes of appreciation of nature and recreational activities. The first was represented mostly by photographs of crocodiles and different species of birds and insects. The second was represented by fishing and boating activities. The three units also obtained records of the landscape appreciation experience, with photographs in convergence between them. Most of the photos referred to the area of La Tovara, a group of canals and coastal lagoons accessible by tourist boats, catalogued by the National Commission of Natural Protected Areas (CONANP) as a Ramsar site [51]. Although mangrove cover is one of the areas that most attracts tourists for ecotourism activities, it is also the cover that is most impacted by them [20].
Units CLP-SV, CLP-A, and DP-T had the lowest values of the index, with contributions in appreciation of the landscape, appreciation of nature, and gastronomy, respectively. No records of non-material contributions were obtained in the rest of the units.
It should be noted that the photos analyzed were a sample of those published on Instagram between 2015 and 2019, with most posted by visitors. Therefore, the experiences obtained are associated with tourism activities and biased toward users of this social network, who are mostly young people [39]. For a more complex understanding of non-material contributions, we suggest repeating the method using more precise hashtags to extract a larger number of published photographs in different social networks and adding other categories for its analysis. Thus, minimizing the bias of tourism activities could be accomplished by including information from social networks such as Facebook, which is more frequently used for middle-aged adults to share daily life activities. In this way, it is possible to perform a punctual analysis of people’s lived experiences by age and period (e.g., wet and dry season).

3.2.3. Regulating Contributions

The CLP-M unit, and the CLP-F unit to a lesser extent, proved to be the units with the highest regulatory contributions (Figure 5c). These units obtained the highest values in the categories of freshwater, climate, and biodiversity. It should be noted that due to their characteristics, the two units depend on each other to make regulatory contributions; therefore, the impact on one has repercussions on the contributions generated in both [20]. Results by indicator and examples can be found in Supplementary Material Figure S3.

Freshwater

The CLP-M and DP-M units obtained the highest values in contributions to freshwater infiltration and treatment capacity, followed by the CLP-F and DP-F units, as they have similar characteristics.
As a result of the estimation of freshwater infiltration capacity, we determined that, based on the mean annual precipitation of the study area (1325 mm), 4.4% infiltrates, 79.2% runs off or is retained superficially, and 16.4% evaporates. In accordance with their soil type and cover characteristics, the units responsible for infiltration were secondary vegetation cover and agricultural use in the greatest proportion, followed by floodplains and mangroves. Although there is some contribution, aquatic surfaces were excluded from the estimate, because they are storage areas. Towns and shrimp farms were also excluded, because they are transformed surfaces.
Units CLP-A and CLP-SV obtained the highest contribution values, infiltrating 7.3% and 5.1% of the annual precipitation per year (equivalent to 3.2 and 0.6 million liters per year per unit). However, by extension, the DP-A and CLP-F units had the highest contribution, infiltrating 3.8% and 5% of the annual precipitation, respectively (8.3 and 4.3 million liters per year), followed by the CLP-M unit, infiltrating 2.4% of the precipitation (1.7 million liters per year).
As a result of the estimation of wastewater treatment capacity, we estimated that 55.3 L/s of wastewater is generated in the area (0.002 L/s per habitant). More than half, 31.1 L/s, is generated in the CLP-T unit, where the population and tourist activity is concentrated (the tourist activity population was not considered in the calculation). The remainder, 24.2 L/s, is in the DP-T unit, as a result of rural populations with primary activities.
According to the reference information [52], there are two treatment plants that attend to 80% of the wastewater generated in the CLP-T unit. However, this is old infrastructure that requires rehabilitation, and its actual operation is unknown. Assuming that the treatment plants function correctly, the estuarine ecosystem units would be assimilating 27.3 L/s of wastewater, about 0.01 L/s/ha. The CLP-M and CLP-F units had the greatest contribution by extension, and to a lesser proportion, the DP-M and DP-F units. The results should be considered as an estimate, because it is likely that the estuarine ecosystem units are not able to process the total wastewater. Especially in the area in front of the coastline in the CLP-T unit, where most of the houses and buildings use septic systems, some of them poorly maintained, wastewater could flow directly into the sea.

Climate

Flood marshes, estuaries, coastal lagoons and mangrove cover are known as blue carbon reservoirs, for their capacity to convert and store atmospheric carbon dioxide in soil and vegetation biomass. According to the reference research [32,33,35], in these areas of the San Blas Coastal Plain, between 40 and 160 tons of carbon per hectare are sequestered in the soil (varying according to the depth of the profile), and around 490 tons of carbon per hectare are stored in the biomass of mangrove cover. This value is higher than the general estimate for mangroves in Mexico [53].
The rest of the coastal plain in agricultural use also plays a role in soil carbon storage. According to Murray et al. [34], agricultural soil stores between 25 and 120 tons of carbon per hectare (this may vary according to profile depth and crop). However, this cannot be considered carbon sequestration, because the carbon storage is not long term due to the fact that most of the crops in the area are rotational. For this reason, agricultural use units, towns, and shrimp farms were excluded from the indicator.
Based on the reference studies, the CLP-M unit was the unit with the greatest contribution to climate regulation, with an estimated 6.6 million tons of carbon stored (1235.5 MgC ha); 92% in biomass, and 8% in soil. In second place was the CLP-F unit, with an estimated 890 thousand tons of carbon stored (152.7 MgC ha); 62% in biomass, and 38% in soil. Due to their territorial extension, the DP-M, CLP-SV, and DP-F units also had around 240,000, 42,000, and 20,000 tons of carbon stored, respectively.

Biodiversity

To calculate the contribution, we used the estimated values at the national level of the index of ecological integrity (IEE) [37,38]. This index is an approximation of the state of terrestrial biodiversity of ecosystems. It is calculated by evaluating the anthropogenic impacts on the habitats of top predators. The presence of these species indicates that the necessary conditions exist to maintain the trophic chain, and with it, the ecological processes. Therefore, the degree of conservation of their habitats is used as an indirect measure of the level of biodiversity conservation in a territory.
The CLP-M unit obtained the highest value, because it includes extensive, original, and conserved vegetation cover, where the habitats of top predators such as the river crocodile (Crocodylus acutus) and the jaguar (Panthera onca) are maintained. Unit CLP-F also had a high value, for its proximity and similarity to CLP-M; however, it is fragmented by aquaculture ponds.

3.3. Analysis of the NCP Index Describing the Exposure Component

The results obtained from the material, non-material, and regulatory contribution indices were integrated into a total index of nature’s contributions to people (Figure 5d), assuming that the units with the highest value of contributions are those on which most of the region’s daily subsistence, economic, and recreational activities depend. Therefore, the impact of climate change on these units would have greater repercussions on the human population than the impact on the units with lower contribution values. Thus, the total contribution index is a way of prioritizing the exposure of geographic landscape units to climate change, based on the direct impact on human communities (Figure 6).
According to the results of the sum of material, non-material, and regulating NCP indexes, the unit with the highest exposure value was the CLP-M unit, which obtained a very high value for material contributions in extraction for fishing and forestry, and regulatory contributions for the quality and availability of fresh water, carbon storage, and the maintenance of biodiversity.
Next, the DP-A unit obtained a high exposure value for material contribution in agricultural and livestock production, as did unit CLP-T, for material contribution in land for recreation and housing and non-material contributions for experiences, with both contributions associated with tourism activity and high population.
The CLP-AS and CLP-F units had a medium exposure value for contributions to fish extraction, regulation of freshwater quality and availability, and maintenance of biodiversity. These units share characteristics with the CLP-M unit, functioning as support and connection units. Therefore, impacts on one of these units indirectly affect the contributions of all three.
Units CLP-A and CLP-SV obtained low exposure values because they are transformed units and are smaller in extension than ones previously mentioned. In the first, material contributions from agricultural and livestock production were concentrated, and in the second, carbon storage.
The rest of the units had the lowest exposure values, given their low contributions. Units DP-AS, DP-M, and DP-F, due to their reduced extension, obtained low contribution values in comparison with similar units of the lagoon plain. In the case of the DP-T, CLP-SF, and DP-SF units, the low values were due to the fact that their contribution was focused on a single contribution, land for recreation and housing or aquaculture production.
We want to clarify that the exposure component does not mean that a geographic unit is more or less exposed to climate change because of its location, use, or coverage characteristics. For the purpose of this research, based on vulnerability theory and knowing that it implies a social connotation, the exposure component determines which units are more important for people’s livelihoods; therefore, the impact of climate change on these units (whatever it may be) will have a greater impact on people.
The impact of climate change on geographic units is derived from the location and other characteristics of the units and differs according to the hazards in possible future climate scenarios. This issue is usually studied in the sensitivity component of vulnerability studies or through risk theory [6]. For example, according to IPCC scenario data [1] units located on the coastline could be impacted by climate change due to sea level rise, units located on river banks could be impacted by flooding from torrential rains, and a possible increase in temperature and dry months could have a strong impact on agricultural use units and other vegetation cover, including species distribution in the mangrove forest. Therefore, this type of analysis is complex, first discovering what threats could impact each unit in the study area and then exploring what that impact might entail.
In this sense, to enrich our research, we suggest addressing some of these questions in a non-quantitative way. This might involve exploring territorial prospective methods, such as consulting participatory stakeholders, to explore, in context of climate change, the probable future scenarios of the study area, the threats that could derive from each scenario, and how and which geographic units would be affected. Thus, the exposure component would prioritize geographic units in terms of importance for people and in terms of potential climate change impacts, and could function as a territorial planning tool without conducting a full vulnerability study.
Summarizing the results of the case study, we found that the units with mangrove cover had the highest number of contributions. Therefore, they are the units with the highest exposure value to climate change; the impact on them would derive in a direct impact on human subsistence. However, we also found that the units with agricultural use obtained a high value of food contribution, as well as the units with towns used for contribution in housing and recreation space (specifically, the tourist activity towns located on the coastline).
In this sense, we discussed which is more important: a unit with a diversity of contributions, or a unit with a high amount of a single contribution. The NCP index was constructed by assigning equal weight to each indicator and integrating each indicator into a simple summation. Therefore, the index had no prioritization. However, thinking about territorial planning in the context of climate change, which unit should be prioritized: the unit diversified in contributions or the one specialized in a single contribution? This question has been discussed in other studies where the NCP has been applied. In these, it is mentioned that the prioritization of contributions depends on the users and their objectives, and there is the hope that these are aligned with sustainable development.
For planning and decision making, it is important to prioritize. Previously, Sanchéz-Quinto et al. [54] proposed a DPSIR (Drivers, Pressures-State-Impact-Response) analysis, which includes information on beneficiaries and stakeholders, as well as the identification of problems and stressors in the maintenance of ecosystem services. Subsequently, based on this diagnosis, a valuation of contributions based on the opinion of users, main stakeholders, experts, and decision makers, could be carried out, as proposed by Pascual et al. [55], applying multicriteria decision methods. In this way, a democratic valuation is made based on the preferences and objectives of the users for the conservation or use of nature’s contributions, taking into account the problems that would limit the continuity of the contributions. We suggest for future lines of research to propose methods of prioritization of contributions in the context of climate change, so that they remain allied with vulnerability studies.
According to the results of the case study, and prioritizing the diversity of contributions, the CLP-M and CLP-F units are the most important (see comparative graph in Supplementary Material Figure S4). As has been studied, mangrove covers and their associated landscapes, such as coastal lagoons and flood marshes, maintain a close association, integrating their contributions and the impacts on them [20,56]. Our research was limited to being a first approach to the analysis of the contributions of these landscapes. It is suggested to analyze other contributions, such as coastal protection against erosion, floods, storms, and other hydrometeorological phenomena; climate protection by maintaining surface temperature; and regulatory contributions associated with biological diversity, such as pollinators and trophic chains, which maintain agricultural and fishing production. In addition, other contributions associated with species conservation in landscapes, such as biological connectivity, edge effect, and habit fragmentation, should be considered [56].
It is well known that mangrove ecosystems are among the most resilient to changes in climate, but not to human action [20]. Mangrove cover is being lost due to land use change actions. Flooded marsh areas are the first to be transformed due to urbanization, agriculture, livestock, and aquaculture [56]. In a reciprocal effect, this impacts the functioning of the mangrove ecosystem, and thus its contributions to people.
Specifically, in Mexico, land use change is caused by agricultural expansion and aquaculture [17,19,20]. This could be associated with two facts. The contributions of agriculture are visible, tangible, controllable, and exchangeable for a monetary value, which generates socioeconomic security for people. On the other hand, the contributions of mangroves and associated landscapes are intangible and invisible, and therefore incomprehensible to people, in addition to the fact that they cannot be controlled or directly exchanged for a monetary value, which generates insecurity and disinterest. However, there are studies that demonstrate the high economic value of mangroves, for example, Aburto-Oropeza et al. [57].
These facts are not fortuitous. Since the 1940s, after the agrarian reform, Mexico has maintained a national policy of extension agriculture [50]. Although times have changed, the extractive culture has prevailed, and with it the current policies focused on supporting the agricultural sector. In the annual federal budget, Mexico assigns to the Agriculture and Rural Development sector twice the amount of money as the Environment and Natural Resources sector [58]. We speculate that more government funds would be assigned to agriculture in the case of a natural disaster, such as damage insurance and credit for reactivation, than for mangrove restoration. Kugamai et al. [59] estimate that Mexico invests in mangrove protection less than one third of the monetary value that mangroves contribute to society in terms of climate protection, and only one fifth in terms of carbon stocks. With these policies, how will we preserve the contributions of mangroves to people in response to the challenges of climate change?
If the answer does not come from the government, it will have to come from the private sector. For example, carbon credits have been proposed as a way to make visible and exchange environmental services. For mangrove ecosystems, these are known as blue carbon credits, and they are related to climate protection by carbon sequestration [60]. While this model is a way to finance the conservation of mangrove-associated landscapes, it has also been questioned for responding to the logic of extractive capitalism, because it allows industries to pay for pollution rights, justified by supporting conservation [61].
In the same direction, one of the most promising models recently proposed by the United Nations Environment Programme (UNEP) is Ecosystem-based Adaptation (EbA) [62]. EbA approach is based on prioritizing ecosystems that provide ecosystem services to protect against climate change, thus reducing vulnerability and building resilience in human communities. For example, the model prioritizes the protection of the mangrove forest because it provides protection against storms and floods in coastal communities. The idea is to finance the conservation of these protective ecosystems with the money that could have been used to build protective infrastructure. Although EbA has also been strongly criticized for being a human-centered idea that ignores the intrinsic value of nature [63], for the moment, it is the only globally agreed-upon approach involving a common currency to prioritize the conservation of natural land cover.
Nevertheless, according to the results of the case study, agriculture is as important as the mangrove units for its contributions. So, how do we prioritize between them? Which unit is more vulnerable? We should remember that exposure is only the first component of vulnerability studies. It is necessary to analyze the sensitivity and adaptive capacity components to define which of the landscape units is more vulnerable, and thus decide on its management and conservation.

4. Considerations, Limitations and Final Conclusions

The experience of the application of NCP analysis in the exposure component of vulnerability studies on geographic landscapes to climate change highlights three main advantages:
(1)
It describes the elements of the landscape units based on anthropic contributions/uses, based on the theory of ecosystem services analysis and respecting the complexity of the geographic landscape. The surface magnitude of the landscape units being the spatial limit but not the absolute value of the exposure indicator, as criticised in other research [11].
(2)
It prioritizes the exposure of the units in terms of these uses, and consequently, of the direct impact of climate change on human activities. Following the comments of Rodríguez [8], since vulnerability and geographic units are the product of a social construction, identifying the landscape units with the highest NCP is conducive to seeking actions for their conservation in order to maintain the survival of humans.
(3)
It focuses the vulnerability study on proposing adaptation measures based on the idea of conservation rather than compensation, for example, nature-based adaptation strategies aimed at conserving land covers that maintain ecosystems and contributions. These solutions are translated into public policies to reduce vulnerability to climate change and are aligned with the strategies in the international discourse of the UNEP. Research suggests that the EbA approach should be implemented for the sustainable conservation of Mexican coasts [20].
It should be clarified that the application of the NCP approach in the exposure component does not mean result in a vulnerability assessment of ecosystem services. To do so, it would be necessary to carry out specific vulnerability assessments for each individual contribution, and not as a whole, as was proposed in this research. The objective of using the NCP analysis was to situate the ecosystem services/contributions as key determinants of the socio-environmental exposure of the geographic landscape units, with these units as the study subject of analysis for vulnerability to climate change.
Consequently, the application of the NCP analysis is a descriptive tool; it involved an estimation based on the spatial extent of each landscape unit and did not reflect the quality of the contributions. We suggest that future research should seek methods to assess the quality of contributions as well as their quantity.
Being a complex approach, the main limitation was to obtain the necessary information to integrate all the categories of contributions provided by the initial NCP model. We were only able to estimate six of the 18 initial contributions, focusing on positive contributions and not considering negative contributions. This is a recurring problem in applying the approach [25,26].
In this regard, another limitation was the data used to estimate the contributions. The indicators proposed in this research were calculated with data between 2010 and 2019, justified by the fact that the regionalization was based on a land cover and land use map of 2019. However, the inconsistency of data and the variation of dates cast doubt on the quality of the results. Therefore, our research should be taken as an exercise that exemplifies the use of the NCP approach in vulnerability studies, and as a first approximation of the contributions provided by the landscape units in the case study.
We would like to mention two more reflections on application of the NCP analysis in the exposure component. First, it is an approach that may not work in all areas. Its application is more feasible in areas with a diversity of landscapes, such as rural and coastal zones, than in homogeneous or urban areas; the key to solving this problem resides in the process to delimit landscape units.
Second, the NCP approach may have limitations for use in climate policy; for international financing for climate action, it is more appropriate to use the monetary approach of ecosystem services [64]. However, in recent years, international policy has been changing, and it is the responsibility of academic researchers to encourage proposals to match ecosystem services and international funding interests, based on the idea of no return. This is why we defend the NCP approach, since it assumes that there is no monetary value that equals the contributions of nature to people. Therefore, there will be no monetary value that can compensate for the impact of climate change on nature, knowing that climate change derives from human action.
Our research aims to be a contribution in the area of natural resource management. We hope that it can be taken as an example to demonstrate that it is possible to implement the NCP approach in the exposure component of vulnerability studies of geographic landscapes. We hope that with this, vulnerability studies can lead to long-term sustainable nature-based adaptation solutions, and not short-term actions based on infrastructure or ecosystem modification, as has been noted in the research [11].
Finally, as a result of the case study, we would like to emphasize the importance of mangrove, wetlands, and floodplain landscapes in coastal zones, for the contributions that they provide to human communities. Although they are some of the most resilient ecosystems to climate variations, we are losing them due to land-use change for agricultural and aquaculture activities, especially shrimp farming. It is necessary to take planning measures to ensure the existence of these landscapes, as they will be the only protectors of the Mexican coasts against climate change.

Supplementary Materials

The following supporting information can be downloaded at: https://www.mdpi.com/article/10.3390/su14074200/s1, Refs. [65,66,67,68,69,70,71], Figure S1: Data of Material NCP (food and materials) by ecological landscape unit; Figure S2: Data of Non-material NCP (experiences) by ecological landscape unit; Figure S3: Data of Regulating NCP (freshwater, climate and biodiversity) by ecological landscape unit; Figure S4: Comparative graph of the diversity and total sum of contributions by ecological landscape unit.

Author Contributions

Conceptualization, A.N.G., F.M.C.G., E.C.-G.; contribution to vulnerability knowledge, F.M.C.G., O.N.G., S.M.F.; contribution to ecosystem services knowledge, R.M.C.-D., E.C.-G., J.T.L.; general methodology, A.N.G.; regionalization methodology, O.N.G., J.T.L.; indicators design, A.N.G., F.M.C.G., R.M.C.-D., S.M.F., E.C.-G., J.T.L.; software, A.N.G., F.M.C.G., O.N.G.; resources and Data, A.N.G., F.M.C.G., O.N.G., R.M.C.-D., S.M.F., E.C.-G., J.T.L.; data analysis, A.N.G., F.M.C.G., O.N.G., R.M.C.-D., S.M.F., E.C.-G., J.T.L.; writing—original draft preparation, A.N.G.; figures design, A.N.G.; writing—review and editing, F.M.C.G., O.N.G., R.M.C.-D., S.M.F., E.C.-G., J.T.L. All authors have read and agreed to the published version of the manuscript.

Funding

This research received no external funding.

Data Availability Statement

Data are contained within the article or Supplementary Materials. Additional data presented in this study are available on request from the corresponding author.

Acknowledgments

This research is part of the doctoral thesis of student Areli Nájera Gónzalez, supported by a national scholarship from the National Council of Science and Technology of Mexico (CONACYT).

Conflicts of Interest

The authors declare no conflict of interest.

References

  1. Intergovernmental Panel on Climate Change (IPCC). AR5 Climate Change 2014: Impacts, Adaptation, and Vulnerability. Available online: https://www.ipcc.ch/report/ar5/wg2 (accessed on 16 January 2022).
  2. Füssel, H.M. Vulnerability: A generally applicable conceptual framework for climate change research. Glob. Environ. Chang. 2007, 17, 155–167. [Google Scholar] [CrossRef]
  3. Füssel, H.M.; Klein, R.J.T. Climate change vulnerability assessments an evolution of conceptual thinking. Clim. Chang. 2006, 75, 301–329. [Google Scholar] [CrossRef]
  4. Gallopín, G.C. Linkages between vulnerability, resilience, and adaptive capacity. Glob. Environ. Chang. 2006, 16, 293–303. [Google Scholar] [CrossRef]
  5. Tonmoy, F.N.; El-Zein, A.; Hinkel, J. Assessment of vulnerability to climate change using indicators: A meta-analysis of the literature. WIREs Clim. Chang. 2014, 5, 775–792. [Google Scholar] [CrossRef] [Green Version]
  6. Nájera, A.; Carrillo, F.M. Vulnerability assessment studies on climate change: A review from the research in México. Atmósfera 2022, 35, 179–196. [Google Scholar] [CrossRef]
  7. Coy, M. Los estudios de riesgo y de la vulnerabilidad desde la geografía humana. Su relevancia para América Latina. Población Soc. 2010, 17, 9–28. Available online: https://www.redalyc.org/pdf/3869/386939743002.pdf (accessed on 16 January 2022).
  8. Rodríguez, J.M. El paisaje geográfico en la gestión de desastres. Aportaciones y limitaciones. Rev. Col. San Luis 2020, 10, 1–28. [Google Scholar] [CrossRef]
  9. Bocco, G.; Mendoza, M.; Priego, Á.; Burgos, A. La Cartografía de los Sistemas Naturales Como Base Geográfica Para la Planeación Territorial. Una Revisión Bibliográfica; INE-SEMARNAT: Mexico City, Mexico, 2009; ISBN 978-968-817-920-8. [Google Scholar]
  10. Bertrand, G.; Bertrand, C. Geografía del Medio Ambiente. El Sistema GTP: Geosistema, Territorio y Paisaje; UGR: Grenada, Spain, 2006; ISBN 978-843-384-537-5. [Google Scholar]
  11. Cárdenas, M.F.; Tobón, C. Evaluación de la vulnerabilidad biofísica de los servicios ecosistémicos ante el cambio climático: Una aproximación conceptual y metodológica. Gestión Ambiente 2016, 19, 163–178. Available online: https://revistas.unal.edu.co/index.php/gestion/article/view/54383 (accessed on 16 January 2022).
  12. Díaz, S.; Pascual, U.; Stenseke, M.; Martín-López, B.; Watson, R.T.; Molnár, Z.; Hill, R.; Chan, K.M.A.; Baste, I.A.; Brauman, K.A.; et al. Assessing nature’s contributions to people. Science 2018, 359, 270–272. [Google Scholar] [CrossRef] [Green Version]
  13. Brauman, K.A.; Garibaldi, L.A.; Polasky, S.; Aumeeruddy-Thomas, Y.; Brancalion, P.H.S.; DeClerck, F.; Jacob, U.; Mastrangelo, E.; Nkongolo, N.V.; Palang, H.; et al. Global trends in nature’s contributions to people. Proc. Natl. Acad. Sci. USA 2020, 117, 32799–32805. [Google Scholar] [CrossRef]
  14. Instituto Nacional de Estadística y Geografía (INEGI). Serie cartográfica de Fisiografía. Escala 1:1 000 000. Available online: https://www.inegi.org.mx/temas/fisiografia/ (accessed on 16 January 2022).
  15. Bojórquez, I.; Nájera, O.; Hernández, A.; Flores, F.; González, A.; García, D.J.; Madueño, A. Particularidades de formación y principales suelos de la llanura costera norte del estado de Nayarit, México. Cultiv. Trop. 2006, 27, 19–24. Available online: https://www.redalyc.org/pdf/1932/193215912003.pdf (accessed on 16 January 2022).
  16. González, A.; Bojórquez, I.; Nájera, O.; García, J.D.; Madueño, A.; Flores, F. Regionalización ecológica de la llanura costera norte de Nayarit. Investig. Geográficas 2009, 69, 21–32. [Google Scholar] [CrossRef]
  17. De la Lanza, G.; Gómez, J.C.; Blanco, M.; Flores-Verdugo, F.; Hernández, S. Vulnerabilidad costera: Caso de estudio del sistema de humedales de Marismas Nacionales. In Cambio Climático en México: Un Enfoque Costero y Marino; Rivera, E., Azuz, I., Alpuche, L., Villalobos, G., Eds.; UACAM: Campeche, Mexico, 2010; pp. 205–230. ISBN 978-607-7887-19-5. [Google Scholar]
  18. Instituto Nacional de Estadística y Geografía (INEGI). Censo de Población y Vivienda 2010. Available online: https://www.inegi.org.mx/programas/ccpv/2010/ (accessed on 16 January 2022).
  19. Nájera, A.; Carrillo, F.M.; Morales, J.C.; Nájera, O. Cambio de cobertura y uso de suelo en llanura costera asociados a procesos antropogénicos: Caso San Blas, Nayarit. Madera Bosques 2021, 27, e2712104. [Google Scholar] [CrossRef]
  20. Carranza-Ortiz, G.; Gómez-Mendoza, L.; Caetano, E.; Infante, D. Vulnerability of human communities in Mexican mangrove ecosystems: An ecosystem-based adaptation approach. Investig. Geográficas 2018, 95, 1–18. [Google Scholar] [CrossRef]
  21. United States Geological Survey (USGS). Earth Explorer. Available online: https://earthexplorer.usgs.gov/ (accessed on 16 January 2022).
  22. García, A.; Muñoz, J. El Paisaje en el Ámbito de la Geografía; UNAM: Mexico City, Mexico, 2002; ISBN 968-36-9856-5. [Google Scholar]
  23. Herrera, J.A.; Bojórquez, I.; Hernández, A.; Can-Chulim, A. Paisajes geomorfoedafológicos y regularidades de distribución de suelos en San Blas, Nayarit, México. Rev. Bio Cienc. 2020, 7, 1–19. [Google Scholar] [CrossRef]
  24. Berlanga-Robles, C.; Ruiz-Luna, A. Evaluación de cambios en el paisaje y sus efectos sobre los humedales costeros del sistema estuarino de San Blas, Nayarit (México) por medio de análisis de imágenes Landsat. Cienc. Mar. 2006, 32, 523–538. [Google Scholar] [CrossRef] [Green Version]
  25. Chaplin-Kramer, R.; Sharp, R.P.; Weil, C.; Bennett, E.M.; Pascual, U.; Arkema, K.K.; Brauman, K.A.; Bryant, B.P.; Guerry, A.D.; Haddad, N.M.; et al. Global modeling of nature’s contributions to people. Science 2019, 366, 255–258. [Google Scholar] [CrossRef]
  26. Bondé, L.; Assis, J.C.; Benavides-Gordillo, S.; Canales-Gómez, E.; Fajardo, J.; Marrón-Becerra, A.; Noruega-Urbano, E.A.; Weidlich, E.W.A.; Ament, J.M. Scenario-modelling for the sustainable management of non-timber forest products in tropical ecosystems. Biota Neotrop. 2020, 20, e20190898. [Google Scholar] [CrossRef]
  27. Schuschny, A.; Soto, H. Guía Metodológica Diseño de Indicadores Compuestos Para el Desarrollo Sostenible; CEPAL: Santiago de Chile, Chile, 2009; Available online: https://www.bivica.org/file/view/id/2485 (accessed on 16 January 2022).
  28. Secretaria de Agricultura y Desarrollo Rural (SADER). Servicio Nacional de Información Agroalimentaria y Pesquera (SIAP). Available online: https://www.gob.mx/siap (accessed on 16 January 2022).
  29. Núñez, V.H. Determinación del uso de la Madera de Manglar: Impactos Socioambientales en el Ejido San Blas, Nayarit, México. Master’s Thesis, Universidad Autónoma de Nayarit, Tepic, Mexico, 2016. [Google Scholar]
  30. Comisión Nacional de Agua (CONAGUA). Registro Público de Derechos del Agua (REPDA). Available online: https://app.conagua.gob.mx/ConsultaRepda.aspx (accessed on 16 January 2022).
  31. Instituto Mexicano del Transporte (IMT). Red Nacional de Caminos. Available online: https://www.gob.mx/imt/acciones-y-programas/red-nacional-de-caminos (accessed on 16 January 2022).
  32. Valdés, E.; Valdez-Hernández, J.I.; Ordaz, V.M.; Gallardo, J.F.; Pérez, J.; Ayala, C. Evaluación del carbono orgánico en suelos de los manglares de Nayarit. Rev. Mex. Cienc. For. 2011, 2, 47–58. [Google Scholar] [CrossRef] [Green Version]
  33. Murray-Núñez, R.M.; Bojórquez, I.; Hernández, A.; García, J.D.; Madueño, A.; Bugarin, R.; Orozco, M.G. Perdida de carbono en suelos de la llanura costera de Nayarit, México. Rev. Bio Cienc. 2012, 1, 38–46. [Google Scholar] [CrossRef]
  34. Murray-Núñez, R.M.; Nájera, O.; Orozco, M.G.; Bojórquez, I. Cambios en carbono orgánico en suelos cambisoles, solonetz y arenosoles. Rev. Iberoam. Las Cienc. Biológicas Agropecu. 2015, 4, 22–40. Available online: https://www.ciba.org.mx/index.php/CIBA/article/view/31/94 (accessed on 16 January 2022).
  35. Rivera, M.Y. Reservas de Carbón en Biomasa Aérea del Bosque de Manglar. Master’s Thesis, Universidad Autónoma de Nayarit, Tepic, Mexico, 2015. [Google Scholar]
  36. Agraz-Hernández, C.M.; Chan-Keb, C.A.; Chávez-Barrera, J.; Osti-Sáenz, J.; Expósito-Díaz, G.; Alonso-Campos, V.A.; Muñiz-Salazar, R.; Ruiz-Fernández, A.C.; Pérez-Bernal, L.H.; Sánchez-Cabeza, J.A.; et al. Reserva de carbón en un ecosistema de manglar al norte de México: Cambios ambientales durante 35 años. Rev. Mex. Biodivers. 2020, 91, 1–19. [Google Scholar] [CrossRef]
  37. Comisión Nacional Para el Conocimiento y Uso de la Biodiversidad (CONABIO). Índice de Integridad Ecológica (IIE) Escala: 1:250000. Available online: http://magrat.mine.nu:8088/geonetwork/srv/api/records/a5d63dbc-4d3f-4aee-8728-adf9f507b6a9 (accessed on 16 January 2022).
  38. Mora, F. A Spatial Framework for Detecting Anthropogenic Impacts on Predator-Prey Interactions that Sustain Ecological Integrity in México. Ecol. Processes 2018, 7, 35. [Google Scholar] [CrossRef]
  39. Ruiz-Frau, A.; Ospina-Álvarez, A.; Villasante, S.; Pita, P.; Maya-Jariego, I.; De Juan, S. Using graph theory and social media data to assess cultural ecoystem services in coastal area: Method development and application. Ecosyst. Serv. 2020, 45, 101176. [Google Scholar] [CrossRef]
  40. Cohen, J. A coefficient of agreement of nominal scales. Educ. Pshychol. Meas. 1960, 20, 37–46. [Google Scholar] [CrossRef]
  41. Landis, J.R.; Koch, G.G. The measurement of observer agreement for categorical data. Biometrics 1977, 33, 159–174. [Google Scholar] [CrossRef] [Green Version]
  42. López, W.; Reynoso, R.; Castro, I.; Salinas, E.; Magdaleno, R. Capacidad de infiltración de la cuenca del río Cuxtepeques, Chiapas, México. Ing. Hidráulica Ambient. 2016, 37, 103–112. Available online: http://scielo.sld.cu/pdf/riha/v37n3/riha08316.pdf (accessed on 16 January 2022).
  43. Nájera, A.; Carrillo, F.M.; Nájera, O.; Chavéz-Dagostino, R.M. Caracterización climática y variabilidad de temperatura superficial de la llanura costera de Nayarit y su teleconexión con ENSO y PDO. Acta Univ. 2020, 30, 1–21. [Google Scholar] [CrossRef]
  44. Diario Oficial de la Federación. Norma Oficial Mexicana NOM-011-CNA-2000, Conservación del Recurso Agua- Que Estable las Especificaciones y el Método Para Determinar la Disponibilidad Media Anual de las Aguas Nacionales. Available online: https://www.dof.gob.mx/nota_detalle.php?codigo=734510&fecha=17/04/2002 (accessed on 16 January 2022).
  45. Lara-Domínguez, A.L.; Yáñez-Arancibia, A.; Seijo, J.C. Valuación económica de los servicios de los ecosistemas: Estudio de caso de los manglares en Campeche. In Aspectos Económicos Sobre la Biodiversidad de México; Benítez, H., Vega, E., Peña, A., Ávila, S., Eds.; CONABIO-SEMARNAP: Mexico City, Mexico, 1998; pp. 23–44. ISBN 970-9000-05-5. [Google Scholar]
  46. Comisión Nacional del Agua (CONAGUA). Manual de Agua Potable, Alcantarillado y Saneamiento. Datos Básicos Para Proyectos de Agua Potable y Alcantarillado; SEMARNAT: Mexico City, Mexico, 2019; ISBN 978-607-626-036-4. [Google Scholar]
  47. Comisión Nacional Para el Conocimiento y Uso de la Biodiversidad (CONABIO). Cuencas Hidrográficas de México. Available online: http://www.conabio.gob.mx/informacion/gis/ (accessed on 16 January 2022).
  48. Sanjurjo, E.; Welsh, S. Una descripción del valor de los bienes y servicios ambientales prestados por los manglares. Gac. Ecológica 2005, 7, 55–68. Available online: https://dialnet.unirioja.es/servlet/articulo?codigo=2881023 (accessed on 19 January 2022).
  49. Valdez-Hernández, J.I. Manejo forestal de un manglar al sur de Marismas Nacionales, Nayarit. Madera Bosques 2004, 10, 93–104. [Google Scholar] [CrossRef]
  50. García, L.; Camelo, J.C. San Blas, Nayarit; México. La Historia Económica del Puerto Mercante y Agricultor que se Convirtió en Destino Turístico (1768–2010); Eumed: Malaga, Spain, 2016; Available online: https://www.eumed.net/libros-gratis/2016/1520/index.htm (accessed on 16 January 2022).
  51. Comisión Nacional de Áreas Naturales Protegidas (CONANP). Sitios Ramsar. Available online: https://ramsar.conanp.gob.mx/index.php/sitios-ramsar/ (accessed on 16 January 2022).
  52. Comisión Nacional del Agua (CONAGUA). Inventario de Plantas Municipales de Potabilización y de Tratamiento de Aguas Residuales en Operación. Available online: https://www.gob.mx/conagua/documentos/inventario-de-plantas-municipales-de-potabilizacion-y-de-tratamiento-de-aguas-residuales-en-operacion (accessed on 16 January 2022).
  53. Herrera, J.A.; Camacho, A.; Pech, E.; Pech, M.; Ramírez, J.; Teutli, C. Carbon dynamics (stocks and fluxes) in mangroves of Mexico. Terra Lat. 2016, 34, 61–72. Available online: http://www.scielo.org.mx/scielo.php?script=sci_arttext&pid=S0187-57792016000100061 (accessed on 16 January 2022).
  54. Sánchez-Quinto, A.; Correa, J.; Zamboni, N.S.; Sanches, F.H.C.; Principe, S.C.; Viotto, E.E.; Casagranda, E.; da Veiga-Lima, F.A.; Possamai, B.; Faroni-Perez, L. Development of a conceptual framework for the management of biodiversity and ecosystem services in the Mexican Caribbean. Biota Neotrop. 2020, 20, e20190901. [Google Scholar] [CrossRef]
  55. Pascual, U.; Balvanera, P.; Díaz, S.; Pataki, G.; Roth, E.; Stenseke, M.; Watson, R.T.; Dessane, E.B.; Islar, M.; Kelemen, E.; et al. Valuating nature’s contributions to people: The IPBES approach. Curr. Opin. Environ. Sustain. 2017, 26–27, 7–16. [Google Scholar] [CrossRef] [Green Version]
  56. Ho, Y.-S.; Mukul, S.A. Publication Performance and Trends in Mangrove Forests: A Bibliometric Analysis. Sustainability 2021, 13, 12532. [Google Scholar] [CrossRef]
  57. Aburto-Oropeza, O.; Ezcurra, E.; Danemann, G.; Valdez, V.; Murray, J.; Sala, E. Mangroves in the Gulf of California increase fishery yields. Proc. Natl. Acad. Sci. USA 2008, 105, 10456–10459. [Google Scholar] [CrossRef] [Green Version]
  58. Guzmán, S.; Rodríguez, G.; Mejía, C. Análisis de Presupuesto Internacional y Nacional Público para Cambio Climático; Detusche Gesellschaft für Internationale Zusammenarbeit (GIZ): Bonn, Germany, 2018; Available online: https://iki-alliance.mx/wp-content/uploads/An%C3%A1lisis-de-Presupuesto-Internacional-y-Nacional-P%C3%BAblico-para-Cambio-Clim%C3%A1tico_VF171218.pdf (accessed on 20 January 2022).
  59. Kumagai, J.A.; Costa, M.T.; Ezcurra, E.; Aburto-Oropeza, O. Prioritizing mangrove conservation across Mexico to facilitate 2020 NDC ambition. Ambio 2020, 49, 1992–2002. [Google Scholar] [CrossRef]
  60. López-Toache, V.; Romero-Amado, J.; Toache-Berttolini, G.; García-Sánchez, S. Bonos de carbono: Financiarización del medioambiente en México. Estud. Soc. 2016, 25, 189–215. Available online: https://www.ciad.mx/estudiosociales/index.php/es/article/view/314 (accessed on 7 March 2022).
  61. Zeng, Y.; Friess, D.A.; Sarira, T.V.; Siman, K.; Koh, L.P. Global potential and limits of mangrove blue carbon for climate change mitigation. Curr. Biol. 2021, 31, 1737–1743.e3. [Google Scholar] [CrossRef]
  62. United Nations Environment Programme (UNEP). Ecosystem-Based Adaptation. Available online: https://www.unep.org/explore-topics/climate-action/what-we-do/climate-adaptation/ecosystem-based-adaptation (accessed on 7 March 2022).
  63. International Institute for Sustainable Development (IISD). Seeking Common Ground for climate, Biodiversity, and People: How to get the Debate on Nature-Based Solutions Right. Available online: https://www.iisd.org/articles/common-ground-nature?fbclid=IwAR2bkE4Zsefg22nh6doalHLtJ5SObcdgs_o6Me2O6ZZ9N-zdf2DcAU-7Row (accessed on 7 March 2022).
  64. Braat, L.C.; de Groot, R. The ecosystem services agenda: Bridging the worlds of natural science and economics, conservation and development, and public and private policy. Ecosyst. Serv. 2012, 1, 4–15. [Google Scholar] [CrossRef] [Green Version]
  65. Patty De La Cruz [@patriciadlcruzvillafuentes]. En San Blas Disfrutando un Platillo Especial de Camarones Empanizados de coco! #sanblasnayarit #food #delisioso #delicious. Available online: https://www.instagram.com/p/BapcnRanEBd/ (accessed on 24 October 2017).
  66. El Pato Hernandez [@elpatohernandezbarrera]. #sanblasnayarit. Available online: https://www.instagram.com/p/BMdXujzj9Gy/ (accessed on 6 November 2016).
  67. Hugo Alejandro García Murillo [@hgarmur]. San Blas, Nayarit, México #sanblas #sanblasnayarit #nayarit #mexico #nayaritenamora #sea #beach #playa. Available online: https://www.instagram.com/p/Bwn0znZJx5p/ (accessed on 24 April 2019).
  68. Roberto Zepeda [@djrobertzphoto]. Baby croc #sanblasnayarit #nayarit #sedetur #saboresdenayarit @natgeo @natgeotravel #crocodile #cocodrilo. Available online: https://www.instagram.com/p/-vU54yQt2v/ (accessed on 1 December 2015).
  69. Festival de Aves Migratorias [@fiamsanblas]. Jóvenes Voluntarios en su día de capacitación. #SomosPafiam #SanBlasNayarit #FestivalInternacionalDeAvesMigratorias. Available online: https://www.instagram.com/p/BL_oQACAah7/ (accessed on 25 October 2016).
  70. Francisco Chapa Kiko [kiko_chapa]. Sesión #SanBlas #Sanblasnayarit #Libre #water #mar #sea #Libre #sunset #palmeras #palmas. Available online: https://www.instagram.com/p/2r5ZgOmUp2/ (accessed on 15 May 2015).
  71. Muro SB [@muro_sb]. #sanblasnayarit. Available online: https://www.instagram.com/p/4an-h-LRt5/ (accessed on 27 June 2015).
Figure 1. Location of the case study: San Blas Coastal Plain. This is a fragment of the Pacific Coastal Plain in Mexico delimited within the municipality of San Blas in Nayarit. Own elaboration, using the physiographic map from INEGI [14], and a satellite image from May 2019 obtained from the United States Geological Survey (USGS) [21].
Sustainability 14 04200 g001
Figure 2. Indicators implemented to analyze NCP in geographic landscape ecological units.
Sustainability 14 04200 g002
Figure 3. Process of consolidating information from the three board groups of contributions in a total NCP index applied to the exposure component.
Sustainability 14 04200 g003
Figure 4. Location of landscape ecological units in the study area. The coastal lagoon plain landscape units are identified without borders, and the deltaic plain landscape units with dark borders.
Sustainability 14 04200 g004
Figure 5. (a) Index of material contributions (food and materials); (b) index of non-material contributions (experiences); (c) index of regulating contributions (freshwater, climate, and biodiversity); (d) total contributions index applied to the exposure component, understood as nature’s contributions to people who are exposed to climate change. The coastal lagoon plain landscape units are identified without borders, and the deltaic plain landscape units with dark borders.
Sustainability 14 04200 g005
Figure 6. Index contribution values.
Sustainability 14 04200 g006
Publisher’s Note: MDPI stays neutral with regard to jurisdictional claims in published maps and institutional affiliations.

