Article

A q-Rung Orthopair Fuzzy FUCOM Double Normalization-Based Multi-Aggregation Method for Healthcare Waste Treatment Method Selection

1
Department of Mathematics, Techno College of Engineering Agartala, Agartala 799004, India
2
Department of Mathematics, Government College Raigaon, Satna 485441, India
3
Department of Mathematics, Rajiv Gandhi National Institute of Youth Development, Sriperumbudur 602105, India
4
Department of Statistics & Operations Research, College of Sciences, King Saud University, Riyadh 11451, Saudi Arabia
5
Department of Economics, University of Molise, 86100 Campobasso, Italy
*
Author to whom correspondence should be addressed.
Sustainability 2022, 14(7), 4171; https://doi.org/10.3390/su14074171
Submission received: 25 January 2022 / Revised: 18 March 2022 / Accepted: 25 March 2022 / Published: 31 March 2022

Abstract

:
Healthcare waste (HCW) management is an intricate issue upon which numerous factors, such as technical, economic, environmental, and social factors, have an impact. A determination on the best treatment method for HCW management can be viewed as a challenging multi-criteria decision-making (MCDM) problem in which various options and evaluation criteria are considered. One critical concern when assessing HCW treatment (HCWT) methods is the representation and treatment of dubious data. In this paper, we present a q-rung orthopair fuzzy full consistency method double normalization-based multi-aggregation methodology called q-ROF-FUCOM-DNMA to solve MCDM problems with q-rung orthopair fuzzy information (q-ROFI). In the proposed approach, criteria weights are estimated through the full consistency method (FUCOM) and a ranking of the alternatives is obtained through the double-normalization-based multi-aggregation (DNMA) method with q-ROFI. A HCWT method assessment issue was considered in order to clarify the relevance of the proposed approach. Five HCWT methods, including chemical disinfection, microwave disinfection, incineration, autoclaving (steam sterilization), and reverse polymerization, were considered as alternatives. The results show that autoclaving (steam sterilization) is the most efficient HCWT method. Furthermore, we performed a sensitivity analysis to determine the stability of the proposed approach. Additionally, we compared the presented approach with existing methods.

1. Introduction

Due to rapid population growth and the increase in the number of healthcare facilities, the provision of safe and proper supervision of healthcare waste (HCW) has become a public health and ecological issue for healthcare organizations and municipalities [1]. Healthcare facilities exist to ensure human survival; however, the clinical waste produced in healthcare centers carries different microorganisms that could contaminate the natural environment (e.g., water, soil, and air) and spread disease to imperil human health [2,3]. According to the World Health Organization (WHO), “HCW [i]s any waste that is produced from the detection, treatment, or prevention of ailments in humans or animals” [4,5]. To adeptly separate hazardous from non-hazardous HCWs, precise protocols have been implemented by several developed and emerging nations. Non-hazardous wastes can be treated with municipal solid wastes (MSWs); however, hazardous HCWs need to be carefully treated and disposed of in isolation. Improper waste management can cause environmental pollution and numerous harmful diseases in human beings. Thus, choosing methods for the safe and effective treatment and disposal of HCW is essential for human well-being and the environment [6,7].
The HCW management process includes the collection of waste from medical/health-care centers, the selection of a treatment method, and the selection of a location for the disposal of the waste. Due to their major economic, environmental, and social impacts, the assessment of healthcare waste treatment (HCWT) methods, in terms of their effectiveness and appropriateness, is considered an open issue of considerable research interest [8]. With the purpose of choosing the most suitable medical waste treatment method, decision experts (DEs) consider several qualitative and quantitative criteria. Each treatment method has a different performance score for each assessment criterion. Nonetheless, no treatment method exists that is better than all other methods when considering all of the assessment criteria. Thus, the assessment of HCWT methods can be viewed a multi-criteria decision-making (MCDM) problem in which different attributes/factors are considered. Consequently, a methodology for the evaluation of HCWT methods that considers various conflicting criteria is desirable.
Several scholars have paid attention to HCW management practices. For instance, Dursun et al. [9,10] employed a fuzzy-logic-based decision-making framework to choose the best method for the disposal and treatment of HCW. Ozkan [11] examined the current state of HCW management in Turkey and selected the best treatment method from a set of treatment methods. Voudrias [6] employed an AHP model to assess five different methods for the treatment of infectious medical waste in terms of different criteria. Aung et al. [4] presented a procedure for the evaluation of the medical waste management arrangement in Myanmar. Recently, Yazdani et al. [12] assessed locations for the disposal of HCW using an integrated best–worst model (BWM) with interval rough numbers (IRNs). Mishra et al. [13] presented a model comprised of the complex proportional assessment (COPRAS) method and interval-valued intuitionistic fuzzy sets (IVIFSs) for selecting an appropriate safety and health evaluation facility (SHEH) in hazardous waste recycling organizations. Mishra et al. [14] presented a modified evaluation based on distance from the average solution (EDAS) method on intuitionistic fuzzy sets (IFSs) for the estimation of the best method for the disposal of HCW. Liu et al. [15] discussed and prioritized medical waste treatment methods using the Pythagorean fuzzy-logic-based combined compromise solution (CoCoSo) method. When using this method, it is first necessary to obtain the importance weights of the criteria to be considered in the selection of a waste disposal method and then rank the alternatives. To select an appropriate HCWT method, we need to consider more sustainability dimensions and criteria. In this study, we first use the full consistency method (FUCOM) in the q-rung orthopair fuzzy sets (q-ROFSs) environment to reduce the subjectivity in the decision-making procedure by determining the weights of the criteria in an environment characterized by uncertainty.
Due to imprecise information, ambiguous human observations, time constraints, and deficiencies in information, the selection and prioritization of appropriate HCWT method is a significant and uncertain MCDM problem faced by hospitals and medical centers. As the fact that the q-ROFSs have more operative capability than the IFSs and “Pythagorean fuzzy sets (PFSs)” to treat the ambiguity and imprecision occurred in various realistic MCDM issues. Due to this advantage, the paper is developed under q-ROFSs setting for the assessment of HCWT methods. In this study, the authors have extended the “double normalization-based multi-aggregation (DNMA)” method to select most appropriate HCWT method with “q-rung orthopair fuzzy information (q-ROFI)”. This research focuses on the combination of the FUCOM and DNMA methods on q-ROFSs called “q-rung orthopair fuzzy-full consistency method-double normalization-based multi-aggregation (q-ROF-FUCOM-DNMA)” methodology for the first time. The novel contributions are presented as follows:
  • An integrated q-ROF-FUCOM-DNMA methodology is developed for the evaluation of MCDM problems.
  • FUCOM is used to obtain the attributes’ weight for assessing the HCWT method.
  • To reveal the practicality and usefulness of q-ROF-FUCOM-DNMA approach, a case study of HCWT method selection is taken on q-ROFSs.
  • Sensitivity investigation and comparisons are made to certify the outcomes and display the advantage of the developed methodology.
The remaining paper is designed as follows: In Section 2, we present a brief literature review. In Section 3, we present some important and vital concepts of q-ROFSs. In Section 4, we develop an integrated q-ROF-FUCOM-DNMA approach. In Section 5, we discuss a case study of HCWT method selection to implement and polish the proposed method. Section 6 shows, with sensitivity, investigation, comparison, implication, and discussion related to the developed technique. In Section 7, we conclude the study and provide an outline of future works.

2. Literature Review

This section presents the ample review about the study.

2.1. q-Rung Orthopair Fuzzy Sets (q-ROFSs)

Due to indeterminacy of human thinking and increasing complexity of daily life problems, it is not possible for DEs to offer assessment information quantitatively or qualitatively through precise numerical values in several practical problems. To deal with this issue, Zadeh [16] firstly invented the notion of “fuzzy sets (FSs)” theory and widely applied for different purposes. As an extension of FSs, Atanassov [17] introduced the “intuitionistic fuzzy sets (IFSs)” theory to portray the vagueness in accordance with “belongingness grade (BG)” and “non-belongingness grade (NBG)”. Since IFSs was originated, copious authors have carried out in-depth studies [18,19,20,21,22]. It necessitates that the sum of BG and NBG should not exceed 1, and this limits its application in viable dynamic issues. Under this requirement, much complex assessment data cannot be portrayed as some decision makers may suggest some assessing criteria values that surpass the restriction. For instance, if the BG and the NBG of an assessing criterion value presented by a DE are 0.9 and 0.6, respectively, at that point the IFSs are not reasonable to be utilized for this sort of issue. Further, Yager [23] introduced the concept of PFSs, where a prominent condition of PFSs is that the squares addition of the BG and NBG is 1 . Consequently, PFSs can be employed to deal with various MCDM problems wherein IFSs cannot be utilized to manage such types of issues. In this way, PFSs are more preferable in articulating fuzzy data than IFSs. In view of the theory of PFSs, numerous broad studies have been carried out. For instance, Rani et al. [24] employed the divergence and entropy based “vlsekriterijumska optimizcija I kaompromisno resenje (VIKOR)” model to study the MCDM issues that has shown to be well fit to explain the “renewable energy resources (RESs)” selection in India. Alrasheedi et al. [25] gave a comprehensive model to assess suppliers in manufacturing sectors under PFSs.
The main flaws of IFSs and PFSs are that they cannot offer a wider space for preference elicitation due to their bounding constraint. To cope with the concern, Yager [26] established the notion of “q-rung orthopair fuzzy sets (q-ROFSs)” that satisfy that the qth powers sum of BG and NBG is 1 , where q 1 . When q = 1 and q = 2, the q-ROFSs are generated by the IFSs and PFSs, respectively. Therefore, it is evident that q-ROFSs are more elegant than the IFSs and PFSs. Due to the unique advantages of q-ROFSs, many scholars have focused their studies on q-ROFSs. For example, Peng et al. [27] originated a score function for “q-rung orthopair fuzzy numbers (q-ROFNs)”and employed for developing a novel algorithm using the “weighted distance-based approximation (WDBA)” method. Wang et al. [28] developed a modified “multi-attributive border approximation area comparison (MABAC)” approach on “q-rung orthopair fuzzy information (q-ROFI)” for treating the MCDM problems. Rani and Mishra [29] studied an extended “weighted aggregated sum product assessment (WASPAS)” approach with q-ROFSs for the evaluation of multi-criteria fuel technology selection. Mishra and Rani [30] provided a q-rung orthopair fuzzy-“additive ratio assessment (ARAS)” model using the entropy and discrimination measures for handling the sustainable recycling partner selection problem. Xin et al. [31] developed a framework using the “stepwise weight assessment ratio analysis (SWARA)” and the COPRAS approach to evaluate the challenges of sustainable supply chain 4.0 in a q-ROFSs setting. However, there are very few studies concerning the evaluation of multi-criteria HCWT method selection process under q-ROFSs environment.

2.2. FUCOM Method

In the literature, some popular procedures which are identical to the “analytic hierarchy process (AHP)” method [32] and the BWM [33] have been developed. According to the doctrines of comparisons in pairs of attributes, and the outcomes validation by defining deviation from the utmost consistency, the FUCOM [34] was established. The main advantages of the FUCOM are: (i) minimum number of pairwise comparisons of attributes (only n − 1 comparison), (ii) validation of the outcomes through “deviation from full consistency (DFC)” of the comparison, and (iii) removing the concern of redundancy of pairwise comparisons of attributes, which is presented in several subjective weighting procedures for evaluating criteria weights [34]. Recently, Fazlollahtabar et al. [35] evaluated and selected a forklift in a warehouse by using integrated FUCOM and WASPAS models. Stević and Brkovic [36] suggested a combined model by integrating FUCOM and “measurement alternatives and ranking based on compromise solution (MARCOS)” methods to tackle the “human resources management (HRM)” in a transport business. Pamučar et al. [37] introduced fuzzy FUCOM for ranking the transport demand processes in Istanbul’s urban mobility structure.

2.3. DNMA Method

With the ever-increasing intricacy and wide-ranging challenges of today’s environment, numerous MCDM approaches have been introduced by copious authors. The MCDM models can be characterized into two ways: (i) Outranking tools such as “elimination et choix traduisant la realité (ELECTRE)” and “preference ranking organization method for enrichment of evaluation (PROMETHEE)”, and (ii) utility degree-based approaches such as “technique for order performance by similarity to ideal solution (TOPSIS)”, VIKOR, “multi-attribute multi-objective optimization by ratio analysis (MULTIMOORA)”, and “simple multi-attribute rating technique (SMART)”. Several procedures or algorithms for optimizing the problem have been developed using optimization, “artificial intelligence (AI)”, and soft computing. Related study on AI is emerging in an endless stream, especially research on uncertainty-based decision making and other methods, such as Zhao and Zhang’s [38] development of a learning-based model to improve generalization ability. They included a “decomposition-based many-objective optimization (MOOD)” framework and a “learning automaton (LA)”. The LA amends the “evolutionary algorithm (EA)” to acclimate to the problem features based on the feedback information during the optimizing model. Pasha et al. [39] introduced a combined optimization model that addresses all the key tactical liner shipping decisions and permits the deployment of a heterogeneous ship fleet at each route. They also presented a decomposition-based heuristic model to tackle large-size problem instances. Dulebenets [40] presented an “adaptive polyploid memetic algorithm (APMA)” for the problem of scheduling “cross-docking terminal (CDT)” trucks that can support with appropriate CDT operations planning. The APMA depends on the polyploidy doctrine. They controlled the number of chromosome copies with the adaptive polyploid tool using the objective function improvements achieved and computational time changes. Pasha et al. [41] presented a “mixed-integer linear programming (MILP)” tool, which purposes to minimize the total cost of the “factory-in-a-box” supply chain. They utilized the CPLEX software to tackle the approach to the global optimality, while four “metaheuristic algorithms (MAs)”, comprising the “evolutionary algorithm (EA)”, “variable neighborhood search (VNS)”, and “simulated annealing (SA)”, are utilized to treat the approach for large scale problem instances. Theophilus et al. [42] introduced a mixed-integer mathematical structure for the truck scheduling optimization at a cold-chain CDT to improve the efficiency of perishable product distribution. The outcome of the proposed algorithm validates an acceptable stability of the solution quality at termination. Rabbani et al. [43] defined diverse patient groups using their needs and characteristics. They developed an MILP model to obtain the suitable sequence of routes for each ambulance and minimize the latest “service completion time (SCT)” as well as the number of patients whose condition worsens due to receiving untimely medical services. They also used “non-dominated sorting genetic algorithm-II (NSGA-II)” and “multi-objective particle swarm optimization (MOPSO)” to obtain high-quality solutions over a short time. Next, the utility-based approaches only employed single normalization technique to non-dimensionalize assessment values over diverse attributes. In this way, utilizing a predefined normalization tool may bias the outcomes when the normalization process is not appropriate. To conquer this issue, Liao and Wu [44] intended a new utility value-based approach, namely, the “double normalization-based multi-aggregation (DNMA)” framework, which takes the benefits of different normalization methods and aggregation functions and combines them in an appropriate way. The overall integration function of DNMA approach widely considers the subordinate utility degrees and the ranks of options, and thus the overall priority outcome has high dependability. Nie et al. [45] proposed a multi-expert MCDM technique by combining a DNMA approach with cardinal consensus reaching procedure under “hesitant fuzzy linguistic term sets (HFLTSs)”. Lai et al. [46] studied a Z-number-based DNMA methodology to treat with the form of beneficial, non-beneficial, and target types for sustainable cloud service provider development. Wang and Rani [47] made an extension the DNMA approach on IFSs context for the identification, ranking, and evaluation of the sustainability risk factors in “supply chain management (SCM)”. Here, we develop a combination of FUCOM and DNMA based method under q-ROFSs setting for the evaluation of HCWT method selection.

2.4. Literature Summary and Contributions

In this study, we want to select the suitable HCWT method. To tackle this concern, we have considered one of the optimization techniques based on the utility degree method of MCDM tool, called DNMA. We have also chosen one of the weighting procedures to obtain the attribute weights of MCDM model. From the aforementioned literature, we are inspired to extend the MCDM methods called FUCOM and DNMA on q-ROFSs settings, because we have observed that there is a gap at the extension of the presented approaches in q-ROFSs settings. Here, this motivation guides us to develop the methods q-ROF-FUCOM and q-ROF-DNMA in the decision-making process.
In this work, the implementation of the DNMA tool is discussed. This tool is very robust compared to diverse MCDM models. The certain benefits of the DNMA tool are that of other MCDM models (more sophisticated, stable, and with easy mathematical calculations). Additionally, there are distinct benefits to the DNMA tool, the combination of different normalization processes and aggregation functions to aggregate them in an appropriate way. The overall integration function of the DNMA approach widely considers the subordinate utility degrees and the ranks of options and, thus, the overall priority outcome has high dependability. After analyzing the advantages and disadvantages of the linear and vector normalization process, we make a suitable combination on two kinds of normalized values and three types of aggregation models to derive the subordinate utility values and ranks. It can reduce the information loss caused by one normalization technique used in DEMATEL-MULTIMOORA [1], AHP method [6], ordered weighted averaging (OWA)-based fuzzy measure methods [9,10], ANP-ELECTRE method [11], and IF-EDAS method [14]. To sum up, the common flaw of the extant models is that they eliminate the attribute dimensions only based on one normalization process, which may bias the outcomes as all the normalization processes lose the original information more or less from different aspects.
In this study, the FOCUM is applied to obtain the subjective weight of attributes based on the doctrines of pairwise comparisons of attributes and the outcomes validation by DFC [34]. It requires a lower number of pairwise comparisons of attributes (only n − 1 comparisons), which results in more accurate, optimal weights. In Voudrias [6], the AHP and ANP-based weighting technique is utilized to obtain the weights of the attributes. In this procedure, the total n(n − 1)/2 pairwise comparisons of attributes are required. In a similar way, Özkan [11] utilized the ANP to obtain the attribute weight, which is a general form of AHP. It is very tough to execute entirely consistent pairwise comparisons if the number of criteria is high. In Mishra et al. [14], discrimination measure-based procedure is used to assess the criteria weights, which loses some original information from different aspects. In Liu et al. [1], the DEMATEL tool was used to obtain the weights of attributes. By comparing to other MCDM tools, some drawbacks of the DEMATEL tool become apparent, such as (a) it provides the priority order of options with the use of interdependent relationships among the options, but other aspects are not combined in the decision-making problem, and (b) the weight values of the DEs are not considered by combining individual decisions of DEs into group evaluations. Hence, the DEMATEL has been combined with different decision-making tools to obtain the desired outcomes.
Corresponding to the extant literature on the HCWT management in MCDM, a few authors have studied this application with q-ROF-DNMA. To date, there are no studies on q-ROF-FUCOM-DNMA. To fill this research gap, we developed the q-ROF-FUCOM-DNMA methodology. This presented weighting procedure and ranking approach give the chance to elucidate DE’s hesitation and ambiguity when they are providing the values for choosing the suitable option. Furthermore, the application of HCWT method selection has a lot of hesitant and vague terms, as well as some vague attributes. When DEs provide the degrees for attributes, they want to illustrate their views of hesitation and ambiguity, and the q-ROFSs assist to assign the BDs in terms of q-ROFNs. Hence, application of HCWT with q-ROFNs is considered the key motivation of this study.

3. Preliminaries

Here, we highlight on some important concepts related to the q-ROFSs.
Definition 1
[26]: Let U = { u 1 ,   u 2 , ,   u n } be a fixed set. Then, a q-ROFS α on U is defined as
α = { u i , μ α ( u i ) , γ α ( u i ) : u i U } ,
where μ α ( u i ) and γ α ( u i ) portray the BD and NBD, respectively, of u i U on q-ROFS α and 0 μ α ( u i ) , γ α ( u i ) 1 with 0 ( μ α ( u i ) ) q + ( γ α ( u i ) ) q 1 , ( q 1 ). The hesitancy degree of u i U in the q-ROFS α is δ α ( u i ) = ( 1 ( μ α ( u i ) ) q ( γ α ( u i ) ) q ) 1 q and 0 δ α ( u i ) 1 . Yager [26] gave the “q-rung orthopair fuzzy number (q-ROFN)” as a pair μ α ( x ) , γ α ( x ) . For easiness, we shall apply the symbol α = μ α , γ α to signify a q-ROFN.
Definition 2
[48]: For a q-ROFN α , the score value is given by
S ( α ) = μ α q γ α q ,
where 1 S ( α ) 1 . It is found that the score degree cannot be effectively utilized to distinguish some q-ROFNs in several particular cases. For instance, if α 1 = 0.6138 , 0.2534 and α 2 = 0.7147 , 0.4453 , then S ( α 1 ) = 0.3125 = S ( α 2 ) (take q = 2). Hence, we should not depend exclusively on the score function to compare the q-ROFNs. To tackle this issue, Liu and Wang [48] discussed the notion of accuracy function of a q-ROFN.
Definition 3:
For α = μ α , γ α , the accuracy value is given by
A ( α ) = μ α q + γ α q ,   where   0 A ( α ) 1 .
Based on the score value and accuracy value, a comparative procedure is discussed as
Definition 4
[48]: For any two q-ROFNs, α 1 = μ α 1 , γ α 1 and α 2 = μ α 2 , γ α 2 , we have
(1)
If S ( α 1 ) > S ( α 2 ) , then α 1 α 2 ;
(2)
If S ( α 1 ) = S ( α 2 ) , then
(i)
if A ( α 1 ) > A ( α 2 ) , then α 1 α 2 ;
(ii)
if A ( α 1 ) = A ( α 2 ) , then α 1 = α 2 .
Definition 5
[48]: Suppose α 1 = μ α 1 , γ α 1 and α 2 = μ α 2 , γ α 2 to be two q-ROFNs and λ > 0 . Then,
(i)
α 1 α 2 = ( 1 ( 1 μ α 1 q ) ( 1 μ α 2 q ) ) 1 q , γ α 1 γ α 2 ;
(ii)
α 1 α 2 = μ α 1 μ α 2 , ( 1 ( 1 γ α 1 q ) ( 1 γ α 2 q ) ) 1 q ;
(iii)
λ α 1 = ( 1 ( 1 μ α 1 q ) λ ) 1 q , γ α 1 λ ;
(iv)
α 1 λ = μ α 1 λ , ( 1 ( 1 γ α 1 q ) λ ) 1 q .
Definition 6
[49]: For any two q-ROFNs, α 1 = μ α 1 , γ α 1 and α 2 = μ α 2 , γ α 2 , the distance measure between them is given as:
d ( α 1 , α 2 ) = 1 2 ( | μ α 1 q μ α 2 q | + | γ α 1 q γ α 2 q | + | δ α 1 q δ α 2 q | ) .
Definition 7
[49]: Suppose α 1 = μ α 1 , γ α 1 be a q-ROFN. Then, the entropy is given by
E n ( α 1 ) = 1 | μ α 1 q γ α 1 q | 1 + | μ α 1 q γ α 1 q | .

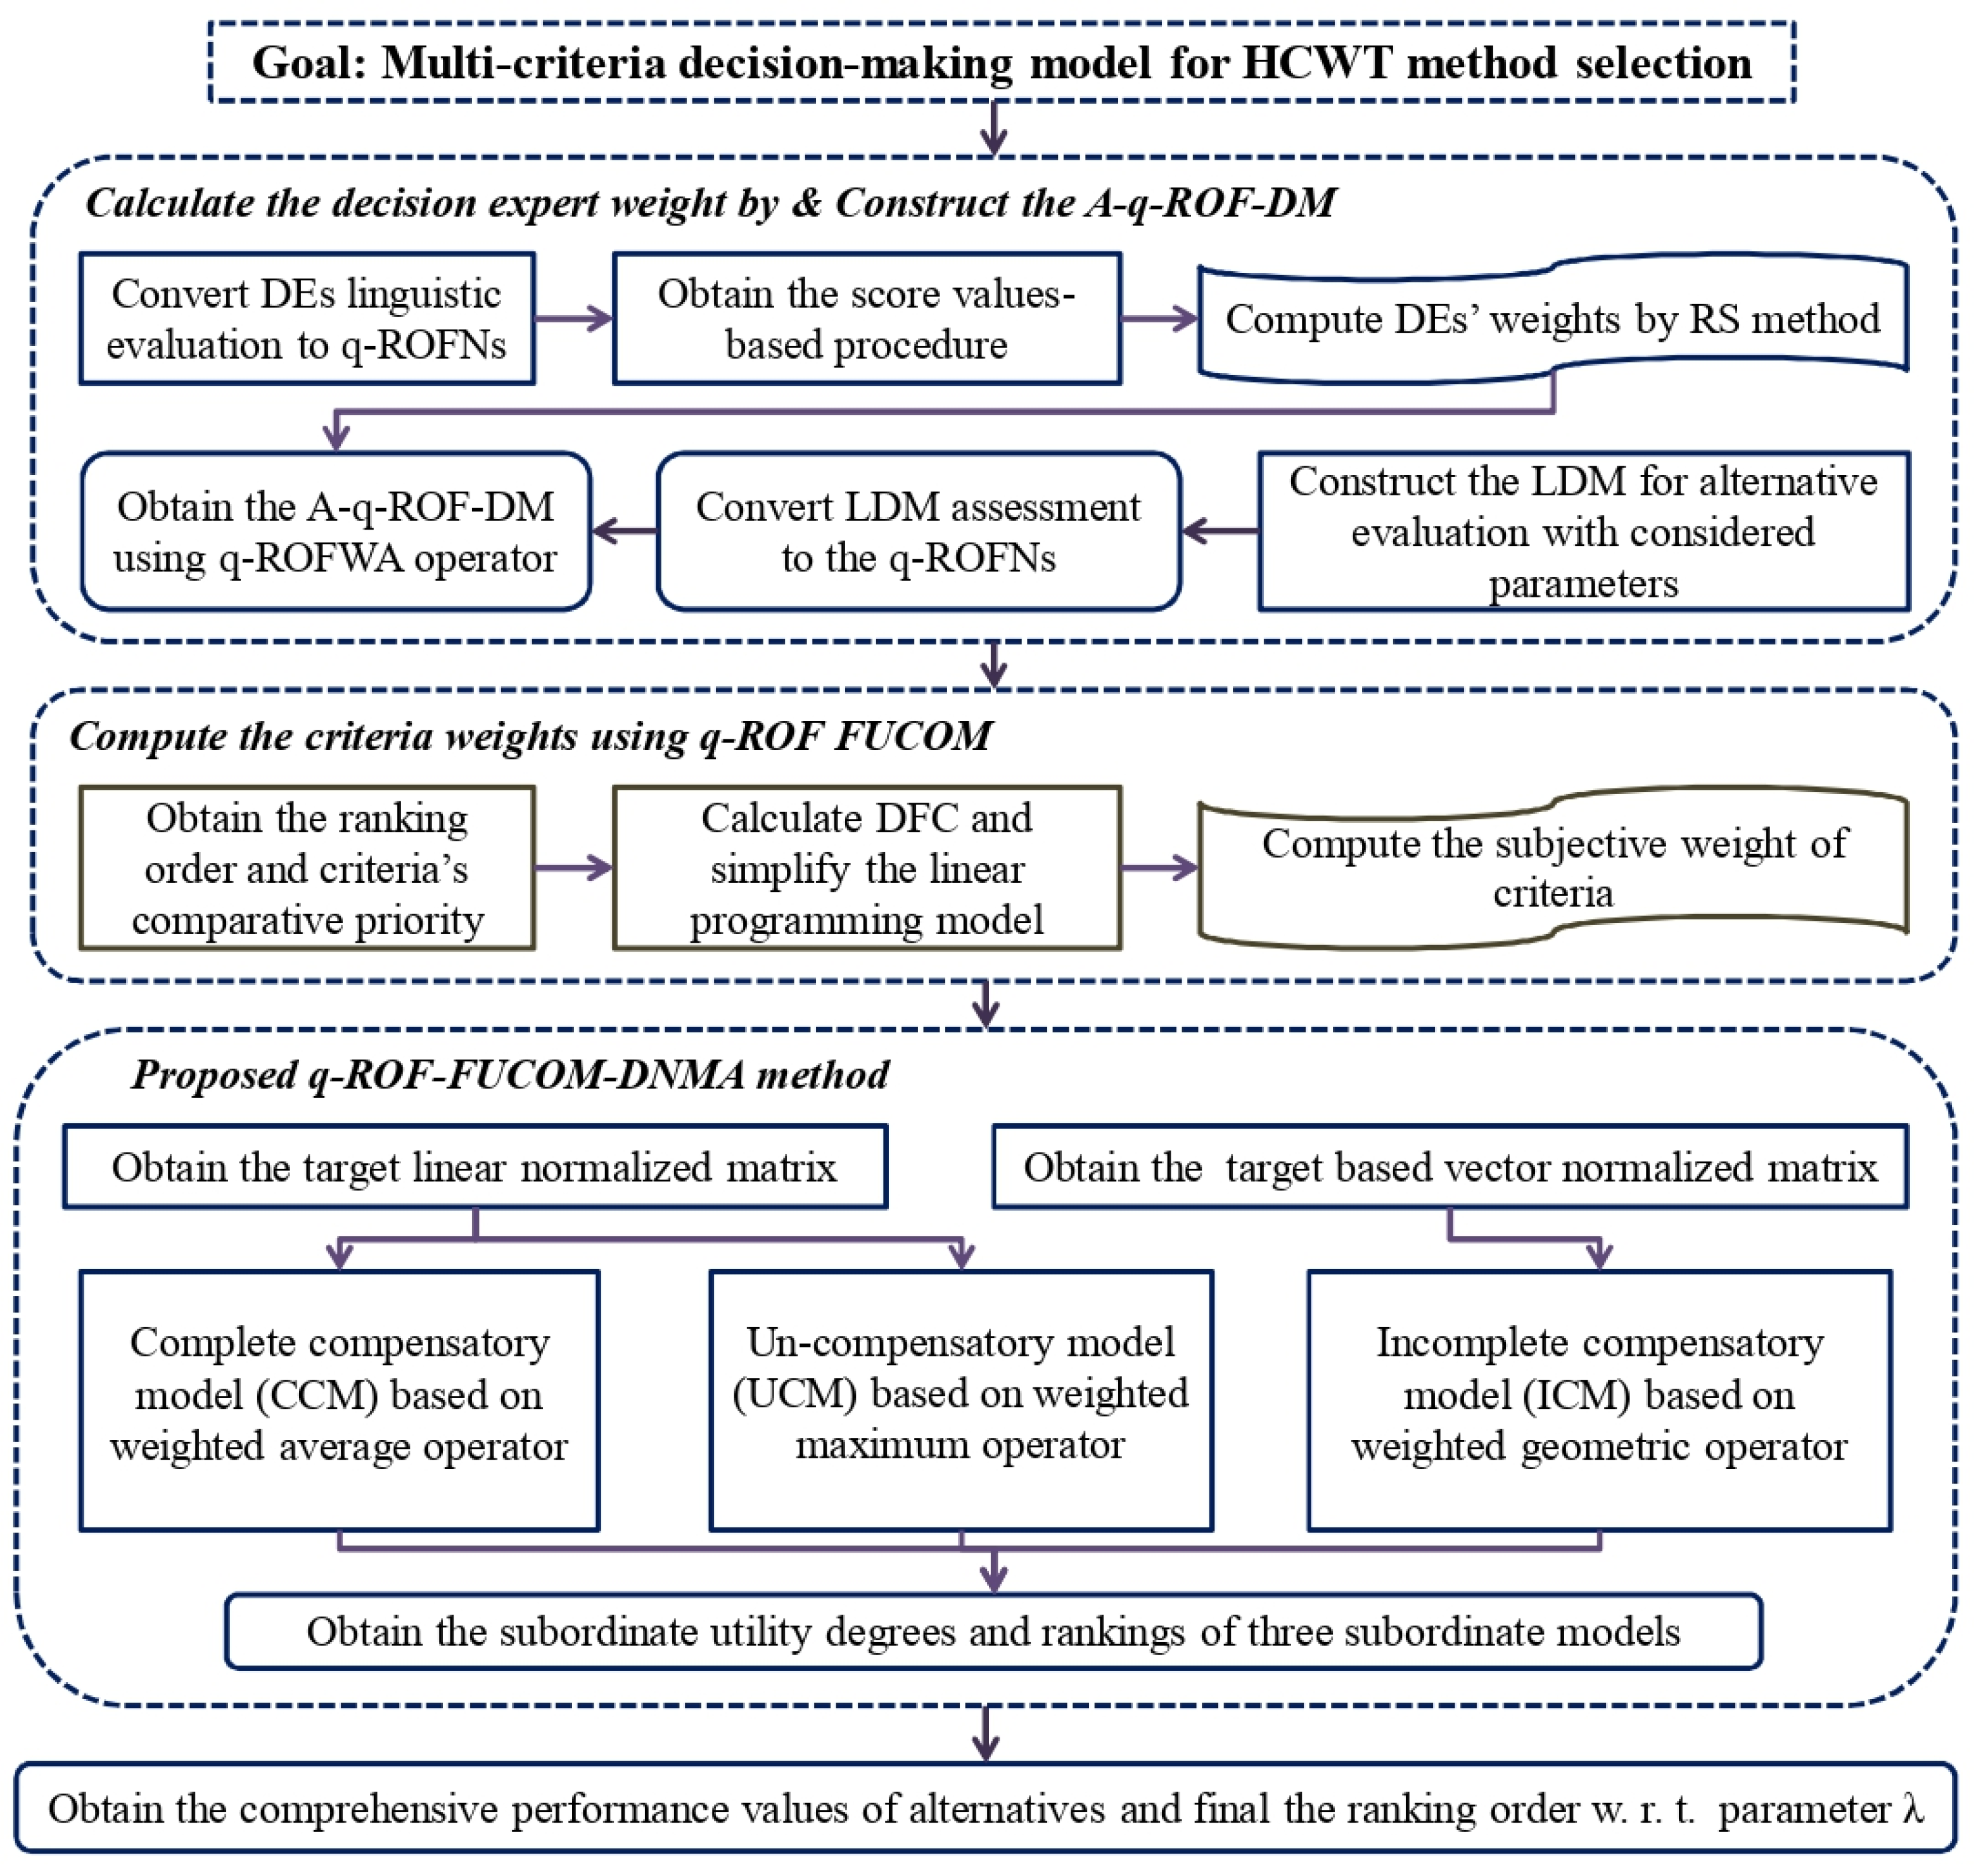
4. Proposed q-ROF-FUCOM-DNMA Methodology

To overcome the defects of the utility based methods such as MULTIMOORA, TOPSIS, VIKOR, and SMART, the DNMA approach was initiated by Liao and Wu [38]. In DNMA methodology, two kinds of normalization procedures, namely linear normalization and vector normalization, are used. This method is a combination of three kinds of aggregation processes, “complete compensatory model (CCM)”, “un-compensatory model (UCM)”, and “incomplete compensatory model (ICM)”. The good assessment value of the option over certain criteria for a CCM based model completely fulfills the dearth of the poor assessment of an option over other criteria and, afterwards, with the considered criteria, the obtained best option attains the highest assessment value. Moreover, with the considered criteria, the worst performance of an alternative is performed by the UCM model. The underlying issue of fulfillment of deficiency in performance for some alternatives by one certain alternative’s good performance gives rise to the ICM model. By merging the final outcomes of these aforesaid three aggregation models, it is possible to obtain the resultant values of the alternatives.
To solve a MCDM problem comprising m different options H1, H2, …, Hm in which these options are evaluated in q-ROFSs environment over the set of n criteria G1, G2, ……, Gn, we develop an integrated q-ROF-FUCOM-DNMA method with the steps gained as follows (see Figure 1):
Step 1: Obtain the DEs’ weights.
Let D ˜ k = μ k , γ k , 0 ( μ k ) 2 + ( γ k ) 2 1 k = 1 , 2 , 3 be a q-ROFN signifying the initial assessment result of kth DE. Then, the weight ϑ k of kth DE D k can be defined by
ϑ k = θ k q k = 1 l θ k q , k = 1 , 2 , , l ,
where θ k q = μ k + ( 1 μ k q γ k q ) 1 q ( γ k μ k + γ k ) , k = 1 , 2 , , l , and k = 1 l ϑ k = 1 .
Step 2: Assemble the assessment values of each DEs in terms of “linguistic decision matrices (LDMs)” D ˜ k = ( α i j ( k ) ) m × n = ( μ i j ( k ) , γ i j ( k ) ) m × n ( k = 1 , 2 , , l ) .
Step 3: Aggregate the individual decision opinions using the “q-rung orthopair fuzzy weighted averaging (q-ROFWA)” operator.
Note that, in an aggregation process, all single matrices need to combine to form the aggregated decision matrix.
Let D * = ( α i j * ) m × n = ( μ i j * , γ i j * ) m × n be the “aggregated q-ROF-decision-matrix (A-q-ROF-DM)”, wherein
α i j * = q R O F A ( α i j ( 1 ) , α i j ( 2 ) , , α i j ( l ) ) .
Thus, by definition of Liu and Wang [42], we have
q R O F W A ( α i j ( 1 ) , α i j ( 2 ) , , α i j ( l ) ) = ( 1 k = 1 l ( 1 ( μ i j ( k ) ) q ) ϑ k ) 1 q , k = 1 l ( γ i j ( k ) ) ϑ k .
Step 4: Compute the criteria weights by FUCOM method.
In the framework of MCDM, it is considered that the resolution of criteria’s relative weights is one of the tangible problems in the verge of subjectivity without loss of generality. Due to the crucial impact of weight coefficients to the solution in some methods, this procedure gains great importance and plays a vital character in the final result of the MCDM settings. Here, for computing the criteria weights, we deploy FUCOM method. Under the conviction of a definite level of hierarchy alongside the joint fulfillment of the comparison consistency’s situations, it is possible to accurately measure the ratings of the criteria weight coefficients by employing this method.
Here, we furnished the steps to determine the criteria weights by FUCOM method:
Step 4.1: At the very beginning, we attempt in this step the ranking of the evaluation criteria G1, G2, G3, …, Gn. The preference order is obtained based on the highest importance to lowest importance of criteria. Thus, we refer that the obtained desired values of the weight coefficients make it possible to frame the ranking of the criteria that can be viewed as:
G j ( 1 ) > G j ( 2 ) > G j ( 3 ) > > G j ( σ )
where σ expresses the rank of the observed criterion.
Step 4.2: In this step, we discuss a comparative study of the ranked criteria as well as the determination of the evaluation criteria’s comparative priority ( Θ σ / ( σ + 1 ) ; σ = 1 , 2 , 3 , , n ) . Importantly, the preference is given to the comparative priority Θ σ / ( σ + 1 ) of the evaluation criteria related to the rank G j ( σ ) while compared with that of the G j ( σ + 1 ) . In this way, we can suggest below an expression which is responsible to vectors of the comparative priorities associated with the corresponding evaluation criteria:
ψ = ( Θ 1 / 2 , Θ 2 / 3 , , Θ σ / ( σ + 1 ) )
where it is pursued the significance by the Θ σ / ( σ + 1 ) that the criterion of the rank G j ( σ ) is assessed by the criterion of rank G j ( σ + 1 ) .
Step 4.3: In this step, it is required to compute the outcomes of the weight coefficients of the assessment criteria ( w 1 , w 2 , , w n ) T . Below, we present two constraints that are obeyed by the final results of the weight coefficients.
(I)
The comparative preference among the considered criteria coincides with the ratio of the weight coefficients, i.e., the below mentioned condition must be satisfied.
w σ w σ + 1 = Θ σ / ( σ + 1 )
(II)
In addition to Equation (5), the condition of mathematical transitivity, i.e., Θ σ / ( σ + 1 ) × Θ ( σ + 1 ) / ( σ + 2 ) = Θ σ / ( σ + 2 ) must be fulfilled by the overall degrees of the weight coefficients. As Θ σ / ( σ + 1 ) = w σ w σ + 1 and Θ ( σ + 1 ) / ( σ + 2 ) = w σ + 1 w σ + 2 , so w σ w σ + 2 = w σ w σ + 1 × w σ + 1 w σ + 2 is obtained; thus, showing yet another constraint that the final degrees of the weight coefficients of the assessment criteria require an encounter and is estimated as
w σ w σ + 2 = Θ σ / ( σ + 1 ) × Θ ( σ + 1 ) / ( σ + 2 ) .
It is important to mention here that the minimum “deviation from full consistency (DFC)” ( Ω ) is fulfilled only if we successfully enter into the transitivity, i.e., when we undertake both the conditions w σ w σ + 1 = Θ σ / ( σ + 1 ) and w σ w σ + 2 = Θ σ / ( σ + 1 ) × Θ ( σ + 1 ) / ( σ + 2 ) . To implement this, the values of the weight coefficients ( w 1 , w 2 , , w n ) T should comply with the conditions | w σ w σ + 1 Θ σ / ( σ + 1 ) | Ω and | w σ w σ + 2 Θ σ / ( σ + 1 ) × Θ ( σ + 1 ) / ( σ + 2 ) | Ω with the minimization of the value Ω .
Based on the constraints and settings cited above, below we address the desired model for calculating the final degrees of the weight coefficients of the assessment criteria:
Min Ω | w σ w σ + 1 Θ σ / ( σ + 1 ) | Ω , | w σ w σ + 2 Θ σ / ( σ + 1 ) × Θ ( σ + 1 ) / ( σ + 2 ) | Ω , σ w j 0 , j , j = 1 n w j = 1 .
By solving (5), the final weights ( w 1 , w 2 , , w n ) T of the evaluation criteria are obtained.
Step 5: Estimate the linear normalized-matrix R ˜ 1 = ( R ˜ i j 1 ) m × n .
Corresponding to the weighted A-q-ROF-DM, we obtain the linear normalized ratings using Equation (8).
R ˜ i j 1 = 1 d ( α i j * , α j * ) max i d ( α i j * , α j * ) ,
where
d ( α i j * , α j * ) = 1 2 ( | ( μ i j * ) q ( μ j * ) q | + | ( γ i j * ) q ( γ j * ) q | + | ( δ i j * ) q ( δ j * ) q | )
and α j * = μ j * , γ j * is the normalized q-ROFN on the criterion G j , j = 1 , 2 , , n .
Step 6: Compute the vector normalized-matrix R ˜ 2 = ( R ˜ i j 2 ) m × n .
Corresponding to the weighted A-q-ROF-DM, the vector normalized ratings are estimated by Equation (10) by employing the entropy measures given in Equations (11) and (12).
R ˜ i j 2 = 1 | E n ( α i j * ) E n ( α j * ) | i = 1 m ( ( E n ( α i j * ) ) 2 + ( E n ( α j * ) ) 2 )
E n ( α i j * ) = 1 | ( μ i j * ) q ( γ i j * ) q | 1 + | ( μ i j * ) q ( γ i j * ) q |
E n ( α j * ) = 1 | ( μ j * ) q ( γ j * ) q | 1 + | ( μ j * ) q ( γ j * ) q |
Step 7: Find adjusted weights for criteria.
The S.D. and adjusted weight coefficient of criteria are determined by Equations (13) and (14) as follows:
σ j = 1 m i = 1 m ( E n ( α i j * ) max i E n ( α i j * ) 1 m i = 1 m ( E n ( α i j * ) max i E n ( α i j * ) ) ) 2 , j = 1 , 2 , , n ,
w ˜ j σ = σ j j = 1 n σ j , j = 1 , 2 , , n .
By combining the linear normalized ratings with diverse criteria, the criteria weights can be adjusted as
w ˜ j = w ˜ j σ × w j j = 1 n w ˜ j σ × w j , j = 1 , 2 , , n .
Step 8: Evaluate the normalized values of R ˜ i j 1 and R ˜ i j 2 .
To derive the comprehensive performance of each option, R ˜ i j 1 and R ˜ i j 2 can be normalized as
R ¯ ¯ i j 1 = R ˜ i j 1 max i R ˜ i j 1 and R ¯ ¯ i j 2 = R ˜ i j 2 max i R ˜ i j 2 .
Step 9: Calculate the subordinate values of the alternatives based on CCM, UCM, and ICM models.
In particular, for determination of the subordinate values of the alternatives, we require to utilize three aggregation models distinct in nature in accordance with the target based normalization values of two categories.
Step 9.1: The subordinate values of the alternative H i , i = 1 , 2 , , m based on CCM is computed as
S 1 ( H i ) = j = 1 n w ˜ j R ¯ ¯ i j 1 , i = 1 , 2 , , m .
The alternatives H i , i = 1 , 2 , , m can be prioritized using S 1 ( H i ) in decreasing order and obtained the first-type of ranking r 1 ( H i ) .
Step 9.2: The subordinate values of the alternative H i , i = 1 , 2 , , m based on UCM are computed as
S 2 ( H i ) = max j w ˜ j ( 1 R ¯ ¯ i j 1 ) , i = 1 , 2 , , m .
The alternatives H i , i = 1 , 2 , , m can be prioritized using S 2 ( H i ) in ascending order and obtained the second-type of ranking r 2 ( H i ) .
Step 9.3: The subordinate values of the alternative H i , i = 1 , 2 , , m based on ICM is computed as
S 3 ( H i ) = ( j = 1 n R ¯ ¯ i j 1 ) w ˜ j , i = 1 , 2 , , m .
The alternatives H i , i = 1 , 2 , , m can be ranked using S 3 ( H i ) in decreasing order and obtained the third-type of ranking r 2 ( H i ) .
Step 10: Find the comprehensive performance values of the alternatives and rank them accordingly.
The comprehensive performance values of the alternatives H i , i = 1 , 2 , , m can be obtained as follows:
Ψ ( H i ) = θ 1 λ ( S ˜ 1 ( H i ) max i S ˜ 1 ( H i ) ) 2 + ( 1 λ ) ( m r 1 ( H i ) + 1 m ) 2 θ 2 λ ( S ˜ 2 ( H i ) max i S ˜ 2 ( H i ) ) 2 + ( 1 λ ) ( r 2 ( H i ) m ) 2 + θ 3 λ ( S ˜ 3 ( H i ) max i S ˜ 3 ( H i ) ) 2 + ( 1 λ ) ( m r 3 ( H i ) + 1 m ) 2 ,
where
S ˜ 1 ( H i ) = S 1 ( H i ) i = 1 m ( S 1 ( H i ) ) 2 , S ˜ 2 ( H i ) = S 2 ( H i ) i = 1 m ( S 2 ( H i ) ) 2 , S ˜ 3 ( H i ) = S 3 ( H i ) i = 1 m ( S 3 ( H i ) ) 2 , i = 1 , 2 , , m .
Here, the parameter λ [ 0 , 1 ] reflects the relative significance of the subordinate values. θ 1 , θ 2 , θ 3 are the weights of the CCM, UCM, and ICM models, respectively, such that θ 1 + θ 2 + θ 3 = 1 .

5. Case Study: Healthcare Waste Treatment (HCWT) Method Selection

5.1. Problem Definition

The waste produced by the healthcare services includes ‘regulated clinical waste’, hazardous chemical waste, recyclable solid waste, etc. To obey the medical belief ‘do not harm’, it is their duty to ensure the implementation of waste disposal policies that include the safety measure of workers, public health, and environmental concerns alongside the legal and existing regulatory permission. We also require a social norm to ponder over the disposal technologies and services regarding the waste management system followed by the incorporation of the upstream waste management (removal or minimization of some wastes, reuse and recycling of others) and post treatment methods facilities (such as shredding, land filled material, incineration ash, and air and water emissions).
With development in several healthcare facilities, Delhi, Noida, and other surrounding places collectively generate over 5900 tones medical waste per year, most of which remains unprocessed and dumped with solid waste, thus causing severe health and environment hazards. To choose a treatment method for HCW, generally if there is a threat of toxic emissions or other harmful distresses, the relative threats, as well as the assimilation into the whole procedure of comprehensive waste strategy, should consequently be prudently considered with regard to local environments.
After initial screening, five HCWT method alternatives, chemical disinfection (H1), microwave disinfection (H2), autoclaving (steam sterilization) (H3), incineration (H4), and reverse polymerization (H5) are selected over the 16 criteria, and details are specified in Table 1. Through widespread review [1,6,8,14,15,50] of the literature on HCWT method assessment, we identified 16 attributes characterized into four key aspects, viz., economic, environmental, technical, and social. After the literature is examined in detail, the criteria and alternatives given in this section are used for the selection of the best HCWT method. For the evaluation phase of waste disposal methods, a group of DEs who will carry out the process is formed. The group of three DEs, abbreviated as D1, D2, and D3, includes a lecturer who advises on waste management, a professor who carries out many projects and studies in the field of MCDM, and a consultant who advises on strategies and policies in the municipality. To choose the best alternative among these five medical waste treatment technologies, a board was formed consisting of the three DEs. The list of considered criteria for HCWT method assessment with literature sources is presented in Table 1.

5.2. Implementation of Proposed q-ROF-FUCOM-DNMA Methodology

Step 1: Assume that the ratings of the three Des, D1, D2 and D3, are represented by the q-ROFNs as (0.90, 0.20), (0.75, 0.30), (0.60, 0.50), (0.30, 0.75), and (0.20, 0.90), respectively. Then, the weights of Des are calculated using Equation (1) and are given as w 1 = 0.350 , w 2 = 0.319 , and w 3 = 0.331 .
For this, the current linguistic decision matrices are constructed using the “linguistic values (LVs)” given in Table 2, obtained from Krishankumar et al. [57], to evaluate the alternatives in terms of criteria according to DEs’ opinions. After, the current linguistic decision matrices are transformed to their corresponding q-ROFNs.
Step 2: Using the intuitionistic fuzzy linguistic scale given in Table 2, the DE group evaluates the alternatives in terms of the main criteria and the sub-criteria. The current LDMs created according to the evaluations of the DEs in the form of (D1, D2, D3) are given in Table 3. The types of the criteria are also presented in Table 1. The linguistic evaluations of each DE are converted to their corresponding q-ROFNs using the scale given in Table 2. For instance, the initial assessment results of the DEs in the form of LDMs D ˜ k = ( α i j ( k ) ) 5 × 16 = ( μ j i ( k ) , γ j i ( k ) ) 16 × 5 , k = 1 , 2 , 3 , based on the main criteria, is presented in Table 3.
Step 3: The A-q-ROF-DM R ˜ = ( R ˜ i j ) 5 × 16 = ( R ˜ j i ) 16 × 5 is obtained using Equation (2) and Table 3, and mentioned in Table 4.
Step 4: The procedure of FUCOM method for computing the criteria weights is as follows:
Step 4.1: The ranking of the criteria using g Equation (3): G8 > G7 > G6 > G16 > G15 > G1 > G13 > G2 > G11 > G3 > G14 > G9 > G5 >G4 > G10 > G12.
Step 4.2: The comparison is made over the first-ranked G8 criterion using the scale [1,9]. Therefore, the prioritization of criteria ( w G j ( k ) ), prioritized in Step 4.1, are estimated using Equation (4) and presented in Table 5.
On the basis of Table 4 and Equations (5) and (6), the comparative ratings of criteria are determined as
φ G 8 / G 7 = 1.2 / 1 = 1.2 ,   φ G 7 / G 6 = 1.6 / 1 .2 = 1.33 ,   φ G 6 / G 16 = 1.8 / 1.6 = 1.13 ,   φ G 16 / G 15 = 2 / 1.8 = 1.11 , …, φ G 12 / G 10 = 7 / 5.8 = 1.21 .
Step 4.3: The Model (7) for determining the weight coefficients are given by
min χ s . t . { | w 8 w 7 1.2 | χ ,   | w 7 w 6 1.33 | χ ,   | w 6 w 16 1.13 | χ ,   | w 16 w 15 1.05 | χ ,   | w 15 w 1 1.1 | χ ,   | w 1 w 13 1.1 | χ , | w 13 w 12 1.3 | χ ,   | w 2 w 11 1.8 | χ ,   | w 11 w 3 1.12 | χ ,   | w 3 w 14 1.05 | χ , | w 14 w 9 1.13 | χ , | w 9 w 5 1.04 | χ , | w 11 w 14 1.18 | χ ,   | w 3 w 9 1.18 | χ ,   | w 14 w 5 1.8 | χ , | w 9 w 4 1.11 | χ , | w 5 w 10 1.23 | χ , | w 4 w 12 1.4 | χ , j = 1 16 w j = 1 ,   w j 0 , j
Simplifying the model with Lingo 17.0 tool, DFC of the results χ = 0.00 are computed and the overall weight of criteria is obtained as
( 0.730 , 0.0511 , 0.0404 , 0.0309 , 0.0327 , 0.0962 , 0.1279 , 0.1535 , 0.0340 , 0.0266 , 0.0452 , 0.0220 , 0.0664 , 0.0384 , 0.0767 , 0.0851 ) .
Step 5: The targeted ratings are obtained and presented in Table 6. Corresponding to these targeted ratings and distance measures obtained by Equation (10), we compute the linear normalized ratings mentioned in Table 7.
Step 6: Based on the entropy measures given by Equations (11) and (12), vector normalized ratings are estimated by Equation (10) and presented in Table 8.
Step 7: The S.D. adjustment factors and weights for criteria are calculated using Equations (13)–(15). The obtained results are provided in Table 9.
Steps 8–11: Compute the normalized values of R ˜ i j 1 and R ˜ i j 2 with the use of Equation (16). On the basis of Equations (17)–(19), the sub-ordinate values of options H i corresponding to CCM, UCM, and ICM, respectively, are computed. The comprehensive performance values Ψ ( H i ) of the alternatives H i are obtained by Equation (20) (taking λ = 0.3 and θ 1 = θ 2 = θ 3 = 1 / 3 ). All these outcomes are summarized in Table 10.
Based on the values of Ψ ( H i ) ( i = 1 , 2 , , 5 ) , the preference order of the HCWT methods is given by H 3 H 4 H 1 H 2 H 5 , where the symbol “ ” means “superior to”. Thus, the best HCWT method is H 3 , i.e., autoclaving (steam sterilization) for treating the HCWs.
Regardless of assuming θ 1 = θ 2 = θ 3 = 1 / 3 , the weights can be chosen as per the preferences of DEs on the basis of the comprehensive accomplishment by the alternatives or of their poor performances. CCM is preferred if attention of the alternatives’ comprehensive abilities can be drawn from DEs. If the DEs are not interested to take risks, then a large weight can be attached to the UCM. It is pertinent to mention that ICM can be endowed by a large weight in cases when the DEs focus solely upon the comprehensive performance as well as the decision risks. Furthermore, when we preserve the property that linear normalization is much more efficient than vector normalization, then it can genuinely be possible to attribute a large weight to both the CCM and UCM models, failing which inculcates complicity with a big weight to ICM.

6. Sensitivity Investigation and Comparisons with Extant Methods

Here, we show the different types of analyses related to the proposed methodology to show the usefulness.

6.1. Sensitivity Investigation (SI) of Criteria Weights

Here, we make an investigation to illustrate the impact of the diverse criterion considered and assessed by the introduced method. By FUCOM, the “most significant criterion” is recognized among a set of 16 criteria. A criterion chosen as “most significant criterion” means it has the highest weight value. Kahraman [58] provided the procedure to discuss the weights proportionality through the analysis in Equation (21) as
w c = ( 1 w s ) × w c 0 W c 0 = w c 0 α c × Δ x ,
where w c = variation in of attribute weights during SI, w s = most significant attribute weight, w c 0 = original criteria weights, and W c 0 = sum of the original criteria weight and weights that are changed,
α c = w c 0 W c 0 = weight   coefficient   of   flexibility .
From Equation (21), it is observed that the variation degree utilized to a weight coefficient is signified by Δ x based on their weight flexibility coefficients. The positive and negative ratings of parameter Δ x may specify the increment and decrement in relative importance. The major variation in the most important attribute’s weight in both directions is computed with the limits for Δ x . Now, we can define the limit of parameter Δ x as
w s 0 Δ x min { w c 0 α c } .
Next, we define the limits for Δ x and then the new values of criteria weights are estimated as per the pre-set parameters for the SI. A set of new values of weight coefficients is computed through the use of Equations (24) and (25).
w s = w s 0 + α s × Δ x
w c = w c 0 α c × Δ x
where w s 0 = original weight of the most important attribute subjected to the SI, w c 0 = original weight value, and w s + w c = 1 is taken. The priority of the options is obtained by considering the latest values of the attribute weights.
In this analysis, the uppermost rating of weight coefficient w7 = 0.1051, the G7 criterion, can be considered as the most important criterion. Afterward, the coefficients of weight flexibility (Table 11) are estimated, and the limits of parameter ( Δ x ) are obtained as −0.1051 ≤ Δ x ≤ 0.8979. Corresponding to the limits of parameter ( Δ x ), several criteria weight sets (SET-1, SET-2, …, SET-16) for the SI are considered. The interval −0.1051 ≤ Δ x ≤ 0.8979 is partitioned into 16 weight sets. For each set, new values of the weight coefficients are obtained using Equations (24) and (25) and are presented in Table 12. Now, the comprehensive values of the HCWT options are obtained for diverse weight sets and are presented in Figure 2; their corresponding priority orders are given in Table 13. The outcomes (Figure 2 and Table 13) indicate that the assignment of the different criteria weights is being reflected into the changes occurred in ranking order of alternatives, which ensures the significant sensitivity of the proposed model with regards to the variations of weight coefficients. Next, the “Spearman rank correlation coefficient (SRCC)” values (rA) [59,60] are estimated in the results through various weight sets characterized by several criteria elicited in Table 13. We have noticed in Table 13 that the average SRCC (rA) value is 0.994, which expresses a very strong association [59,60] of the ranks of the alternatives. Thus, with these results, it is concluded that the priority of options obtained by q-ROF-FUCOM-DNMA method are accurate and reliable.

6.2. Comparative Discussion

To certify results, we make a comparison of the developed q-ROF-FUCOM-DNMA method with q-ROF-FUCOM-MULTIMOORA method.
The MULTIMOORA model contains of three models, namely the “ratio system (RS)”, the “reference point (RP)”, and the “full multiplicative form (FMF)” procedure. In comparison with various extant models (such as “AHP, TOPSIS, VIKOR, PROMETHEE, and ELECTRE”), the MULTIMOORA method has more advantages, easier mathematical procedure, lower computation time, and stronger robustness (Brauers and Zavadskas [61]). Owing to these benefits, extended MULTIMOORA (q-ROF-FUCOM-MULTIMOORA) method has been considered in this work for comparison purpose. The steps of q-ROF-FOCUM-MULTIMOORA method are given as
Steps 1 to 4: Same as the steps 1 to 4 discussed in Section 5.
Step 5: We normalize the A-q-ROF-DM ( α i j * ) m × n = ( μ i j * , γ i j * ) m × n by target-based vector normalization, supposing the aggregated target-based vector normalized decision-matrix is R ˜ i j N = ( α i j ) m × n .
Step 6: Estimate the utility degrees of options by RS method as
S i 1 = j = 1 n w j × α i j , i = 1 , 2 , , m .
Step 7: Find the utility degrees of the options by RP method as
S i 2 = max j   w j × ( 1 α i j ) , i = 1 , 2 , , m .
Step 8: Evaluate the utility values of the alternatives by FMF method as:
S i 3 = j = 1 n ( α i j ) w j , i = 1 , 2 , , m .
Step 9: Determine the final priority order of options.
The final assessment degree of option is obtained by
I ( H i ) = S i 1 × m ρ ( S i 1 ) + 1 ( m ( m + 1 ) / 2 ) S i 2 × ρ ( S i 2 ) ( m ( m + 1 ) / 2 ) + S i 3 × m ρ ( S i 3 ) + 1 ( m ( m + 1 ) / 2 ) , i = 1 , 2 , , m .
where ρ ( S i 1 ) ,   ρ ( S i 2 ) and ρ ( S i 3 ) are the final rankings of options by RS, RP, and FMF models, respectively. The best alternative has the maximum value of I ( H i ) .
We utilize these steps in the case study and the outcomes obtained are depicted in Table 14.
From Table 14, it follows that the final ranking by method is H 3 H 4 H 2 H 5 H 1 , where the symbol “ ” means “superior to”. Hence, the best HCWT method is H 3 , i.e., autoclaving (steam sterilization) which coincides with the best choice obtained through proposed q-ROF-FUCOM-DNMA method.
The proposed q-ROF-FUCOM-DNMA methodology has the following advantages:
(a)
As q-ROFSs are generalizations of IFSs and PFSs, they can treat more uncertain complex information that exists in practical decision-making problems. The introduced approach develops the model using the q-ROFSs, unlike [9,10,14,15], in which FSs/IFSs/PFSs have been applied. Thus, our developed method is more general.
(b)
The proposed integrated MCDM approach permits efficient treatment of uncertain information, as well as handling of complex information in the circumstances of group expert assessment of HCWT method.
(c)
The proposed methodology estimates the criteria weights with the use of FUCOM, which is a subjective weighting model. Similar to the AHP and BWM methods, FUCOM is also defined on the doctrines of comparison in pairs of attributes and validation of outcomes through deviation from maximum consistency. Hence, in contrast to the extant subjective tools, FUCOM considers smaller deviations of the achieved values of the criteria from the most favorable values (Pamucar et al. [34]).
(d)
The proposed methodology is applied to the q-ROF-DNMA method to increase the robustness of the fuzzy-DNMA model. Compared to the extant utility-based ranking methods (namely MULTIMOORA, VIKOR, TOPSIS, and others), the key benefit of DNMA approach is that it is considered by two normalization procedures (namely target-based linear and vector normalization). Moreover, the DNMA approach enables the DEs to adjust the weight of subordinate models (namely CCM, UCM, and ICM) to reveal their preferences on the “group utility” values and the “individual regret” values of options. Thus, the proposed hybrid DNMA approach is fulfilling the existing gap in the study of HCWT method assessment.
In Figure 3, it is noticed that the introduced methodology is consistent with existing models. To preserve uniformity in the technique-related comparison, various appraisal measures and existing q-ROF-MULTIMOORA methods are considered. The Spearman rank correlation coefficient (SRCC) [59,60] degrees of different model CCM, UCM, ICM, and extant methods with comprehensive performance values are presented by (1.00, 0.9, 0.30, and 0.70), respectively. From Figure 3, the SRCCs are higher than 0.6, except ICM. Additionally, the WS coefficients (Sałabun and Urbaniak [62]) of the different models and extant methods with comprehensive performance values are presented by (1.00, 0.9714, 0.625, 0.8464), respectively, which are each higher than 0.6. The outcomes of the WS coefficient state that it is an appropriate way to associate the similarity of prioritizations, which signifies the similarity of priority order of HCWT methods is high. Thus, it is concluded that the developed methodology has resilient association between preference outcomes. Hence, the developed approach is more reliable and has stability with the extant approaches.

6.3. Implication and Discussion

The outcomes of the developed q-ROF-FUCOM-DNMA method shows that microbial inactivation (G7) is the most significant attribute with a weight of 0.1051, volume reduction (G6) is the second most significant attribute with a weight of 0.1005, and capital cost (G8) is the third most important criterion with a weight of 0.0946. The other attributes have less significant values. The results show that microbial inactivation (G7), volume reduction (G6), and capital cost (G8) should be given more consideration in the evaluation of the desirable HCW waste treatment technology alternative.
From Table 10, we observe that autoclaving (steam sterilization) (H3) is considered the optimal treatment technology. Incineration (H4) is in the second position, chemical disinfection (H1) is in the third position, microwave disinfection (H2) is in the fourth position, and reverse polymerization (H5) is in the fifth position. Among the five medical waste treatment technologies, the decision-making implications of autoclaving (steam sterilization) are provided as follows: (1) it is visualized that through keeping the perilous medical waste within the particular healthcare regions, the risk can be minimized, (2) the socio-economic, environmental, and technical oriented performances are viewed to occur in better ways, and the same can be observed in cases of their corresponding criteria, and (3) operational cost is minimum.
Autoclaving (steam sterilization) (H3) is considered to be the best performing treatment technology during discussion of results in this study. At the time of nurturing the previous works related to this case study, it is found that a fuzzy MCDM procedure framed by TOPSIS can be utilized to assess incineration, steam sterilization, microwave disinfection, and land filling, which has been presented in the research work of Dursun et al. [9,10], and were able to certify steam sterilization to be the best treatment. Ozkan [11], in his work, performs a comparative study that includes incineration, microwave disinfection, off site steam sterilization, on site steam sterilization, and land filling by applying the MCDM approach, and inferred off site steam sterilization as the best suited technology. Afterwards, it was shown by Voudrias [6] that, while we consider an additional two technologies, namely chemical disinfection and reverse polymerization, with the previous set in the AHP method steam sterilization comes out to be the best one. In the subsequent study, Liu et al. [1] outlined that the most suitable HCWT method is the steam sterilization through joint venture of the 2-tuple “decision making trial and evaluation laboratory (DEMATEL)” method and fuzzy-MULTIMOORA approach that facilitates the selection procedure of HCW treatment technology. Mishra et al. [14] considered the microwave disinfection, incineration, steam sterilization, and landfill disposal as the four HCW treatment alternatives, and concluded a remark based on the results in their study that steam sterilization must be suggested as the most suitable HCW treatment technology.
From the above discussion, it is clear that few authors have utilized fuzzy TOPSIS, AHP, MULTIMOORA, and DEMATEL methods for selection of best HCWT method. However, each of these methods has some disadvantages, presented below:
(a)
For measuring the distance between each alternative and corresponding reference points, the TOPSIS [63] plays a key role in providing the optimal solution. Subsequently, the guarantee of non-exactness of the solution achieved through TOPSIS with ideal solution has been put forth by Opricovic and Tzeng [64].
(b)
MULTIMOORA [65] applies three aggregation models to derive three kinds of subordinate utility values based on the vector normalization, and the final rankings are determined by aggregating the subordinate ranks. Liao and Wu [44] contended that it is unreasonable to consider the subordinate ranks only for the purpose of final selection, as MULTIMOORA does not take into consideration the matching of normalization and aggregation techniques.
(c)
The application of AHP becomes complicated when it adopts lots of comparisons [32]. Zhu et al. [66] have proven that in the AHP strategy it is much easier to perform pair-wise comparisons with a complete, consistent manner if we restrict the criteria to nine; it becomes truly hard to perform when criteria limit exceeds nine.
(d)
The DEMATEL [67] method cannot approve the outcomes acquired. In other words, it is missing from consistency measure.
As the developed integrated q-ROF-FUCOM-DNMA method is free from the above mentioned difficulties, it imparts the best performance compared to other existing tools for selection of best HCW treatment technology.

7. Conclusions

Due to rapid urbanization and population growth, the HCWT has become a primary concern for healthcare experts and municipalities. Over the last few decades, it has gained emergent attention all over the globe. Selection of the most sustainable treatment method for HCW can be regarded as a complex, uncertain MCDM problem, as it often contains multiple incompatible criteria and various stakeholders. The aim of the paper is to propose a decision-making framework for the assessment of HCWT methods. For this, we have developed an integrated methodology by the hybridization of FUCOM and DNMA techniques with q-ROFSs. Considering the sensitivity of increasing complexity and ambiguity of realistic MCDM problems, we represent the criteria values in terms of q-ROFNs to the formulation of proposed decision-making method. In this proposed methodology, criteria weights are estimated through FUCOM, and final ranks of the alternatives are obtained through DNMA method. Further, to exemplify the practicality and usefulness of the developed methodology, a case study on HCWT method selection is considered. In this case study, the assessment index procedure for treatment technologies has been developed, which includes four dimensions of sustainability, namely environmental, economical, technical, and social. Those four dimensions consist of seven, three, three, and three sub-criteria, respectively, which are extensively considered in accordance with the existing literature. Later, the corresponding results are compared with extant approaches, which reveals its effectiveness and advantages. Moreover, the proposed methodology not only provides the rankings of the treatment technologies, but also explores the criteria performances in the medical waste treatment technology assessment.
The developed methods have been applied to the HCWT method selection, and the advantages, such as stability and precision of the developed methods, have been utilized. The developed methods, which have a very flexible structure, can also be used for many problems in the field of HCWT method selection. Thus, with the importance given to urbanization in recent years, the contribution of municipalities to the city management can be increased by ensuring that DEs or policymakers make investments in the right HCWT method selection of waste management, which includes constantly developing and changing conditions. The contributions and advantages of the study can be summarized as follows:
  • As the MCDM methods found in the literature only take into account the current situation and do not consider future trends, there is a need to develop new tools to make more efficient and reliable decisions. This study has developed a new decision methodology integrating q-ROF-FUCOM and q-ROF-DNMA in order to obtain the best solutions among contradictory and proportional criteria that must be evaluated simultaneously in an uncertain environment.
  • The q-ROF-FUCOM method allows us to consider the subjective nature of the decision process by using the objective weights of the criteria. The presented method computes the attribute weights by the FUCOM. It belongs to the group of subjective procedures for computing attribute weights, as well as the AHP tool [32] and the BWM [33]. Like the AHP and BWM methods, FUCOM is based on the pairwise comparison of attributes doctrine and validates the outcomes with DFC. However, in contrast to different subjective procedures, FUCOM shows smaller DFC while obtaining the degree of the attributes from the optimal degrees [34].
  • As the developed q-ROF-DNMA method takes into account future trends as well as current evaluations, it enables the decision model to be handled in a dynamic structure [41]. The developed methods have the ability to handle uncertain information more flexibly and better deal with uncertainties than ordinary fuzzy sets. Through q-ROFSs, not only are the uncertainties caused by the incomplete knowledge of the DEs dealt with, but so too are the hesitations of the decision makers reflected in their choices.
  • The q-ROF-DNMA method utilizes the benefits of different normalization methods and aggregation functions and combines them in an appropriate way [38]. The overall integration function of DNMA approach widely considers the subordinate utility degrees and the ranks of options and, thus, the overall priority outcome has high dependability. In the q-ROF-DNMA method, the obtained results are more logical because double normalization procedures are used to obtain the ranking order.
  • The study presents a real case study to prove the effectiveness, robustness, and reliability of the presented method and to determine the most HCWT method for the region of Delhi, India.
  • The application of the developed methods to the HCWT method selection problem has been tested with sensitivity and comparison analyses, and it has been proven that the alternatives are ranked correctly and the best one is selected.
  • This study provides an important contribution to the literature for both the HCWT method selection and the selection process in other realistic problems involving uncertainty by extending the DNMA method with q-ROFSs. The developed method contributes to meet the needs of both DEs and policymakers in the field of waste management.
From the point of view of our own understanding, it can be stated that there is a possibility to explore some elegant research issues such as financial analysis, image classification, environment assessment, and others in the vicinity of the q-ROF-FUCOM-DNMA framework due to its development, and to do so in more realistic ways in comparison to other existing approaches. For further study, the developed method can be applied to various decision-making problems such as energy investment evaluation, project selection, and risk assessment. It may be beneficial to consider different criteria and alternatives for waste disposal location evaluation for a more comprehensive solution. The developed methods can be extended by hesitant fuzzy soft sets, neutrosophic sets, picture fuzzy sets, spherical fuzzy sets, and an intuitionistic 2-tuple fuzzy linguistic environment [68]. In addition, the developed q-ROF-FUCOM-DNMA method can be used with other criterion weighting methods such as AHP, BWM [69], “criteria importance through intercriteria correlation (CRITIC)”, “method based on the removal effects of criteria (MEREC)”, and similarity measures-based approaches.

Author Contributions

Conceptualization A.S. and A.R.M.; methodology, A.S. and P.R.; Software, A.S. and I.M.H.; validation, A.R.M. and F.C.; formal analysis; A.R.M. and P.R.; investigation; I.M.H. and F.C.; data curation, A.S. and P.R.; writing—original draft preparation, A.S. and A.R.M.; writing—review and editing, P.R., I.M.H. and F.C.; supervision, F.C. and P.R.; funding acquisition, I.M.H. All authors have read and agreed to the published version of the manuscript.

Funding

This paper is supported by the “Researchers Supporting Project number (RSP-2021/389), King Saud University, Riyadh, Saudi Arabia”.

Institutional Review Board Statement

Not applicable.

Informed Consent Statement

Informed consent was obtained from all subjects involved in the study.

Data Availability Statement

Not applicable.

Conflicts of Interest

The authors declare no conflict of interest.

Abbreviations

AHPAnalytic hierarchy process
ANPAnalytic network process
APMAAdaptive polyploid memetic algorithm
A-q-ROF-DMAggregated q-ROF-decision-matrix
ARASAdditive ratio assessment
BGBelongingness grade
BWMBest-worst model
CCMComplete compensatory model
CDTCross-docking terminal
COPRASComplex proportional assessment
CoCoSoCombined compromise solution
CRITICCriteria importance through intercriteria correlation
DEsDecision experts
DEMATELDecision making trial and evaluation laboratory
DFCDeviation from full consistency
DNMADouble normalization-based multi-aggregation
EAEvolutionary algorithm
EDASEvaluation based on distance from average solution
ELECTREElimination et choix traduisant la realité
FMFFull multiplicative form
FUCOMFull consistency method
FSsFuzzy sets
HCWHealthcare waste
HCWTHCW treatment
HFLTSsHesitant fuzzy linguistic term sets
ICMIncomplete compensatory model
IFSsIntuitionistic fuzzy sets
IRNsInterval rough numbers
IVIFSsInterval-valued intuitionistic fuzzy sets
LALearning automaton
LDMsLinguistic decision matrices
LVsLinguistic values
MABACMulti-attributive border approximation area comparison
MARCOSMeasurement alternatives and ranking based on compromise solution
MCDMMulti-criteria decision-making
MERECMethod based on the removal effects of criteria
MAsMetaheuristic algorithms
MILPMixed-integer linear programming
MOPSOMulti-objective particle swarm optimization
MULTIMOORAMulti-attribute multi-objective optimization by ratio analysis
MSWsMunicipal solid wastes
NBGNon-belongingness grade
NSGA-IINon-dominated sorting genetic algorithm-II
OWAOrdered weighted averaging
PFSsPythagorean fuzzy sets
PROMETHEEPreference ranking organization method for enrichment of evaluation
q-ROFNsq-rung orthopair fuzzy numbers
q-ROFSsq-rung orthopair fuzzy sets
q-ROF-FUCOM-DNMAq-rung orthopair fuzzy-full consistency method-double normalization-based multi-aggregation
q-ROFIq-rung orthopair fuzzy information
q-ROFWAq-rung orthopair fuzzy weighted averaging
RSRatio system
RPReference point
SASimulated annealing
SCMSupply chain management
SCTService completion time
SHEHSafety and health evaluation facility
SISensitivity investigation
SMARTSimple multi-attribute rating technique
SRCCSpearman rank correlation coefficient
SWARAStepwise weight assessment ratio analysis
TOPSISTechnique for order performance by similarity to ideal solution
UCMUn-compensatory model
VIKORVlsekriterijumska optimizcija I kaompromisno resenje
VNSVariable neighborhood search
WASPASWeighted aggregated sum product assessment
WDBAWeighted distance-based approximation
WHOWorld Health Organization

References

  1. Liu, H.C.; You, J.X.; Lu, C.; Chen, Y.Z. Evaluating health-care waste treatment technologies using a hybrid multi-criteria decision making model. Renew. Sustain. Energy Rev. 2015, 41, 932–942. [Google Scholar] [CrossRef]
  2. Gusca, J.; Kuznecova, I.; Kalnins, S.N. Algorithm for life cycle inventory of medical waste treatment technologies emphasizing the role of treatment efficiency. Energy Procedia 2017, 113, 423–427. [Google Scholar] [CrossRef]
  3. Su, E.C.; Chen, Y.T. Policy or income to affect the generation of medical wastes: An Application of the Environmental Kuznets Curve by Using Taiwan as an Example. J. Clean. Prod. 2018, 188, 489–496. [Google Scholar] [CrossRef]
  4. Aung, T.S.; Luan, S.; Xu, Q. Application of multi-criteria-decision approach for the analysis of medical waste management systems in Myanmar. J. Clean. Prod. 2019, 222, 733–745. [Google Scholar] [CrossRef]
  5. Baghapour, M.A.; Shooshtarian, M.R.; Javaheri, M.R.; Dehghanifard, S.; Sefidkar, R.; Nobandegani, A.F. A computer-based approach for data analyzing in hospital’s health-care waste management sector by developing an index using consensus-based fuzzy multi-criteria group decision-making models. Int. J. Med. Inform. 2018, 118, 5–15. [Google Scholar] [CrossRef]
  6. Voudrias, E.A. Technology Selection for Infectious Medical Waste Treatment Using the Analytic Hierarchy Process. J. Air Waste Manag. Assoc. 2016, 66, 663–672. [Google Scholar] [CrossRef] [Green Version]
  7. Badi, I.; Shetwan, A.; Hemeda, A. A grey-based assessment model to evaluate health-care waste treatment alternatives in Libya. Oper. Res. Eng. Sci. Theory Appl. 2019, 2, 92–106. [Google Scholar] [CrossRef]
  8. Hinduja, A.; Pandey, M. Assessment of Healthcare Waste Treatment Alternatives Using an Integrated Decision Support Framework. Int. J. Comput. Intel. Syst. 2019, 12, 318–333. [Google Scholar] [CrossRef] [Green Version]
  9. Dursun, M.; Karsak, E.E.; Karadayi, M.A. A fuzzy multi-criteria group decision making framework for evaluating health-care waste disposal alternatives. Expert Syst. Appl. 2011, 38, 11453–11462. [Google Scholar] [CrossRef]
  10. Dursun, M.; Karsak, E.E.; Karadayi, M.A. Assessment of health-care waste treatment alternatives using fuzzy multi-criteria decision making approaches. Resour. Conserv. Recycl. 2011, 57, 98–107. [Google Scholar] [CrossRef]
  11. Özkan, A. Evaluation of healthcare waste treatment/disposal alternatives by using multi-criteria decision-making techniques. Waste Manag. Res. 2013, 31, 141–149. [Google Scholar] [CrossRef] [PubMed]
  12. Yazdani, M.; Tavana, M.; Pamucar, D.; Chatterjee, P. A rough based multi-criteria evaluation method for healthcare waste disposal location decisions. Comput. Ind. Eng. 2020, 143, 106394. [Google Scholar] [CrossRef]
  13. Mishra, A.R.; Rani, P.; Mardani, A.; Pardasani, K.R.; Govindan, K.; Alrasheedi, M. Healthcare evaluation in hazardous waste recycling using novel interval-valued intuitionistic fuzzy information based on complex proportional assessment method. Comput. Ind. Eng. 2020, 139, 106140. [Google Scholar] [CrossRef]
  14. Mishra, A.R.; Mardani, A.; Rani, P.; Zavadskas, E.K. A novel EDAS approach on intuitionistic fuzzy set for assessment of health-care waste disposal technology using new parametric divergence measures. J. Clean. Prod. 2020, 272, 122807. [Google Scholar] [CrossRef]
  15. Liu, P.; Rani, P.; Mishra, A.R. A novel Pythagorean fuzzy combined compromise solution framework for the assessment of medical waste treatment technology. J. Clean. Prod. 2021, 292, 126047. [Google Scholar] [CrossRef]
  16. Zadeh, L.A. Fuzzy sets. Inf. Control. 1965, 8, 338–353. [Google Scholar] [CrossRef] [Green Version]
  17. Atanassov, K.T. Intuitionistic fuzzy sets. Fuzzy Sets Syst. 1986, 20, 87–96. [Google Scholar] [CrossRef]
  18. Liu, Z.; Xiao, F. An Evidential Aggregation Method of Intuitionistic Fuzzy Sets Based on Belief Entropy. IEEE Access 2018, 7, 68905–68916. [Google Scholar] [CrossRef]
  19. Mishra, A.R. Intuitionistic Fuzzy Information Measures with Application in Rating of Township Development. Iran. J. Fuzzy Syst. 2016, 13, 49–70. [Google Scholar]
  20. Mishra, A.R.; Rani, P.; Pardasani, K.R.; Mardani, A.; Stević, Ž.; Pamučar, D. A novel entropy and divergence measures with multi-criteria service quality assessment using interval-valued intuitionistic fuzzy TODIM method. Soft Comput. 2020, 24, 11641–11661. [Google Scholar] [CrossRef]
  21. Mishra, A.R.; Chandel, A.; Saeidi, P. Low-carbon tourism strategy evaluation and selection using interval-valued intuitionistic fuzzy additive ratio assessment approach based on similarity measures. Environ. Dev. Sustain. 2021. [Google Scholar] [CrossRef] [PubMed]
  22. Chen, L.; Duan, D.; Mishra, A.R.; Alrasheedi, M. Sustainable third-party reverse logistics provider selection to promote circular economy using new uncertain interval-valued intuitionistic fuzzy-projection model. J. Enterp. Inf. Manag. 2021. [Google Scholar] [CrossRef]
  23. Yager, R.R. Pythagorean fuzzy subsets. In Proceedings of the 2013 Joint IFSA World Congress and NAFIPS Annual Meeting (IFSA/NAFIPS), Edmonton, AB, Canada, 24–28 June 2013; IEEE, 2013; pp. 57–61. [Google Scholar]
  24. Rani, P.; Mishra, A.R.; Pardasani, K.R.; Mardani, A.; Liao, H.; Streimikiene, D. A novel VIKOR approach based on entropy and divergence measures of Pythagorean fuzzy sets to evaluate renewable energy technologies in India. J. Clean. Prod. 2019, 238, 117936. [Google Scholar] [CrossRef]
  25. Alrasheedi, M.; Mardani, A.; Mishra, A.R.; Rani, P.; Loganathan, N. An extended framework to evaluate sustainable suppliers in manufacturing companies using a new Pythagorean fuzzy entropy-SWARA-WASPAS decision-making approach. J. Enterp. Inf. Manag. 2021, 35, 333–357. [Google Scholar] [CrossRef]
  26. Yager, R.R. Generalized orthopair fuzzy sets. IEEE Trans Fuzzy Sys. 2017, 25, 1222–1230. [Google Scholar] [CrossRef]
  27. Peng, X.; Krishankumar, R.; Ravichandran, K.S. Generalized orthopair fuzzy weighted distance-based approximation (WDBA) algorithm in emergency decision-making. Int. J. Intel. Syst. 2019, 34, 2364–2402. [Google Scholar] [CrossRef]
  28. Wang, J.; Wei, G.; Wei, C.; Wei, Y. MABAC method for multiple attribute group decision making under q-rung orthopair fuzzy environment. Def. Technol. 2020, 16, 208–216. [Google Scholar] [CrossRef]
  29. Rani, P.; Mishra, A.R. Multi-criteria weighted aggregated sum product assessment framework for fuel technology selection using q-rung orthopair fuzzy sets. Sustain. Prod. Consum. 2020, 24, 90–104. [Google Scholar] [CrossRef]
  30. Mishra, A.R.; Rani, P. A q-rung orthopair fuzzy ARAS method based on entropy and discrimination measures: An Application of Sustainable Recycling Partner Selection. J. Ambient. Intel. Humaniz. Comput. 2021. [Google Scholar] [CrossRef]
  31. Xin, L.; Lang, S.; Mishra, A.R. Evaluate the challenges of sustainable supply chain 4.0 implementation under the circular economy concept using new decision making approach. Oper. Manag. Res. 2021. [Google Scholar] [CrossRef]
  32. Saaty, T.L. Analytic Hierarchy Process; Mc-Graw Hill: New York, NY, USA, 1980. [Google Scholar]
  33. Razaei, J. Best-Worst multi-criteria decision making method. Omega 2015, 53, 49–57. [Google Scholar] [CrossRef]
  34. Pamučar, D.; Stević, Ž.; Sremac, S. A new model for determining weight coefficients of criteria in MCDM models: Full Consistency Method (FUCOM). Symmetry 2018, 10, 393. [Google Scholar] [CrossRef] [Green Version]
  35. Fazlollahtabar, H.; Smailbašić, A.; Stević, Ž. FUCOM method in group decision-making: Selection of Forklift in a Warehouse. Decis. Mak. Appl. Manag. Eng. 2019, 2, 49–65. [Google Scholar] [CrossRef]
  36. Stević, Ž.; Brkovic, N. A Novel Integrated FUCOM-MARCOS Model for Evaluation of Human Resources in a Transport Company. Logistics 2020, 4, 4. [Google Scholar] [CrossRef] [Green Version]
  37. Pamučar, D.; Deveci, M.; Canıtez, F.; Bozanic, D. A fuzzy Full Consistency Method-Dombi-Bonferroni model for prioritizing transportation demand management measures. Appl. Soft Comput. 2020, 87, 105952. [Google Scholar] [CrossRef]
  38. Zhao, H.; Zhang, C. An online-learning-based evolutionary many-objective algorithm. Inf. Sci. 2020, 509, 1–21. [Google Scholar] [CrossRef]
  39. Pasha, J.; Dulebenets, M.A.; Fathollahi-Fard, A.M.; Tian, G.; Lau, Y.; Singh, P.; Liang, B. An integrated optimization method for tactical-level planning in liner shipping with heterogeneous ship fleet and environmental considerations. Adv. Eng. Inform. 2021, 48, 101299. [Google Scholar] [CrossRef]
  40. Dulebenets, M.A. An Adaptive Polyploid Memetic Algorithm for scheduling trucks at a cross-docking terminal. Inf. Sci. 2021, 565, 390–421. [Google Scholar] [CrossRef]
  41. Pasha, J.; Dulebenets, M.A.; Kavoosi, M.; Abioye, O.F.; Wang, H.; Guo, W. An Optimization Model and Solution Algorithms for the Vehicle Routing Problem with a “Factory-in-a-Box”. IEEE Access 2020, 8, 134743–134763. [Google Scholar] [CrossRef]
  42. Theophilus, O.; Dulebenets, M.A.; Pasha, J.; Lau, Y.; Fathollahi-Fard, A.M.; Mazaheri, A. Truck scheduling optimization at a cold-chain cross-docking terminal with product perishability considerations. Comput. Ind. Eng. 2021, 156, 107240. [Google Scholar] [CrossRef]
  43. Rabbani, M.; Oladzad-Abbasabady, N.; Akbarian-Saravi, N. Ambulance routing in disaster response considering variable patient condition: NSGA-II and MOPSO algorithms. J. Ind. Manag. Optim. 2022, 18, 1035. [Google Scholar] [CrossRef]
  44. Liao, H.; Wu, X. DNMA: A Double Normalization-Based Multiple Aggregation Method for Multi-Expert Multi-Criteria Decision Making. OMEGA 2020, 94, 102058. [Google Scholar] [CrossRef]
  45. Nie, S.; Liao, H.; Wu, X.; Tang, M.; Al-Barakati, A. Hesitant Fuzzy Linguistic DNMA Method With Cardinal Consensus Reaching Process for Shopping Mall Location Selection. Int. J. Strateg. Prop. Manag. 2019, 23, 420–434. [Google Scholar] [CrossRef] [Green Version]
  46. Lai, H.; Liao, H.; Šaparauskas, J.; Banaitis, A.; Ferreira, F.A.F.; Al-Barakati, A. Sustainable Cloud Service Provider Development by a Z-Number-Based DNMA Method with Gini-Coeffcient-Based Weight Determination. Sustainability 2020, 12, 3410. [Google Scholar] [CrossRef] [Green Version]
  47. Wang, L.; Rani, P. Sustainable supply chains under risk in the manufacturing firms: An Extended Double Normalization-Based Multiple Aggregation Approach Under an Intuitionistic Fuzzy Environment. J. Enterp. Inf. Manag. 2021. [Google Scholar] [CrossRef]
  48. Liu, P.; Wang, P. Some q-rung orthopair fuzzy aggregation operators and their applications to multiple-attribute decision making. Int. J. Intel. 2018, 33, 259–280. [Google Scholar] [CrossRef]
  49. Peng, X.; Liu, L. Information measures for q-rung orthopair fuzzy sets. Int. J. Intel. Syst. 2019, 34, 1795–1834. [Google Scholar] [CrossRef]
  50. Zhao, W.; Vander Voet, E.; Huppes, G.; Zhang, Y. Comparative life cycle assessments of incineration and non-incineration treatments for medical waste. Int. J. Life Cycle Assess. 2009, 14, 114–121. [Google Scholar] [CrossRef]
  51. Diaz, L.F.; Savage, G.M.; Eggerth, L.L. Alternatives for treatment and disposal of healthcare wastes in developing countries. Waste Manag. 2005, 25, 626–637. [Google Scholar] [CrossRef]
  52. Xiao, F. A novel multi-criteria decision making method for assessing health-care waste treatment technologies based on D numbers. Eng. Appl. Artif. Intel. 2018, 71, 216–225. [Google Scholar] [CrossRef]
  53. Tudor, T.L.; Townend, W.K.; Cheeseman, C.R.; Edgar, J.E. An overview of arisings and large scale treatment technologies for health care waste in the United Kingdom. Waste Manag. Res. 2009, 27, 374–383. [Google Scholar] [CrossRef] [PubMed]
  54. Karagiannidis, A.; Papageorgiou, A.; Perkoulidis, G.; Sanida, G.; Samaras, P. A multicriteria assessment of scenarios on thermal processing of infectious hospital wastes: A Case Study for Central Macedonia. Waste Manag. 2010, 30, 251–262. [Google Scholar] [CrossRef] [PubMed]
  55. Lu, C.; You, J.X.; Liu, H.C.; Li, P. Health-Care Waste Treatment Technology Selection Using the Interval 2-Tuple Induced TOPSIS Method. Int. J. Environ. Res. Public Health 2016, 13, 562. [Google Scholar] [CrossRef] [PubMed] [Green Version]
  56. Rafiee, A.; Yaghmaeian, K.; Hoseini, M.; Parmy, S.; Mahvi, A.; Yunesian, M.; Khaefi, M.; Nabizadeh, R. Assessment and selection of the best treatment alternative for infectious waste by modified Sustainability Assessment of Technologies methodology. J. Environ. Health Sci. Eng. 2016, 14, 10. [Google Scholar] [CrossRef] [PubMed] [Green Version]
  57. Krishankumar, R.; Nimmagadda, S.; Mishra, A.R.; Rani, P.; Ravichandran, K.S.; Gandomi, A.H. Solving renewable energy source selection problems using a q-rung orthopair fuzzy-based integrated decision-making approach. J. Clean. Prod. 2020, 279, 123329. [Google Scholar] [CrossRef]
  58. Kahraman, Y.R. Robust Sensitivity Analysis for Multi-Attribute Deterministic Hierarchical Value Models; (No. AFIT/GOR/ENS/02-10); Air Force Institute of Technology: Wright-Patterson AFB, OH, USA, 2002. [Google Scholar]
  59. Mishra, A.R.; Rani, P.; Pardasani, K.R.; Mardani, A. A novel hesitant fuzzyWASPAS method for assessment of green supplier problem based on exponential information measures. J. Clean. Prod. 2019, 238, 117901. [Google Scholar] [CrossRef]
  60. Ghorabaee, M.K.; Zavadskas, E.K.; Amiri, M.; Esmaeili, A. Multi-criteria evaluation of green suppliers using an extended WASPAS method with interval type-2 fuzzy sets. J Clean. Prod. 2016, 137, 213–229. [Google Scholar] [CrossRef]
  61. Brauers, W.K.M.; Zavadskas, E.K. Robustness of MULTIMOORA: A Method for Multi-Objective Optimization. Informatica 2012, 23, 1–25. [Google Scholar] [CrossRef]
  62. Sałabun, W.; Urbaniak, K. A new coefficient of rankings similarity in decision-making problems. In Proceedings of the 20th International Conference on Computational Science, Amsterdam, The Netherlands, 3–5 June 2020; Springer: Cham, Switzerland, 2020; pp. 632–645. [Google Scholar] [CrossRef]
  63. Bilbao-Terol, A.; Arenas-Parra, M.; Canal Farnandez, V.; Antomil-Ibias, J. Using TOPSIS for assessing the sustainability for government bond funds. Omega 2014, 49, 1–17. [Google Scholar] [CrossRef]
  64. Opricovic, S.; Tzeng, G.H. Compromise solution by MCDM methods: A comparative analysis of VIKOR and TOPSIS. Eur. J. Oper. Res. 2004, 156, 445–455. [Google Scholar] [CrossRef]
  65. Brauers, W.K.M.; Zavadskas, E.K. Project management by MULTIMOORA as an instrument for transition economies. Technol. Econ. Dev. Econ. 2010, 16, 5–24. [Google Scholar] [CrossRef]
  66. Zhu, G.N.; Hu, J.; Qi, J.; Gu, C.C.; Peng, J.H. An integrated AHP and VIKOR for design concept evaluation based on rough number. Adv. Eng. Inform. 2015, 29, 408–418. [Google Scholar] [CrossRef]
  67. Gabus, A.; Fontela, E. World Problems: An Invitation to Further Thought within the Framework of DEMATEL; Battelle Geneva Research Centre: Geneva, Switzerland, 1972. [Google Scholar]
  68. Sajjad, M.; Sałabun, W.; Faizi, S.; Ismail, M.; Wątróbski, J. Statistical and analytical approach of multi-criteria group decision-making based on the correlation coefficient under intuitionistic 2-tuple fuzzy linguistic environment. Expert Syst. Appl. 2022, 193, 116341. [Google Scholar] [CrossRef]
  69. Faizi, S.; Sałabun, W.; Nawaz, S.; ur Rehman, A.; Wątróbski, J. Best-Worst method and Hamacher aggregation operations for intuitionistic 2-tuple linguistic sets. Expert Syst. Appl. 2021, 181, 115088. [Google Scholar] [CrossRef]
Figure 1. Implementation structure of proposed q-ROF-FUCOM-DNMA framework.
Sustainability 14 04171 g001
Figure 2. The comprehensive values of the alternatives for different criteria weight sets.
Sustainability 14 04171 g002
Figure 3. Correlation and similarity design of various models of q-ROF-FUCOM-DNMA with existing models.
Sustainability 14 04171 g003
Table 1. Details of considered criteria HCWT method assessment.
DimensionsCriteriaReferencesType
EnvironmentalGHG emissions (G1)[6,50]Cost
Environmental impact of liquid residues (G2)[6,50,51]Benefit
Environmental impact of solid residues (G3)[6,10,50]Benefit
Energy consumption (G4)[6,50]Cost
Water consumption (G5)[6,10,50]Cost
Volume reduction (G6)[6,10,11]Benefit
Microbial inactivation (G7)[6,9,52]Benefit
EconomicCapital cost (G8)[10,11,53,54,55]Cost
Operation and maintenance costs (G9)[11,53,54,55]Cost
Disposal cost (G10)[6,50]Cost
TechnicalTreatment effectiveness (G11)[9,52,55]Benefit
Automation (G12)[6,10,56]Benefit
Need for skilled operators (G13)[6,10]Benefit
SocialTechnology acceptance (G14)[11,55]Benefit
Cost acceptance (G15)[11,53,54]Benefit
Public acceptance (G16)[10,14,52,55]Benefit
Table 2. Ratings of options and criteria in terms of LVs.
LVsq-ROFNs
Absolutely Significant (AS)(0.95, 0.20)
Very Significant (VS)(0.90, 0.40)
Significant (S)(0.80, 0.60)
Moderately Significant (MS)(0.75, 0.65)
Average (A)(0.60, 0.70)
Moderately Insignificant (MI)(0.50, 0.75)
Insignificant (I)(0.40, 0.80)
Very Insignificant (VI)(0.30, 0.90)
Absolutely Insignificant (AI)(0.20, 0.95)
Table 3. Linguistic decision matrix based on main criteria to assess the HCWT for each DE.
H1H2H3H4H5
G1(S, A, AS)(S, MI, I)(MI, MS, A)(I, MS, A)(A, MI, S)
G2(MI, A, MS)(AI, AI, S)(VI, MI, MI)(VS, VI, I)(MS, MI, MS)
G3(A, VS, A)(MI, S, MI)(MI, I, MI)(MI, I, MI)(I, S, I)
G4(AS, A, MI)(I, A, MS)(MS, MS, VI)(A, MS, S)(S, A, MI)
G5(VI, I, MI)(MI, AS, VS)(AS, I, S)(MI, AI, A)(AI, I, VS)
G6(AI, S, MI)(MS, VI, AI)(VI, A, VI)(MS, AS, VS)(MI, A, MS)
G7(MI, AS, A)(VS, I, MS)(S, MS, VI)(A, A, A)(VS, S, MS)
G8(A, VI, A)(MI, MI, AI)(MS, VS, MI)(MS, MI, VI)(MI, AI, MI)
G9(I, A, VI)(AS, MS, I)(I, VI, MI)(AI, A, AI)(I, MS, VS)
G10(S, MI, I)(VI, VS, AS(A, S, I)(AS, A, AI)(A, VS, I)
G11(A, AI, VI)(MS, MS, MI)(VI, VI, AS)(A, MS, MI)(MS, MI, AI)
G12(A, VI, A)(AI, I, A)(MI, MI, MS)(VI, AI, MS)(MI, VS, A)
G13(VS, MI, A)(S, MS, MI)(I, VI, MS)(I, S, MS)(S, MI, MI)
G14(A, MS, AI)(A, S, MS)(MS, MI, VI)(MS, I, MS)(A, MS, MI)
G15(VI, MI, S)(I, AI, VI)(MI, VI, A)(AI, VS, AS)(VS, MS, A)
G16(MI, A, VS)(MS, MI, S)(VI, MI, I)(S, MI, I)(MI, I, S)
Table 4. The A-q-ROF-DM for HCWT method assessment.
H1H2H3H4H5
G1 0.790064822 , 0.484516642 0.662237401 , 0.73349173 0.65327846 , 0.551088146 0.603790046 , 0.628757526 0.708914052 , 0.492211331
G2 0.618073698 , 0.657171213 0.633399171 , 0.865587596 0.457497196 , 0.726338754 0.751763561 , 0.623522039 0.65798676 , 0.556653376
G3 0.770668319 , 0.556653376 0.661151683 , 0.527203323 0.474945467 , 0.682848504 0.474945467 , 0.630241905 0.641666565 , 0.633929306
G4 0.772147575 , 0.385389603 0.605386825 , 0.553727917 0.642152316 , 0.540275425 0.718823162 , 0.442352602 0.685842444 , 0.516915886
G5 0.422815226 , 0.697004905 0.845687491 , 0.369541624 0.808205763 , 0.403929754 0.508221673 , 0.755184243 0.742426296 , 0.625626843
G6 0.644982966 , 0.63939534 0.554385084 , 0.705633967 0.469515799 , 0.715990397 0.859648797 , 0.346696875 0.618073698 , 0.624699007
G7 0.761185579 , 0.422619537 0.783433855 , 0.478177491 0.700080383 , 0.54402571 0.6 , 0.5933327 0.827449397 , 0.454959106
G8 0.551564473 , 0.653475171 0.454749221 , 0.724217197 0.778562405 , 0.469397026 0.579182639 , 0.705633967 0.456658343 , 0.718594269
G9 0.483180128 , 0.696526026 0.782463746 , 0.377698349 0.424570519 , 0.730461736 0.458917758 , 0.746123262 0.775860799 , 0.662754128
G10 0.662237401 , 0.547871485 0.841632502 , 0.40530276 0.67015198 , 0.558905501 0.76467169 , 0.467137807 0.756843755 , 0.550058511
G11 0.473968153 , 0.751067697 0.656179829 , 0.491202414 0.740976867 , 0.505601239 0.617876284 , 0.58416256 0.576695095 , 0.831804895 ,
G12 0.551564473 , 0.580877131 0.480495214 , 0.726338754 0.59515106 , 0.626223931 0.547623984 , 0.688129373 0.761185579 , 0.523842249
G13 0.772459167 , 0.666410781 0.710102896 , 0.481399445 0.558750146 , 0.797623674 0.696353668 , 0.477908842 0.670893588 , 0.494477777
G14 0.597866623 , 0.705633967 0.717321915 , 0.61915262 0.579182639 , 0.619145237 0.648966993 , 0.51483296 0.617876284 , 0.58416256
G15 0.65091397 , 0.609466203 0.332375746 , 0.792702924 0.511881594 , 0.678495147 0.841153895 , 0.422360158 0.794161981 , 0.491202414
G16 0.765324432 , 0.595733223 0.708914052 , 0.455232336 0.421323781 , 0.758867607 0.662237401 , 0.495393312 0.656348994 , 0.572947475
Table 5. Priorities of criteria for HCWT method assessment.
CriteriaG8G7G6G16G15G1G13G2G11G3G14G9G5G4G10G12
w G j ( k ) 11.21.61.822.12.333.43.844.54.755.87
Table 6. Target values of criteria for HCWT method assessment.
Criteria α j * Criteria α j * Criteria α j * Criteria α j *
G1 0.6 , 0.6 G5 0.3 , 0.8 G9 0.3 , 0.9 G13 0.6 , 0.5
G2 0.5 , 0.6 G6 0.8 , 0.3 G10 0.2 , 0.9 G14 0.4 , 0.7
G3 0.4 , 0.8 G7 0.8 , 0.4 G11 0.5 , 0.7 G15 0.7 , 0.4
G4 0.3 , 0.8 G8 0.9 , 0.2 G12 0.2 , 0.9 G16 0.7 , 0.4
Table 7. Linear normalized ratings for HCWT method assessment.
H1H2H3H4H5
G100.1561720.7507990.8843890.455332
G20.27384410.2695580.5181340.265427
G310.8681820.413150.5431560.638728
G400.3200180.2750890.0968940.209972
G50.74233200.1186340.8211730.351867
G60.6155670.86046310.2857170.667959
G70.2226560.1630030.5873510.265694
G80.13716900.605050.1425360.005203
G90.47505700.5501010.5730670.311701
G100.21653600.2242390.0870090.169778
G110.2483850.77984710.5093720.930054
G120.8118110.5382950.7668680.6386541
G1310.3267050.92390.2822460.192921
G140.46427810.4782090.8052560.635239
G150.3440310.5911460.5125090.406876
G160.5687150.09328210.1621380.310717
Table 8. Vector normalized matrix for HCWT method assessment.
H1H2H3H4H5
G10.802680710.9323050.92807280.98015430.862545
G20.0311718140.1641260.1150870.05833230.014502
G30.0928636820.1961010.14331610.19550790.318579
G40.9548392730.6815480.73582050.87944980.803649
G50.8311567140.957130.98489420.86278810.735423
G60.3453007650.1872290.12746140.04956220.34449
G70.0504588170.0466080.18797910.36584360.013827
G80.564658040.7314620.795640.61330190.723165
G90.6539823160.8273430.73683820.74163760.602327
G100.5659267080.8972080.56637310.77051430.705755
G110.060146930.0370380.0372450.13980380.09565
G120.4493712470.2352320.44228080.32116020.217827
G130.0497399520.0977320.14222780.08769130.05974
G140.0865968190.090680.15765180.08713780.16302
G150.1874514310.1069320.07327970.13574870.064058
G160.0276324470.0109660.04952990.0763960.136512
Table 9. S.D. adjustment factors and weights of criteria for HCWT method assessment.
Criteria σ j w ˜ j σ w ˜ j
G10.1825160.062865260.071
G20.1859250.0640393120.0599
G30.1441870.0496631760.0469
G40.1889280.0650736360.0470
G50.214790.0739814540.0515
G60.2776070.095617790.1005
G70.2285350.0787157860.1051
G80.1542690.0531359750.0946
G90.1465850.0504892750.0434
G100.2301440.0792699340.0481
G110.1851250.0637636890.0563
G120.181480.0625081550.0389
G130.106250.0365962010.0517
G140.0855440.029464340.0352
G150.2452020.0844563970.0843
G160.1462090.0503596190.0686
Table 10. Sub-ordinate values and comprehensive performance values of the HCWT alternatives.
HCWT Options S 1 ( H i ) S 2 ( H i ) S 3 ( H i ) Ψ ( H i ) Rank
H10.4806510.0817230.50307170.1920033
H20.4714370.0946270.50160370.0495044
H30.7593560.0440900.6082620.5080511
H40.5622730.0723350.6347540.3869162
H50.4704000.0938130.47641610.0362465
Table 11. Weight coefficient of flexibility for each criterion.
Criteria α c Criteria α c Criteria α c Criteria α c
G10.079073393G50.057356053G90.048335004G130.057578795
G20.066711215G60.111927832G100.05356944G140.039202584
G30.052232988G71G110.06270186G150.093885733
G40.052344359G80.105356944G120.04332331G160.07640049
Table 12. Sixteen sets of criteria weights for sensitivity investigation.
S1S2S3S4S5S6S7S8S9S10S11S12S13S14S15S16
G10.0790.02160.01790.01410.01040.00670.06250.05870.0550.05130.04760.04390.04020.03640.03270.029
G20.06670.01820.01510.01190.00880.00570.05270.04960.04640.04330.04010.0370.03390.03070.02760.0245
G30.05220.01420.01180.00930.00690.00440.04130.03880.03630.03390.03140.0290.02650.02410.02160.0192
G40.05230.01430.01180.00940.00690.00440.04130.03890.03640.0340.03150.0290.02660.02410.02170.0192
G50.05740.01560.0130.01030.00760.00490.04530.04260.03990.03720.03450.03180.02910.02640.02370.021
G60.11190.03050.02530.020.01480.00950.08840.08310.07790.07260.06740.06210.05680.05160.04630.0411
G700.72720.77420.82120.86820.91520.21020.25720.30420.35120.39820.44520.49220.53920.58620.6332
G80.10540.02870.02380.01880.01390.00890.08320.07830.07330.06840.06340.05850.05350.04850.04360.0386
G90.04830.01320.01090.00860.00640.00410.03820.03590.03360.03140.02910.02680.02450.02230.020.0177
G100.05360.01460.01210.00960.00710.00450.04230.03980.03730.03480.03220.02970.02720.02470.02220.0196
G110.06270.01710.01420.01120.00830.00530.04950.04660.04360.04070.03770.03480.03180.02890.02590.023
G120.04330.01180.00980.00770.00570.00370.03420.03220.03010.02810.02610.0240.0220.020.01790.0159
G130.05760.01570.0130.01030.00760.00490.04550.04280.04010.03740.03470.03190.02920.02650.02380.0211
G140.03920.01070.00890.0070.00520.00330.0310.02910.02730.02540.02360.02170.01990.01810.01620.0144
G150.09390.02560.02120.01680.01240.0080.07420.06970.06530.06090.05650.05210.04770.04330.03880.0344
G160.07640.02080.01730.01370.01010.00650.06030.05680.05320.04960.0460.04240.03880.03520.03160.028
Table 13. Priority order of option with diverse criteria weights and SRCC values (rA).
HCWT S1S2S3S4S5S6S7S8S9S10S11S12S13S14S15S16Final Ranking
H133333333333333333
H244444444444444444
H312222222222222222
H421111111111111111
H555555555555555555
SRCC values0.9111111111111111-
Table 14. Outcomes of the case study by q-ROF-FUCOM-MULTIMOORA method.
HCWTRS MethodRP MethodFM MethodFinal Assessment ValueFinal Rank
S i 1 ρ ( S i 1 ) S i 2 ρ ( S i 2 ) S i 3 ρ ( S i 3 ) I ( H i )
H10.32022150.12144630.17032730.0311245
H20.35092930.12193920.17031240.0766363
H30.36966310.10385740.22307820.1550131
H40.36869820.09143250.22936110.1442962
H50.34649840.12613110.16644850.0488884
Publisher’s Note: MDPI stays neutral with regard to jurisdictional claims in published maps and institutional affiliations.

