Article

Modelling Land Use and Land Cover in the Transboundary Mono River Catchment of Togo and Benin Using Markov Chain and Stakeholder’s Perspectives

by
Sophie Thiam
1,*,
Eric Ariel L. Salas
2,
Nina Rholan Hounguè
3,
Adrian Delos Santos Almoradie
3,
Sarah Verleysdonk
1,
Julien G. Adounkpe
4 and
Kossi Komi
5
1
Center for Development Research (ZEF), University of Bonn, Genscheralle 3, 53113 Bonn, Germany
2
College of Science and Engineering, Central State University C.J. McLin, Rm 210, 1400 Brush Row Road, Wilberforce, OH 45384, USA
3
Department of Geography, University of Bonn, 53115 Bonn, Germany
4
Laboratory of Applied Ecology, Faculty of Agronomic Sciences, University of Abomey-Calavi, Abomey-Calavi P.O. Box 526, Benin
5
Laboratory of Research on Spaces, Exchanges and Human security, Department of Geography, University of Lomé, Lomé 01BP1515, Togo
*
Author to whom correspondence should be addressed.
Sustainability 2022, 14(7), 4160; https://doi.org/10.3390/su14074160
Submission received: 9 March 2022 / Revised: 25 March 2022 / Accepted: 28 March 2022 / Published: 31 March 2022
(This article belongs to the Topic Climate Change and Environmental Sustainability)

Abstract

:
Integrating both modeling approach and stakeholders’ perspectives to derive past and future trends of land use land cover (LULC) is a key to creating more realistic results on LULC change trajectories and can lead to the implementation of appropriate management measures. This article assessed the past changes of LULC in the Mono River catchment using Landsat images from the years 1986, 2000, 2010, and 2020 by performing Machine Learning Classification Method Random Forest (RF) technique, and using Markov chain method and stakeholder’s perspective to simulate future LULC changes for the years 2030 and 2050. LULC was classified as savanna, cropland, forest, water bodies, and settlement. The results showed that croplands and forests areas declined from 2020 to 2050 with decreases of −7.8% and −1.9%, respectively, a modest increase in settlement (1.3%), and savanna was the dominant LULC in the study region with an increase of 8.5%. From stakeholders’ perspective, rapid population growth, deforestation, rainfall variability/flood, urbanization, and agricultural expansion were the most important drivers associated with the observed LULC changes in the area. Other factors, such as lack of political commitment, distance to river, and elevation were also mentioned. Additionally, most the land-use scenarios identified by stakeholders would intensify land degradation and reduce ecosystem services in the area. By considering all of these potential LULC changes, decision-makers need to develop and implement appropriate solutions (e.g., land use planning strategies, reforestation campaigns, forest protection measures) in order to limit the negative effects of future LULC changes.

1. Introduction

Anthropogenic activities have negative impacts on land cover in many catchments in the world. Due to the rapid growth of population and economic development, it is expected that urbanization will expand and land will be used for more economic purposes such as industries and agriculture [1]. From 1960 to 2019, about one-third of land area around the world was affected by various types of land use changes ranging from deforestation to expansion of agricultural lands as well as reforestation [2].
Human-induced land cover change is primarily motivated by the need of the communities to grow economically. However, this change may also have consequences on the environment, especially on hydrological processes [3]. For example, the change of land use from forest to farmland in a catchment can affect run-off and consequently soil water retention, causing severe flooding [4,5]. Appollonio et al. [6] has demonstrated a strong link between flooding areas and land-use changes, and showed that urbanization growth is a significant driver of flood areas expansion. This can also exacerbate other hazards such as landslides, erosion, and droughts. Consequently, impacts on infrastructures, food systems, health, biodiversity, and livelihoods will be intensified [7]. On the other hand, the current and projected pattern of climate extremes can affect land cover, trigger land degradation and intensify the likelihood, the magnitude, and associated damages of hazards in a feedback loop system [8]. Moreover, the scenario of a 1.5 °C global warming would make 178 million people vulnerable to water stress and habitat degradation, with the highest number in Asia and Africa [9].
The republics of Benin and Togo in West Africa experience recurrent flooding almost every year with an increasing magnitude. One of the most devastating floods was in the year 2010. It struck 55 of 77 towns in Benin, affecting 680,000 people, killing 46 people, and causing agricultural losses of more than USD one million; whereas in Togo, more than 5.9 million people were affected by the extreme flood event [10]. The flood in Togo caused estimated damage of $38 million (ca. 1.1% of the national Gross Domestic [11]. In 2019, flood events in the Mono River catchment of Benin and Togo affected about 50,000 people in the two riparian countries, causing damages to roads, health centers, and other public infrastructures in the Lacs prefecture in Togo and in the districts of Athiémé, Grand-Popo, and Lokossa in Benin [12]. This increase in flood hazards in the Mono River basin may be attributed to the changes in climate and land use/cover, as well as population growth [13,14]. Using the impact chain methodology to understand drivers of flood risks in the lower Mono River catchment, Wetzel et al. [15] found out that the drivers attributed to land-use change and population growth are “the destruction of ecosystem and soil degradation” and “use of land for agriculture”. Indeed, land use has become important in the management of transboundary catchments, especially in response to natural hazards and to develop appropriate adaptation strategies [16]. Because water and flood have no boundaries, land use and practices in one part of the catchment can affect other parts for instance in terms of water availability, water quality, sedimentation, soil erosion, and soil degradation [17]. Consequently, a lack of transboundary land use planning and management at the catchment scale can affect agriculture, food production, water security, hydropower energy production and thereby, exacerbate human pressure on natural resources like water and forests [18,19]. Therefore, to investigate and understand the future dynamics of flood hazards in the Mono River catchment, there is a need to develop land use land cover change scenarios, which will be used to simulate flooding in the area.
Various research methodologies on deriving past and future land use land cover (LULC) changes have been developed to support decision-makers on urban development, disaster risk and environmental management, and resource planning. In this study, we combined the CA-Markov chain model and the stakeholders’ perspective to derive future land use land cover changes. An important aspect of our case study is considering stakeholders’ perceptions and knowledge in order to identify LULC drivers, potential transitions, and scenarios in the region. Indeed, involving stakeholders during scenario development is key to achieving holistic results on a participatory basis. Stakeholders’ information is critical in LULC change modeling processes [20]. Their insights on land cover changes, drivers, reconstruction of major past events timelines, and their perspective on potential future land-use change trajectories, can support and complement models’ outputs [21]. Furthermore, stakeholders’ engagement in identifying land use changes and modelling helps to close the gap between perspectives from practitioners and technical or policy-oriented stakeholders [22], in order to design a consensual overview of past and upcoming change patterns. Therefore, the main objective of this article is to derive past and future land-use change information for the Mono River catchment by using the machine learning classification method Random Forest (RF) to determine past LULC changes for the years 1986, 2000, 2010, and 2020, and by combining the Markov chain method with stakeholder inputs to predict future LULC changes for the years 2030 and 2050.

2. Materials and Methods
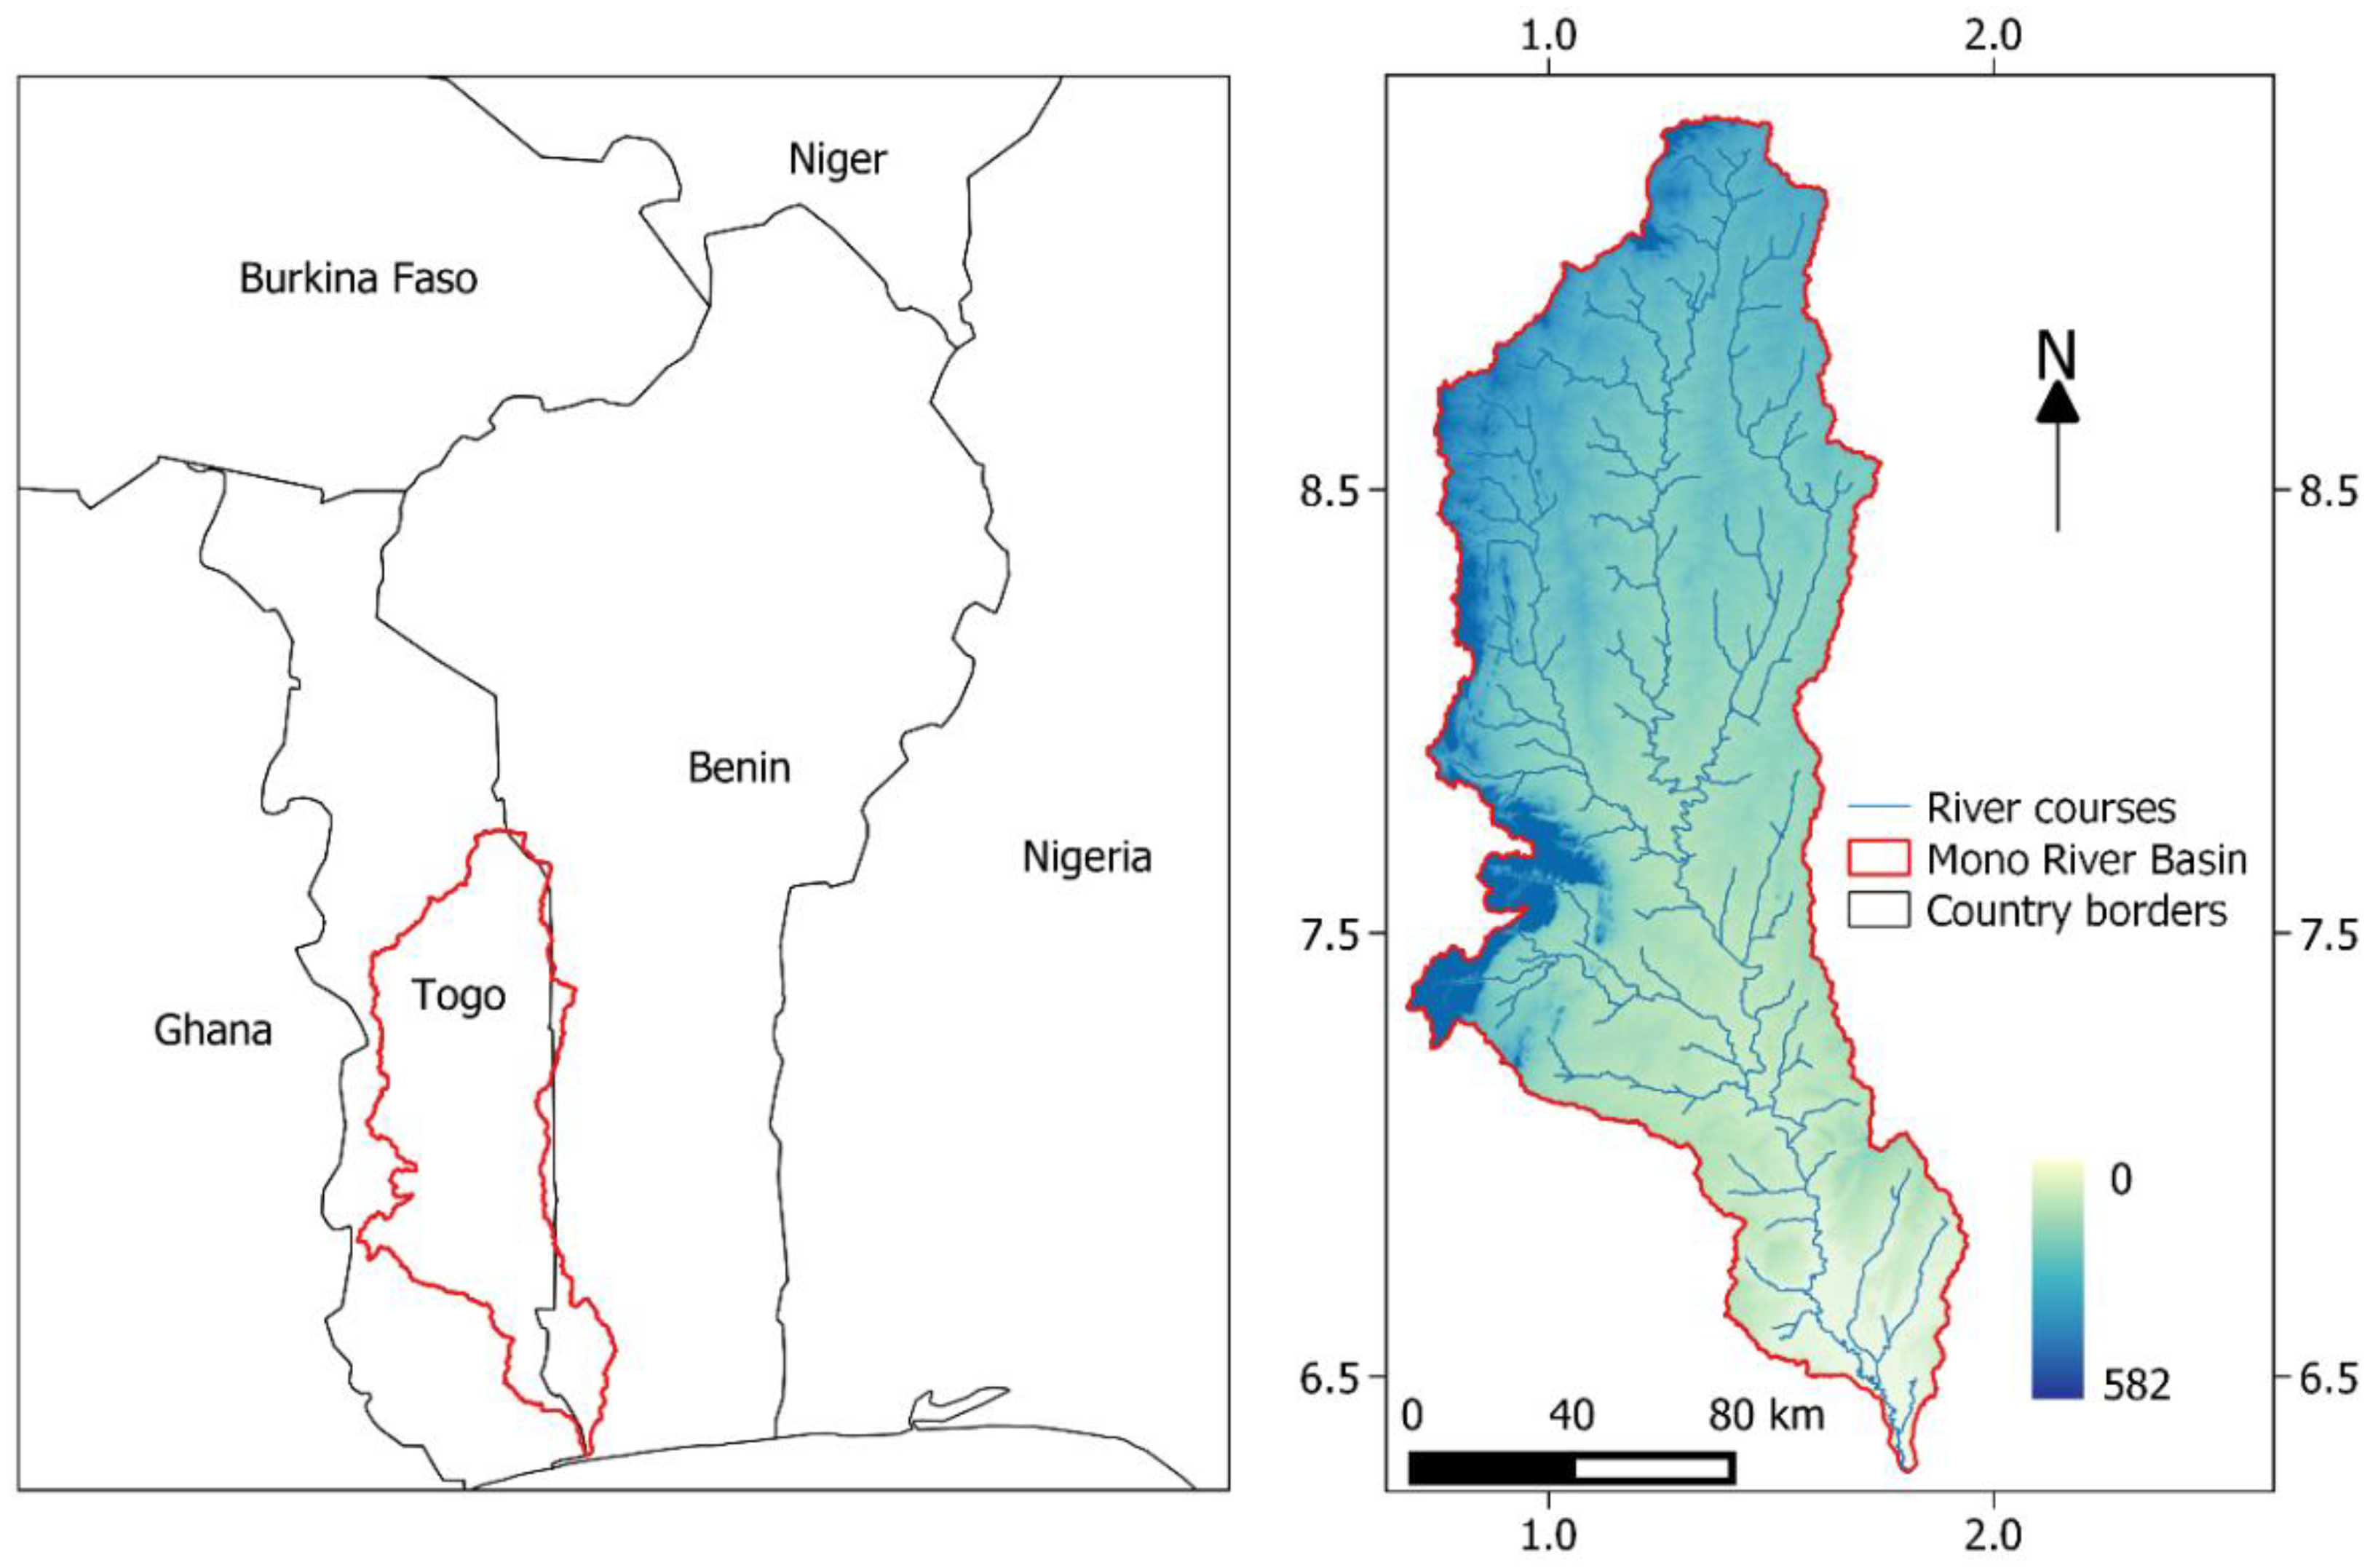
2.1. Study Area

The Mono River basin is located in West Africa and is shared by the Republics of Benin and Togo. It lies within latitudes 6.28° N and 9.35° N, and longitudes 0.68° E and 1.95° E (Figure 1). It covers an area of 23,736.64 Km2 of which 89.2% lies in Togo. The remaining 10.8% in Benin are mainly located in the southern part and downstream of the basin. There are two climatic zones within the basin: a sub-equatorial zone with two rainy seasons and two dry seasons in the southern part, and a tropical zone characterized by one dry and one rainy season. In the last 30 years, an average of 1200 mm of precipitation per year has been recorded in the basin, while the average annual temperature ranges between 26 °C and 28 °C.
The vegetation is mainly made of grasslands, savanna, and forests. Furthermore, soil textures found in the basin are sandy, loam, and clay. Main economic activities consist of small-scale farming, fishing, small trades, and livestock breeding. The basin is of great importance for both countries because it hosts the mutually owned Nangbeto hydroelectric dam. In addition, the valley of the river contributes to food production, and the recurrent flood events experienced at the downstream of the Nangbeto dam have become more frequent and intense over the past years. Moreover, the Mono River basin covers about 35% of Togo’s territory.

2.2. Data Source and Processing

The USGS Earth Resources Observation and Science (USGS EROS) repository (https://glovis.usgs.gov/) (accessed on 18 May 2020) provided the level-one terrain-corrected Landsat image collection (Table 1) for our goal of detecting gradual change over a three-decade span (USGS, 2020). Landsat has a nominal ground pixel size of 30 m. Scenes with a minimal cloud cover (<5%) were chosen and captured within the time period of interest, January to March. This dry period is ideal for distinguishing cropland classes from the images.
In addition, different drivers of land-use changes (elevation, slope, distance to river, and population data) were chosen for the land-use modeling. The digital elevation model (DEM) (30 m × 30 m resolution) was obtained from the USGS web repository. Elevation and slope were derived from DEM using ArcGIS. Distance to the river was generated using the Euclidian distance module in ArcGIS, and the population data were obtained from World Population Review (http://worldpopulationreview.com/) (accessed on 20 February 2021).

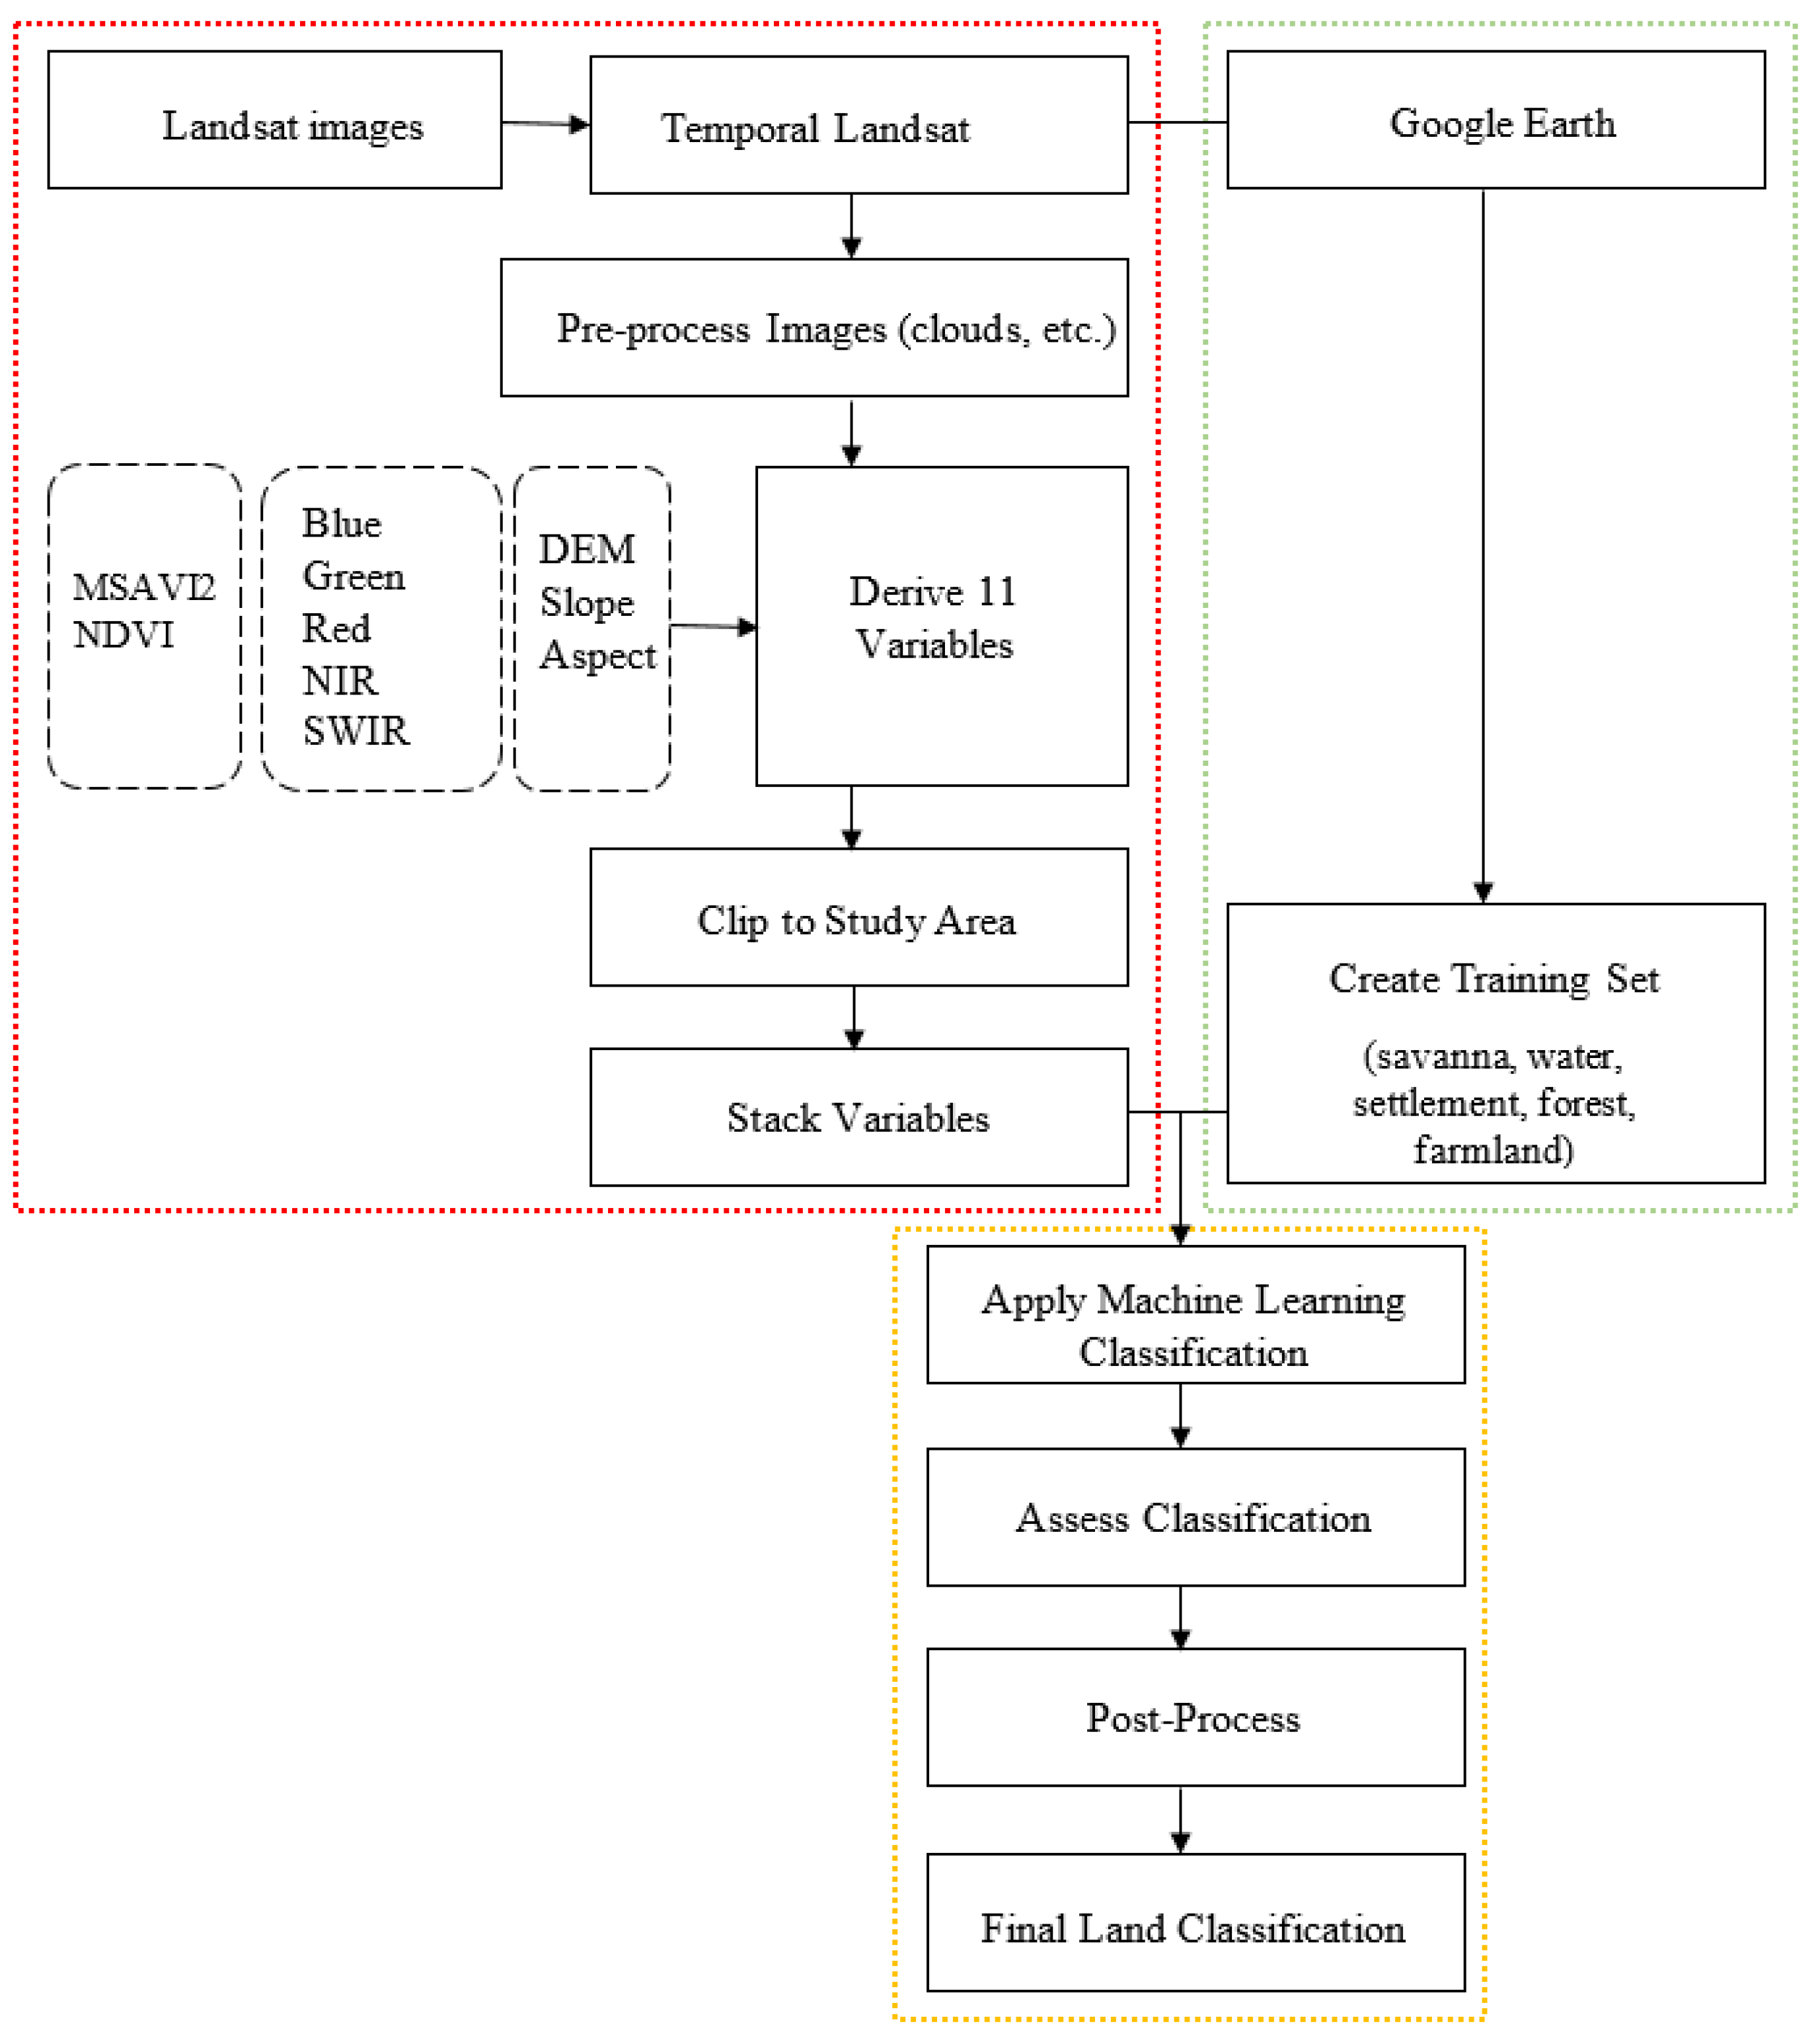
2.2.1. Image Processing

Spatial information on the evolution of land-use change over the past decades provides a better understanding of the future scenarios of landscapes. This helps to better identify and understand the factors that influence the change in land-use. In this case study, the past thirty-five years were investigated to understand the change in land-use. Landsat images from 1986, 2000, 2010, and 2020 were used to identify land-use patterns.
Pre-processing is essential prior to utilizing satellite images for land use/land cover maps in order to remove inherent noise that could have negative impacts on the classification and the scene-to-scene comparisons over time [23]. The Landsat images were normalized by converting the measured digital number (DN) values to top of atmosphere (TOA) reflectance. Normalization removed variations between images caused by sensor differences, Earth-sun distance, and solar zenith angle. All images were screened of cloud patches and cloud shadows to ensure that they were devoid of hitches that could result in false classification. To determine the existence of clouds and cloud shadows, define their presence, and mask them out from the classification, we performed visual and/or spectral analyses. All image processing steps were done using the ENVI and ArcMap software.
The classification of land-use images was processed by combining both conventional and novel methods. The methodological steps (Figure 2) are the (a) pre-processing of data sets using spectral images Modified Soil Adjusted Vegetation Index 2 (MSAVI2) and Normalized Difference Vegetation Index (NDVI), the use of Landsat bands red, blue, green (RBG), Near Infra-Red (NIR), SWIR 1, and SWIR 2 and topographic dataset DEM, slope, aspect, (b) creating the training data sets for the five classes using Google Earth, (c) application of RF algorithm machine learning classification method, (d) accuracy assessment using the confusion matrix, and (e) post-processing to produce the final land-use maps.

2.2.2. Predictors

Spectral and topographic datasets were combined as predictors in the classification models. For example, DEM, slope, and aspect have been shown to improve land feature discrimination and classification accuracy and as such, it is recommended for image classification [24]. Two spectral indices such as MSAVI2 (Equation (1)) and NDVI (Equation (2)) were selected for the classification since they proved to be ideal for vegetation sensitivity and soil noise reduction using Landsat images [25,26]. In addition, individual bands (blue, green, red, NIR, SWIR 1, and SWIR 2) were added to the models since they have the potential to discriminate similar spatio-temporal phenomena, thus improving the separability of land use classes [27]. A total of 11 variables were stacked and used to run our classification models.
MSAVI 2 = ( 2 NIR + 1 ( 2 NIR + 1 ) 2 8 ( NIR Red ) ) 2
NDVI = ( NIR     Red ) ( NIR + Red )

2.2.3. Machine Learning Classification and Assessment

LULC maps were produced by using the five defined land use classes in Table 2 and a pixel-based RF classification technique through the capabilities of the QGIS software. RF is a machine learning approach that assigns a class to a response variable by using an ensemble of regression or classification trees. Several remote sensing studies have shown the RF algorithm to perform satisfactorily for LULC classification [28]. Further, RF is resistant to outliers and overfitting induced by an excessive number of training points and a strong method for dealing with non-normal crop species and rotation patterns [29].
In order to perform RF, high-quality samples were extracted from Google Earth and each class label was visually interpreted (Table 2) using spectral profiles. These samples served as regions of interest (ROI) for the RF classification process. Each ROI was assigned to a specific LULC class. Approximately, two-thirds of the samples were utilized for training, with the remaining third being used for internal model validation. The number of decision trees was an important parameter that ensured more accurate model results. In this study, the parameter was set to 100 decision trees, which was sufficient for our classification and also reduced the calculation time. Five land use classes were used in the classification: savanna, water, settlement, forest, and cropland (Table 2). The choice of these five classes follows the trend of previous studies in the region, which used similar classes [30,31,32].
The classified images were post-processed using a three by three window filter to smooth isolated pixels. To validate the efficacy of the classification, we generated the classification error matrix [33]. The conventional accuracy metrics such as user accuracy (UA), producer accuracy (PA), overall accuracy (OA), and kappa statistics (KA) were used to evaluate the model performance (Appendix A, Table A1).
After the LULC classification, the intensity analysis was conducted to determine the variation of the categories’ gains and losses for each time interval [34]. The change in terms of loss (Lij) and gain (Gij) for the three-time intervals was calculated using Equations (3) and (4) [35,36].
L ij   =   ( P i P ii   ) ( P j j = 1 P j ) , where   i     j
G ij   =   ( P j P jj ) ( P i i = 1 P i ) ,     where   i     j
where Lij is the proportion of loss from category i to j under random processes of loss; and Pii is the proportion of the category i that showed persistence between the two times; Gij is the proportion of gain from category i to j, Pj is the proportion of the landscape in category j in the final time; Pjj is the observed persistent proportion of the category j; Pi is the total area of category i at initial time.

2.3. Land Use Scenarios Development and Model Implementation

The simulation of land-use changes gives useful information for the design, evaluation, and implementation of effective spatial plans and strategies against disaster risks [37]. It has been increasingly considered in risk management as well as other causes such as climate change impacts [38]. In this study, land use scenarios were developed to visualize prospective changes in land use land cover in order to cope with future land use and climate change impacts in the study area. The Mono River catchment’s LULC maps for 2030 and 2050 were predicted using a participatory approach and the CA-Markov chain model embedded in the Land Change Modeler (LCM) component in IDRISI 20. The CA-Markov chain model is a widely used model in which the state of one future system may be anticipated based on its prior state and the possibility for transmission [39]. Its widespread use in land-use change modeling stems from its ability to determine not only the various states of different land uses, but also the rate of transition between them [39]. CA-Markov chains were proven to be a useful operational model for anticipating future LULC scenarios [40,41]. In such simulations, a variety of driving forces can be applied, including infrastructural and socio-economic drivers (road network and human settlement), as well as terrain physical drivers (elevation, slope, soil properties, etc.). The main steps for the simulations were: change analysis, land use scenarios based on stakeholder knowledge, identification of drivers and probable transitions, model validation, and prediction [42].

2.3.1. Land Use Scenario Workshop

This study also used a participatory approach to investigate stakeholders’ awareness of land-use changes, drivers, and potential transitions in the Mono River catchment in the coming decades. Many studies have recently applied this approach to develop land-use scenarios, by incorporating local knowledge and awareness [43,44,45]. In our case study, a virtual workshop was conducted in January 2021 with stakeholders in order to get their perspectives on how land use could look like in the area from now to 2050 and what might be the causes of those changes. Around 30 stakeholders from different institutions of both Benin and Togo (e.g., ministries, researchers, NGOs, and local authorities) participated. An online software named Mentimeter was used to create surveys and interactive presentations with the stakeholders. They were asked to identify the following: (1) drivers of LULC changes observed in the catchment, (2) potential changes (increase, decrease, or consistency) for each land use, and (3) potential land-use transitions/scenarios (e.g., deforestation, afforestation, settlement expansions) as well as their feasibility. As a result of the stakeholders’ examination and ranking of drivers and potential scenarios, a final set of land-use scenarios and their applicability in the area were determined.

2.3.2. Identification of Drivers and Probable Transitions

In the modeling of land-use change, a list of potential explanatory variables was identified based on the literature and the stakeholders’ knowledge as mentioned in the previous section. From there, Cramer’s coefficient has been applied to test the power of each explanatory variable for simulating LULC changes. This coefficient is provided by LCM and it serves as a reference for determining whether or not a driving factor is worth considering [46]. A Cramer’s coefficient of less than 0.15 indicates that this variable is not useful in describing the changes, and can be rejected. On the other hand, a value greater than 0.4 indicates that the independent variable has a great capability to describe the LULC changes [46,47].
For identifying transitions, LCM creates a number of potential maps that occur in transitions into empirically tested transition sub-models. In order to select the transition sub-model with the highest accuracy, the model must be run several times with different scenarios of land cover transitions [48]. In our case, the land cover transitions were chosen and grouped into three sub-models. These were the transitions that covered more than 3000 hectares and were declared feasible by the stakeholders.
Results from the change analysis for the period 2010–2020 were used as input data to compute the transition probabilities for each LULC type. A Multi-Layer Perceptron (MLP) neural network was used to calculate the transition probabilities [49]. This method has been applied and shown in various studies to be a useful and effective technique for LULC prediction [30,47,50]. Then, after generating the LULC transition potential layer for the period 2010–2020, we applied the Markov chain analysis to predict LULC for the next 30-year period (2020–2050).

2.3.3. Model Validation

The validation process is a procedure that assesses the quality of the predicted LULC map against the reference LULC map [51]. In this study, the LULC maps of the years 2000 and 2010 were utilized to calibrate LCM and predict the LULC map of 2020 for the validation process. First, a three-way comparison between the later LULC map (2010), the predicted LULC map (2020), and the observed LULC map (2020) was run using the validation module of the LCM model. In addition, the Kappa Index of Agreement (KIA) between the predicted 2020’s LULC map and observed 2020’s LULC map was performed to assess the accuracy of the model. The following Kappa variables were used in this study: Kno, Klocation, and Kstandard. The Kappa Kno denotes the overall accuracy of the simulation run, Klocation denotes the level of agreement of location, and Kstandard is the ratio of inaccurately allocations by chance to the correct assignments [52,53,54]. For a thorough evaluation of the model’s overall accuracy in terms of location and quantity, a combination of Kno, Klocation, and Kstandard scores is used. According to Zadbagher et al. [55], a LULC model is considered valid if the Kstandard is greater than 70%. Thus, after demonstrating our model’s capacity to predict LULC map 2020 using LULC maps from 2000 and 2010, the same simulation process was adopted to predict the LULC maps of 2030 and 2050 using 2010 and 2020 maps.

3. Results

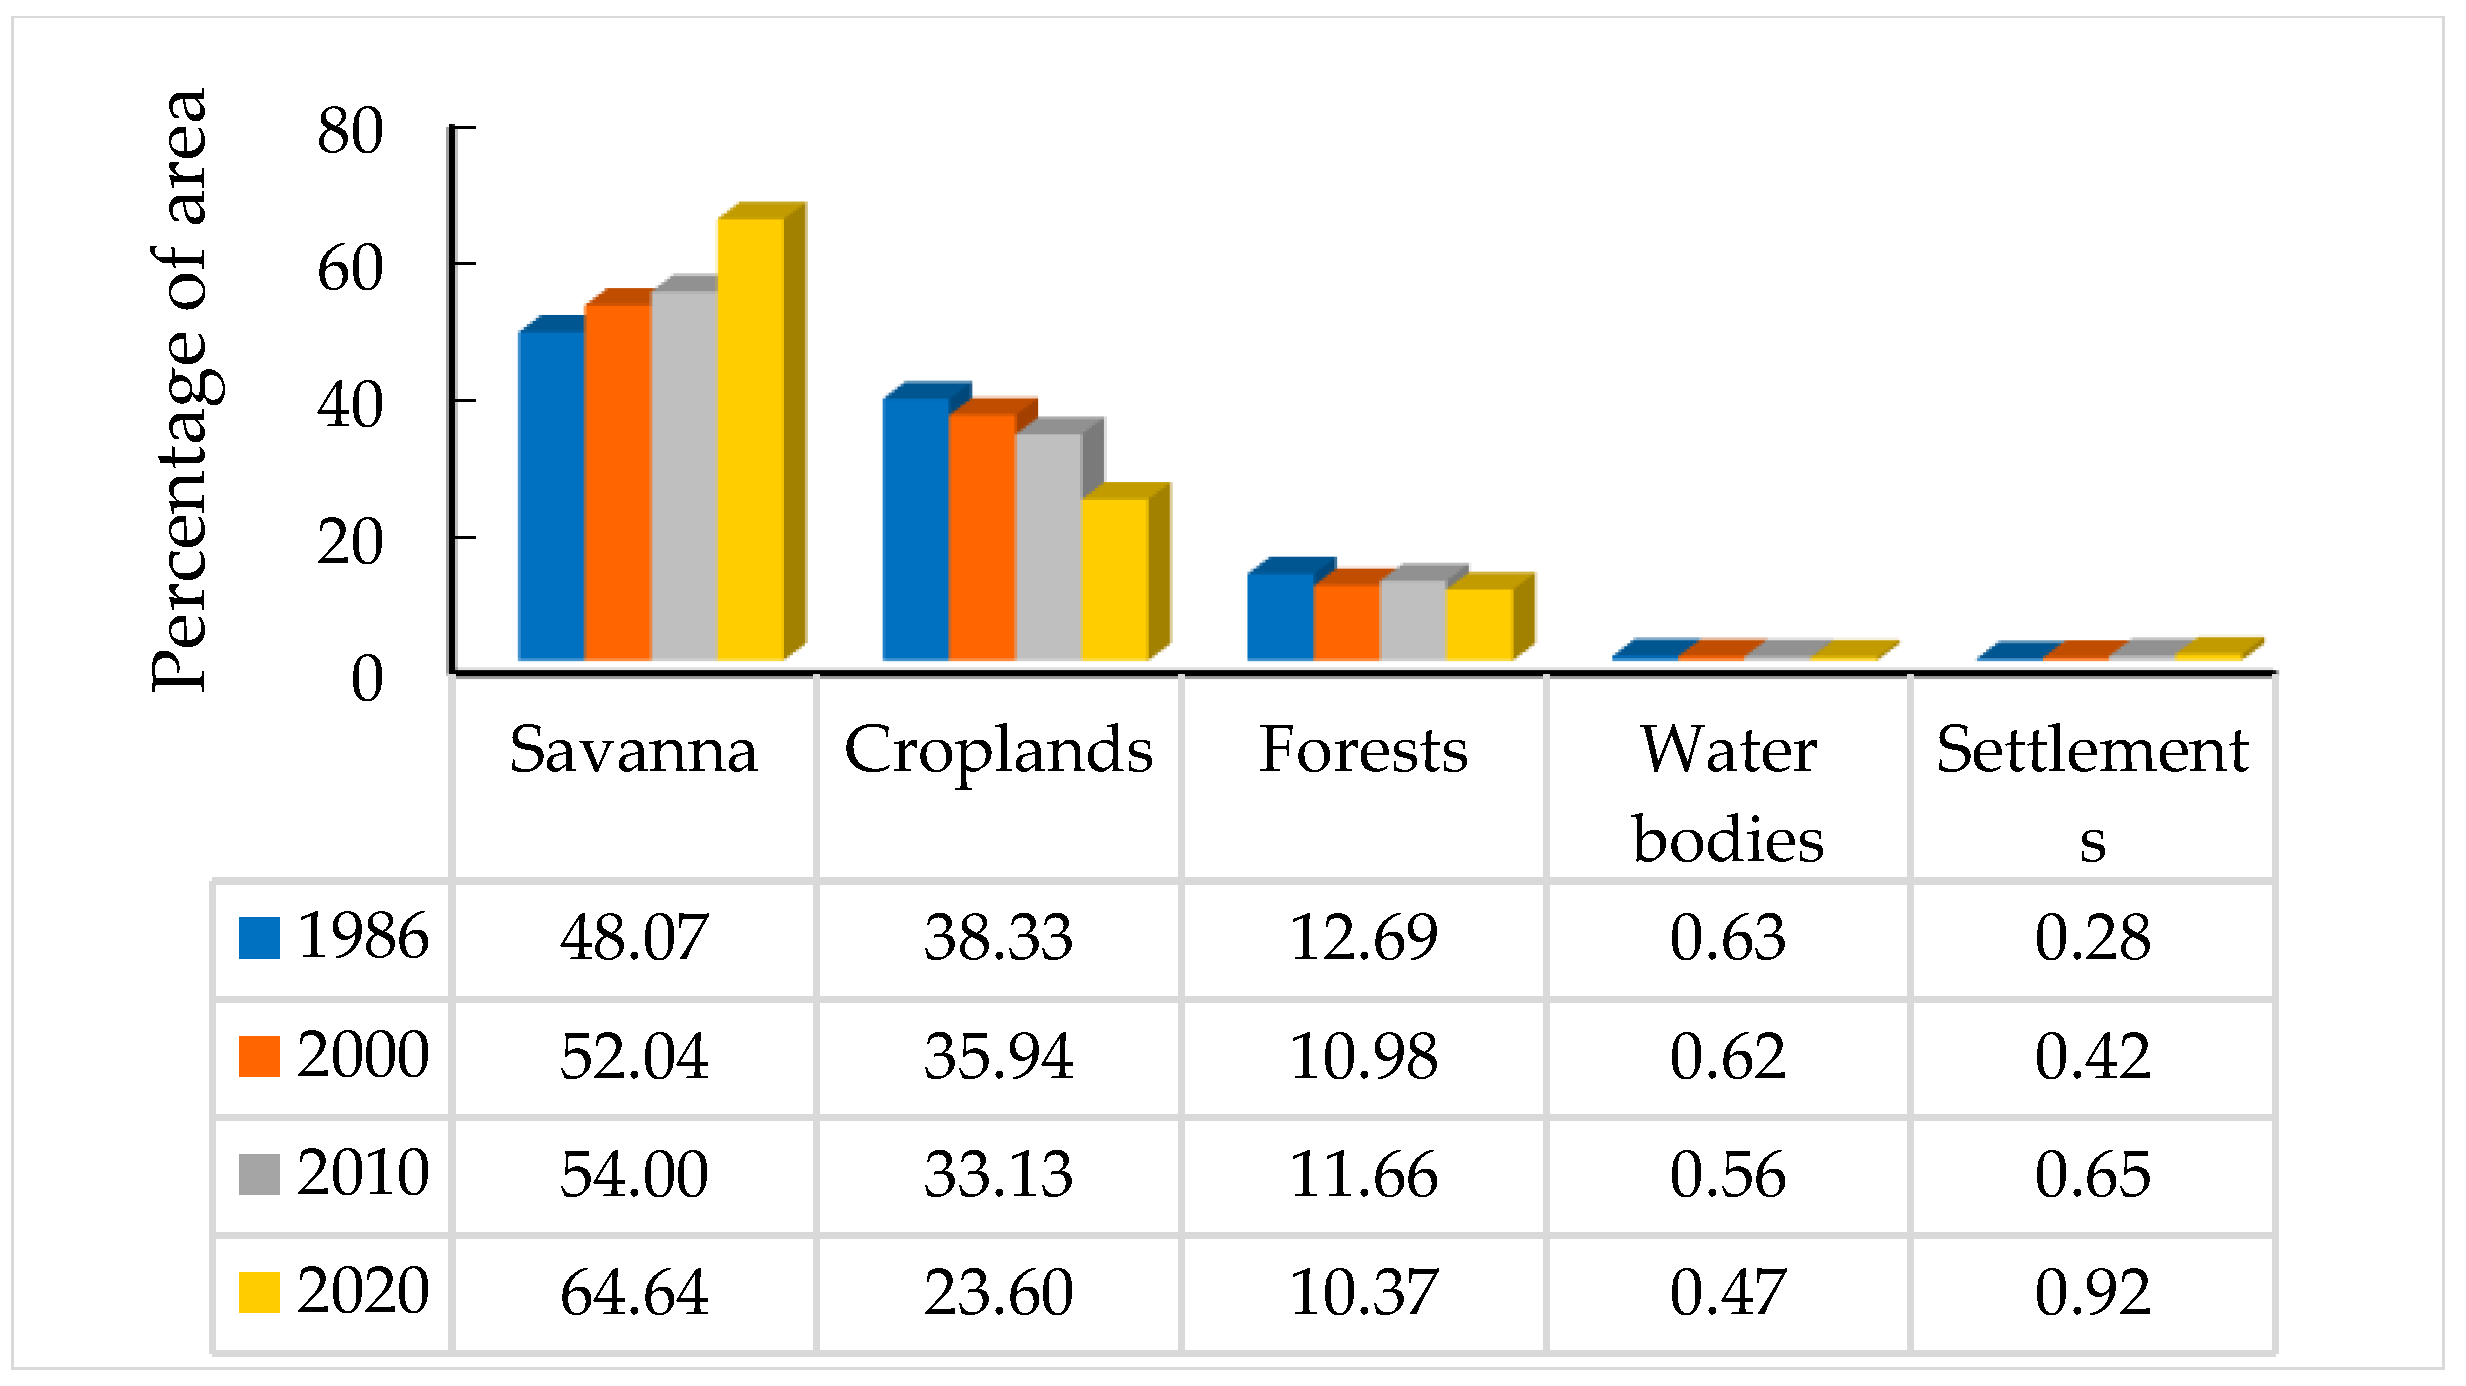
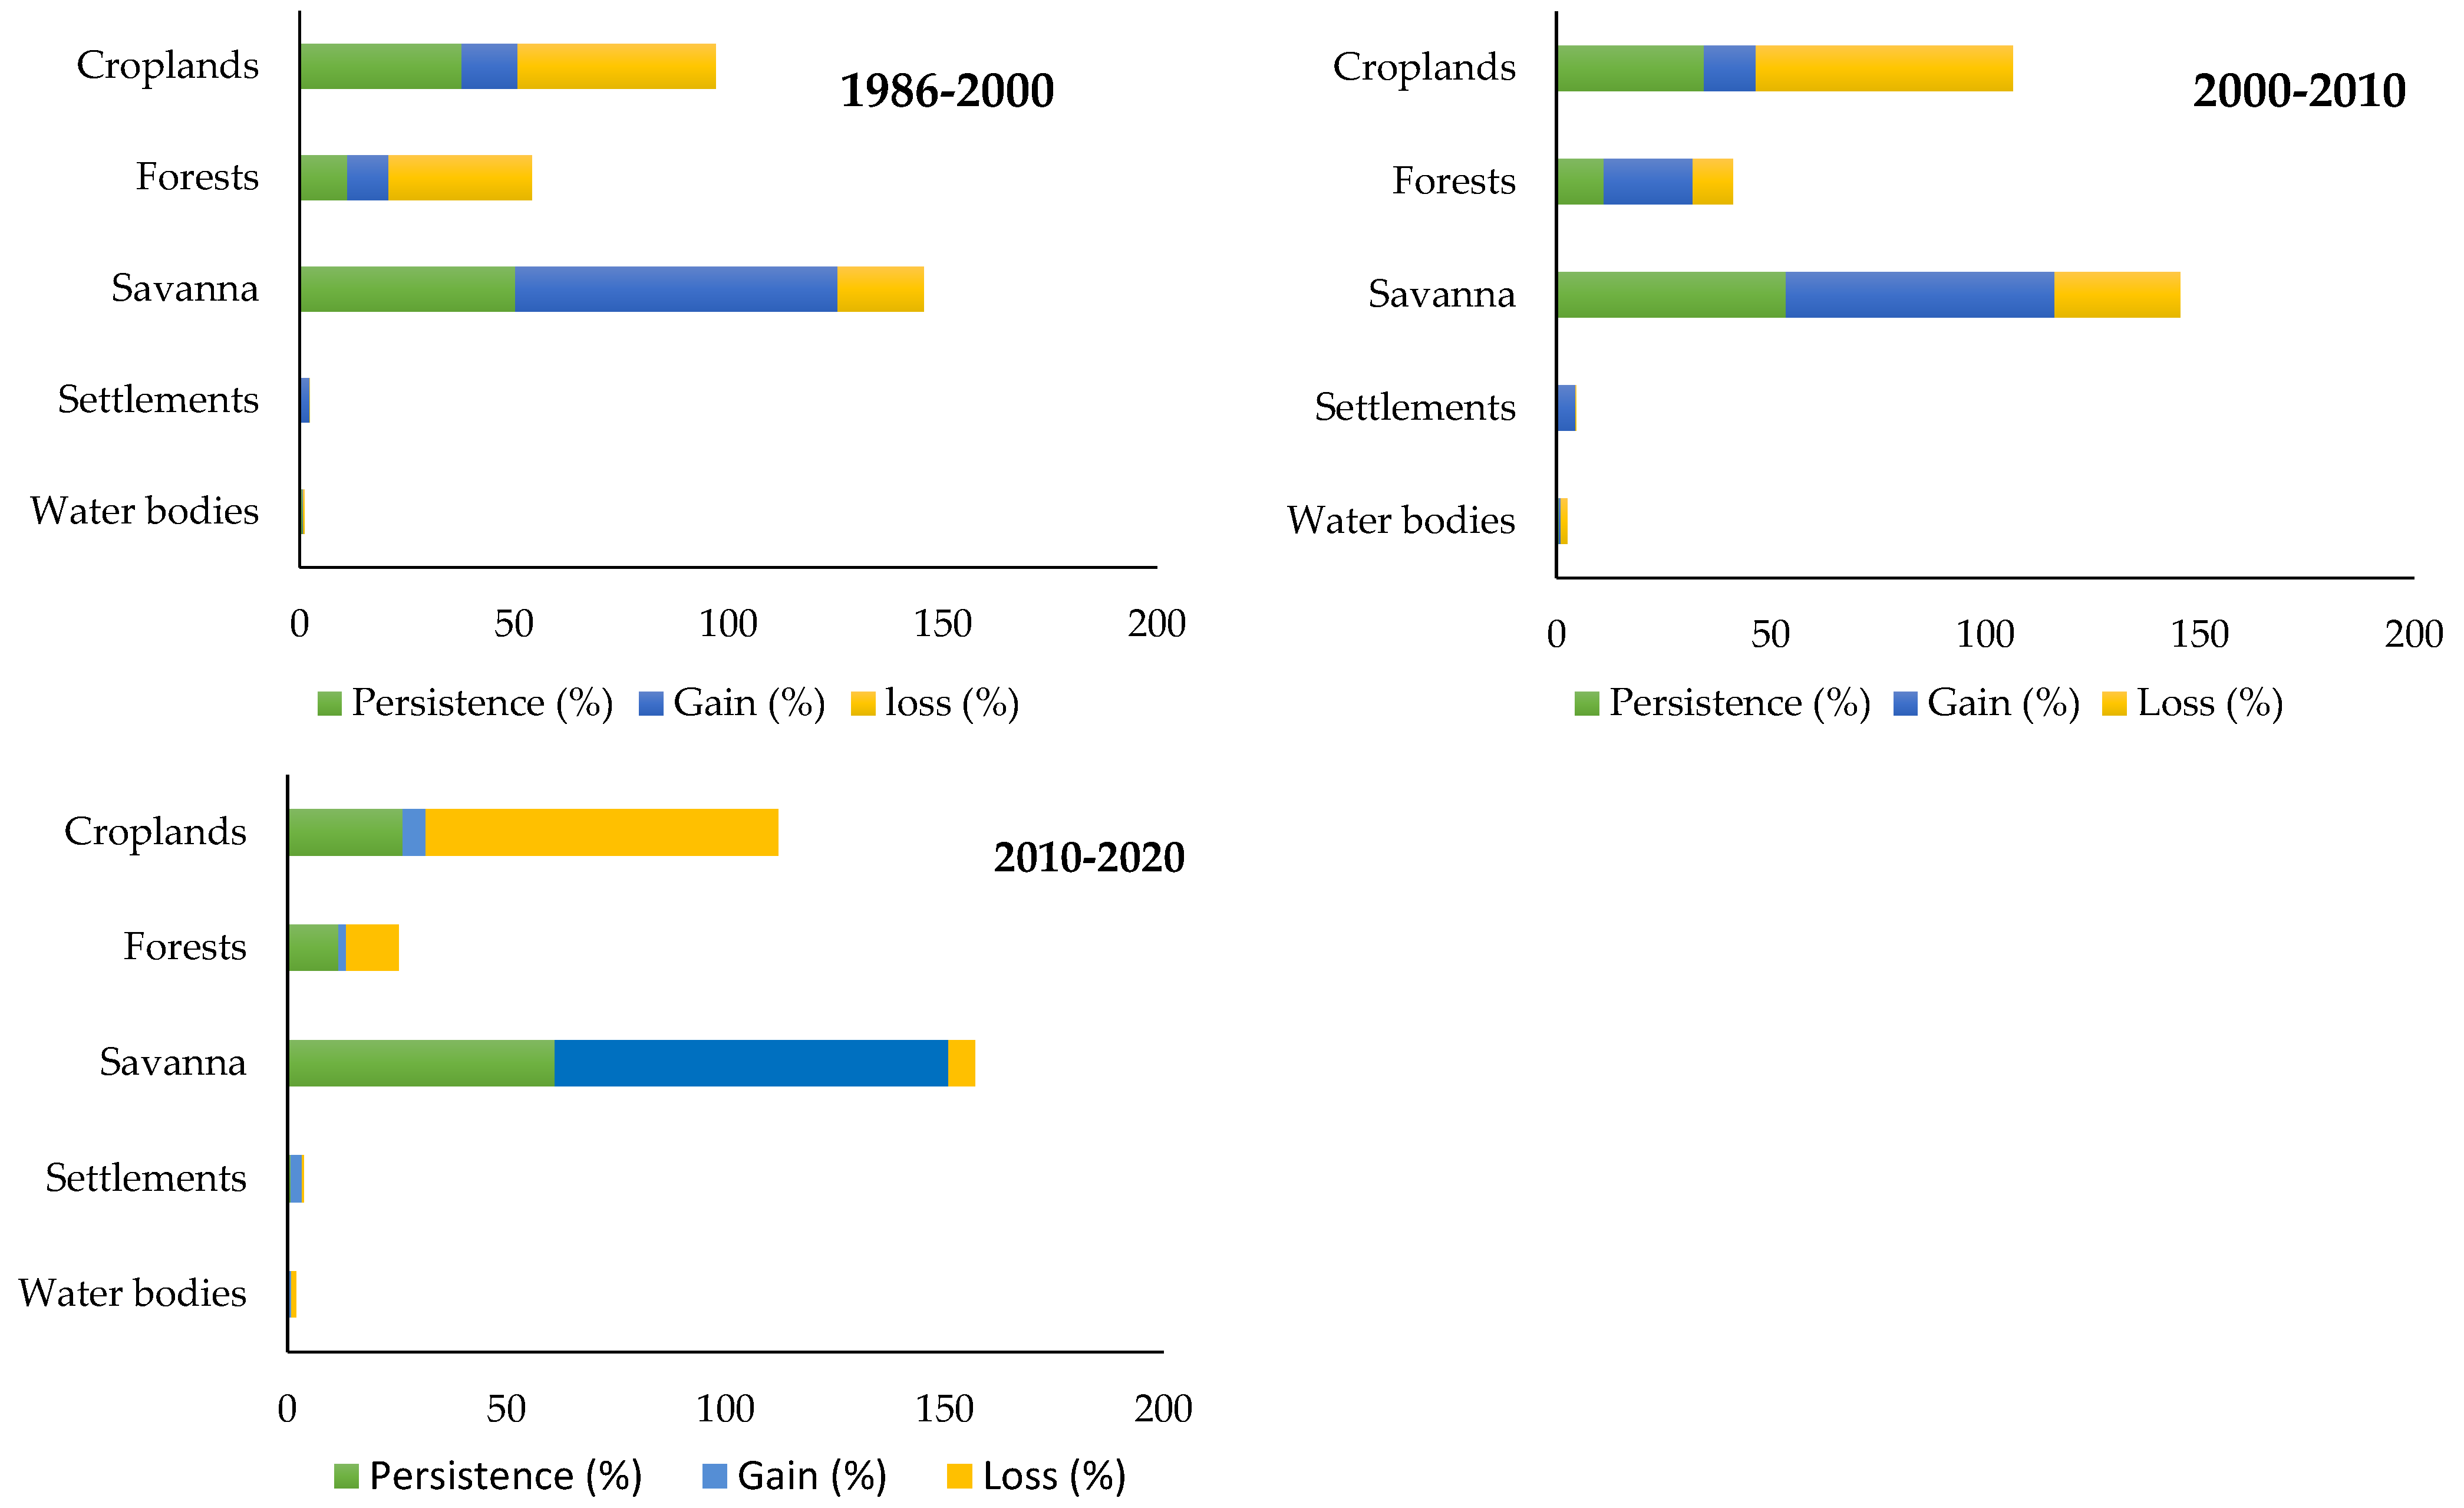
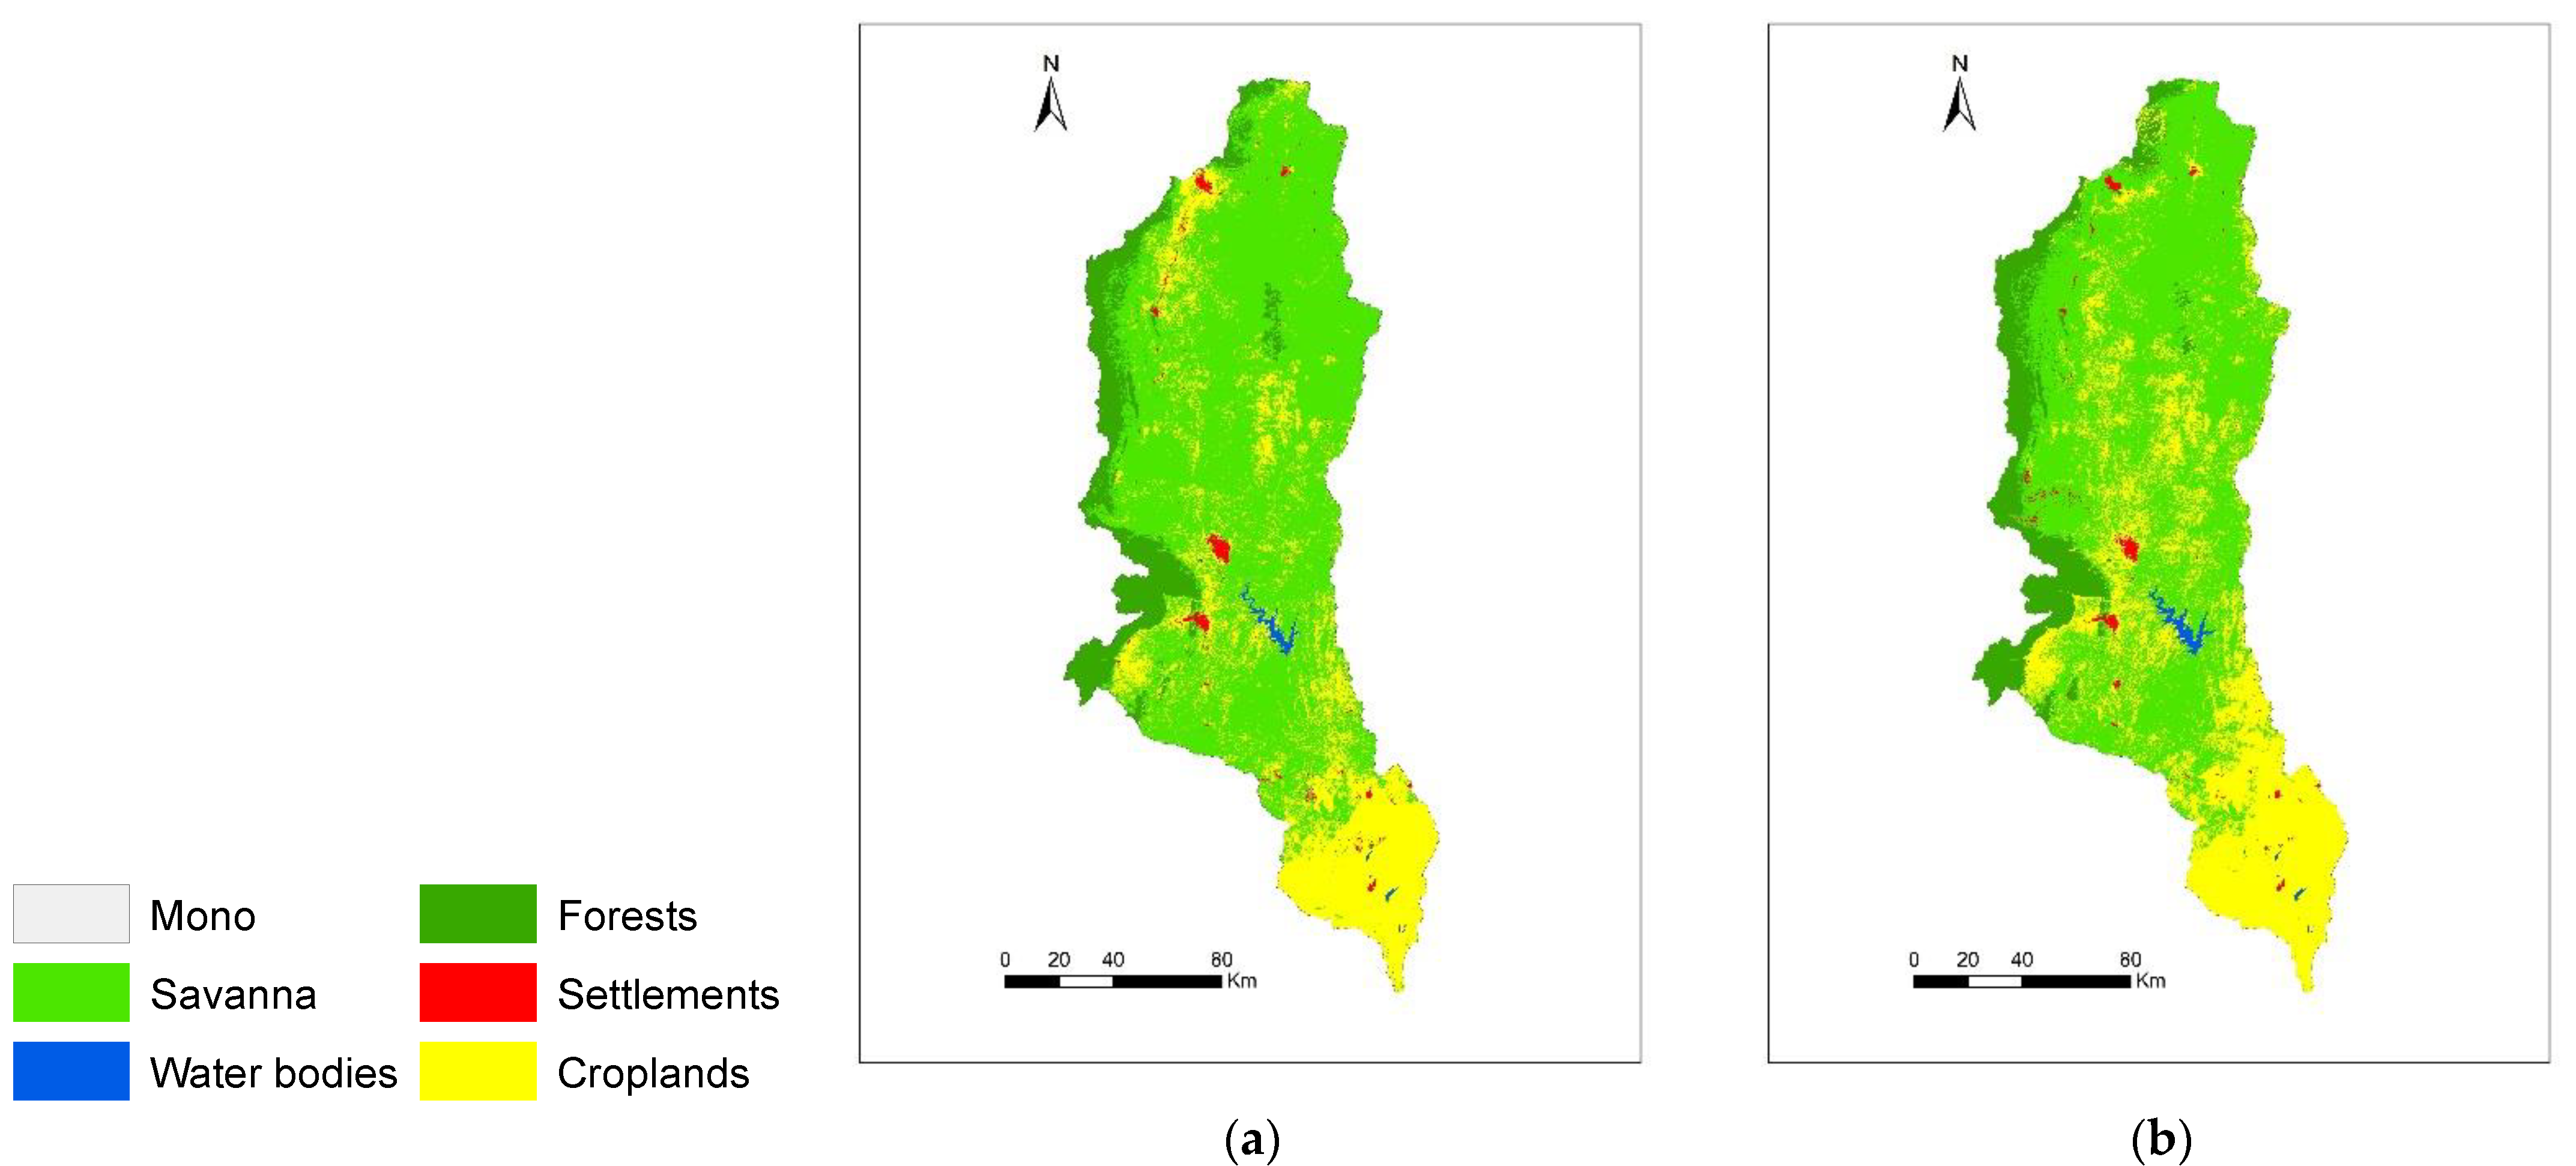
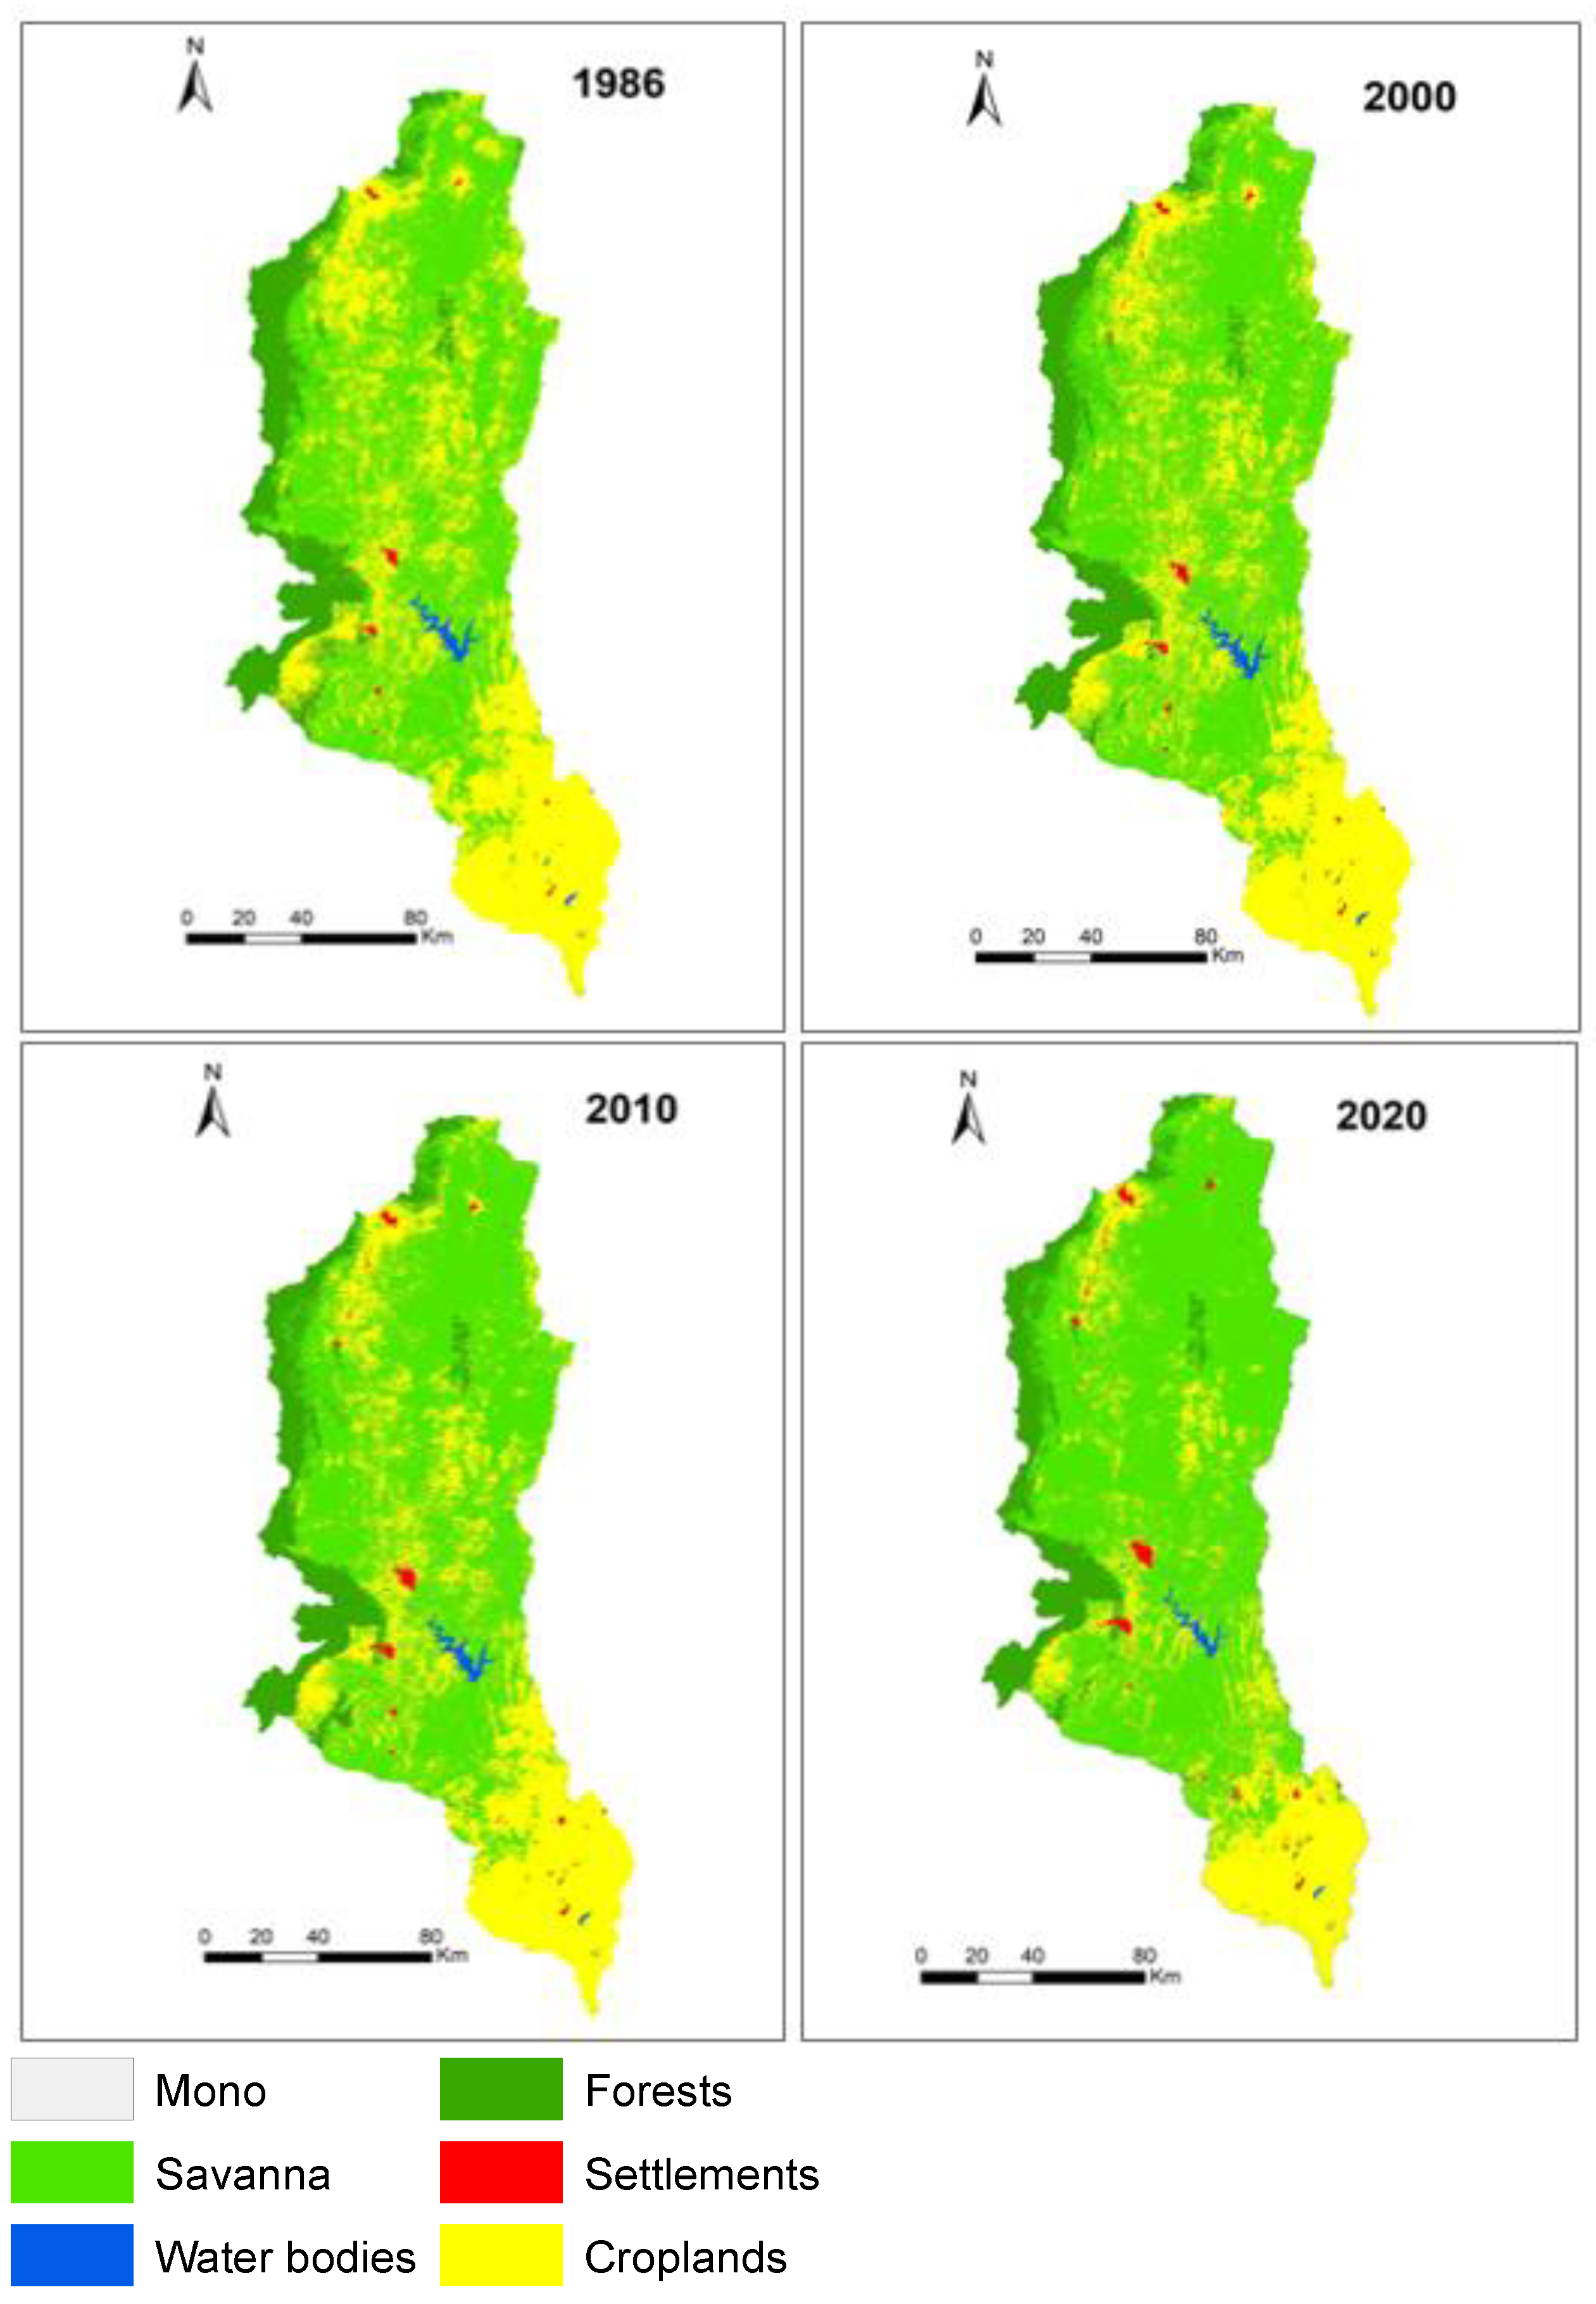
3.1. Land Use Land Cover (LULC) Changes

Figure 3 presents the classified LULC maps of 1986, 2000, 2010, and 2020 of the Mono River. Five LULC types were identified during the classification process: savanna, croplands, forests, water bodies, and settlements. The analysis showed savanna and croplands as the dominant land-use types in the basin over the period 1986 to 2020 with, respectively, 48.07% and 38.33% of the total area in 1986; 64.64% and 23.60% in 2020 (Figure 4).
The accuracy of the results of the classification was confirmed using the Kappa coefficient and the overall accuracy. For the years 1986, 2000, 2010, and 2020, the overall accuracy was 86.34%, 87.94%, 87.59%, and 86.37%, respectively (Table 3). The kappa values range from 80 to 82.6, which indicate an acceptable level of accuracy of the classified maps. However, croplands and settlements registered the lowest accuracies, which could be explained by the similarities between them.
In terms of changes, Figure 5 presents the gains, losses, and persistence of the LULC types for the periods 1986–2000, 2000–2010, and 2010–2020. A decreasing trend of cropland and forests was observed during all periods, whereas savanna and settlements were increasing. In fact, during the first period (1986–2000), croplands and forests had the highest loss with 46.1% and 33.3%, respectively. In contrast, savanna registered the highest gain (75.1%). During the period 2000–2010, cropland registered the largest loss (59.7%) followed by savanna (29.3%). However, during this same period, we noticed an improvement of the vegetation cover; forest increased to 20.7% compared to the first period (9.6%). In the last time interval (2010–2020), the highest loss of croplands (80%) was observed compared to the previous periods. Similarly, savanna increased by 27.3%. Throughout all the periods, the water bodies and settlements recorded the lowest losses.

3.2. Stakeholders’ Perception on Land Use Scenarios

The workshop held in January 2021 aimed to explore stakeholder understanding of land-use drivers, verify the applicability of land-use scenarios, and adjust when necessary. This participatory approach allowed us to engage stakeholders and co-produce scenarios for modeling LULC in the Mono River basin.

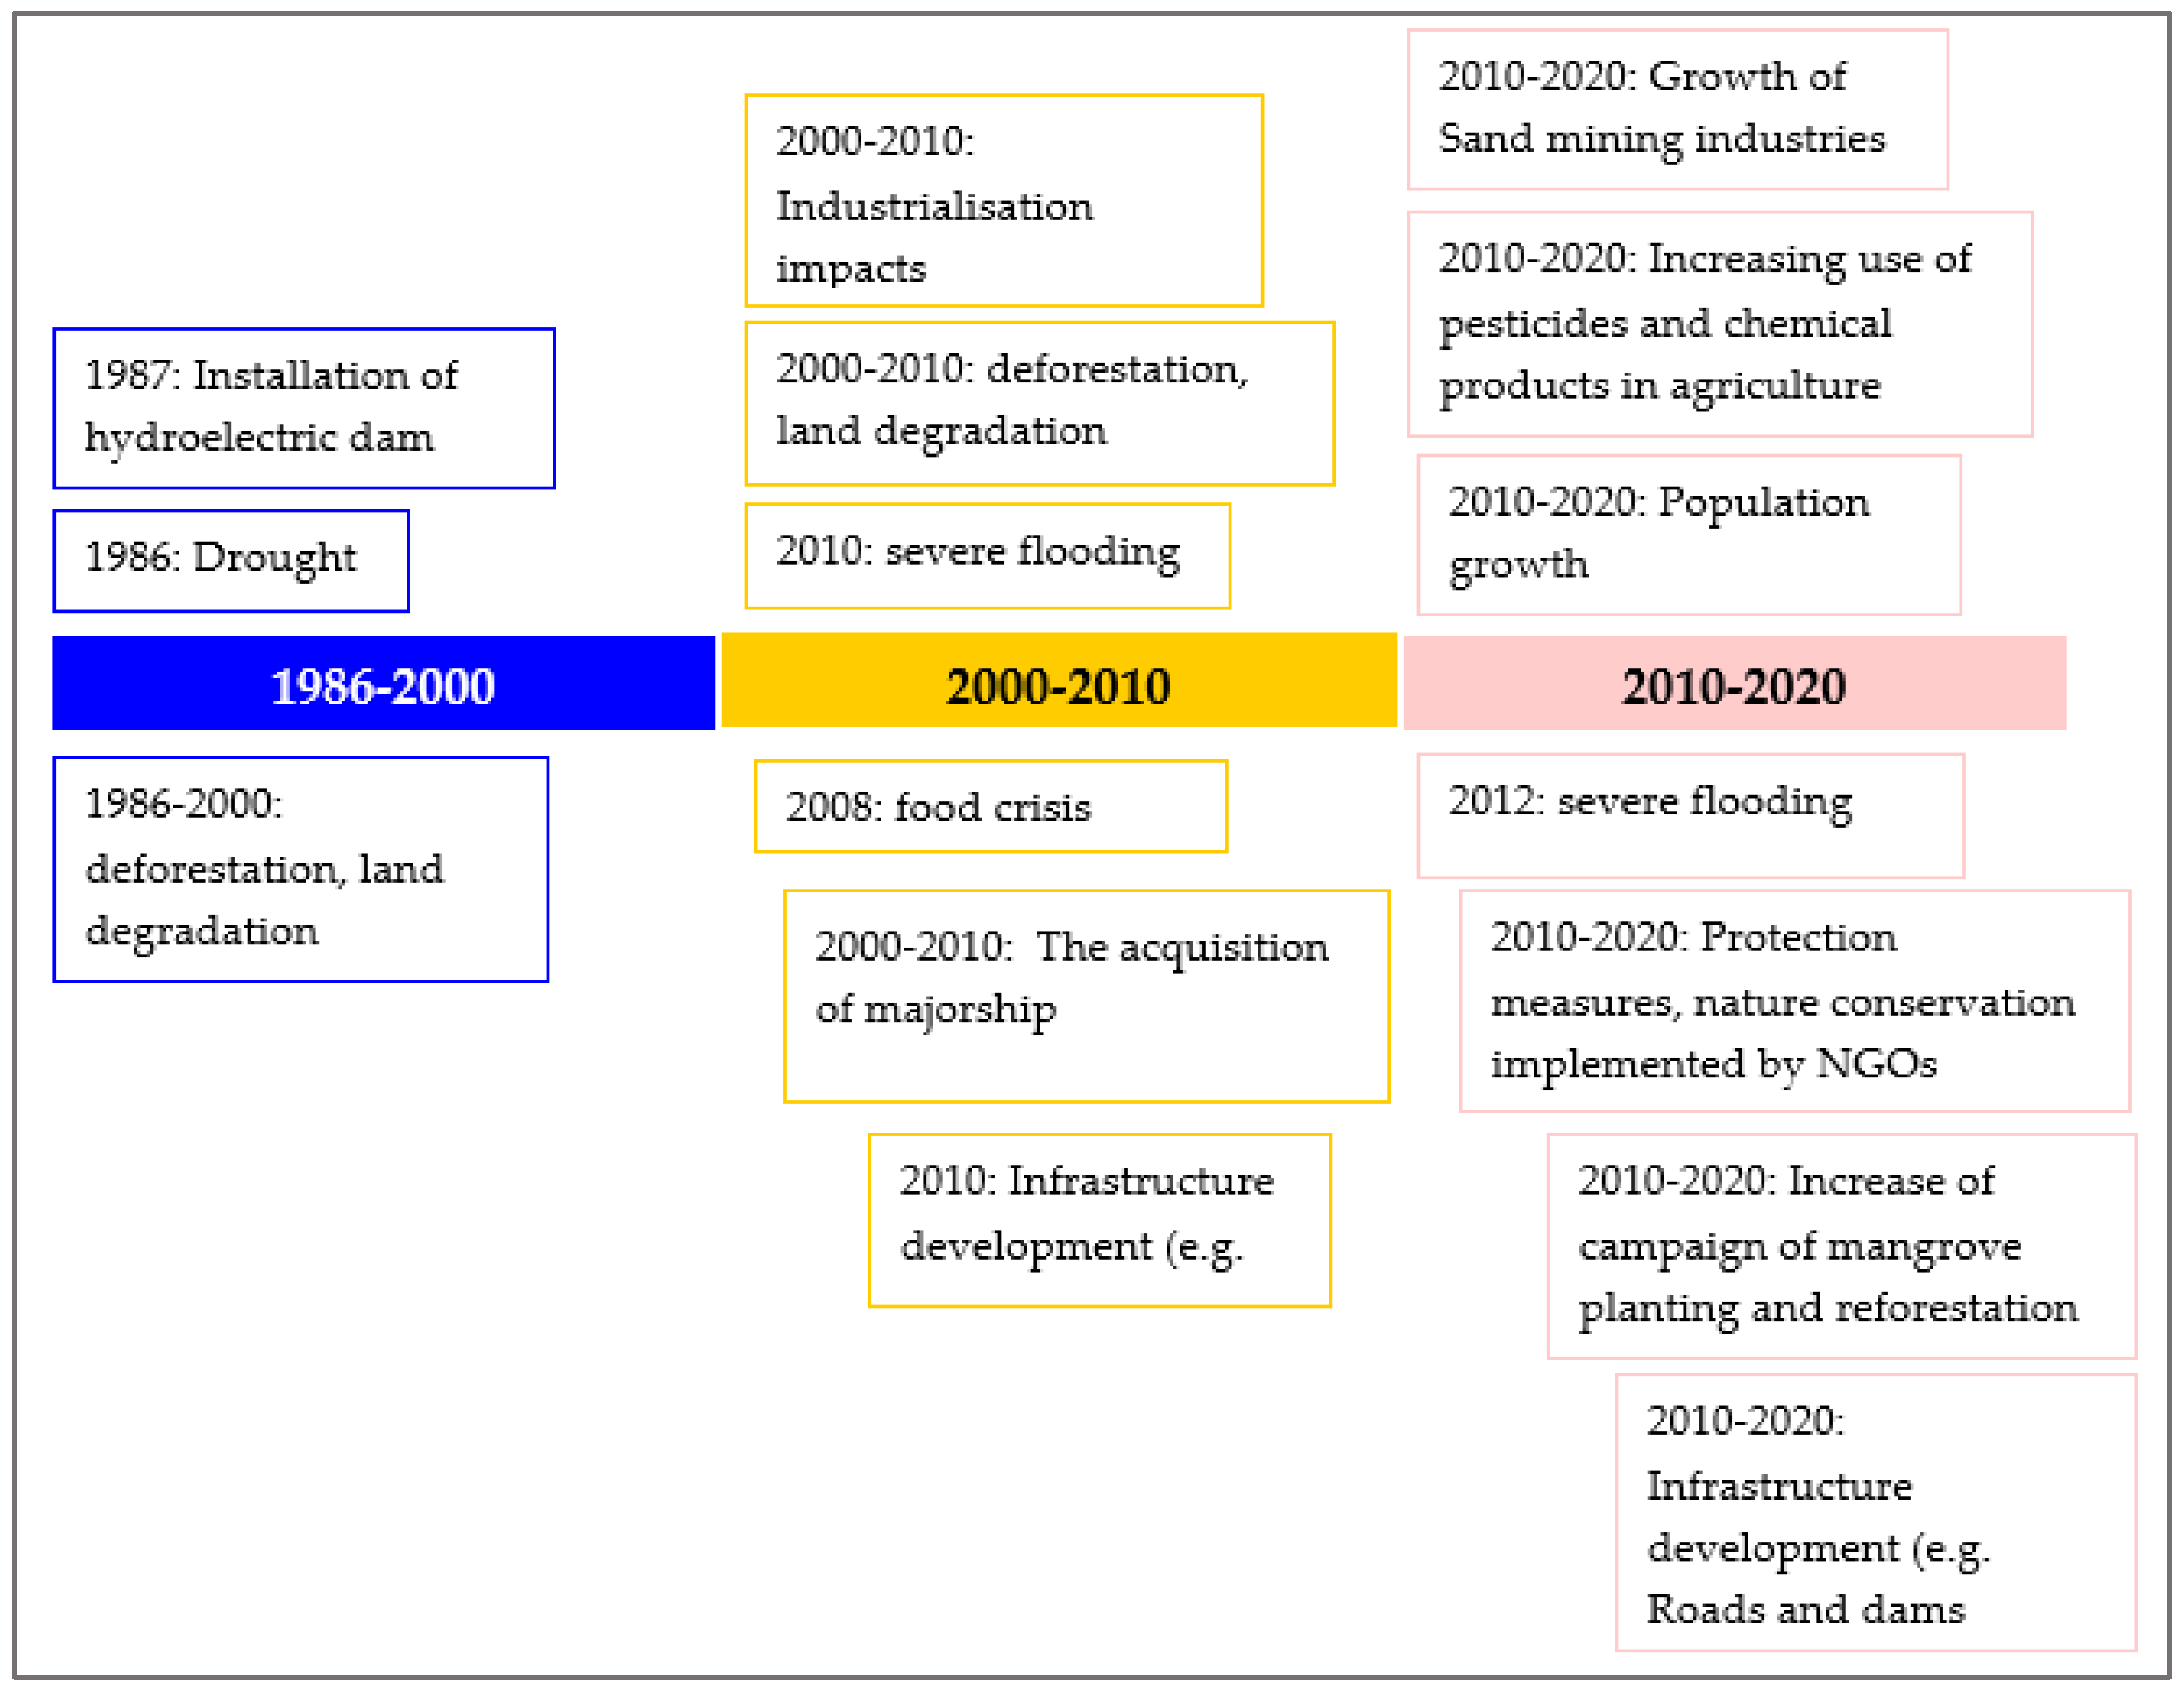
3.2.1. Drivers of LULC Changes According to Stakeholders

Based on their experiences and knowledge on the ground, stakeholders identified and ranked eleven (11) driving forces of historical LULC changes from 1986 to 2020 (Table 4). Indeed, rapid population growth (18%), overexploitation of forest products (15%), rainfall variability (12%), urbanization attributed to settlement expansion and infrastructure development (10%), and agricultural expansion (9%) were the most important land-use change drivers in the area. Other factors, such as lack of environmental management and political commitment, distance to river, elevation, and abusive exploitation of sand mining were also mentioned.
Stakeholders reconstitute a history of major events influencing the LULC changes in the study area from 1986 to 2020 (Figure 6). The main events identified were generally linked to socio-economic, climatic, environmental, and political factors. Drought and the Nangbéto dam installation were the key events listed during the period 1986–2000. Indeed, like other West African countries, Togo and Benin have suffered from drought in the 1970s and 1980s, which was characterized by a reduction in annual rainfall, causing deforestation and land degradation in the area. The following period 2000–2010 was described as difficult in the region due to the occurrence of devastating flood episodes that resulted in the loss of agricultural land and vegetation cover. Flooding severely affected staple food production and demand because of the region’s dependency on agriculture. Infrastructure development and the ascension of political positions were also reported to be important factors in increasing settlement areas and agricultural land sales over that same period. For the period 2010–2020, stakeholders associated LULC changes and land degradation with the population growth, growth of mining industries, flooding, and infrastructure development. On the other hand, campaigns for mangrove planting, reforestation, and environmental conservation measures were seen as causes of vegetation recovery in the study area.

3.2.2. Feasible Land Use Scenarios According to Stakeholders

Five potential land-use scenarios were identified and ranked by stakeholders. Only three of these, namely deforestation, agricultural land reduction, and urbanization, were recognized as realistic in the study area (Table 5). Stakeholders expressed these scenarios based on current land-use types and possible transitions (e.g., forests to croplands, forests to settlements, croplands to settlements, croplands to savannas, savanna to croplands). All of the identified land-use scenarios will result in an increase in land degradation in the area. Stakeholders associated this with the long-term effects of driving forces such as population growth and climate change.
Collecting the perspectives of stakeholders on land use drivers and possible scenarios has helped us to preselect relevant drivers and transition sub-models to be considered in the LULC simulation of the Mono River catchment. As a result, the three most important scenarios identified by the stakeholders (deforestation, agricultural land expansion, and settlement expansion) were considered as our final set of transition sub-models.

3.3. Modelling of LULC

3.3.1. Explanatory Variables and Transitions Sub-Models

Based on Cramer’s coefficient, the explanatory variables such as population growth, distance to river, elevation, and slope were used for each transition sub-model (e.g., deforestation, agricultural land expansion, and settlement expansion) (Appendix B, Table A2). The scenarios’ accuracy rates range from 41.7 to 64.2% and therefore demonstrate a wide range of confidence levels for the different transitions. Indeed, the scenarios’ accuracy rate was higher in agricultural land expansion and deforestation sub-models with 64.2 and 61.6%, respectively. In contrast, the scenario accuracy rate was lower in the settlement expansion sub-model (41.7%) (Appendix B, Table A2).

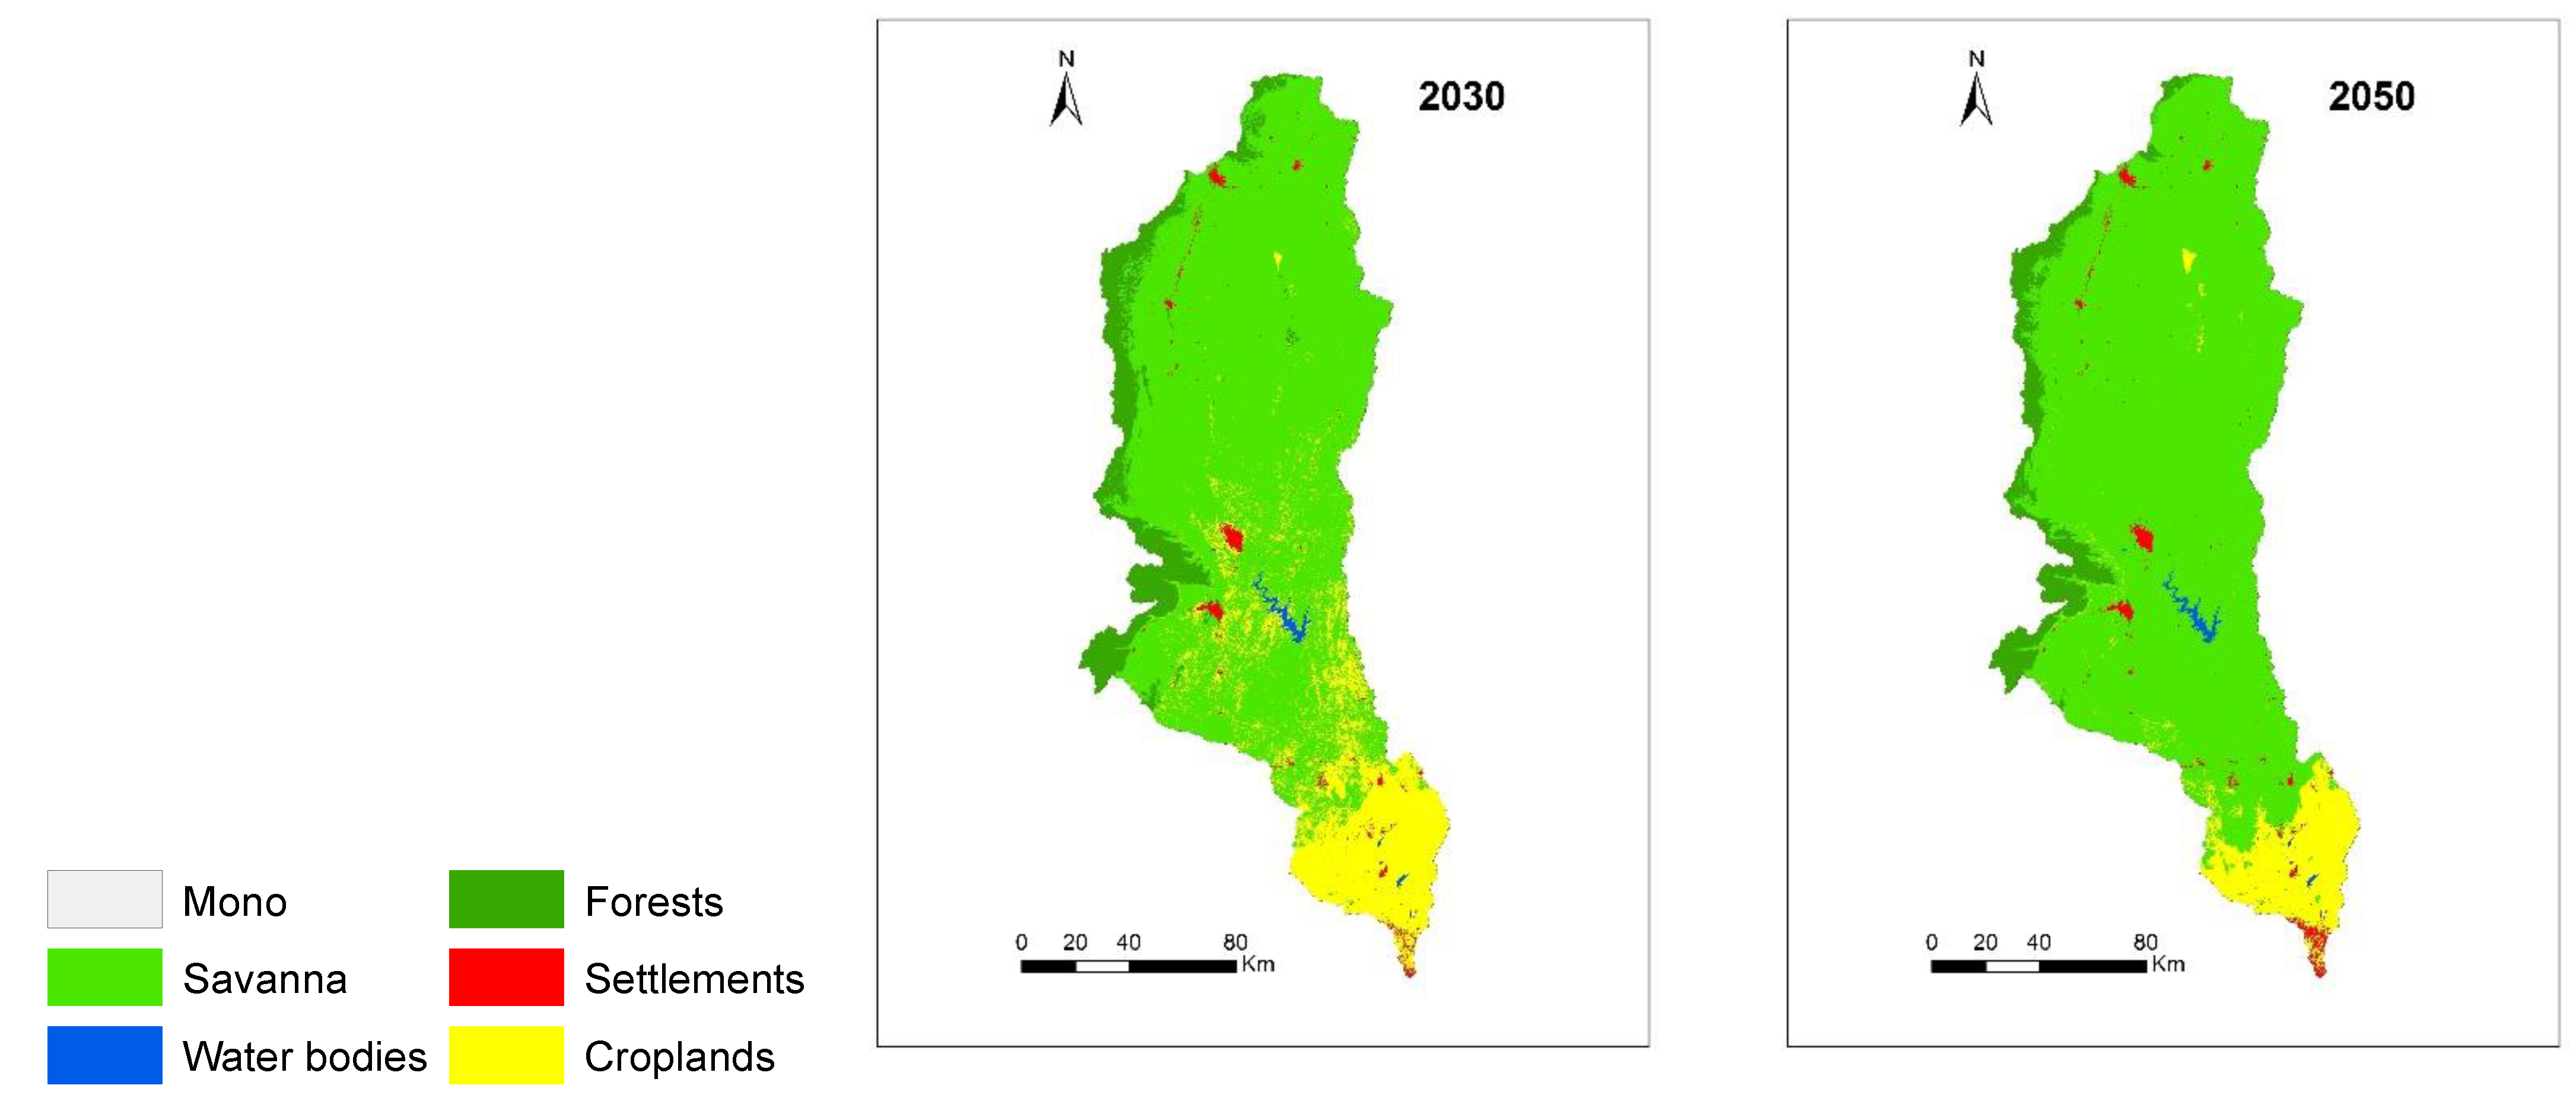
3.3.2. Simulated LULC Maps and Area of Changes

Figure 7 shows the predicted LULC maps for the years 2030 and 2050 using the five land-use classes considered in this study (savanna, forests, water bodies, croplands, and settlements). Table 6 represents the related statistics of each LULC type from 2030 to 2050. According to this simulation result, savanna will cover the highest extent with 72.5% and 82.5% of the area in 2030 and 2050, respectively. Settlements and water bodies will have the lowest extent in 2030, with 1.08% and 0.47%, respectively.
During the overall period of 2020–2050, the land use land cover pattern shows a decrease in croplands (−7.8%) and in forest (−1.9%), whereas savanna and settlement will expand with a change rate of 8.4% and 1.3%, respectively (Figure 8a).
Similarly, during the period of 2030–2050, cropland and forest will decrease with a change rate of −4.09% and −1.07%, respectively. In contrast, savanna and settlement will increase at a rate of 5.07% for savanna and 0.10% for settlement (Figure 8b). The probability matrix of the Markov chain for each land use persisting of transitioning to another land use type is presented in Appendix C (Table A3).

3.3.3. Model Accuracy Assessment

The results of the comparison of the simulated and actual maps of 2020 showed a close similarity between the two LULC maps (Figure 9). In fact, the Kappa Index Agreement resulted in a Kappa for no information (Kno) of 0.91, a standard Kappa (Kstandard) of 0.89, and a Kappa for grid-cell level location of 0.95 (Klocation) (Table 7). All index values exceeded the minimum acceptable criterion and were larger than 80%, indicating that the observed and simulated LULC maps were in good agreement. Hence, the Markov model can be used to accurately predict LULC maps for 2030 and 2050.

4. Discussion

Four LULC maps were produced based on Landsat images and using five LULC classes, namely savanna, croplands, forests, water bodies, and settlements. Analysis of the maps after classification revealed that savanna and croplands are the major land-use types. They also presented the highest changes over the past 35 years. From 1986 to 2020, savanna areas have steadily increased by 16.6% while croplands show a decrease of 9.7%. The same increasing pattern of savanna has been reported by Judex et al. [56] in the upper Ouémé in Benin. Likewise, a study conducted by Imorou et al. [57] showed a ‘savannification’ of forests in northern Benin between 2000–2015. Previous research in the Mono river basin [30] reported as well a conversion of forests into savanna. As for croplands reduction, it can be explained by the land tenure change over the past decades with a high increase of land acquisition by individuals in rural and suburb areas of cities [58]. In facts, land tenure is dominated by purchase-and-sale processes whereby agricultural plots, which use to be families’ properties mainly acquired through inheritance, are now portioned and sold to individuals and multinationals corporations [59,60,61] who do not maintain the initial use of the land for agriculture. In addition, in southern Togo, Bawa [59] reported a 36.35% decrease of croplands areas (cash crops and cereals) between 2000–2015. Furthermore, the slight increase of forest lands observed in 2010 can be explained by reforestation efforts undertaken in Togo between 1991 and 2012, as reported in the country’s third national communication on climate change [62,63]. However, the overall decrease of forest from 1986 to 2020 may point out potential effects of population growth, timber extraction, bush fires, and reduction of precipitation as a result of climate change [64,65,66].
The findings of this study also revealed that stakeholders in the Mono River basin have a good awareness about changing land use (e.g., its drivers and scenarios). Indeed, stakeholders perceived rapid population growth as the primary land-use driver, followed by overexploitation of forest products, rainfall variability, urbanization, and agricultural expansion. According to stakeholders, these drivers have triggered significant LULC changes and land degradation, which they expect to continue because of the ongoing increase in population. Indeed, as it is in most West African countries, the population growth rate in Togo is high with an average annual growth of 2.84% (and doubles every 25 years) [67]. As a result, the need for more agricultural land, forest products, and increasing settlements, all contribute to the observed LULC changes in the area. Similarly, many studies around the world also reported population growth, agriculture expansion, and resettlements as the main LULC drivers [68,69,70,71]. Apart from the human-induced drivers, stakeholders also listed biophysical factors such as soil type, proximity to river, and elevation. This was also reported by earlier studies, which indicated a significant effect of elevation [53] and distance variables [69] on the changes in LULC.
Exploring stakeholders’ perceptions on land-use change has helped us in understanding the past and current land conditions, as well as identifying relevant drivers and transitions for the development of the LCM model. Not all of the drivers mentioned during our workshop with the stakeholders could be considered in the modeling process because of the limited dataset. Nevertheless, it was important to integrate the local expertise into our scenario development as a means of model improvement and validation [72,73]. According to Koo et al. [37], considering local knowledge based on their experience and observations, as opposed to standard approaches, gives important inputs in generating land-use scenarios. However, we recognize that due to the difficulties of individuals recalling their personal memories of prior landscapes and events, local knowledge of land-use change may be insufficient or inaccurate. Therefore, combining these two approaches (participatory and conventional) becomes essential for visualizing future land-use patterns [37,43,44].
The LULC maps for 2030 and 2050 were predicted using the stakeholders’ perspectives and the Markov chain model. The main explanatory variables were population growth, distance to river, elevation, and slope. These were chosen based on Cramer’s coefficient and their significant impact on LULC, which has been proven by previous research [30,42] and inputs made by local stakeholders. In our case, the results from the transition power model showed high predictive accuracy in most of the sub-modules (41.7–64.2%). However, the predictive accuracy rate of the settlement expansion sub-model (41.7%) was lower compared to deforestation (61.6%) and agriculture expansion (64.2%) sub-models. This may be explained by the low classification accuracy rate of settlement (see Section 3.1), and could also indicate that the drivers used for this sub model are not totally explaining the settlement change; thus, more variables could be integrated into further studies to accurately simulate future settlement cover. According to Mas et al. [74], this could also be due to errors from LCM software or users’ manipulations. Nevertheless, LCM gives us acceptable predictive accuracy rates for deforestation and agriculture expansion sub-models, as earlier demonstrated by Nahib et al. [75].
From the prediction results, it was observed that savanna would be the dominant LULC type in the study area over the period 2020 to 2050. Similar findings in Togo were also reported by Koubodana et al. [30] in the Mono River basin and [76] in the Mo River basin. Moreover, we noticed an increase in savanna and settlement between 2030 and 2050 with a change rate of 5.07% and 0.10%, respectively. Indeed, savanna would gain a lot of area from croplands. According to stakeholders, such conversions of cropland to savanna could be caused by the abandonment of croplands due to excessive floods, which, in the long term, turns the farmlands into shrubs. For example, farmers are converting their lands into plantations, fallow lands, or abandonment areas as a means to respond to the effects of climate change and improve their production systems [77,78]. The slight increase in settlement could be related to the growing population in the area, as previously mentioned by [30]. The simulation also revealed that there would be a decrease in cropland (−4.09%) and forest (−1.07%) between 2030 and 2050. This could be caused by future climate change-related environmental issues such as forest degradation, agricultural land, and production losses, erosion, and flooding [79,80]. Considering all these future LULC changes and their possible impacts on people and the environmental system, decision-makers need to take steps to limit the severity of changes and implement proper land use planning strategies in the study area. Development of nature-based and integrated solutions such as retention areas can be envisaged to support farmers to respond to flood events and rather use them as an opportunity for fisheries or off-season cropping. That way, fewer croplands would be abandoned because of climate-related issues. In addition, the efforts engaged for reforestation in the study area can be combined with agroforestry options to concomitantly address croplands reduction and eventual food production and security challenges.

5. Conclusions and Recommendations

This study looked at the historical LULC change in the Mono River basin from 1986 to 2020 and projected the LULC for 2030 and 2050 using the CA-Markov chain model and the stakeholders’ perspectives. To analyze the changes in land use and land cover during the past years, five land-use types were classified using a pixel-based Random Forest (RF) classification technique, which resulted in kappa accuracies above 80%. Out of the five classes, savanna and croplands are the major ones, and they respectively increased and decreased over the past 35 years. Overall, forest areas have declined during the same period, despite a slight increase noticed in 2010. Therefore, ongoing reforestation and afforestation initiatives in the two countries should be maintained with more involvement of local communities. The study identified the relevant driving factors (e.g., population growth, distance to a river, elevation, and slope), which were used to perform the simulation of future LULC changes in the Mono River. They were chosen in collaboration with stakeholders, and other authors have utilized these factors in similar studies to project LULC maps. In this study, they provided satisfactory prediction accuracy rates and results. However, with these factors, the accuracy rate of the settlement expansion sub-model (41.7%) was lower than the deforestation (61.6%) and agriculture growth (64.2%) sub-models. As a result, new variables (such as land policy data, urbanization rate, and climate change pressure) could be included in future research to improve the accuracy of future projections.
The catchment’s LULC fluctuations and land degradation were clearly visible in the prediction results. The findings revealed a growing tendency in savanna and settlement, deforestation, and cropland decline, all of which will become the most prominent aspect of LULC change over the next 30 years. Similarly, stakeholders identified five future land use scenarios, all of which will intensify land degradation and reduce ecosystem services in the area. Therefore, to ensure sustainable development in the Mono River catchment, monitoring the ongoing and expected land degradation appears to be very important. Furthermore, land-use planners and decision-makers must develop and implement appropriate strategies (e.g., land use planning strategies, forest conservation measures) in order to mitigate the damaging effects of future LULC changes. Novel engagement approaches such as incentive-based conservation and payment for ecosystem services could also be explored.

Author Contributions

Conceptualization, S.T.; methodology, E.A.L.S., S.T. and A.D.S.A.; software, E.A.L.S. and S.T.; formal analysis, E.A.L.S. and S.T.; data curation, E.A.L.S. and S.T.; writing—original draft preparation, S.T., E.A.L.S., N.R.H. and A.D.S.A.; writing—review and editing, S.V., N.R.H., J.G.A. and K.K.; funding acquisition, S.T. and S.V. All authors have read and agreed to the published version of the manuscript.

Funding

This research was funded by the German Federal Ministry of Education and Research (BMBF), grant number: 01LZ1710C.

Institutional Review Board Statement

Not applicable.

Informed Consent Statement

Not applicable.

Data Availability Statement

Not applicable.

Acknowledgments

This research was conducted within the CLIMAFRI project (Implementing Climate-sensitive Adaptation strategies to reduce Flood Risk in the transboundary Lower Mono River catchment in Togo and Benin). We are grateful to all stakeholders and to our partners of WASCAL programs in Togo and Benin for their valuable inputs and support during our workshops.

Conflicts of Interest

The authors declare no conflict of interest.

Appendix A

Table A1. Accuracy assessment of the classified LULC maps (1986, 2000, 2010 and 2020).
Land Use/Cover TypesReferences (Pixels)Accuracy Assessment
SavannaWater BodiesForestSettlementCroplandProd.
Acc. (%)
Users
Acc. (%)
Ov.
Acc.
(%)
Kappa
1986 classified data
Savanna358423528653583.7487.5986.3480
Water bodies1383239596.5296.97
Forest87062812185.2189.21
Settlement8901086911380.3985.36
Cropland31931153314889.0882.37
2000 classified data
Savanna367611676346685.8389.8387.9482
Water bodies1485000098.3898.72
Forest24063082092.3889.49
Settlement90186112486.5384.58
Cropland3690686323287.5284.12
2010 classified data
Savanna36169475765682.4688.3787.5981
Water bodies582708298.2296.05
Forest100630141594.1789.49
Settlement15208638589.4384.77
Cropland446232776462688.9985.92
2020 classified data
Savanna366710315172181.8590.0186.3780
Water bodies182700099.8896.05
Forest606370598.395.36
Settlement24008808988.6286.44
Cropland37624087302586.1378.78

Appendix B

Table A2. Sub-models’ performance and associated drivers.
Sub-ModelsSkill MeasureAccuracy Rate (%)Requested Samples per ClassRMSSelected VariablesCramer’s Values
TrainingTesting
Deforestation0.424761.6510,0000.41640.4151Population growth0.56
Elevation0.45
Distance to river0.56
Slope0.34
Agricultural land expansion0.284364.2293480.48550.4841Population growth0.54
Elevation0.28
Distance to river0.54
Settlement expansion/urbanization0.090441.7893480.42930.4292Population growth0.57
Elevation0.05

Appendix C

Table A3. Markov matrix probability of each land use land cover from 2030 to 2050.
Land Use/Cover TypesProbability to Changing
SavannaWater BodiesForestSettlementCropland
Simulated map 2030
Savanna0.99380.00050.00310.00190.0007
Water bodies0.14520.75320.00000.00060.1010
Forest0.11360.00000.87340.00010.0129
Settlement0.03870.00010.00220.93100.0280
Cropland0.28730.00060.00040.00650.7052
Simulated map 2050
Savanna0.98360.00120.00810.00520.0019
Water bodies0.40570.42760.00140.00370.1615
Forest0.30700.00020.66720.00110.0245
Settlement0.12950.00030.00570.80770.0568
Cropland0.62930.00130.00310.01450.3517

References

  1. Meyer, W.B.; Turner, B.L. Human population growth and global land-use/cover change. Annu. Rev. Ecol. Syst. 1992, 23, 39–61. [Google Scholar] [CrossRef]
  2. Winkler, K.; Fuchs, R.; Rounsevell, M.; Herold, M. Global land use changes are four times greater than previously estimated. Nat. Commun. 2021, 12, 2501. [Google Scholar] [CrossRef] [PubMed]
  3. Carvalho-Santos, C.; Nunes, J.P.; Monteiro, A.T.; Hein, L.; Honrado, J.P. Assessing the effects of land cover and future climate conditions on the provision of hydrological services in a medium-sized watershed of Portugal. Hydrol. Process. 2016, 30, 720–738. [Google Scholar] [CrossRef]
  4. Shang, X.; Jiang, X.; Jia, R.; Wei, C. Land use and climate change effects on surface runoff variations in the upper Heihe River basin. Water 2019, 11, 344. [Google Scholar] [CrossRef] [Green Version]
  5. Mezger, G.; De Stefano, L.; Gonz, M. Analysis of the Evolution of Climatic and Hydrological Variables in the Tagus River Basin, Spain. Water 2022, 14, 818. [Google Scholar] [CrossRef]
  6. Apollonio, C.; Balacco, G.; Novelli, A.; Tarantino, E.; Piccinni, A.F. Land use change impact on flooding areas: The case study of Cervaro Basin (Italy). Sustainability 2016, 8, 996. [Google Scholar] [CrossRef] [Green Version]
  7. Jia, G.; Shevliakova, E.; Artaxo, P.; De Noblet-Ducoudré, N.; Houghton, R.; House, J.; Kitajima, K.; Lennard, C.; Popp, A.; Sirin, A.; et al. Land-climate interactions. In Climate Change and Land: An IPCC Special Report on Climate Change, Desertification, Land Degradation, Sustainable Land Management, Food Security, and Greenhouse Gas Fluxes in Terrestrial Ecosystems; Shukla, P., Skea, J., Calvo Buendia, E., Masson-Delmotte, V., Pörtner, H., Roberts, D., Zhai, P., Slade, R., Connors, S., van Diemen, R., et al., Eds.; IPCC: Geneva, Switzerland, 2019; pp. 131–248. [Google Scholar]
  8. Burkett, V.R.; Suarez, A.G.; Bindi, M.; Conde, C.; Mukerji, R.; Prather, M.J.; St Clair, A.L.; Yohe, G.W. Point of Departure. In Impacts, Adaptation, and Vulnerability. Part A: Global and Sectoral Aspects. Contribution of Working Group II to the Fifth Assessment Report of the Intergovernmental Panel on Climate Change; Field, C.B., Barros, V.R., Dokken, D.J., Mach, K.J., Mastrandrea, M.D., Bilir, T.E., Chatterjee, M., Ebi, K.L., Estrada, Y.O., Genova, R.C., et al., Eds.; Cambridge University Press: Cambridge, UK; New York, NY, USA, 2014; pp. 169–194. [Google Scholar]
  9. IPCC. Summary for Policymakers. In Climate Change and Land: An IPCC Special Report on Climate Change, Desertification, Land Degradation, Sustainable Land Management, Food Security, and Greenhouse Gas Fluxes in Terrestrial Ecosystems; Shukla, P.R., Skea, J., Buendia, E.C., Masson-Delmotte, V., Pörtner, H.-O., Roberts, D.C., Zhai, P., Slade, R., Connors, S., van Diemen, R., et al., Eds.; IPCC: Geneva, Switzerland, 2019; ISBN 9789291691548. [Google Scholar]
  10. Guha-Sapir, D.; Below, R.; Hoyois, P. Annual Disaster Statistical Review 2015: The Numbers and Trends. EM-DAT: The CRED/OFDA International Disaster Database. 2016. Available online: https://reliefweb.int/report/world/annual-disaster-statistical-review-2015-numbers-and-trends (accessed on 24 March 2022).
  11. UNDP. Evaluation des Dommages, Pertes et Besoins de Reconstruction Post Catastrophes des Inondations de 2010 au Togo; UNDP: Lomé, Togo, 2010. [Google Scholar]
  12. Floodlist.com. Togo and Benin—Mono River Flooding Affects 50,000. 2019. Available online: https://floodlist.com/africa/togo-benin-mono-river-floods-october-november-2019 (accessed on 15 September 2021).
  13. Djan’na Koubodana, H.; Adounkpe, J.G.; Atchonouglo, K.; Djaman, K.; Larbi, I.; Lombo, Y.; Kpemoua, K.E. Modelling of streamflow before and after dam construction in the Mono River Basin in Togo-Benin, West Africa. Int. J. River Basin Manag. 2021, 1, 1–17. [Google Scholar] [CrossRef]
  14. Djan’na Koubodana, H.; Adounkpe, J.; Tall, M.; Amoussou, E.; Atchonouglo, K.; Mumtaz, M. Trend Analysis of Hydro-climatic Historical Data and Future Scenarios of Climate Extreme Indices over Mono River Basin in West Africa. Am. J. Rural Dev. 2020, 8, 37–52. [Google Scholar]
  15. Wetzel, M.; Schudel, L.; Almoradie, A.; Komi, K.; Adounkpè, J.; Walz, Y.; Hagenlocher, M. Assessing Flood Risk Dynamics in Data-Scarce Environments—Experiences from Combining Impact Chains with Bayesian Network Analysis in the Lower Mono River Basin, Benin. Front. Water 2022, 4, 16. [Google Scholar] [CrossRef]
  16. UN. Water and Climate Change Adaptation in Transboundary Basins: Lessons Learned and Good Practices; United Nations: Geneva, Switzerland, 2015; ISBN 9789211170832. [Google Scholar]
  17. WMO. The Role of Land-Use Planning in Flood Management; Flood Management Tools Series; WMO: Geneva, Switzerland, 2007. [Google Scholar]
  18. DIE. Transboundary Water Management in Africa: Challenges for Development Cooperation; Scheumann, W., Neubert, S., Eds.; Deutsches Institut für Entwicklungspolitik: Bonn, Germany, 2006; ISBN 9783889853264. [Google Scholar]
  19. Rogger, M.; Agnoletti, M.; Alaoui, A.; Bathurst, J.C.; Bodner, G.; Borga, M.; Chaplot, V.; Gallart, F.; Glatzel, G.; Hall, J.; et al. Land use change impacts on floods at the catchment scale: Challenges and opportunities for future research. Water Resour. Res. 2016, 53, 5209–5219. [Google Scholar] [CrossRef] [PubMed] [Green Version]
  20. Hewitt, R.; van Delden, H.; Escobar, F. Participatory land use modelling, pathways to an integrated approach. Environ. Model. Softw. 2013, 52, 149–165. [Google Scholar] [CrossRef]
  21. Kariuki, R.W.; Munishi, L.K.; Courtney-mustaphi, C.J.; Capitani, C.; Shoemaker, A.; Lane, P.J.; Marchant, R. Integrating stakeholders’ perspectives and spatial modelling to develop scenarios of future land use and land cover change in northern Tanzania. PLoS ONE 2021, 16, e0245516. [Google Scholar] [CrossRef]
  22. Sandker, M.; Campbell, B.M.; Ruiz-pérez, M.; Sayer, J.A.; Cowling, R.; Kassa, H.; Knight, A.T. The Role of Participatory Modeling in Landscape Approaches to Reconcile Conservation and Development. Ecol. Soc. 2010, 15, 13. [Google Scholar] [CrossRef] [Green Version]
  23. Mather, P.M.; Koch, M. Computer Processing of Remotely-Sensed Images; John Wiley & Sons: Hoboken, NJ, USA, 2011; ISBN 9780470742396. [Google Scholar]
  24. Vanselow, K.A.; Samimi, C. Predictive Mapping of Dwarf Shrub Vegetation in an Arid High Mountain Ecosystem Using Remote Sensing and Random Forests. Remote Sen. 2014, 2, 6709–6726. [Google Scholar] [CrossRef] [Green Version]
  25. Mohajane, M.; Essahlaoui, A.; Oudija, F.; El Hafyani, M.; El Hmaidi, A.; El Ouali, A.; Randazzo, G.; Teodoro, A.C. Land Use/Land Cover (LULC) Using Landsat Data Series (MSS, TM, ETM+ and OLI) in Azrou Forest, in the Central Middle Atlas of Morocco. Environments 2018, 5, 131. [Google Scholar] [CrossRef] [Green Version]
  26. Rajani, A.; Varadarajan, S. LU/LC Change Detection Using NDVI & MLC Through Remote Sensing and GIS for Kadapa Region. In Cognitive Informatics and Soft Computing. Advances in Intelligent Systems and Computing; Mallick, P., Balas, V., Bhoi, A., Chae, G.S., Eds.; Springer: Singapore, 2020; Volume 1040. [Google Scholar]
  27. Chaves, M.E.D.; Picoli, M.C.A.; Sanches, I.D. Recent Applications of Landsat 8/OLI and Sentinel-2/MSI for Land Use and Land Cover Mapping: A Systematic Review. Remote Sens. 2020, 12, 3062. [Google Scholar] [CrossRef]
  28. Maxwell, A.E.; Warner, T.A.; Fang, F.; Maxwell, A.E.; Warner, T.A.; Implementation, F.F.; Maxwell, A.E.; Warner, T.A. Implementation of machine-learning classification in remote sensing: An applied review sensing: An applied review. Int. J. Remote Sens. 2018, 39, 2784–2817. [Google Scholar] [CrossRef] [Green Version]
  29. Tatsumi, K.; Yamashiki, Y.; Angel, M.; Torres, C.; Leonidas, C.; Taipe, R. Crop classification of upland fields using Random forest of time-series Landsat 7 ETM + data. Comput. Electron. Agric. 2015, 115, 171–179. [Google Scholar] [CrossRef]
  30. Koubodana, D.H.; Diekkrüger, B.; Näschen, K.; Adounkpe, J.; Atchonouglo, K. Impact of the Accuracy of Land Cover Data sets on the Accuracy of Land Cover Change Scenarios in the Mono River Basin, Togo, West Africa. Int. J. Adv. Remote Sens. GIS 2019, 8, 3073–3095. [Google Scholar] [CrossRef]
  31. Koranteng, A.; Zawila-niedzwiecki, T.; Adu-poku, I. Remote Sensing Study of Land Use/Cover Change in West Africa. J. Environ. Prot. Sustain. Dev. 2016, 2, 17–31. [Google Scholar]
  32. Barnieh, B.A.; Jia, L.; Menenti, M.; Zhou, J.; Zeng, Y. Mapping Land Use Land Cover Transitions at Different Spatiotemporal Scales in West Africa. Sustainability 2020, 12, 8565. [Google Scholar] [CrossRef]
  33. Foody, G.M. Status of land cover classification accuracy assessment. Remote Sens. Environ. 2002, 80, 185–201. [Google Scholar] [CrossRef]
  34. Aldwaik, S.Z.; Pontius, G.R.J. Landscape and Urban Planning Intensity analysis to unify measurements of size and stationarity of land changes by interval, category, and transition. Landsc. Urban Plan. 2012, 106, 103–114. [Google Scholar] [CrossRef]
  35. Villamor, G.B.; Gilmore, R.; Van Noordwijk, M. Agroforest’s growing role in reducing carbon losses from Jambi (Sumatra), Indonesia. Reg. Environ. Chang. 2013, 14, 825–834. [Google Scholar] [CrossRef]
  36. Thiam, S.; Villamor, G.B.; Faye, L.C.; Sène, J.H.B.; Diwediga, B.; Kyei-Baffour, N. Monitoring land use and soil salinity changes in coastal landscape: A case study from Senegal. Environ. Monit. Assess. 2021, 193, 259. [Google Scholar] [CrossRef]
  37. Mugdal, S.; Benito, P.; Koomen, E. Modelling of EU land-use choices and environmental impacts-Scoping study. Final report and appendices. EC-DG Environ. Intell. Serv. 2008, 33, 1–91. [Google Scholar]
  38. Quevauviller, P. Water sustainability and climate change in the EU and global context—Policy and research responses. Issues Environ. Sci. Technol. 2011, 31, 1–24. [Google Scholar]
  39. Sabree Ali, A.H.; Amany, A.K.; Jalil, M.A. Predicting the future growth depending on GIS and IDRISI program, city of Najaf-Iraq. IOP Conf. Ser. Mater. Sci. Eng. 2020, 881, 012031. [Google Scholar] [CrossRef]
  40. Hamad, R.; Balzter, H.; Kolo, K. Predicting land use/land cover changes using a CA-Markov model under two different scenarios. Sustainability 2018, 10, 3421. [Google Scholar] [CrossRef] [Green Version]
  41. Regmi, R.R.; Saha, S.K.; Subedi, D.S. Geospatial Analysis of Land Use Land Cover Change Modeling in Phewa Lake Watershed of Nepal by Using GEOMOD Model. Himal. Phys. 2017, 6, 65–72. [Google Scholar] [CrossRef] [Green Version]
  42. Megahed, Y.; Cabral, P.; Silva, J.; Caetano, M. Land cover mapping analysis and urban growth modelling using remote sensing techniques in greater Cairo region-Egypt. ISPRS Int. J. Geo-Inf. 2015, 4, 1750–1769. [Google Scholar] [CrossRef] [Green Version]
  43. Malek, Ž.; Boerboom, L. Participatory scenario development to address potential impacts of land use change: An example from the Italian alps. Mt. Res. Dev. 2015, 35, 126–138. [Google Scholar] [CrossRef] [Green Version]
  44. Griewald, Y.; Clemens, G.; Kamp, J.; Gladun, E.; Hölzel, N.; von Dressler, H. Developing land use scenarios for stakeholder participation in Russia. Land Use Policy 2017, 68, 264–276. [Google Scholar] [CrossRef]
  45. Koo, H.; Kleemann, J.; Fürst, C. Land use scenario modeling based on local knowledge for the provision of ecosystem services in northern Ghana. Land 2018, 7, 59. [Google Scholar] [CrossRef] [Green Version]
  46. Eastman. IDRISI Selva Tutorial. Idrisi Prod. Clark Labs-Clark Univ. 2012, 45, 51–63. [Google Scholar]
  47. Hakim, A.M.Y.; Baja, S.; Rampisela, D.A.; Arif, S. Spatial dynamic prediction of landuse/landcover change (case study: Tamalanrea sub-district, makassar city). IOP Conf. Ser. Earth Environ. Sci. 2019, 280, 012023. [Google Scholar] [CrossRef] [Green Version]
  48. Gibson, L.; Münch, Z.; Palmer, A.; Mantel, S. Future land cover change scenarios in South African grasslands—Implications of altered biophysical drivers on land management. Heliyon 2018, 4, e00693. [Google Scholar] [CrossRef] [Green Version]
  49. Eastman, J.R. Guide to GIS and Image Processing; Idrisi Prod.Clark University: Worcester, MA, USA, 2006. [Google Scholar]
  50. Bernetti, I.; Marinelli, N. Evaluation of landscape impacts and land use change: A Tuscan case study for CAP reform scenarios. Aestimum 2010, 56, 1–29. [Google Scholar]
  51. Mosammam, H.M.; Nia, J.T.; Khani, H.; Teymouri, A.; Kazemi, M. Monitoring land use change and measuring urban sprawl based on its spatial forms: The case of Qom city. Egypt. J. Remote Sens. Space Sci. 2017, 20, 103–116. [Google Scholar]
  52. Leta, M.K.; Demissie, T.A.; Tränckner, J. Modeling and prediction of land use land cover change dynamics based on land change modeler (Lcm) in nashe watershed, upper blue nile basin, Ethiopia. Sustainability 2021, 13, 3740. [Google Scholar] [CrossRef]
  53. Kim, I.; Jeong, G.; Park, S.; Tenhunen, J. Predicted Land Use Change in the Soyang River Basin, South Korea. In Proceedings of the 2011 TERRECO Science Conference, Karlsruhe Institute of Technology, Garmisch-Partenkirchen, Germany, 2–7 October 2011; pp. 17–24. [Google Scholar]
  54. Nadoushan, M.A.; Soffianian, A.; Alebrahim, A. Predicting urban expansion in arak metropolitan area using two land change models. World Appl. Sci. J. 2012, 18, 1124–1132. [Google Scholar]
  55. Zadbagher, E.; Becek, K.; Berberoglu, S. Modeling land use/land cover change using remote sensing and geographic information systems: Case study of the Seyhan Basin, Turkey. Environ. Monit. Assess. 2018, 190, 494. [Google Scholar] [CrossRef] [PubMed]
  56. Judex, M.; Menz, G. Modelling of land-use changes in a West African catchment. ISPR Arch. 2006, 36, 18. [Google Scholar]
  57. Imorou, I.T.; Arouna, O.; Zakari, S.; Djaouga, M.; Thomas, O.; Kinmadon, G. Évaluation de la déforestation et de la dégradation des forêts dans les aires protégées et terroirs villageois du bassin cotonnier du Bénin. In Proceedings of the Conférence OSFACO: Des Images Satellites Pour la Gestion Durable des Territoires en Afrique, Cotonou, Bénin, 13–15 March 2019. [Google Scholar]
  58. Lavigne Delville, P. Les marchés fonciers ruraux au Bénin: Dynamiques, conflits, enjeux de régulation. Pôle Foncier Montpel. 2018, 19, 53. Available online: http://horizon.documentation.ird.fr/exl-doc/pleins_textes/divers21-04/010081553.pdf (accessed on 24 March 2022).
  59. Bawa, A. Mutations Des Périphéries Urbaines au sud du Togo: Des Espaces Ruraux à l’Épreuve du Peuplement et de la Marchandisation des Terres, Université Montpellier. 2017. Available online: https://tel.archives-ouvertes.fr/tel-01692114 (accessed on 24 March 2022).
  60. Gbaguidi, L. Achat/Accaparement des Terres en Afrique: Opportunités ou Menaces? Cas du Bénin en Afrique de l’Ouest. Cotonou. 2010. Available online: https://www.fondation-farm.org/IMG/pdf/foncier_benin.pdf (accessed on 24 March 2022).
  61. Kadjegbin, T.R.G.; Yabi, I.; Adjakpa, T.; Kotchare, P.; Sewade, S.G.; Houssou, C.S. Influences des modes d’accès à la terre sur la production agricole dans les communes de Dassa-Zoumé et de Glazouè au centre Du Bénin. Eur. Sci. J. ESJ 2018, 14, 412. [Google Scholar]
  62. Republique Togolaise. Troisième Communication Nationale sur les Changements Climatiques au Titre de la CCNUCC; Republique Togolaise: Lomé, Togo, 2015; pp. 39–93. [Google Scholar]
  63. Badjana, M.H.; Olofsson, P.; Woodcock, C.E.; Helmschrot, J.; Wala, K.; Akpagana, K. Mapping and estimating land change between 2001 and 2013 in a heterogeneous landscape in West Africa: Loss of forestlands and capacity building opportunities. Int. J. Appl. Earth Obs. Geoinf. 2017, 63, 15–23. [Google Scholar] [CrossRef]
  64. Atsri, K.H.; Konko, Y.; Cuni-sanchez, A.; Abotsi, K.E.; Kokou, K. Changes in the West African forest-savanna mosaic, insights from central Togo. PLoS ONE 2018, 13, e0203999. [Google Scholar] [CrossRef] [PubMed] [Green Version]
  65. Badjana, H.M. River Basins Assessment and Hydrologic Processes Modeling for Integrated Land and Water Resources Management (Ilwrm) in West Africa; University of Abomey-Calavi: Godomey, Bénin, 2015. [Google Scholar]
  66. Koglo, Y.S.; Agyare, W.A.; Diwediga, B.; Sogbedji, J.M.; Adden, A.K.; Gaiser, T. Remote Sensing-Based and Participatory Analysis of Forests, Agricultural Land Dynamics, and Potential Land Conservation Measures in Kloto District (Togo, West Africa). Soil Syst. 2018, 2, 49. [Google Scholar] [CrossRef] [Green Version]
  67. Nyoni, T.; Thabani, M.C. Prediction of total population in Togo using ARIMA models. Munich Pers. RePEc Arch. 2019, 93983. [Google Scholar]
  68. Kidane, Y.; Stahlmann, R.; Beierkuhnlein, C. Vegetation dynamics, and land use and land cover change in the Bale Mountains, Ethiopia. Environ. Monit. Assess. 2012, 184, 7473–7489. [Google Scholar] [CrossRef]
  69. Kindu, M.; Schneider, T.; Teketay, D.; Knoke, T. Drivers of land use/land cover changes in Munessa-Shashemene landscape of the south-central highlands of Ethiopia. Environ. Monit. Assess. 2015, 187, 452. [Google Scholar] [CrossRef] [PubMed]
  70. Munthali, M.G.; Davis, N.; Adeola, A.M.; Botai, J.O.; Kamwi, J.M.; Chisale, H.L.W.; Orimoogunje, O.O.I. Local perception of drivers of Land-Use and Land-Cover change dynamics across Dedza district, Central Malawi region. Sustainability 2019, 11, 832. [Google Scholar] [CrossRef] [Green Version]
  71. Dessie, G.; Kleman, J. Pattern and magnitude of deforestation in the south central Rift Valley region of Ethiopia. Mt. Res. Dev. 2007, 27, 162–168. [Google Scholar] [CrossRef] [Green Version]
  72. Zoungrana, B.J.B.; Conrad, C.; Amekudzi, L.K.; Thiel, M.; Da, E.D.; Forkuor, G.; Löw, F. Multi-temporal landsat images and ancillary data for land use/cover change (LULCC) detection in the Southwest of Burkina Faso, West Africa. Remote Sens. 2015, 7, 12076–12102. [Google Scholar] [CrossRef] [Green Version]
  73. Celio, E.; Brunner, S.H.; Grêt-Regamey, A. Participatory land use modeling with Bayesian networks: A focus on subjective validation. In Proceedings of the 6th International Congress on Environmental Modelling and Software, Leipzig, Germany, 1–5 July 2012; pp. 1827–1834. [Google Scholar]
  74. Mas, J.; Kolb, M.; Paegelow, M.; Camacho, M.T.; Houet, T.; Mas, J.; Kolb, M.; Paegelow, M.; Teresa, M.; Olmedo, C.; et al. Inductive Pattern-Based Land Use/Cover Change Models: A Comparison of Four Software Packages; Elsevier: Amsterdam, The Netherlands, 2014; pp. 94–111. [Google Scholar]
  75. Nahib, I.; Turmudi, T.; Windiastuti, R.; Suryanta, J.; Dewi, R.S.; Lestari, S. Comparing of Land Change Modeler and Geomod Modeling for the Assessment of Deforestation (Case Study: Forest Area at Poso Regency, Central Sulawesi Province). Int. J. Adv. Eng. Manag. Sci. 2018, 4, 597–607. [Google Scholar] [CrossRef] [Green Version]
  76. Diwediga, B.; Agodzo, S.; Wala, K. Assessment of multifunctional landscapes dynamics in the mountainous basin of the Mo River (Togo, West Africa). J. Geogr. Sci. 2017, 27, 579–605. [Google Scholar] [CrossRef]
  77. Raj Khanal, N.; Watanabe, T. Abandonment of Agricultural Land and Its Consequences. Mt. Res. Dev. 2006, 26, 32–40. [Google Scholar] [CrossRef] [Green Version]
  78. Lambert, D.P. Crop diversity and fallow management in a tropical deciduous forest shifting cultivation system. Hum. Ecol. 1996, 24, 427–453. [Google Scholar] [CrossRef]
  79. Ali, E. Impact of climate variability on staple food crops production in Northern Togo. J. Agric. Environ. Int. Dev. 2018, 112, 321–342. [Google Scholar]
  80. Lawin, A.E.; Hounguè, N.R.; Biaou, C.A.; Badou, D.F. Statistical analysis of recent and future rainfall and temperature variability in the Mono River watershed (Benin, Togo). Climate 2019, 7, 8. [Google Scholar]
Figure 1. Location of the study area.
Sustainability 14 04160 g001
Figure 2. Steps applied to derive the land classification map. Spectral images include the Modified Soil Adjusted Vegetation Index 2 (MSAVI2) and Normalized Difference Vegetation Index (NDVI). Landsat bands include blue, green, red, NIR, SWIR 1, and SWIR 2. The topographic dataset includes the digital elevation model (DEM), slope, and aspect.
Sustainability 14 04160 g002
Figure 3. LULC maps of the Mono River basin for the years 1986, 2000, 2010, and 2020.
Sustainability 14 04160 g003
Figure 4. Percentage of area per LULC category for 1986, 2000, 2010, and 2020.
Sustainability 14 04160 g004
Figure 5. Land use land cover gains, losses, and persistence between 1986 and 2020.
Sustainability 14 04160 g005
Figure 6. Timeline of events from 1986 to 2020 identified by stakeholders.
Sustainability 14 04160 g006
Figure 7. Predicted LULC maps for 2030 and 2050.
Sustainability 14 04160 g007
Figure 8. Area of changes for the periods (a) 2020–2050 and (b) 2030–2050.
Sustainability 14 04160 g008
Figure 9. Comparison between (a) observed and (b) simulated land use maps of 2020.
Sustainability 14 04160 g009
Table 1. List of Landsat scenes selected for this research from 1986 to 2020.
Path/RowSensor/Satellite
1986200020102020
192/054LM05LE07LE07LC08
192/055LM05LE07LE07LC08
193/054LM05LE07LE07LC08
193/055LM05LE07LE07LC08
192/056LT05LE07LE07LC08
Table 2. Description of the five classes used in the study.
LULC ClassesDescriptionNo. of Samples
SavannaVegetation composed of tree savannahs, shrubs, and grasslands. Generally, tree height is lower than 5 m5037
Water bodiesWaterbody surfaces such as reservoirs, ponds, lagoons, and river946
SettlementIndustrial, commercial services, residential, communications, transportation, commercial and industrial, mixed urban or built-up land, built-up land or other urban land1069
ForestAreas dominated by tree clusters resulting from natural regeneration or planting; Woodland or protected areas with trees height higher than 5 m706
CroplandAreas dominated by crop production such as cereal crops and vegetables4727
Table 3. Computed class-wise classification accuracies—user’s accuracy (UA) and producer’s accuracy (PA)—for each of the selected images. The overall accuracy (OA) and the Kappa accuracy (KA) are also provided for each year.
Class1986200020102020
UA (%)PA (%)UA (%)PA (%)UA (%)PA (%)UA (%)PA (%)
Savanna87.5983.7489.8385.8388.3782.4690.0181.85
Water96.9796.5298.7298.3896.0598.2296.0599.88
Forest89.2185.2189.4992.3889.4994.1795.3698.3
Settlement85.3680.3984.5886.5384.7789.4386.4488.62
Cropland82.3789.0884.1287.5285.9288.9978.7886.13
OA (%)86.387.987.686.4
KA (%)80.482.681.480.3
Table 4. Ranking of land-use change drivers in the Mono River catchment.
Drivers of Land Use ChangeRanking (1 = Most Important;
11 = Least Important)
Percentage of Times Mentioned
Rapid population growth118%
Overexploitation of forest products215%
Rainfall variability/flood impacts312%
Urbanization410%
Agricultural expansion59%
Soil types, soil loss69%
Lack of environmental management and political commitment714%
Proximity to the river84%
Existence of environmental protection measures97%
Elevation101%
Abusive exploitation of sand mining111%
Table 5. Feasible land-use scenarios according to stakeholders.
Land Use ScenariosDescriptionRanking
(1 = Most Important;
5 = Least Important)
% of Times MentionedFeasibility
DeforestationVegetation converted to other land covers121%Yes
AfforestationThe other land covers are converted to vegetation515%No
Agricultural land reductionCroplands converted to other land cover221%Yes
Agricultural land expansionThe other land covers are converted to croplands416%No
Settlement expansion/UrbanizationThe other land covers are converted into settlements328%Yes
Table 6. Area of each LULC type for the years 2030 and 2050.
20302050
LULCha%ha%
Savanna1,720,83072.511,958,63382.53
Water bodies11,110.530.4711,110.530.47
Forests215,016.29.06164,554.46.93
Settlements25,569.531.0830,061.621.27
Croplands400,785.216.89208,951.98.80
Total2,373,311100.002,373,311100.00
Table 7. Kappa Index of Agreement (KIA).
StatisticsKappa Index
Kno0.9178
Klocation0.9518
KlocationStrata0.9518
Kstandard0.8929
Publisher’s Note: MDPI stays neutral with regard to jurisdictional claims in published maps and institutional affiliations.

