1. Introduction
The construction sector has been recognized as a fundamental industry, which is the driving force of many other industries and plays a very crucial role in countries’ economic growth. Different construction companies should adapt themselves to swift changes and the rapid development of technology to survive. Nowadays, construction projects require many human resources including professionals and subject matter experts. Therefore, it is certainly much more difficult to manage these people and conflicts among them.
Conflicts in a variety of projects can lead to claims if interlocutors do not agree. Different definitions of the claim are presented, but they all share the concept that the dispute between the parties arises after a claim based on a rejected change or alteration [
1,
2,
3,
4,
5]. Claims in projects lead to increased project costs and time, and ultimately affect the performance and success of construction projects. If the claims are properly resolved and managed, the grounds for disputes will disappear. Claims have a major impact on the performance of construction projects and their success or failure. Given the effects of claims on project performance, it is necessary to investigate and identify the causes of claims and resolve them efficiently and effectively and provide preventive solutions which have a positive effect on improving project performance and completing them successfully.
As mentioned, measuring projects’ performance is a way to assess and control their success. Predicting and evaluating the performance of construction projects has been studied with different methods and approaches in recent years. Different systems and frameworks have been provided for performance evaluation. The performance forecasting models presented so far have not been effective, especially in terms of interdependencies between multidimensional performance indicators. To address these limitations, a system dynamics model can be developed that simulates the complexities that exist between dependent variables and predicts their changes over time.
KPIs provide critical information for monitoring and controlling projects and ensuring that the project goals and objectives are achieved. Although financial performance indicators have traditionally received the most attention, multidimensional performance indicators have now been considered. Since 1980, more attention has been paid to non-financial, multidimensional performance indicators to better understand and manage the performance of construction projects [
6]. In the construction industry, project managers should be able to make reliable predictions for the status of their projects. Such predictions may help contractors monitor projects during the implementation phase and provide early warnings of potential problems. However, performance forecasting is a complex and dynamic process that includes many distinctive indicators [
7]. It also should be noted that any changes in one KPI may affect other KPIs due to their highly complex and interrelated structures. There are also several other factors that have significant impacts on these KPIs and ultimately on the overall performance of construction projects. Project managers employ KPIs during monitoring and controlling projects to see whether projects are being implemented according to the plans and achieve their predefined goals and objectives. Due to the dynamics of relationships and interactions in construction projects, the use of system dynamics seems to be a good solution. Research in recent years has paid less attention to the complexity and interdependence of Key Performance Indicators (KPIs). To address these shortages, a system dynamics model can be useful for simulating dependencies and relationships between indicators. The main aim of this research was to provide a model with a system dynamics approach using VENSIM 9.2.2 software to predict the performance of construction projects based on the reasons for the claim. In this model, the most important KPIs, the interactions between them and the relationship between these factors, and the causes of claims were simulated. Such predictions help project managers to better understand the impacts of their activities on the goals and objectives of projects and their progress over time.
The structure of this paper is as follows. The next section reviews relevant studies. Then, materials and methods are explained in
Section 3. In
Section 4, the case study is presented. The results and discussion are then presented in
Section 5. Finally,
Section 6 concludes the paper.
2. Literature Review
2.1. Claim Management Models
Considering the negative effects of possible claims on the final goals and success of the project, in the last two decades more studies have been conducted on the management of construction claims [
8,
9,
10,
11,
12]. One of the studies showed that the causes of claims often include poor forecasting and review of site conditions, tender with a set of incomplete maps, the untimely introduction of design revisions, and construction disruption [
13]. Half of the contractual claims are related to design errors [
14]. Another study showed that claims of construction delays or delivery of materials, weather, changes by the owner, poor site management, changes in site conditions, insufficient specifications and plans, lack of disclosure of important information during the construction phase, and acceleration in work and timing issues are created [
15]. Another study in Canada found that the most common causes of all claims were project acceleration, limited access, climate, and increased scope [
16].
Similarly, studies have been conducted in different countries to examine the reasons for claims, the types of claims, and the claim management process. One study in the United Arab Emirates found that the reasons for the claim, according to the study, were, in order of priority: changes, extra work, delays, different site conditions, acceleration, and contract ambiguity. In this study, the methods of settling claims were also examined and the priority of use in projects was classified (negotiation, mediation, arbitration, and litigation) [
17]. Another study was conducted to examine the process of managing construction claims in Thailand [
18]. Hassanein and El Nemr (2008) investigated the claim management in the Egyptian construction sector. They concluded that the reasons for the claim include changes, delays by the owner, insufficient information about the tender, recalculations, unprincipled delivery of designs, and unpredictable cases [
19].
Most research emphasizes the two factors of delay and change as the main factors in construction projects. According to a study in Colorado, delays are the main reason for claims in the projects under consideration and are even more important than the order of change and additional orders. It also proved that projects that have fixed completion dates are more prone to claims than projects that have more flexible programming [
20]. Additionally, other research has been carried out in this field and has been proven that changes in the owner’s demands are one of the most important reasons for creating claims [
21]. Other claims and claims management studies have been conducted in countries such as Pakistan, Malaysia, Bhutan, Oman, and Addis Ababa [
22,
23,
24,
25,
26]. In the last two years, there have been many studies on claiming and managing it, and all of them share the need of a good documentation system and recording and maintaining reports to control and manage claims in construction [
27].
Because claim management is a process that requires the analysis of a large amount of diverse information, the old methods of documentation developed by industry experts can be considered one of the most important challenges for successful claim management. The feasibility of existing claim management systems is questionable due to problems with input information and documents. For this reason, studies have been conducted to establish a claim management system with BIM capability [
28]. Additionally, a quantitative study was conducted to investigate the effect of construction claims on project performance in Ghana [
29]. Currently, construction claims have become an unavoidable concern and have a major impact on project performance. Completing construction projects on time is an important criterion for measuring the success of projects. However, construction projects are often delayed due to problems with claims and their management, which will degrade project performance [
30]. Claims also have a large impact on the cost of construction projects and lead to negative cost performance. In addition, the relationship between conflict management, team coordination, and project performance was examined [
31].
2.2. Performance Assessment Models
The primary project goals and objectives defined for achieving project success are mainly categorized into financial, technical, social, educational, and professional aspects [
32].
Later, with the progress of research, the success of the project was divided into two parts: (1) the success of the project management and (2) the success of the project product. Heravi and Ilbeigi (2012) proposed a comprehensive evaluation model comprising of project management and deliverables for the construction projects’ success [
33].
Different criteria such as time, quality, and cost have been used to evaluate the success of projects so far. However, many researchers believe that success cannot be measured considering merely the project iron triangle as the other criteria should be taken into consideration for achieving project success [
34].
Recent research works have indicated that the conventional project iron triangle cannot meet all the prerequisites of project performance, because in today’s complex projects, it is necessary to consider other performance criteria such as stakeholders’ satisfaction, health, safety, and the environment [
35]. Banihashemi et al. (2021) considered environmental impacts in developing project schedules [
36]. Additionally, Naghizadeh Vardin et al. (2021) addressed the sustainability indicators for contractor selection in the construction industry [
37].
Ward et al. (1991) stated that the conventional project iron triangle is not sufficient and other factors such as having a good relationship with project stakeholders and the adaptability to changes can have an effect on customer satisfaction and eventually project success and failure [
38].
Studies have addressed multidimensional and non-financial KPIs in construction projects [
39,
40,
41].
Chan and Chan (2004) categorized the KPIs into objective and subjective (quantitative and qualitative) indicators [
42]. Hwang et al. (2009) assessed the effect of rework on project performance in terms of both owner and the contractor [
43]. Owolabi et al. (2014) examined the impacts of delay on the delivery and performance of construction projects [
44]. Nassar and AbouRizk (2014) investigated the practical application of integrated performance appraisal of construction projects. They considered performance indicators including billing, profitability, scheduling, cost, safety, quality, and customer and team satisfaction and finally presented a general indicator for evaluating the project performance [
45].
Nilashi et al. (2014) evaluated the literature on project critical success factors. They introduced five criteria and 43 sub-criteria and ranked the sub-criteria using decision-making methods ANP (Analytic Network Process) and DEMATEL (Decision Making Trial and Evaluation Laboratory) [
46]. Yun et al. (2016) studied the performance indexes of construction projects regarding the project implementation phases [
47]. Omar and Fayek (2016) addressed the performance of construction projects [
48]. Wibowo et al. (2017) applied the system dynamics method to model the effects of the conflict strategy on the performance of construction projects [
49]. Leon et al. (2018) presented a system dynamics model to predict the construction projects’ performance [
7].
Al-Zwainy and Mezher (2018) presented and diagnosed twenty causes of cost deviation in highway projects in the Republic of Iraq, which they divided into three main groups (planning causes, designing causes, and execution causes). Pareto analysis showed that eleven causes out of twenty causes represented the most important causes of cost deviation [
50].
Cha and Kim (2018) measured construction project performance considering optimal best management practices in South Korea. They proposed an algorithm in which the project stakeholders can effectively measure and analyze the performance level of a building project in conjunction with project characteristics and the identified BMPs (Best Management Practices) [
51]. Mohammadi et al. (2018) investigated the factors affecting safety performance in construction projects. They developed a hierarchical framework to demonstrate how the extracted factors influence the safety aspect of the construction projects [
52]. Tripathi et al. (2019) evaluated the performance measurement of construction firms using a fuzzy preference relation technique [
53]. Sharma et al. (2020) investigated the effects of delays of several highway construction projects on their completion time and cost. They categorized the causes of time overruns and provided a mathematical model for predicting the time overrun percentage, using highway projects in Northern India as a case study [
54]. Additionally, Shafieezadeh et al. (2020) proposed a system dynamics model to show how dynamic changes can affect project’s KPIs during its lifecycle [
55].
Project performance forecasting is extremely important for project management. Several studies have been conducted on the performance prediction methods in construction projects, particularly the Earned Value Management (EVM) method. However, the EVM has been criticized by many researchers [
56,
57]. It has also been shown that the EVM indicators are inappropriate and unreliable for projects, especially those that have a nonlinear cumulative cost curve [
58]. Additionally, the planned value method for projects that continue and run after the scheduled completion date yields unreliable and bizarre results [
56]. The other performance prediction methods are briefly displayed in
Table 1.
The well-known system dynamics method introduced by Forster in 1958 has been widely employed to recognize, visualize, and analyze complicated dynamic systems. System dynamics is a set of conceptual tools that enable us to understand the structure and dynamics of complex systems, and ultimately be able to design more effective policies by careful modeling and computer simulation [
65]. This method can examine the systems’ behavior based on a comprehensive perspective that focuses particularly on the interactions between the system’s components [
66]. Sterman (1992) introduced the system dynamics method as a modeling tool and technique for project management [
67]. Since then, several studies utilized system dynamics approach in construction projects. For example, Nasir and Hadikusumo (2019) proposed a system dynamics model for the owner-contractor relationship [
68]. Al-Kofahi et al. (2020) assessed the impacts of change orders using a system dynamics approach [
69]. Gerami Seresht and Fayek (2020) developed a fuzzy system dynamics model for defining the relationships between the variables of the construction systems [
70]. Mohammadi and Tavakolan (2020) determined the behavioral safety pattern of construction labor using the system dynamics approach [
71]. Asiedu and Ameyaw (2021) presented a system dynamics model to investigate the roots and causes of overrun costs in the construction projects of developing countries [
72]. Etemadinia and Tavakolan (2021) developed a hybrid system dynamics method to analyze the design-phase risks of construction projects [
73]. Dabirian et al. (2021) investigated the effects of financial policies on the performance of construction projects using a system dynamics model [
74].
Numerous applications of the system dynamics approach to project performance management in recent years are shown in
Table 2.
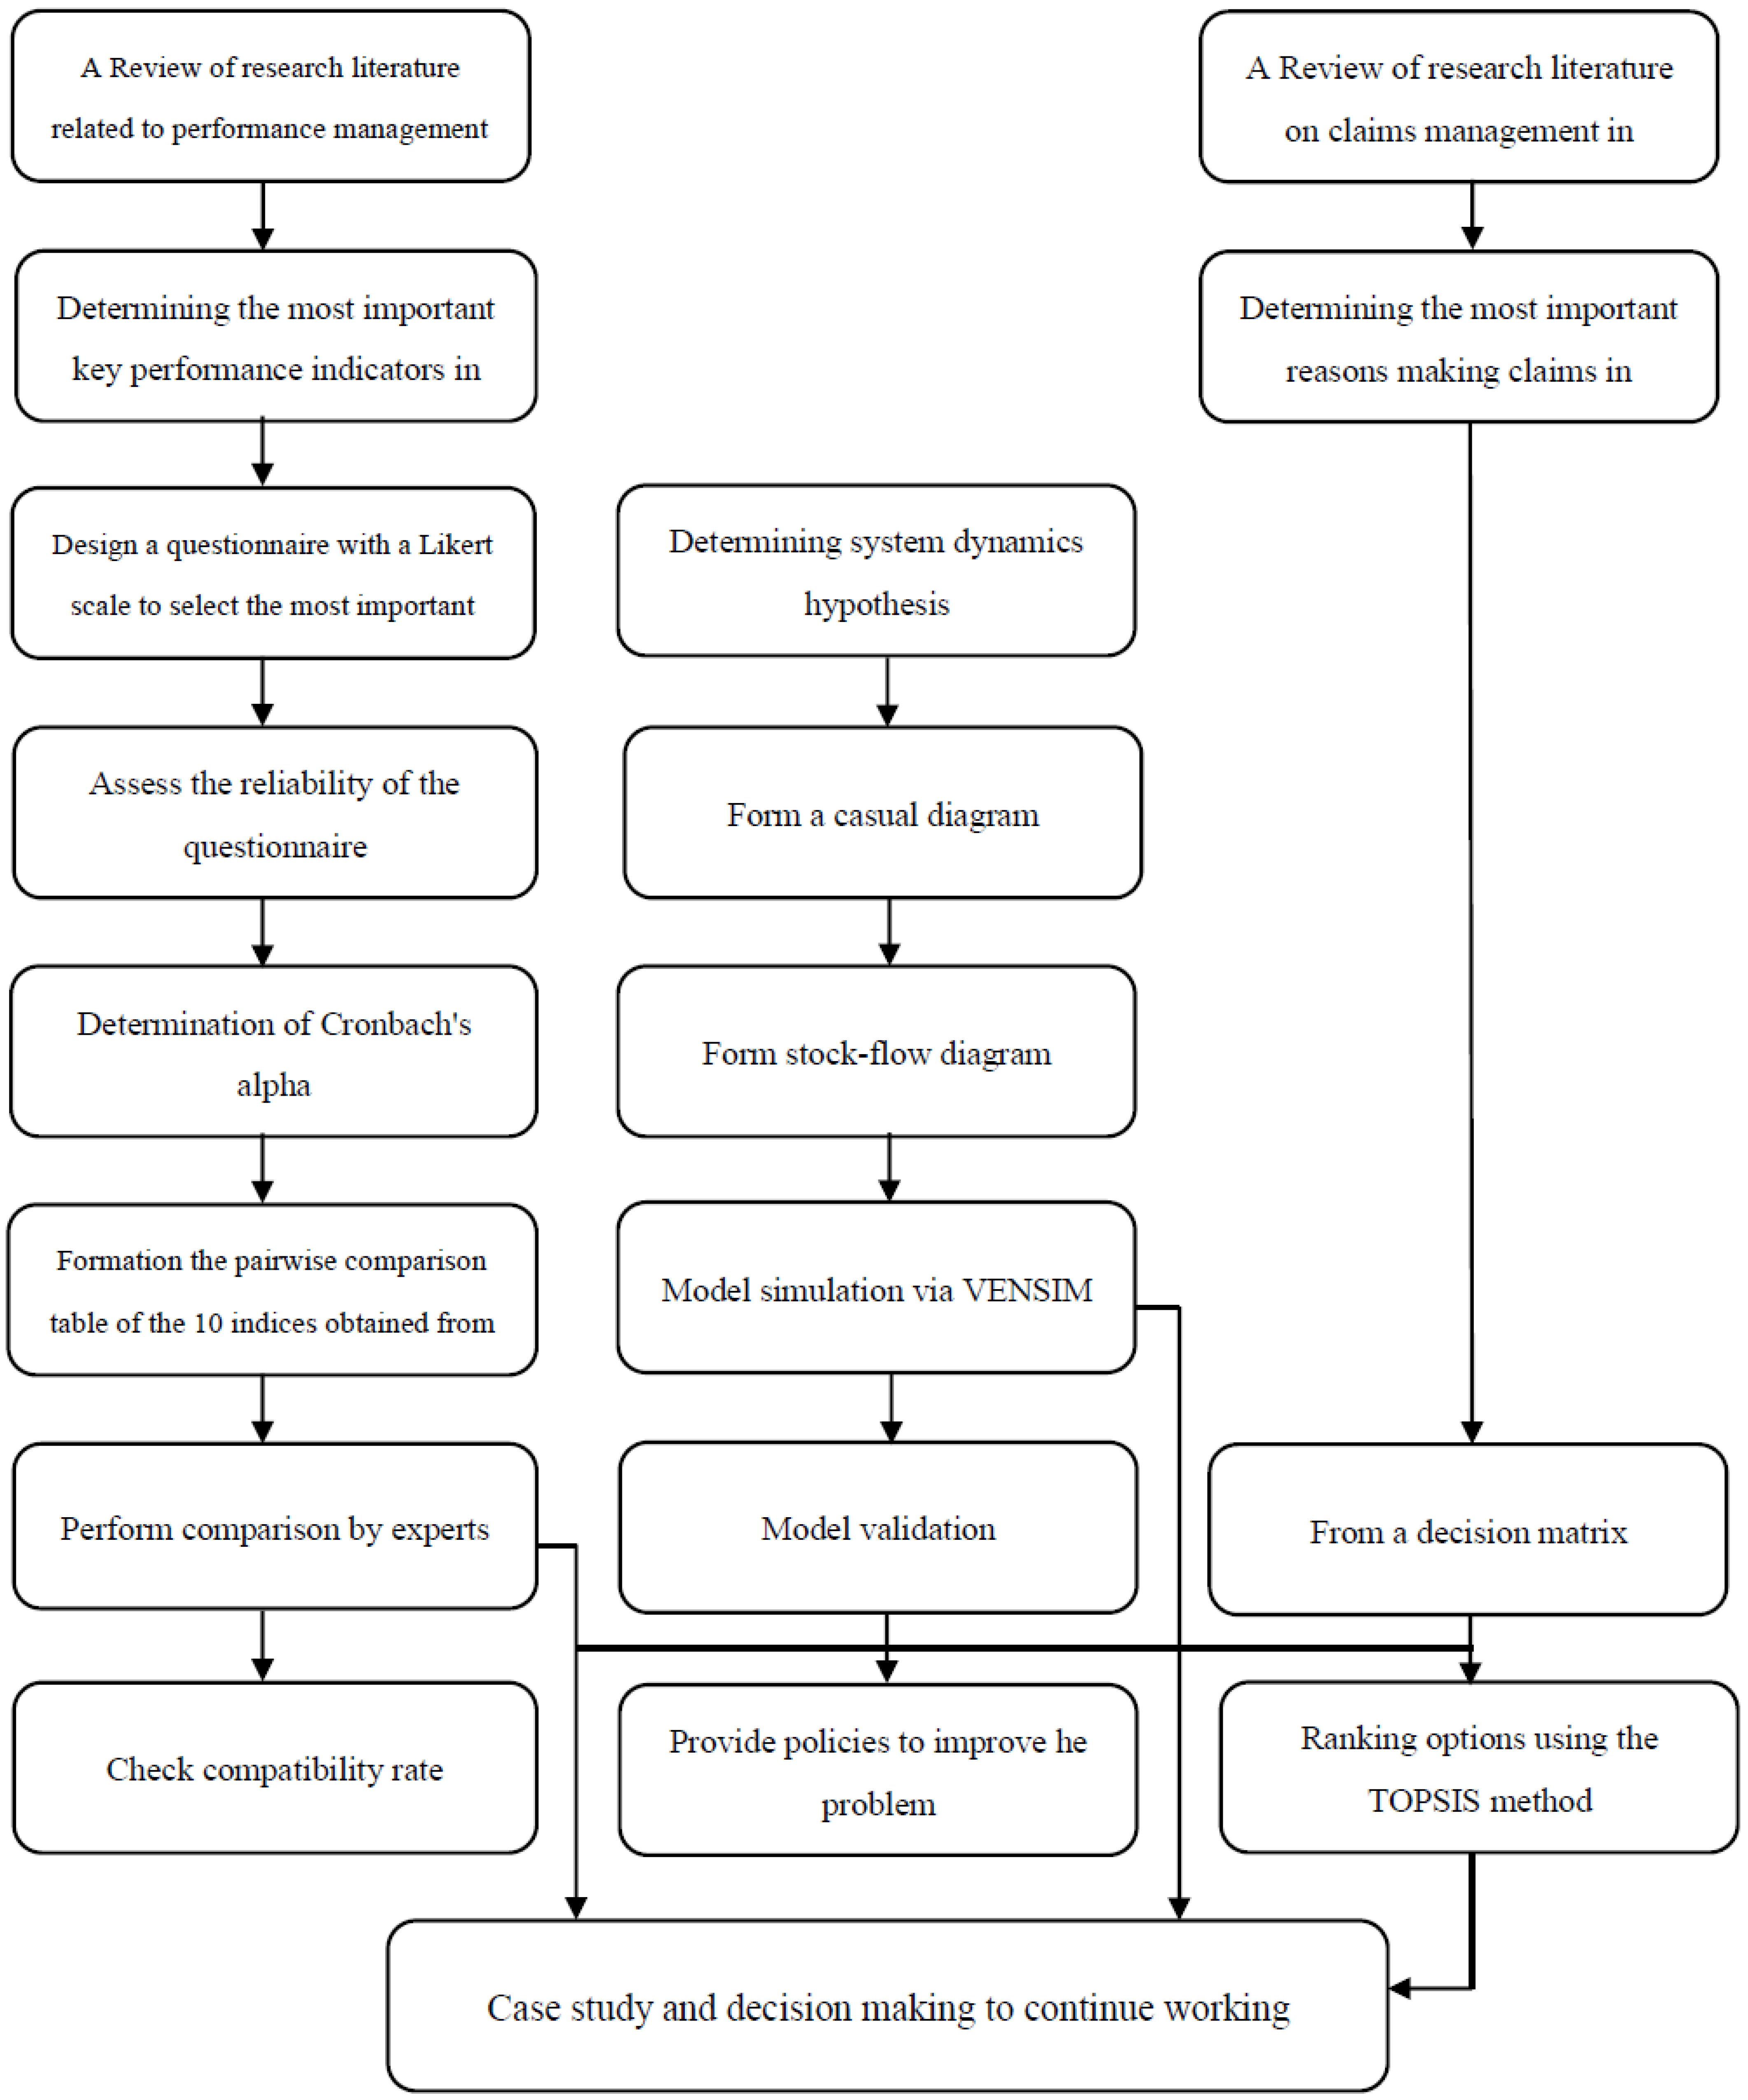
3. Materials and Methods
The research process of this study is shown in
Figure 1.
3.1. System Dynamics
Nonlinear thinking and a dynamic view of phenomena and their consequences are the weak points of managers’ decisions in business and non-commercial businesses and organizations. We live in a complex world that is constantly changing and together with construction projects we face risk and uncertainty every day [
84]. We also face many complex problems in agriculture, biology, aquaculture, the environment, technology, and socioeconomics, which we need to understand and manage to support sustainable development. The system dynamics of feedback-based can be used to address nonlinear, multifaceted, and time-consuming features in complex dynamic systems, as well as to model and simulate these systems, to understand them, and to design management policies.
System dynamics is a method derived from control theory and can easily help us understand and manage today’s dynamic and complex systems. With the publication of the book Industrial Dynamics in 1961, system dynamics studies were developed in most countries [
85]. Forrester’s method of creating computer models for doing things that the human mind cannot analyze logically provides interactions and behavioral states of complex social dynamic systems. Therefore, it provides a framework by which strategies can be tested and traded. These computer simulations and modeling are performed by different software. Today, there is various software such as VENSIM, STELLA, POWERSIM, and ANY LOGIC that has revolutionized the dynamics of system dynamics.
3.2. Determining the Most Significant Key Performance Indicators (KPIs)
In this research, first, the KPIs were defined through literature review and the most important of KPIs were detected by the questionnaire. Finally, the relative importance weights of the indicators were determined using the Analytic Hierarchy Process (AHP) method. Additionally, the most important reasons for making claims were distinguished by reviewing the research literature and ranking the reasons for making claims by the Technique for Order of Preference by Similarity to Ideal Solution (TOPSIS) regarding the weights obtained from the previous stage. Project performance was evaluated using a system dynamics approach on VENSIM software, and the model was validated using the following methods. The simulation of the model considering the case study and application of proposed policies is presented in the last step of the research methodology.
All KPIs were gathered by reviewing the relevant studies on construction projects; then, 22 KPIs were selected using the experts’ opinions for review. Subsequently, a questionnaire was designed using a five-point Likert scale and distributed among experts and specialists to rank these indicators and select the most important ones. The reliability of these questionnaires was determined and confirmed by Cronbach’s alpha test method.
By calculating the mean index, the relative importance of each index was determined, and the most important ones were selected. These indicators included cost, scheduling, safety, quality, environment, team satisfaction, customer satisfaction, profitability, productivity, and sustainability.
3.3. Ranking by AHP Method
The Analytical Hierarchy Process (AHP) is one of the most widely used Multiple Criteria Decision Making (MCDM) methods. This method was developed by Thomas El Saati [
86]. The reason for using the AHP method is to assume that there are no interactions between the KPIs. The principles of the AHP process are:
Reverse condition;
The principle of homogeneity;
The principle of dependency;
The principle of expectations.
This method can do two things: find the relative importance of the indexes and rank the options. The steps of the Analytical Hierarchy Process method are below:
Step 1: First, using the scale (1–9), a logical pairwise comparisons matrix is created. The scale (1–9) is shown in
Table 3 [
86].
Step 2: Normalize the values of pairwise comparisons matrix: for this, we divide the values of each matrix component into the sum of the column components containing the same component.
Step 3: Calculate the relative importance of each index: the arithmetic mean of each row is the relative importance of each index.
Step 4: Determine the incompatibility rate: if the rate is greater than 0.1, the comparisons should be revised; otherwise, there is compatibility and the work can continue.
In this step, 10 indicators were obtained from the analysis of the results of the questionnaire to be used in ranking the options by the TOPSIS method (next step), ranked by the AHP method, and relative weight was determined for each of them. Finally, according to the weights obtained from the software, the ranking of indicators was obtained as shown in
Table 4.
3.4. Ranking the Reasons for Claims by the TOPSIS Method
The TOPSIS method is another MCDM method that is used to rank the causes of claims. At this stage, the most important reasons for making a claim, which have been collected by reviewing the relevant research literature, are ranked. This method was developed by Huang and Yoon in 1981 [
87]. The application of the TOPSIS method to the decision support system can assist managers to achieve qualified alternatives [
88]. In this research, this method was employed in combination with the AHP method. The basic concept of this method is that the chosen option should be the shortest distance from the best possible solution and the longest distance from the worst possible solution. The steps of the TOPSIS method are listed below:
Step 1: Evaluate the options based on the indicators and form the initial decision-making matrix.
Step 2: Normalize (scale) the matrix using the vector normalization method.
Step 3: Calculate weighted matrix. At this point, the weight of each indicator should be determined. We then multiply the components of each indicator by the weight of the same indicator. In this study, the AHP method was used to determine the weight (relative importance) of each indicator.
Step 4: Determine the solution with positive and negative ideals (best and worst). In the positive indicators the highest components, and in the negative indicators the lowest components in each indicator are considered as the ideal positive solution, and vice versa for the negative ideal solution.
Step 5: Obtain the Euclidean distance of each option to the positive and negative ideals.
Step 6: Determine the relative proximity of an option to the ideal solution. Whichever option it is greater is given higher priority.
The options evaluation matrix was designed and distributed. After collection and analysis, the options were ranked by the TOPSIS method and presented in
Table 5.
3.5. System Dynamics Modeling
Today, the conventional KPIs of cost, time, and quality (iron triangle) cannot accurately predict project performance. Researchers have paid more attention to non-financial and multidimensional indicators. It can also be said that a change in one performance index may affect other indicators due to the complex and interactive structures of existing indicators and interactions. However, most existing performance forecasting methods do not take these interactions into account and do not explain the relationship between the indicators, and therefore are unable to provide credible information about the actual impact of the indicators on various aspects of performance. As discussed in the previous sections, performance evaluation methods and factor effects on final project performance only examine the impact of each of the indicators and factors separately and to some extent help project managers make their own decisions. Therefore, in this research, using the system dynamics approach, a model for predicting the performance of construction projects was presented, which simulates the interactions between KPIs and the reasons for claiming that one of the main problems of construction projects. These predictions help project managers succeed in making initial warnings about potential problems.
The first step in this section is to identify the problem, which is fully explained in the previous sections.
The next step is to determine the research hypotheses and draw a causal diagram. This was discussed in the recent research of the authors [
88].
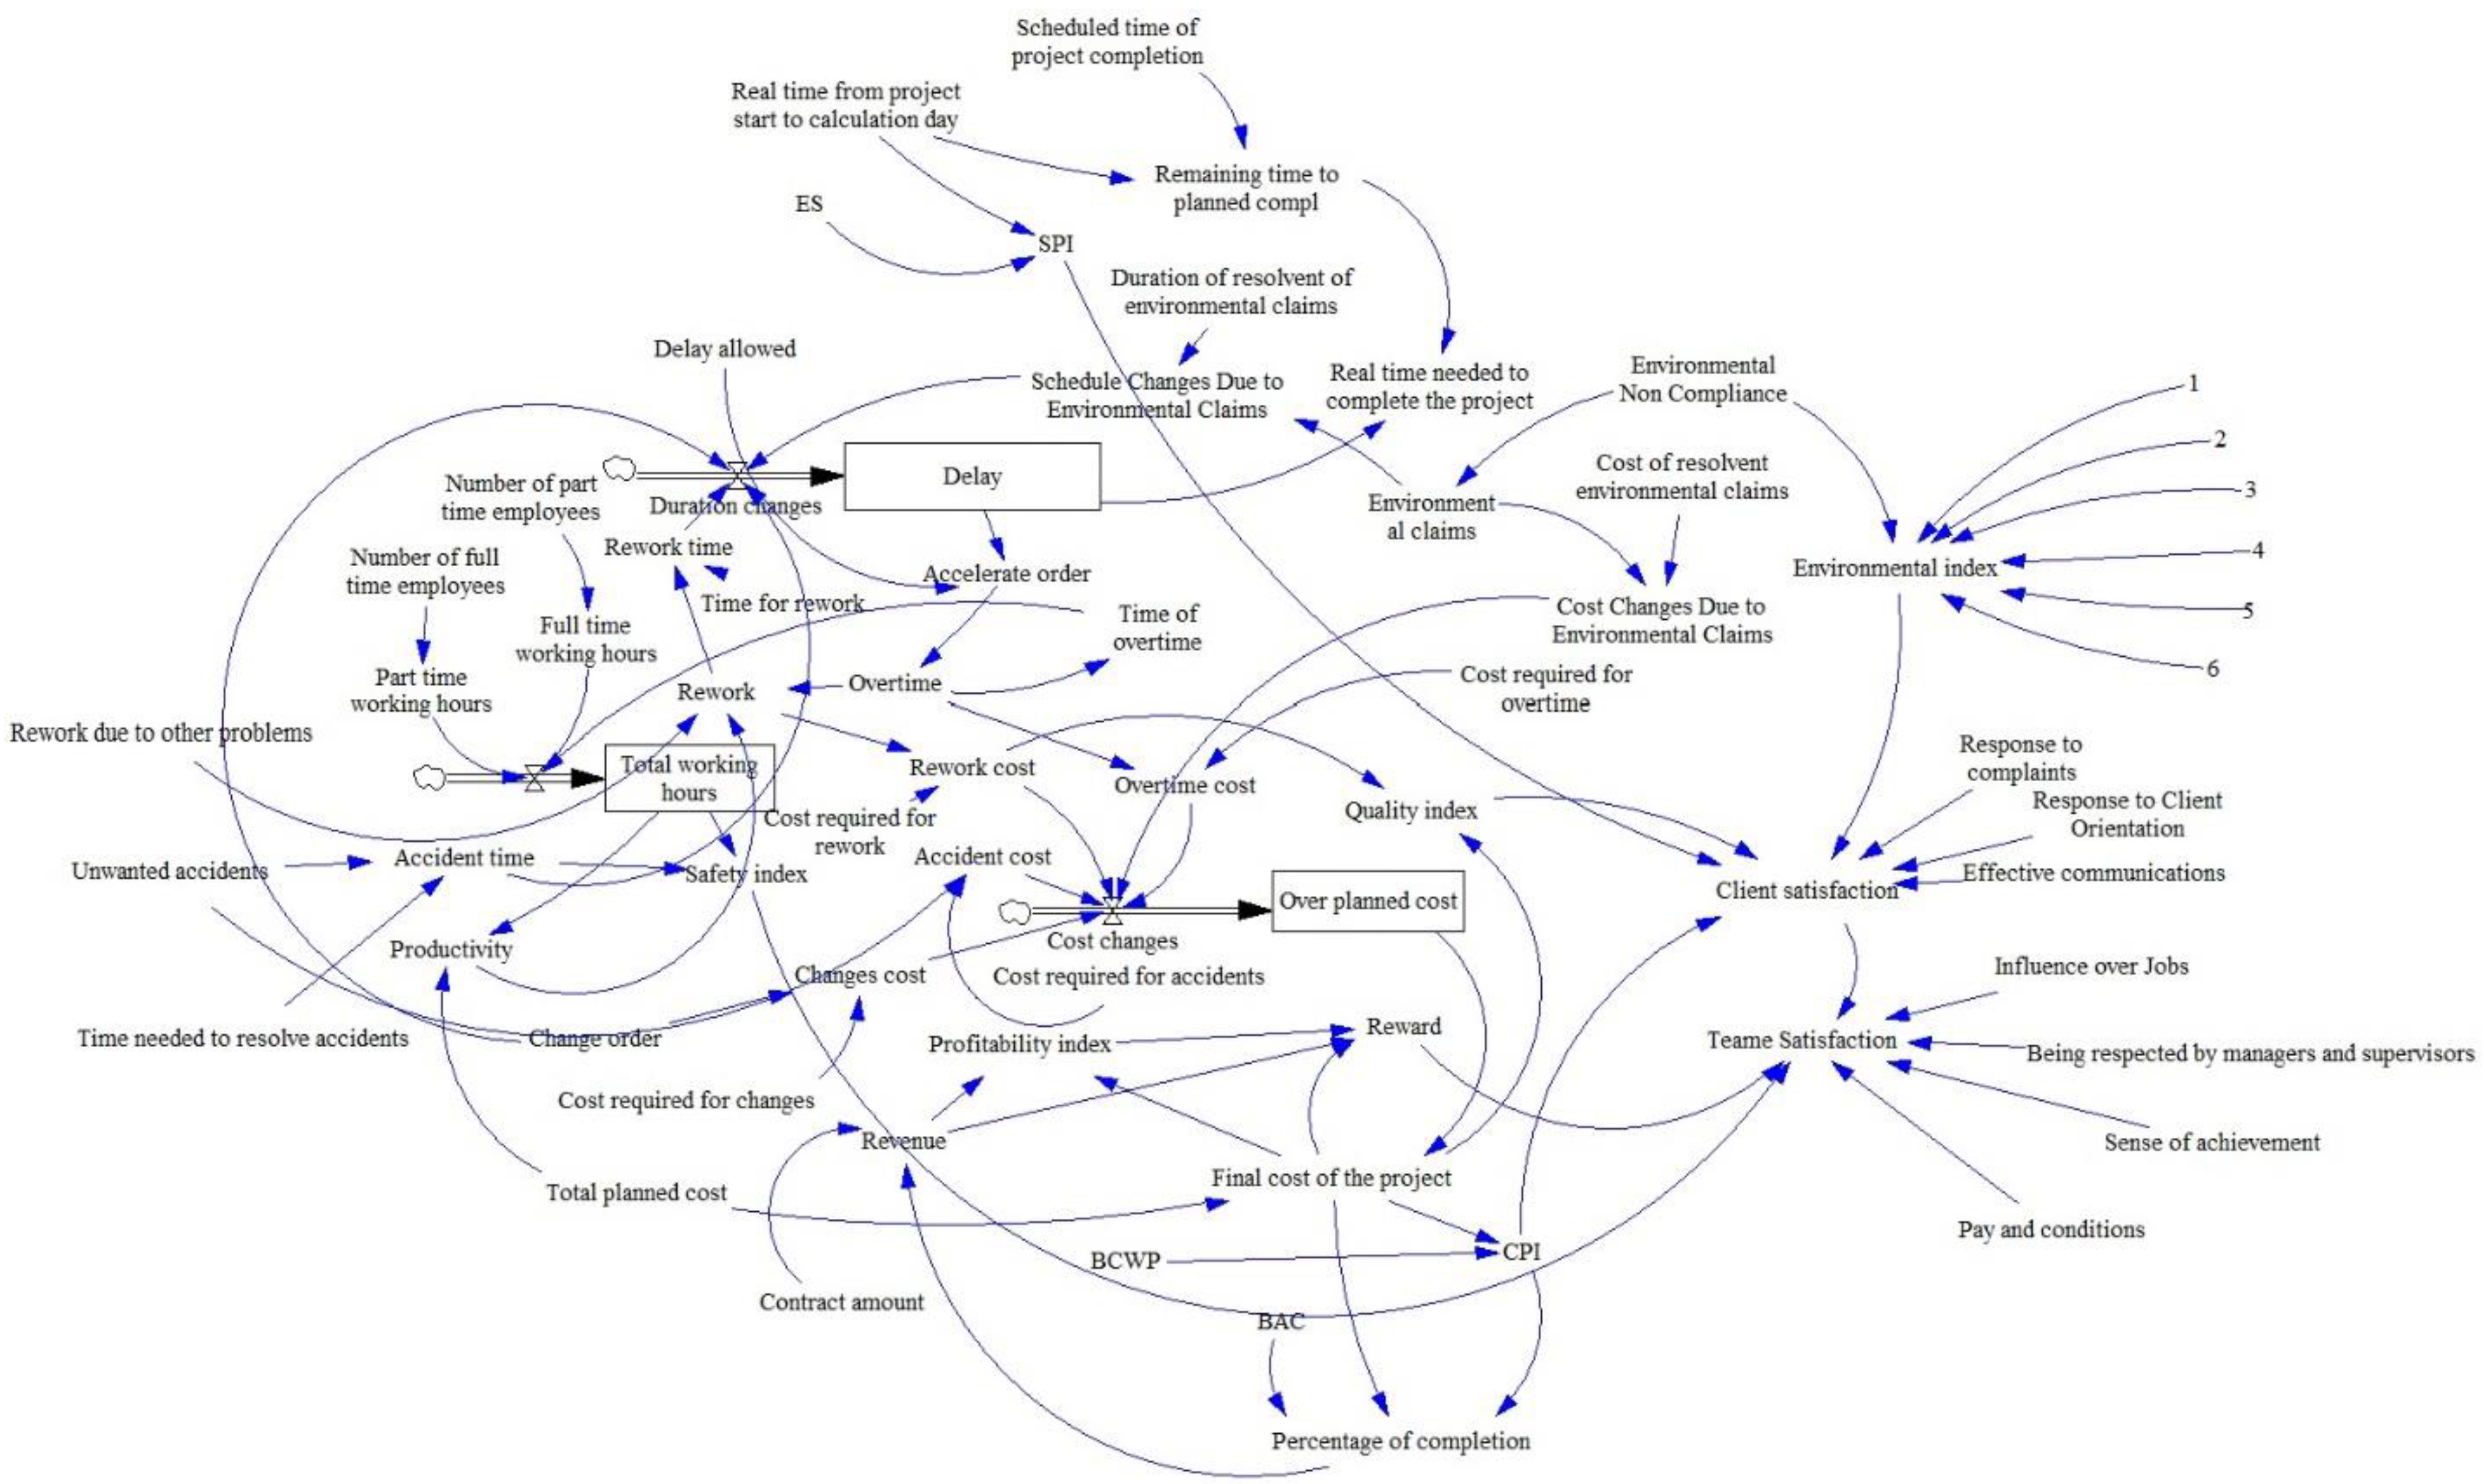
The following step is to prepare a model stock-flow chart, which was carried out in this study using the VENSIM software. At this stage, using the relationships in the causal diagram and examining the models presented in the previous research, as well as using auxiliary variables, a stock-flow chart for the problem was drawn, which is shown in
Figure 2.
In fact, after performing qualitative modeling, which involves selecting the factors that affect the performance of the project and determining the qualitative relationships between them, quantitative modeling was performed. At this stage, the mathematical relationships between all the influential factors and parameters were determined [
88] so that the model could determine the final performance of the project.
The last step is to validate the model. In this research and the proposed model, the qualitative model of the project was based on the system diagrams, feedback loops, and existing relationships by specialists and experts involved in the review and accreditation project. Additionally, since most of the relationships and hypotheses considered from the very early stages were obtained through a review of research literature and interviews with experts and specialists, accreditation and assurance of their accuracy could be verified. Additionally, the relationship between the relevant mathematical equations was accurately assessed and validated by available sources and experts. Additionally, the dimensions and parameters in the system were checked and validated by the automatic functions in the software. The inputs and policies applied were checked and compared with the actual behavior of the model. Additionally, different time steps were tested and the model was re-run, which did not make any difference in the obtained results (i.e., different time steps such as 0.5, 25.2, 0.025, 0.0625, etc.). A summary of these validations is provided in
Table 6.
4. Case Study
The project under study was a reconstruction of a reservoir dam with an annual regulated water volume of 47 million cubic meters in one of the areas of Kermanshah province, located in the West of Iran, to supply the required water for about 3200 hectares of agricultural land.
The initial estimate of the project cost was 22,000,000,000 Iranian Rials (687,500 US Dollars), which, considering the contractor’s coefficient of 23.3%, corresponded to a contract of 27,126,000,000 Iranian Rials (847,687.5 US dollars). According to the schedule, this project should take 3 months. The project should start on 26 May 2019 and end on 27 September 2019, but due to the reasons given in
Table 7, on 5 January 2019, when this simulation was performed, 68% of the work was done, 15% was ongoing, and the rest had not yet begun.
Information about the project under study includes the initial information listed in
Table 7 and other information such as the number of employees, working hours, change and acceleration orders by the owner, the contractor, and the imposed conditions, costs, and time required to perform these orders, and other issues entered and classified in an EXCEL file; then, the EXCEL file is applied to the desired model through the corresponding field in the software and the model is executed. The results of the model implementation were compared by the software based on the input data with the actual results of the ongoing work and the accuracy of the model. In the next step, the proposed policies shown in
Table 8 were applied to the model and re-simulated.
5. Results and Discussion
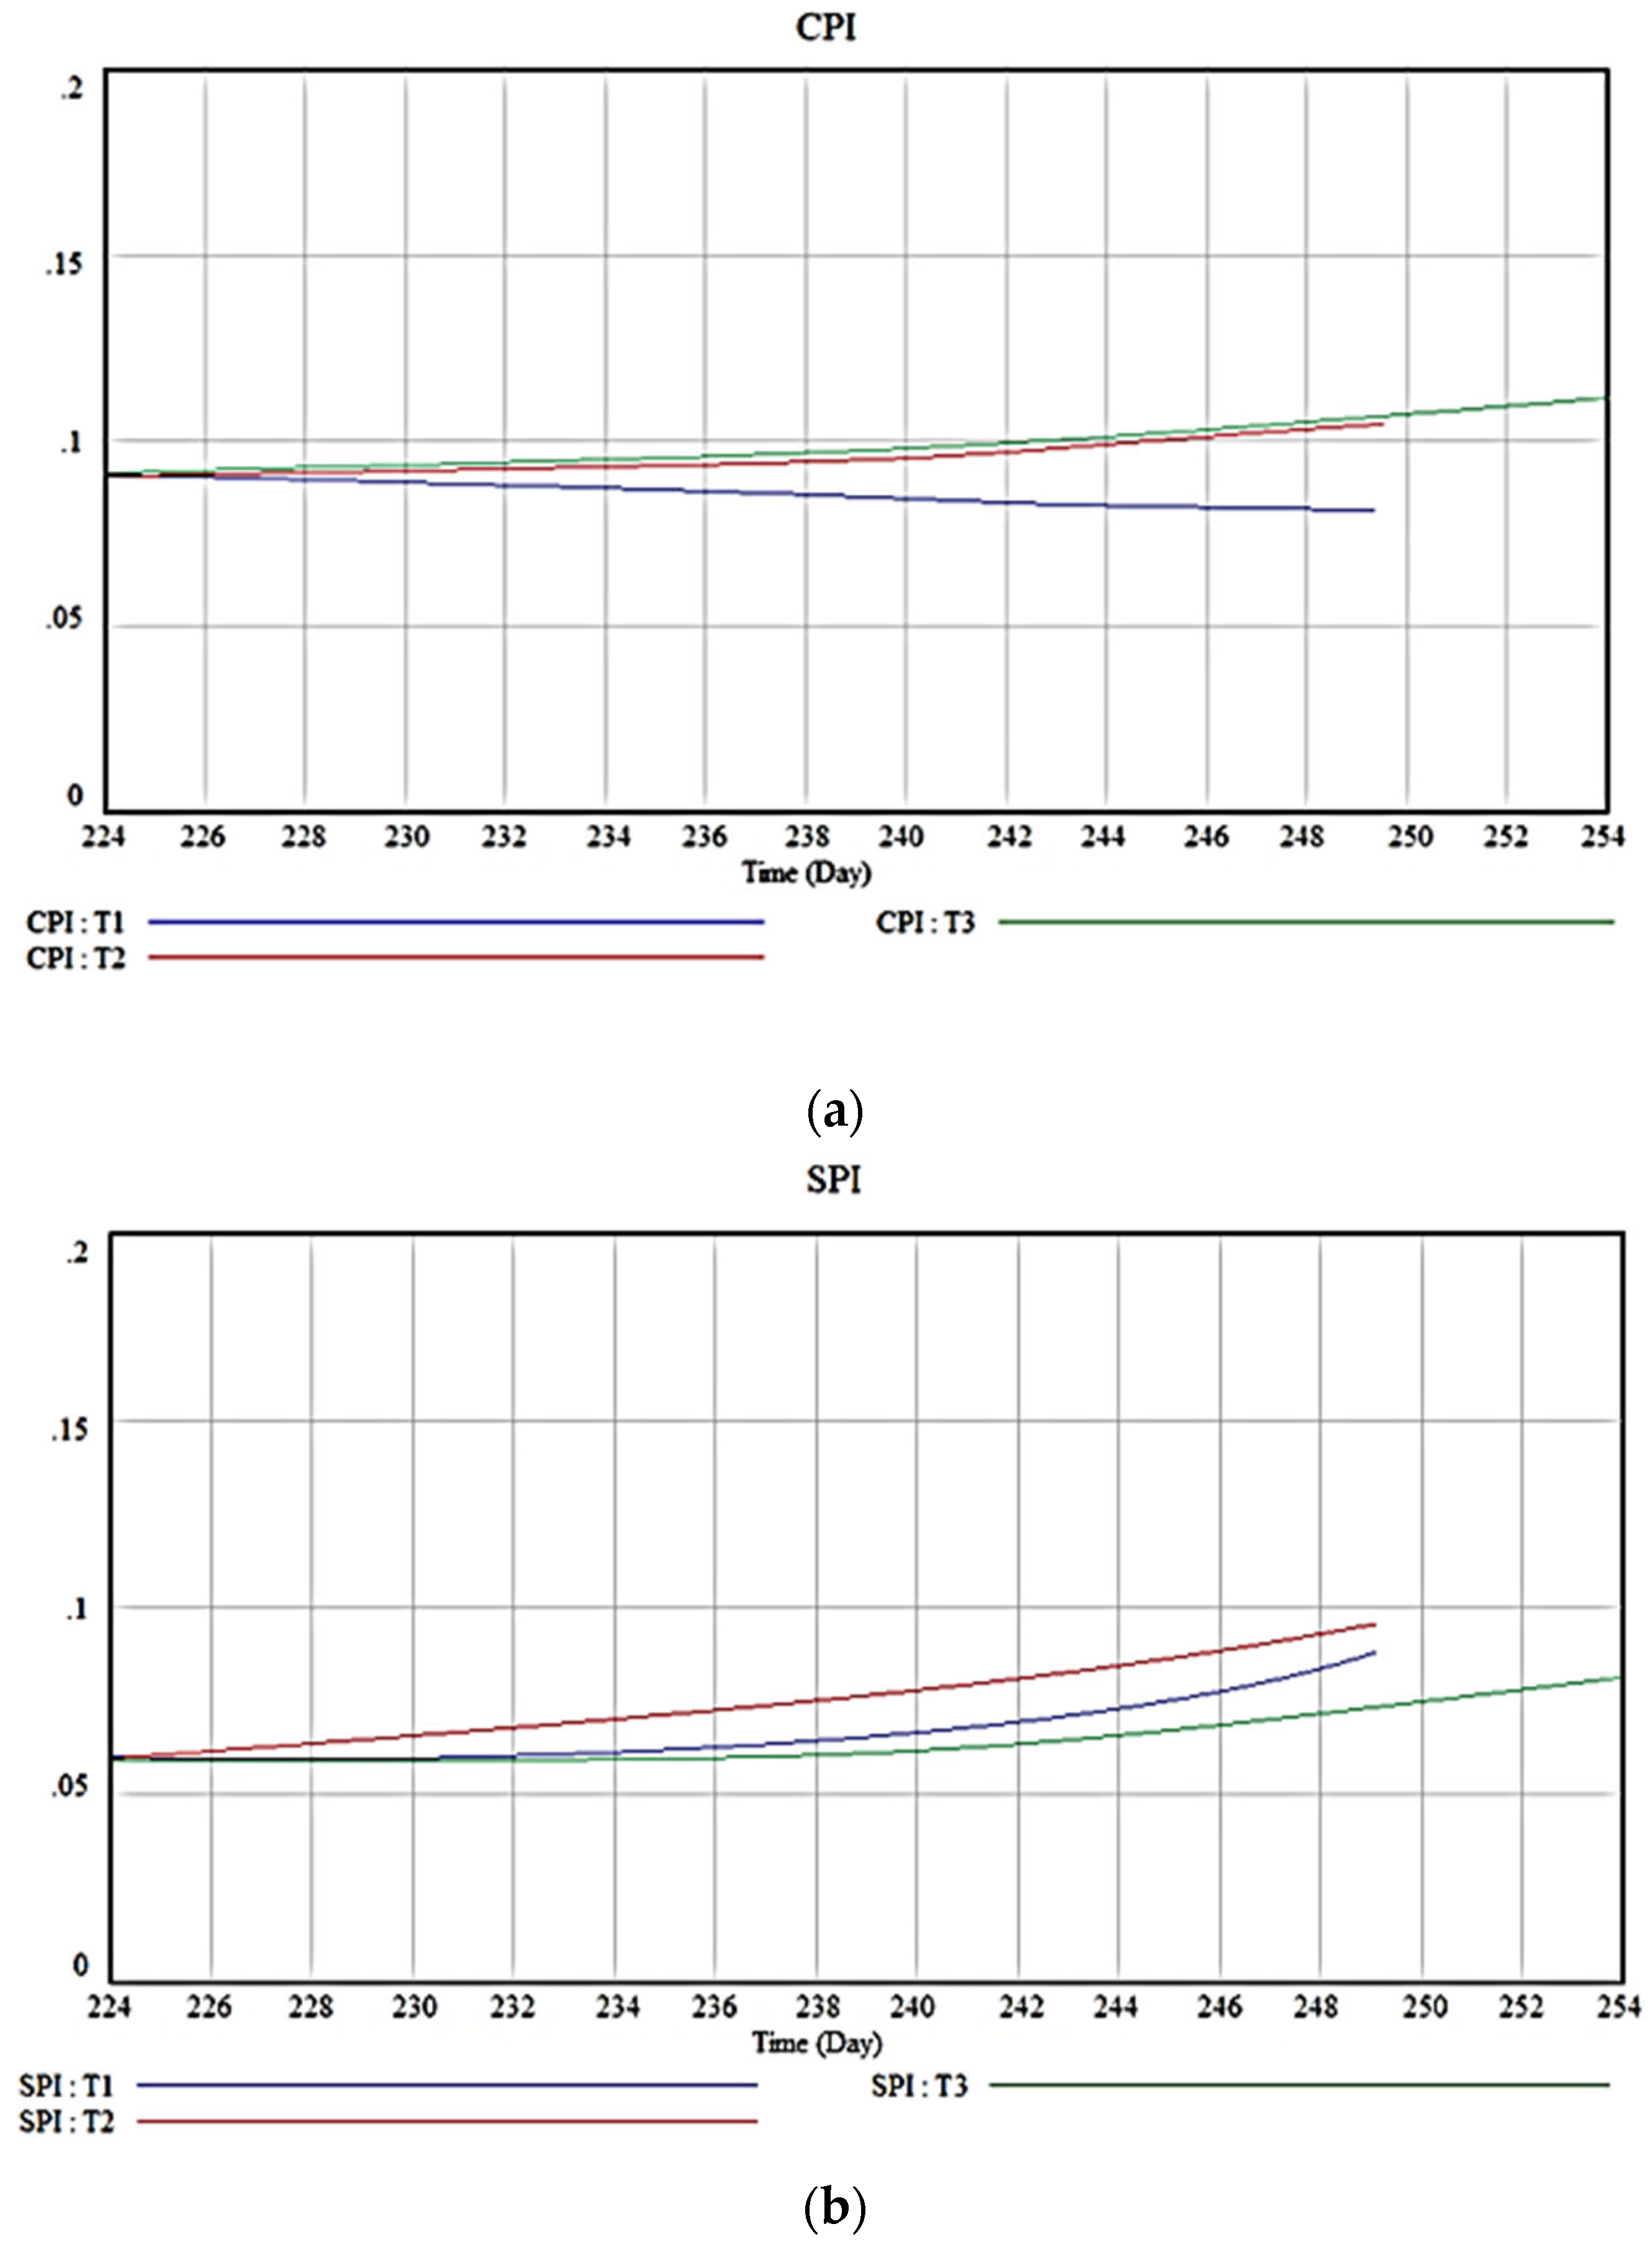
The output results for the two KPIs of time and cost are shown in
Figure 3. This was carried out to test the decisions made to improve the project implementation process and to determine what the outcome of each decision will be in the future.
As the results of the software showed, applying the first policy, i.e., increasing the number of employees, will complete the project on the 249th day. This means that the project will be completed 26 days after the policy is implemented and the number of employees is increased. However, project cost performance (Cost Performance Indicator (CPI)) is declining. This is because by applying this policy, the cost of salaries and benefits of employees will increase, and the cost will decrease in performance. However, as time goes on and, the performance of the schedule (Schedule Performance Indicator (SPI)) improves. Increasing the number of employees will reduce the workload, stress, and pressure from other employees, which will reduce fatigue, increase the quality of work done and, as a result, improve employee satisfaction.
By applying the second policy, both the performance of the schedule and the cost will be improved, and the project will be completed on the 26th day after applying the policy. However, speeding up the work puts pressure and fatigue on employees, and thus reduces productivity, which may reduce the quality of work done, create re-work, and thus reduce employee and customer satisfaction.
The third policy, which is to proceed according to a set schedule and previous work resources, completes the project on the 30th day after the policy is applied and improves the project’s time and cost performance to some extent.
The results of three policies are summarized in
Table 9.
In this section, the project manager can make a decision based on the conditions and limitations of the project delivery time to select the desired policy and choose the best option according to the results and their analysis. In fact, the project manager can make the final decision according to the information in
Table 10 and the existing conditions, and this dynamic model and online decision testing will be a great help in advancing the project towards the final goals.
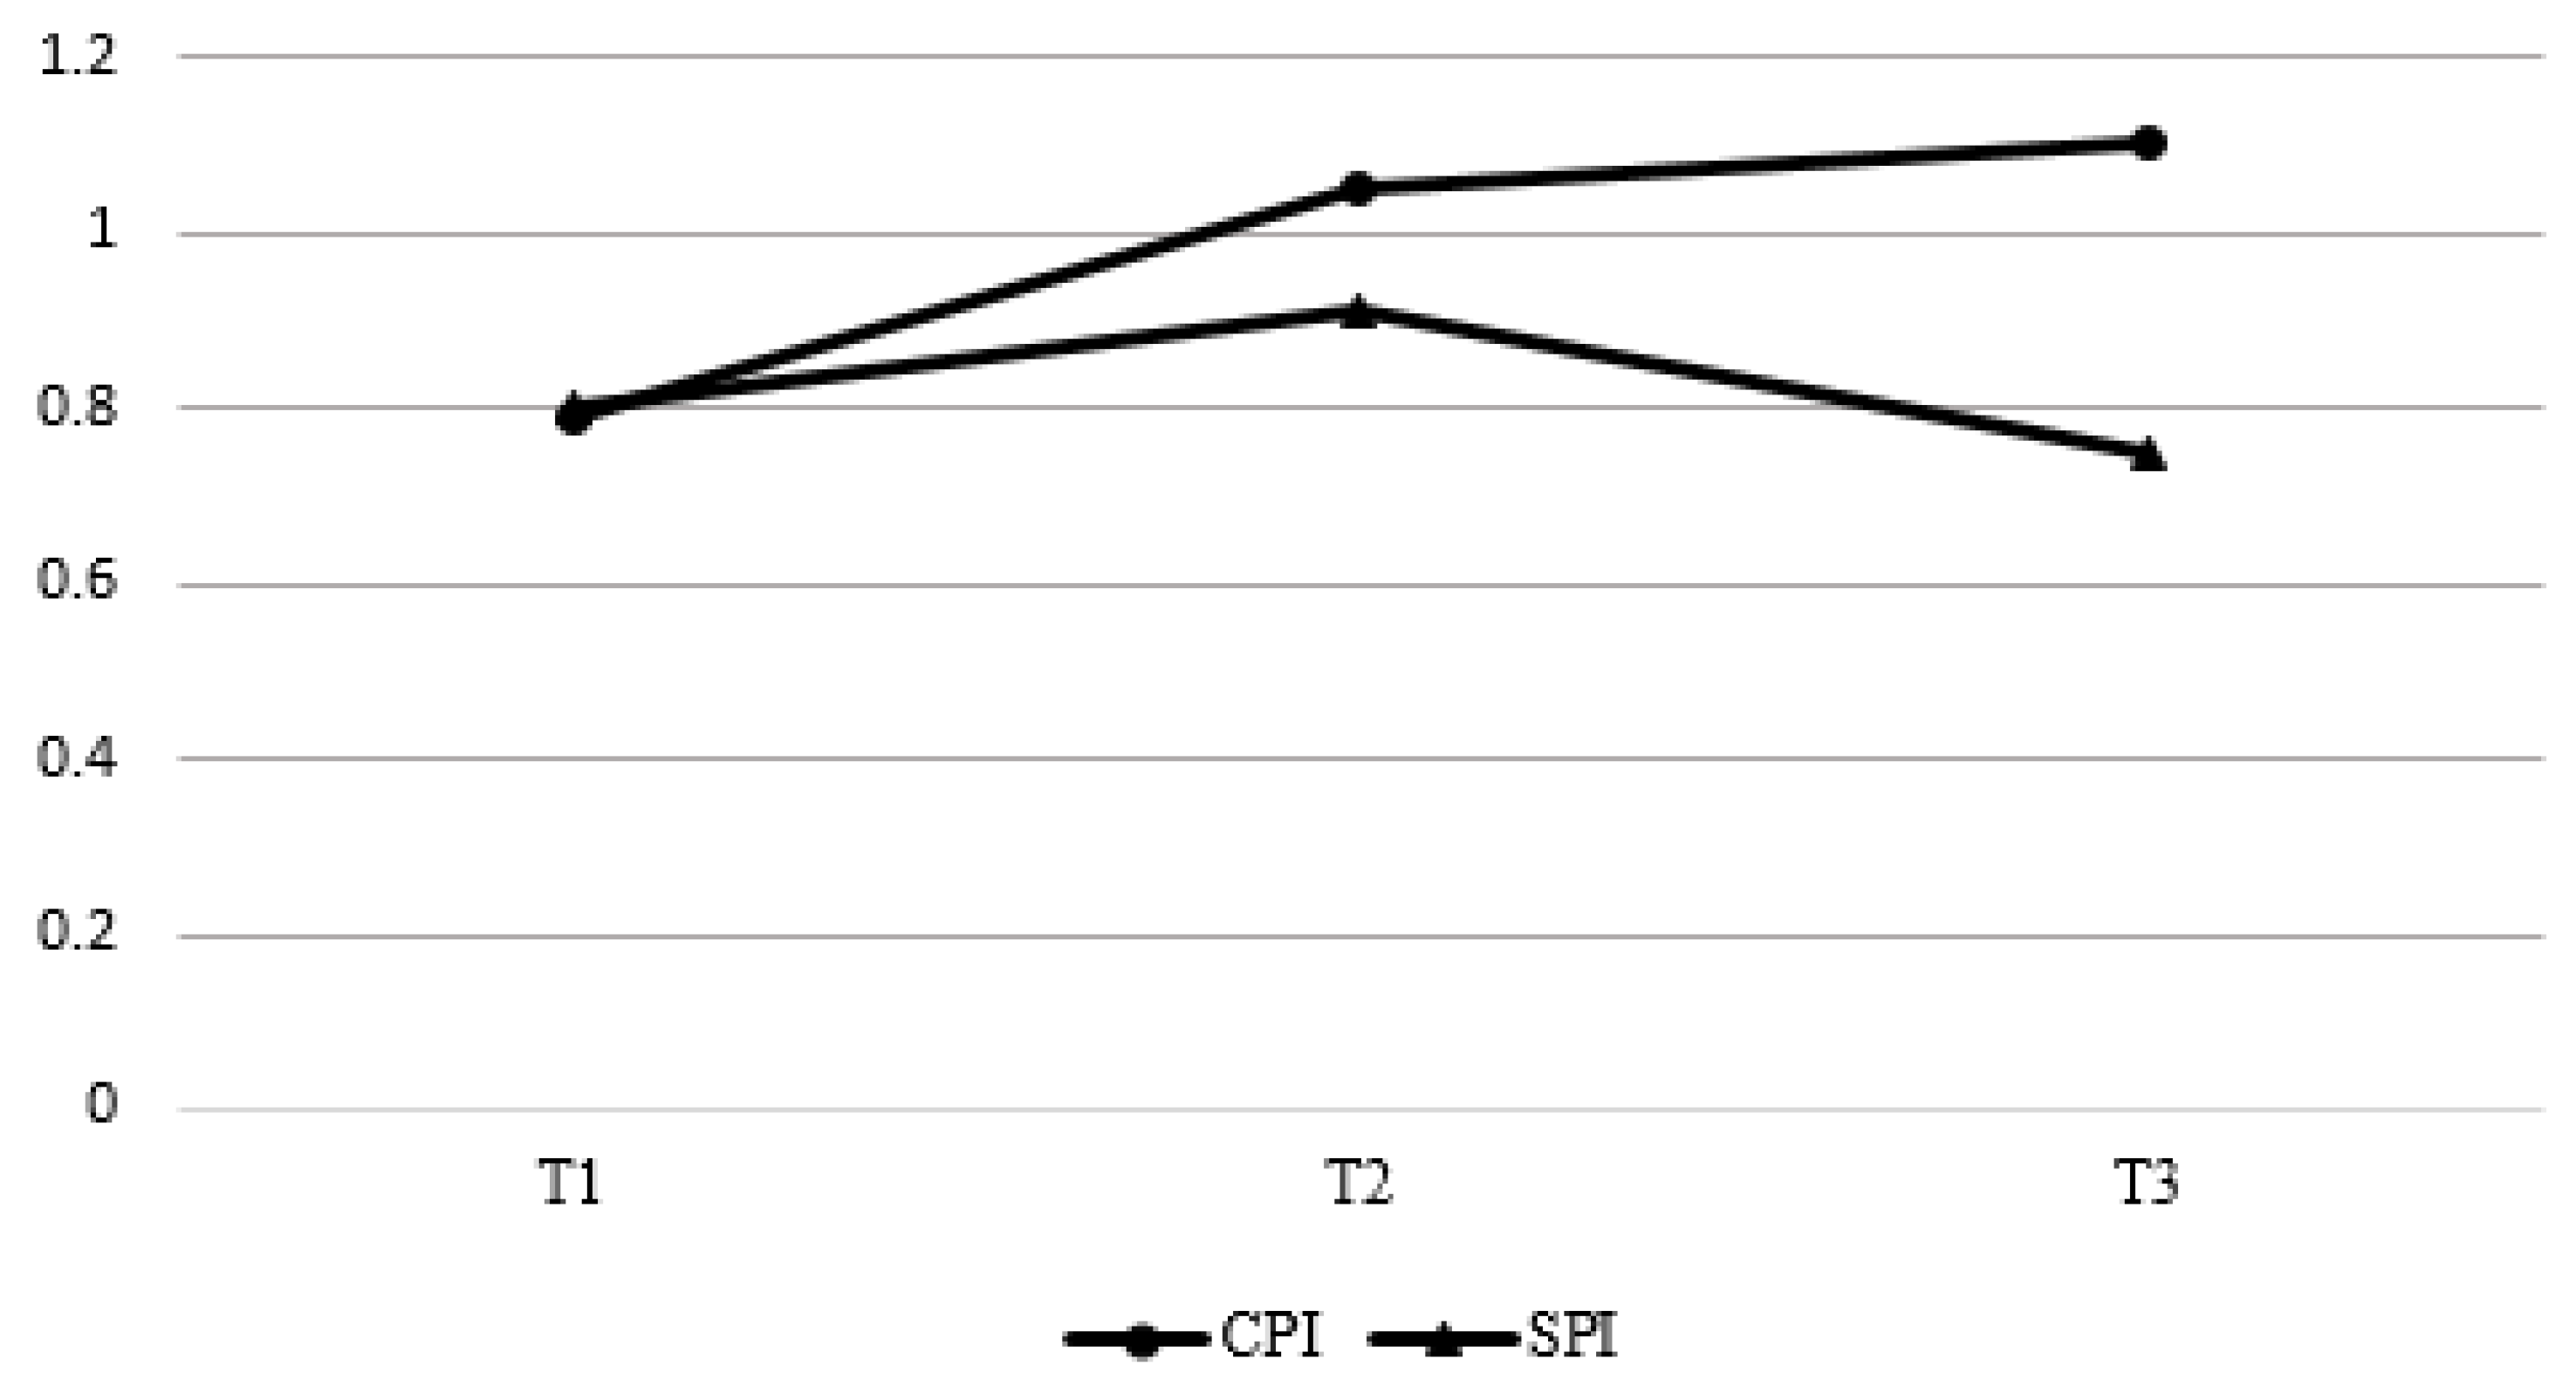
The comparison results of the analysis are shown in the following diagram (
Figure 4).
The advantage of the system dynamics method is in this regard is that, due to the dynamics of the model and the results of simulations, it is possible to apply possible decisions and conditions to the model and predict the final results and performance. Additionally, it helps project managers achieve early warning of problems and issues. Accurate and reliable forecasting of project performance is critical to the success of construction projects.
As we said in the previous sections, the ranking of scheduling, cost, quality, customer satisfaction, and team satisfaction indicators according to the results of the questionnaires is shown in
Table 10. According to the survey, the cost index is the first priority and the scheduling, quality, customer satisfaction and team satisfaction indices are in the next ranks, respectively. These results are general and typical for all types of construction projects.
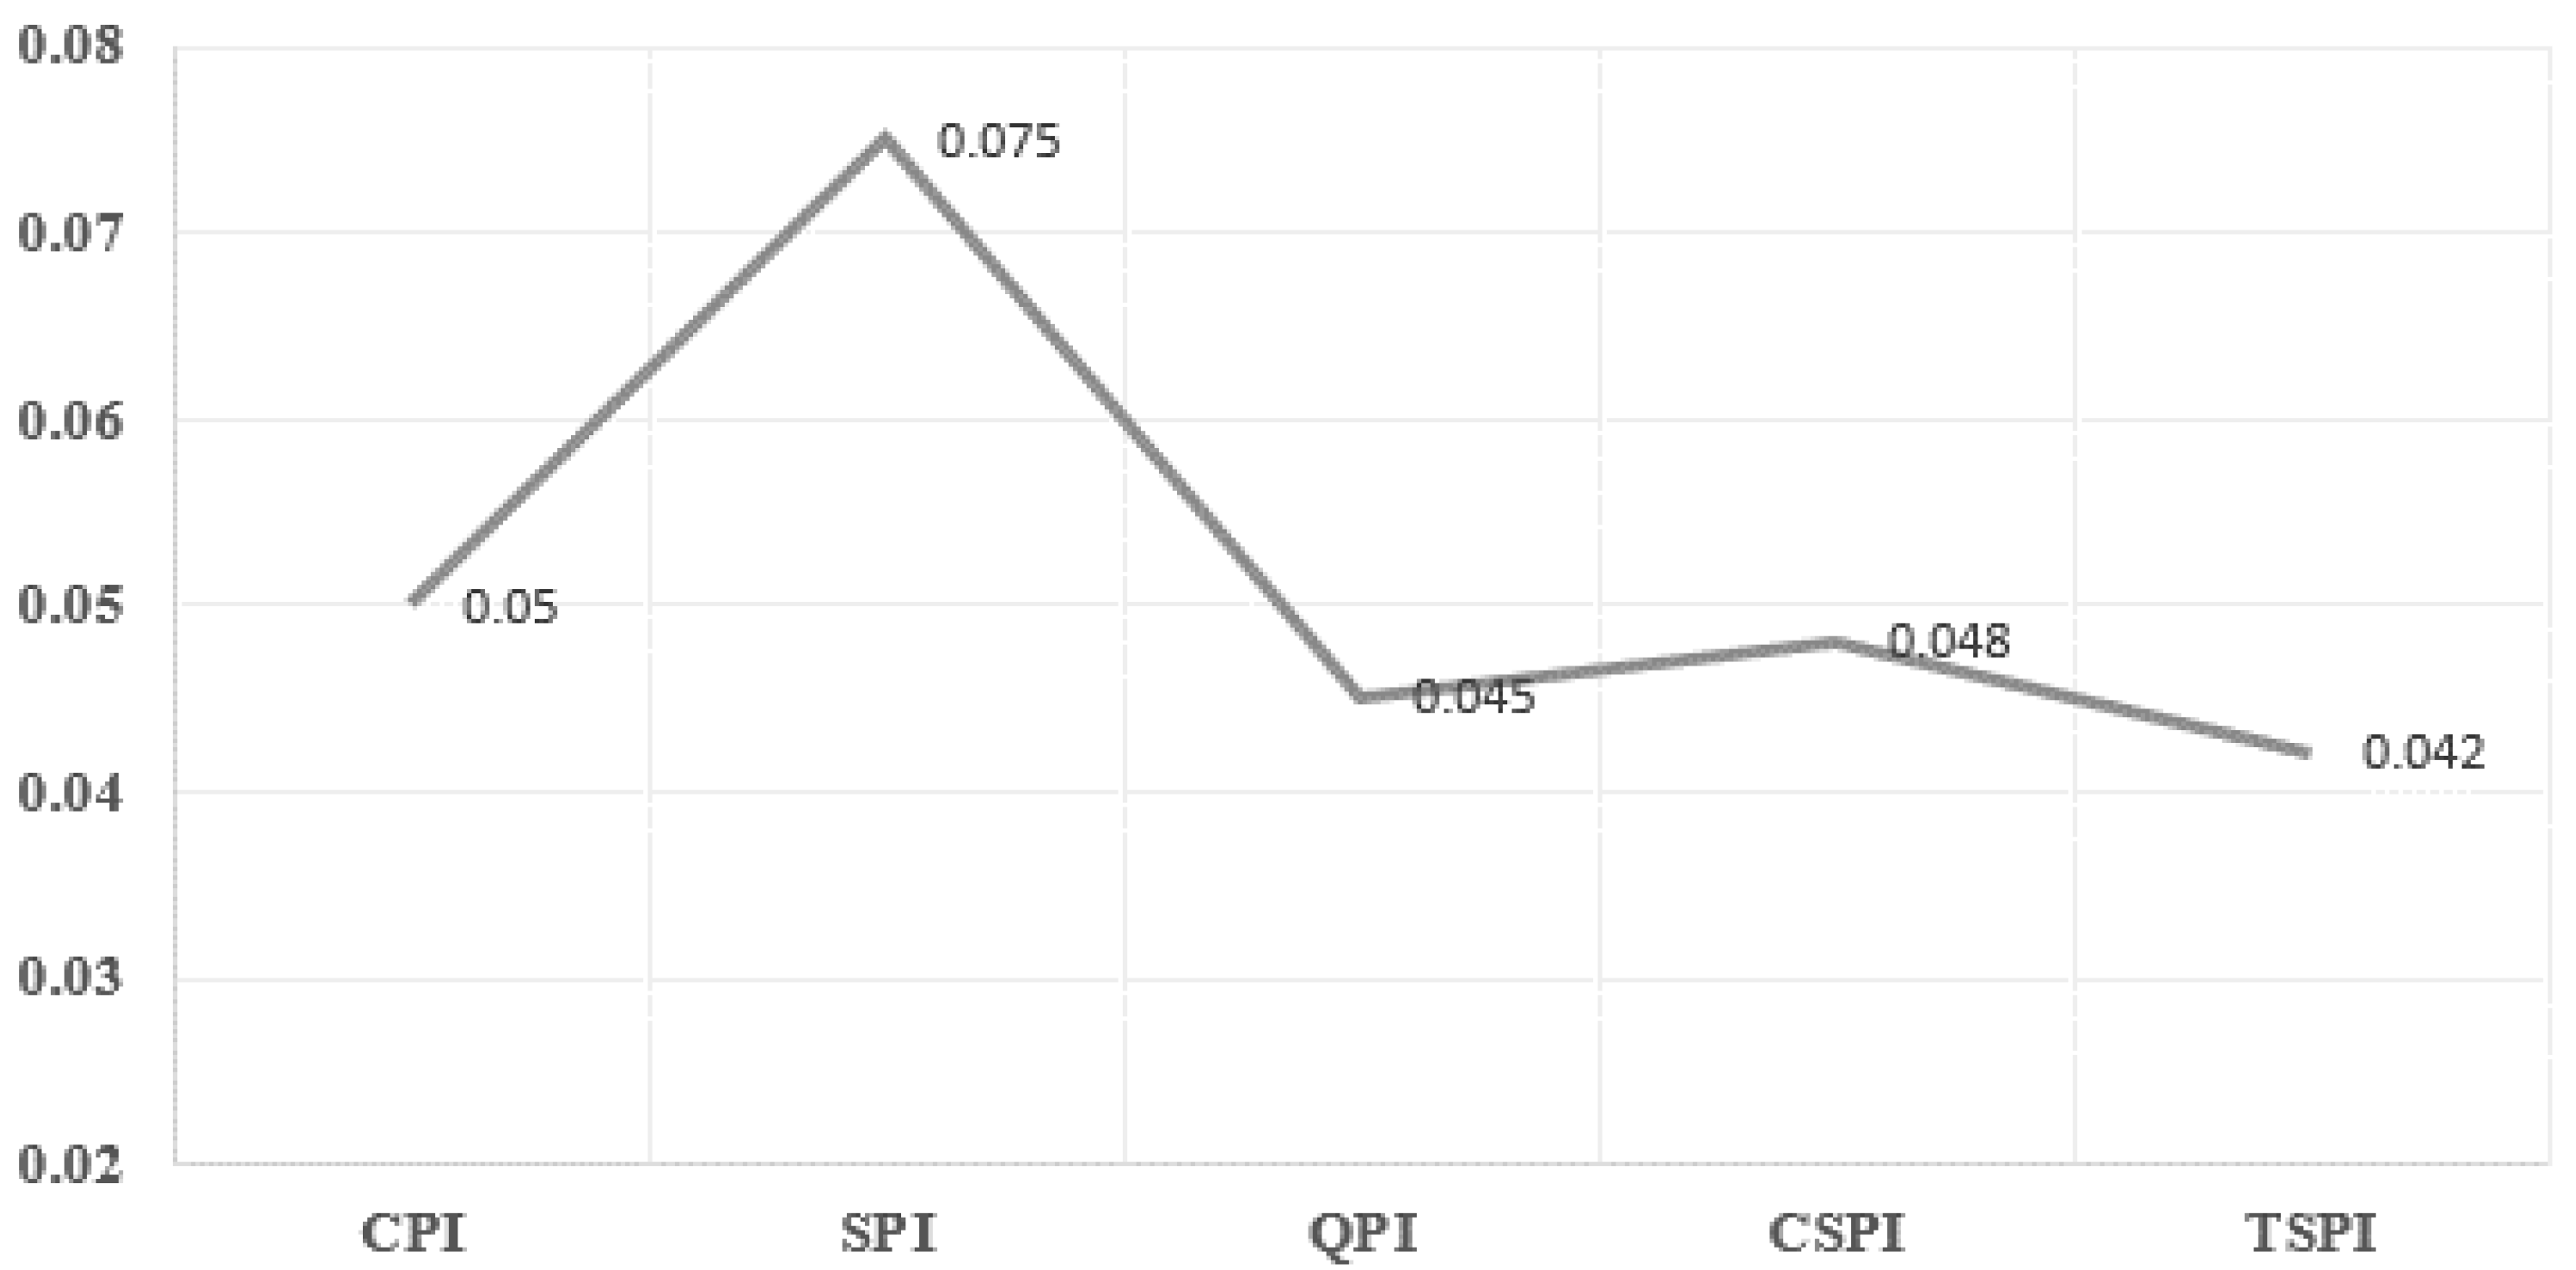
At this stage, project data with ideal conditions and without implementation problems were considered as inputs for the VENSIM software and the final values of the indicators were obtained as outputs. Then, a series of dispute and claim problems related to the costs and time as well as required resources for each of the reasons for the claim were added to the software and the outputs were obtained. The difference in the value of each of the indicator is shown in
Figure 5, which depicts the rate of change of indicators due to the application of problems and delays to the model. According to this simulation, in this type of project studied in this research, the first priority is with scheduling (SPI), and the indicators of cost (CPI), customer satisfaction (CSPI), quality (QPI), and team satisfaction (TSPI) are in the next ranks. This means that the use of system dynamics and simulation helps significantly in building problems. In fact, using this method, correct management decisions can be made in any project according to the type of project, project scale, and considering all factors and types of dependencies in the project. This is another advantage of using the system dynamics method.
6. Conclusions
In the construction industry, project managers should accurately forecast the future status of projects. However, given the complexity of construction projects, such predictions require critical information about the project, which is used to evaluate project performance and ultimately predict it. In this research, the most important measurement systems and frameworks were identified by reviewing the literature in the field of construction project performance. Additionally, the KPIs were used to evaluate the performance of construction projects, which were collected through a comprehensive review of the relevant studies. The following KPIs were selected for this study: safety, cost, quality, timing, productivity, customer satisfaction, profitability, team satisfaction, environment, and sustainability. Then, the KPIs were prioritized and ordered using the Analytic Hierarchy Process (AHP) method as follows: 1—safety, 2—environment, 3—cost, 4—profitability, 5—scheduling, 6—efficiency, 7—sustainability, 8—quality, 9—customer satisfaction, and 10—team satisfaction.
After prioritizing the KPIs, the most important relationships and standards for measuring and evaluating each of these indicators were presented. These relationships and standards were identified by reviewing previous studies.
According to the existing literature, it can be said that claims occur in most construction projects. However, most of these claims are not met. It takes a lot of time and money every year to settle construction claims. Having a proper documentation system has become an essential requirement in resolving claims. This documentation system will help the claim management process to prevent disputes.
In the current study, the reasons for the claims were ranked using the TOPSIS method. Based on the obtained results, the prioritized reasons for the claims in construction projects were as follows: delay, changes, acceleration, extra-work, different site conditions, and contract ambiguity.
Delays with a coefficient of close to 0.728 were the most important cause of claims that have a significant impact on the KPIs. The changes that occur in most construction projects were in second place with a coefficient of 0.640. Acceleration in work, additional work, changes in workshop conditions, and ambiguity in contracts with coefficients of 0.632, 0.519, 0.493, and 0.114 were the next priorities, respectively. In this way, the importance of a documentation and reporting system in projects is determined. Teaching team members and project staff about the requirements of contract clauses and determining the purpose of contract clauses are essential steps in development projects. This can reduce claims to some extent and resolve claims to improve performance and minimize disputes.
The next step in this research was to model system dynamics to predict the performance of construction projects. Accurate and reliable forecasting of project performance is critical to the success of construction projects. In recent years, the system dynamics as an efficient approach has been broadly exploited in project management for analyzing complex systems and assessing the systems’ adaptability to changes. In addition, this approach has been applied to the performance evaluation in the construction projects. As one of the main advantages of the system dynamics method, it is possible to apply different scenarios and conditions to the model and predict the final results and performance. In fact, predicting and managing the performance of construction projects is a complex and dynamic process. Therefore, it is better to use the system dynamics approach to accurately simulate the interrelationships and complex performance indicators and to provide a complete model to work with. The proposed model simulates the existing relationships between the KPIs of construction projects and their changes over time as well as provides a better understanding of how KPIs interact with each other. It also directs project managers to gain early warning of problems and issues to make the best decisions for preventive and corrective actions.
Lack of complete project documentation and difficulties in access to the project managers can be stated as the main research limitations.
As some suggestions for future research, the proposed methodology can be employed in other projects. Additionally, a combination of different simulation techniques is suggested for further studies due to the increasing complexity of construction projects. Therefore, other methods such as fuzzy sets theory and factor-based simulation methods can be integrated with the system dynamics to obtain accurate and results. In fact, all functional aspects of the project should be considered to accurately predict the future project performance. Additionally, BIM is suggested to access all the required inputs to the systems. A combination of the proposed method with BIM is also recommended for future research.


 ,
, 


