
An Analysis of the Development of Modular Building Design Elements to Improve Thermal Performance of a Representative High Rise Residential Estate in the Coastline City of Famagusta, Cyprus


Abstract
:1. Introduction
- To investigate how data-driven building performance simulation may be used to improve predictive capacity and develop robust retrofit solutions.
- To compare on-site walk-through thermal imaging survey campaigns in terms of simulation parameters, temporal resolution, and data application, and
- To identify a range of approaches within the literature, with a bias toward simulating simple performance models over detailed data-driven analysis.
1.1. Novelty of the Study
- Adding to the knowledge base for how to methodologically plan holistic retrofitting schemes and passive-cooling design strategies to not only reduce household energy consumption, but also to increase energy saving awareness by presenting schematic illustrations of retrofitting design interventions.
- Suggesting cost-effective mechanisms and priorities and energy-saving targets that could be effectively implemented at the policy level throughout the EU member states.
- Developing a novel energy-efficiency indicator that is more applicable to the development of an Energy Performance Certificate (EPC) of building implementation schemes than to any existing indicator that has been recommended by the Energy Performance of Buildings Directives (EPBD) objectives.
- Devising a conceptual framework of the STS approach to fill the knowledge gap and apply this to the ‘bottom-up’ design approach to formulate effective policy-making decisions related to energy use.
1.2. Contribution to Current Knowledge
1.3. Significance of the Study
2. Literature Review
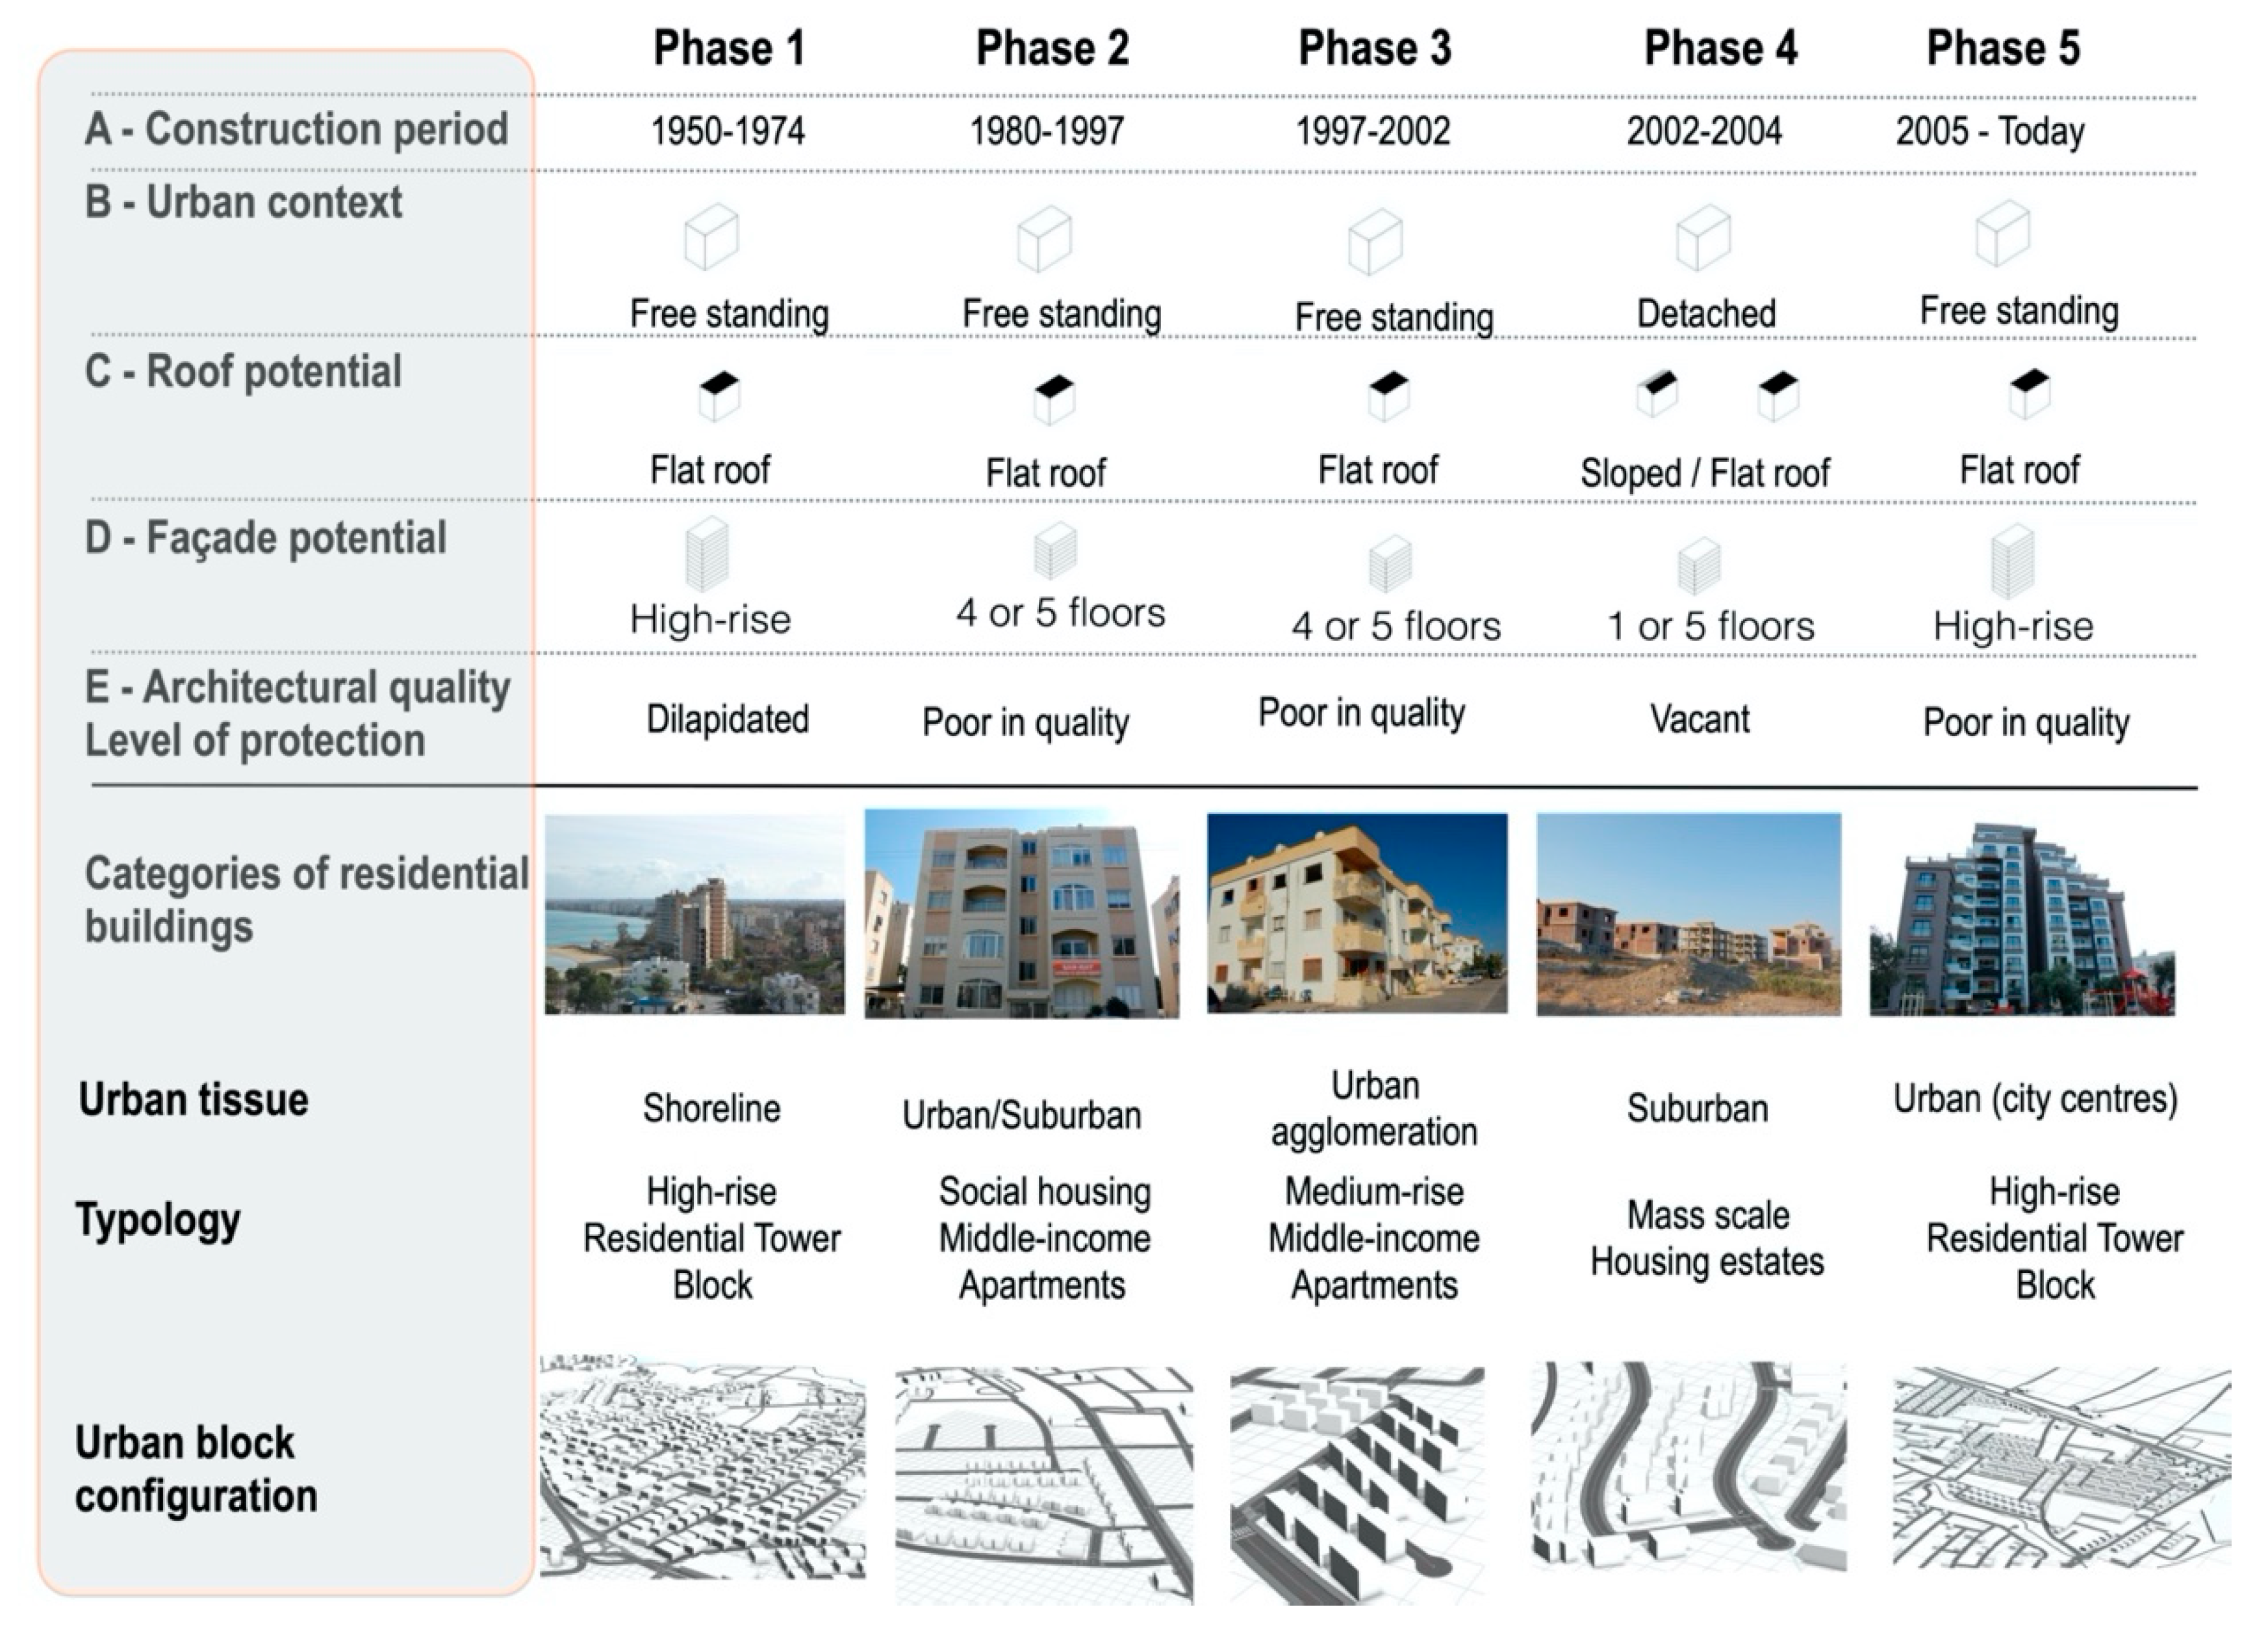
2.1. Identification of Nationally Representative Archetype Housing Stock
2.2. Building Performance Implications
2.3. Thermal Comfort in Residential Buildings in Europe
3. Methodology
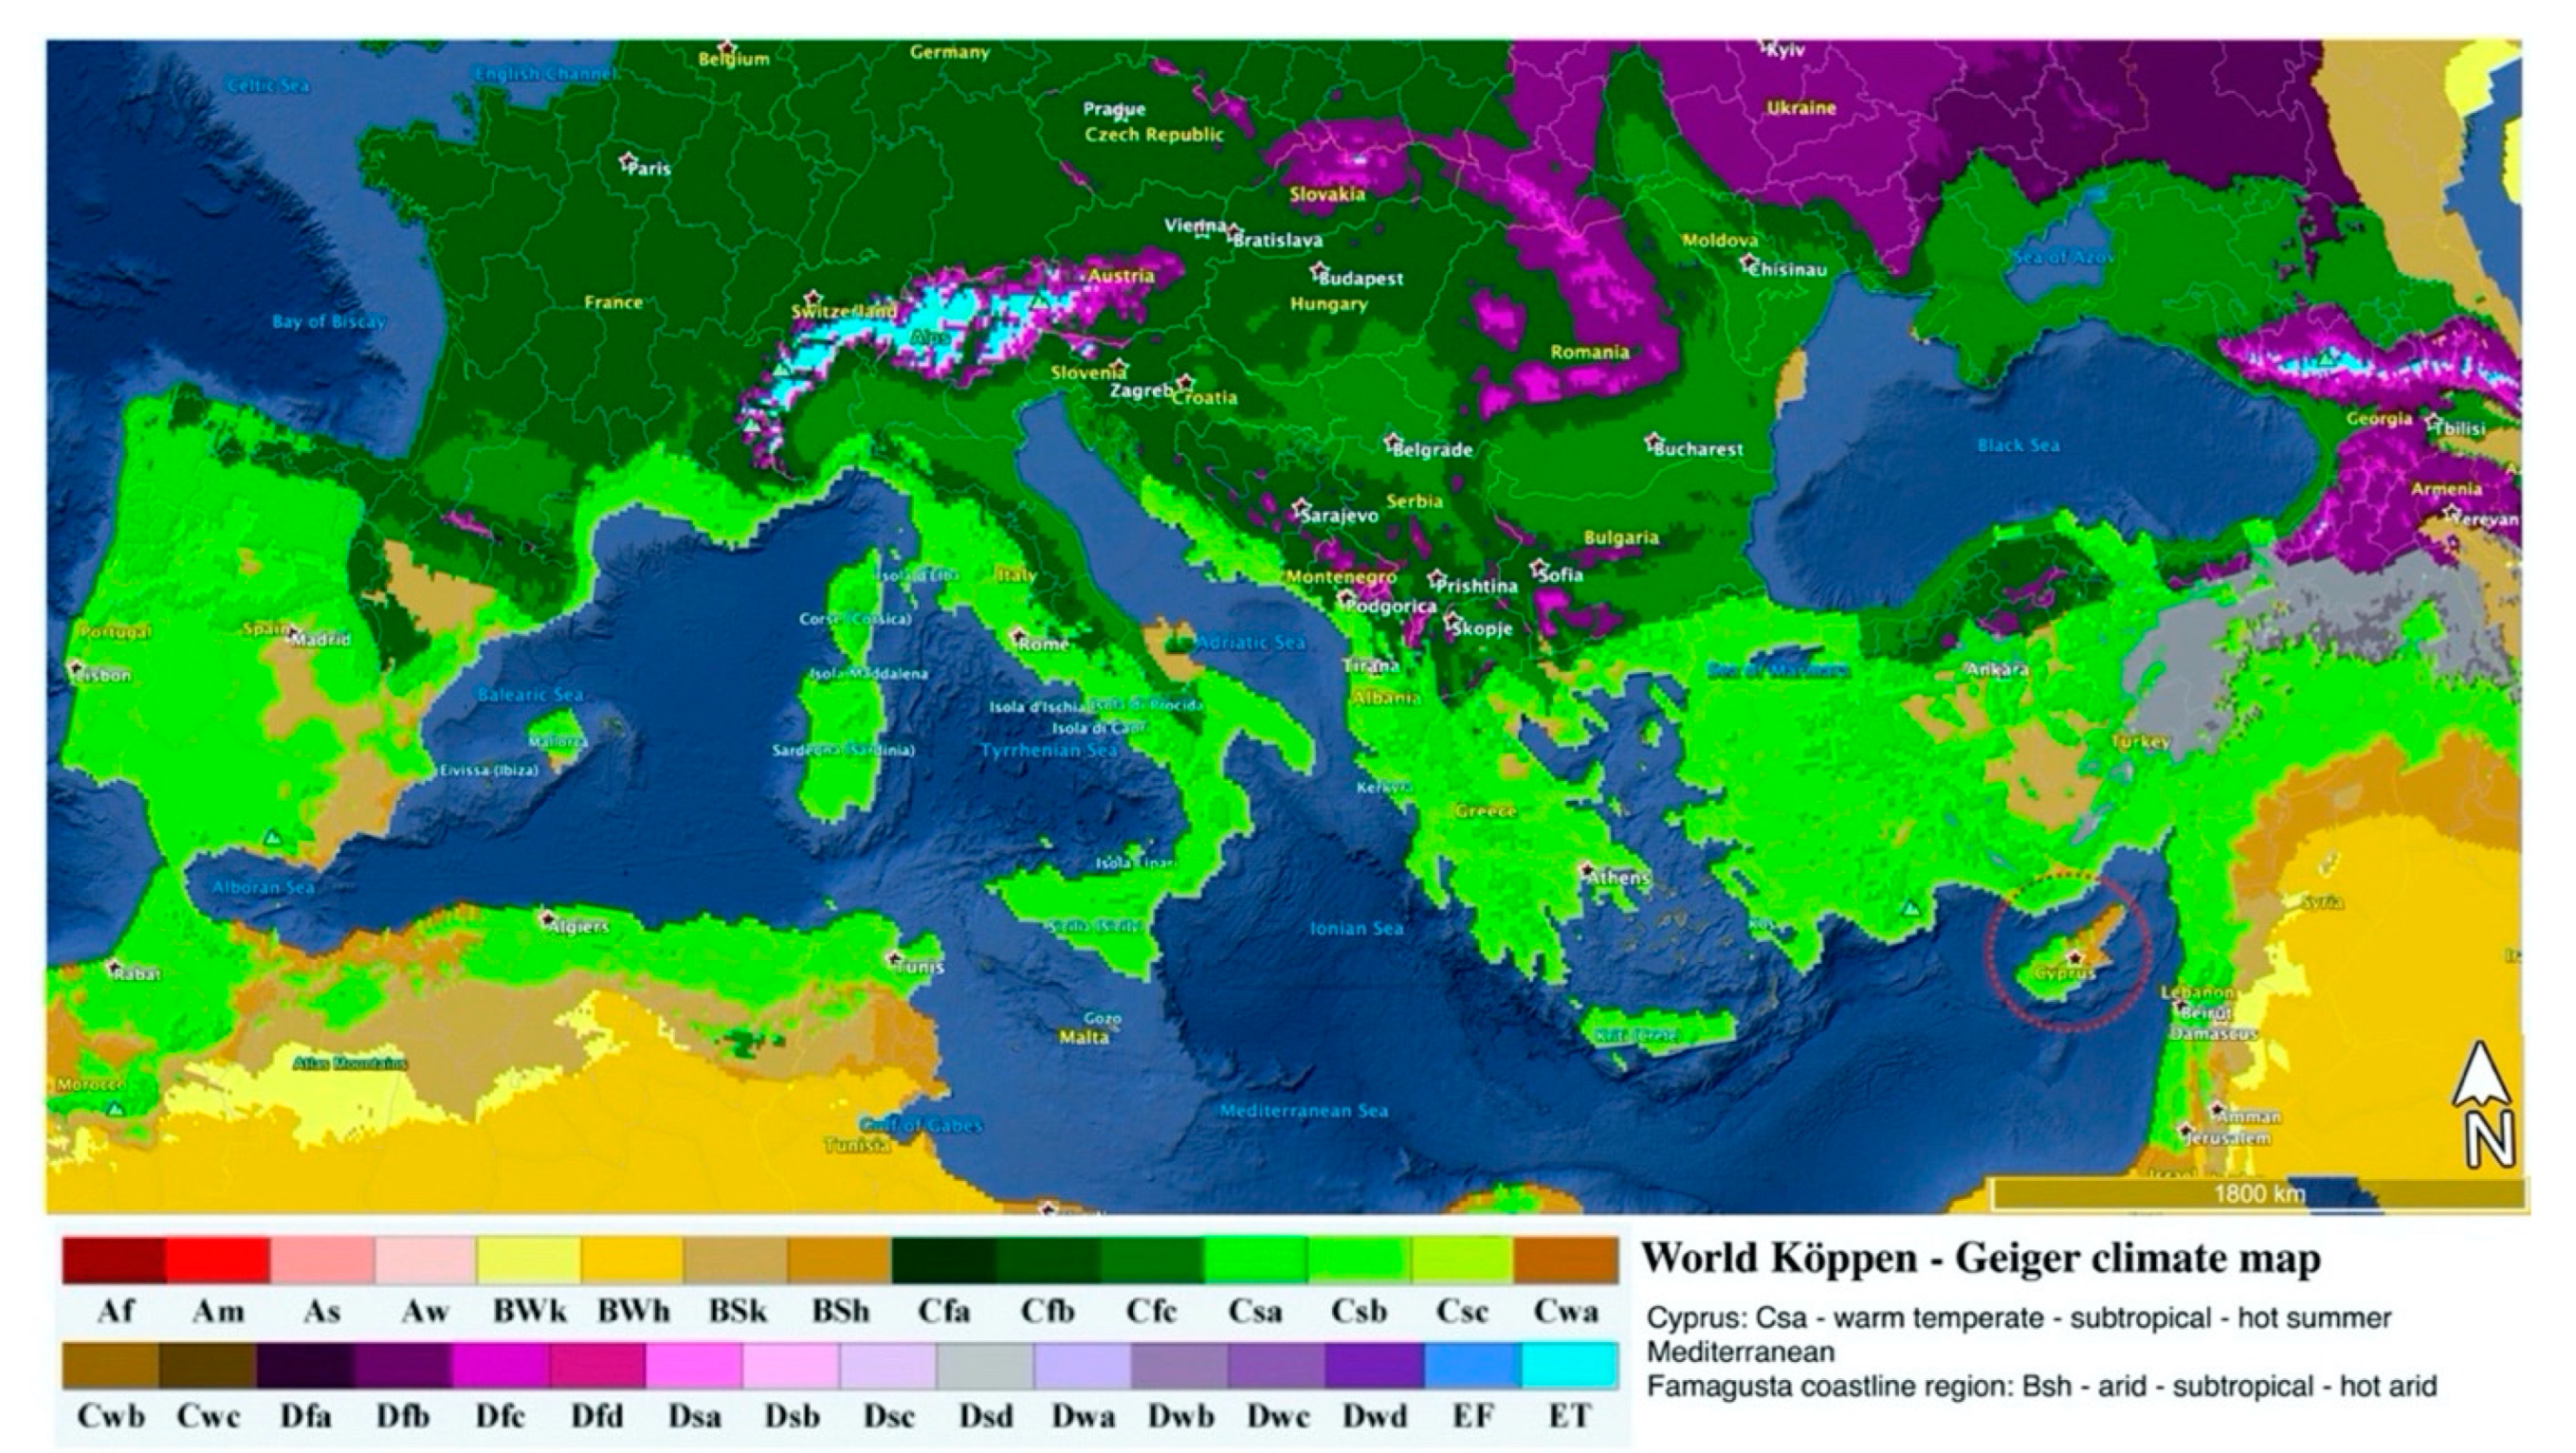
3.1. Eastern Mediterranean Island of Cyprus
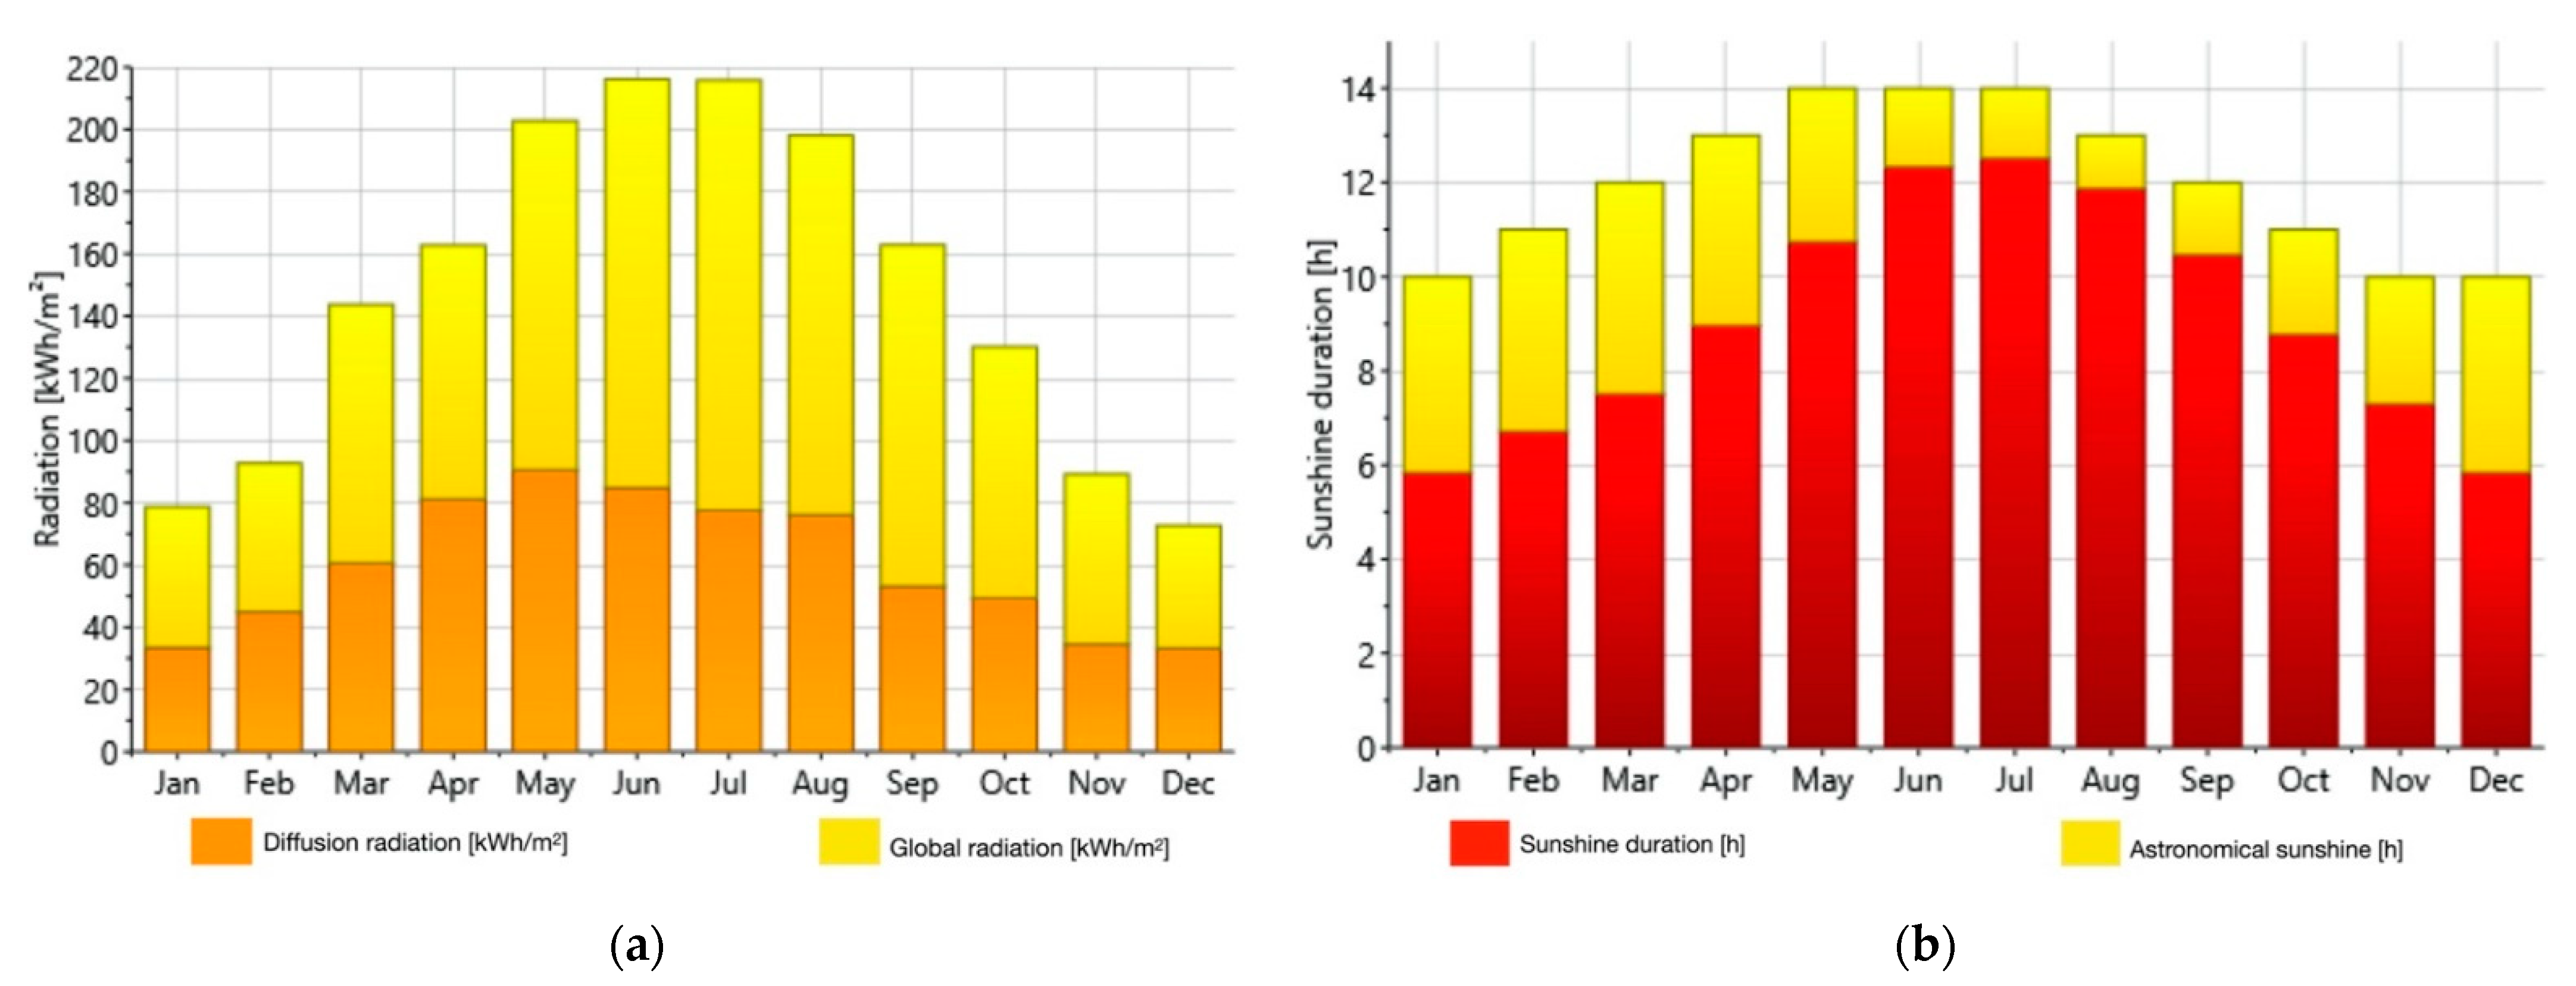
3.2. Climate Characteristics
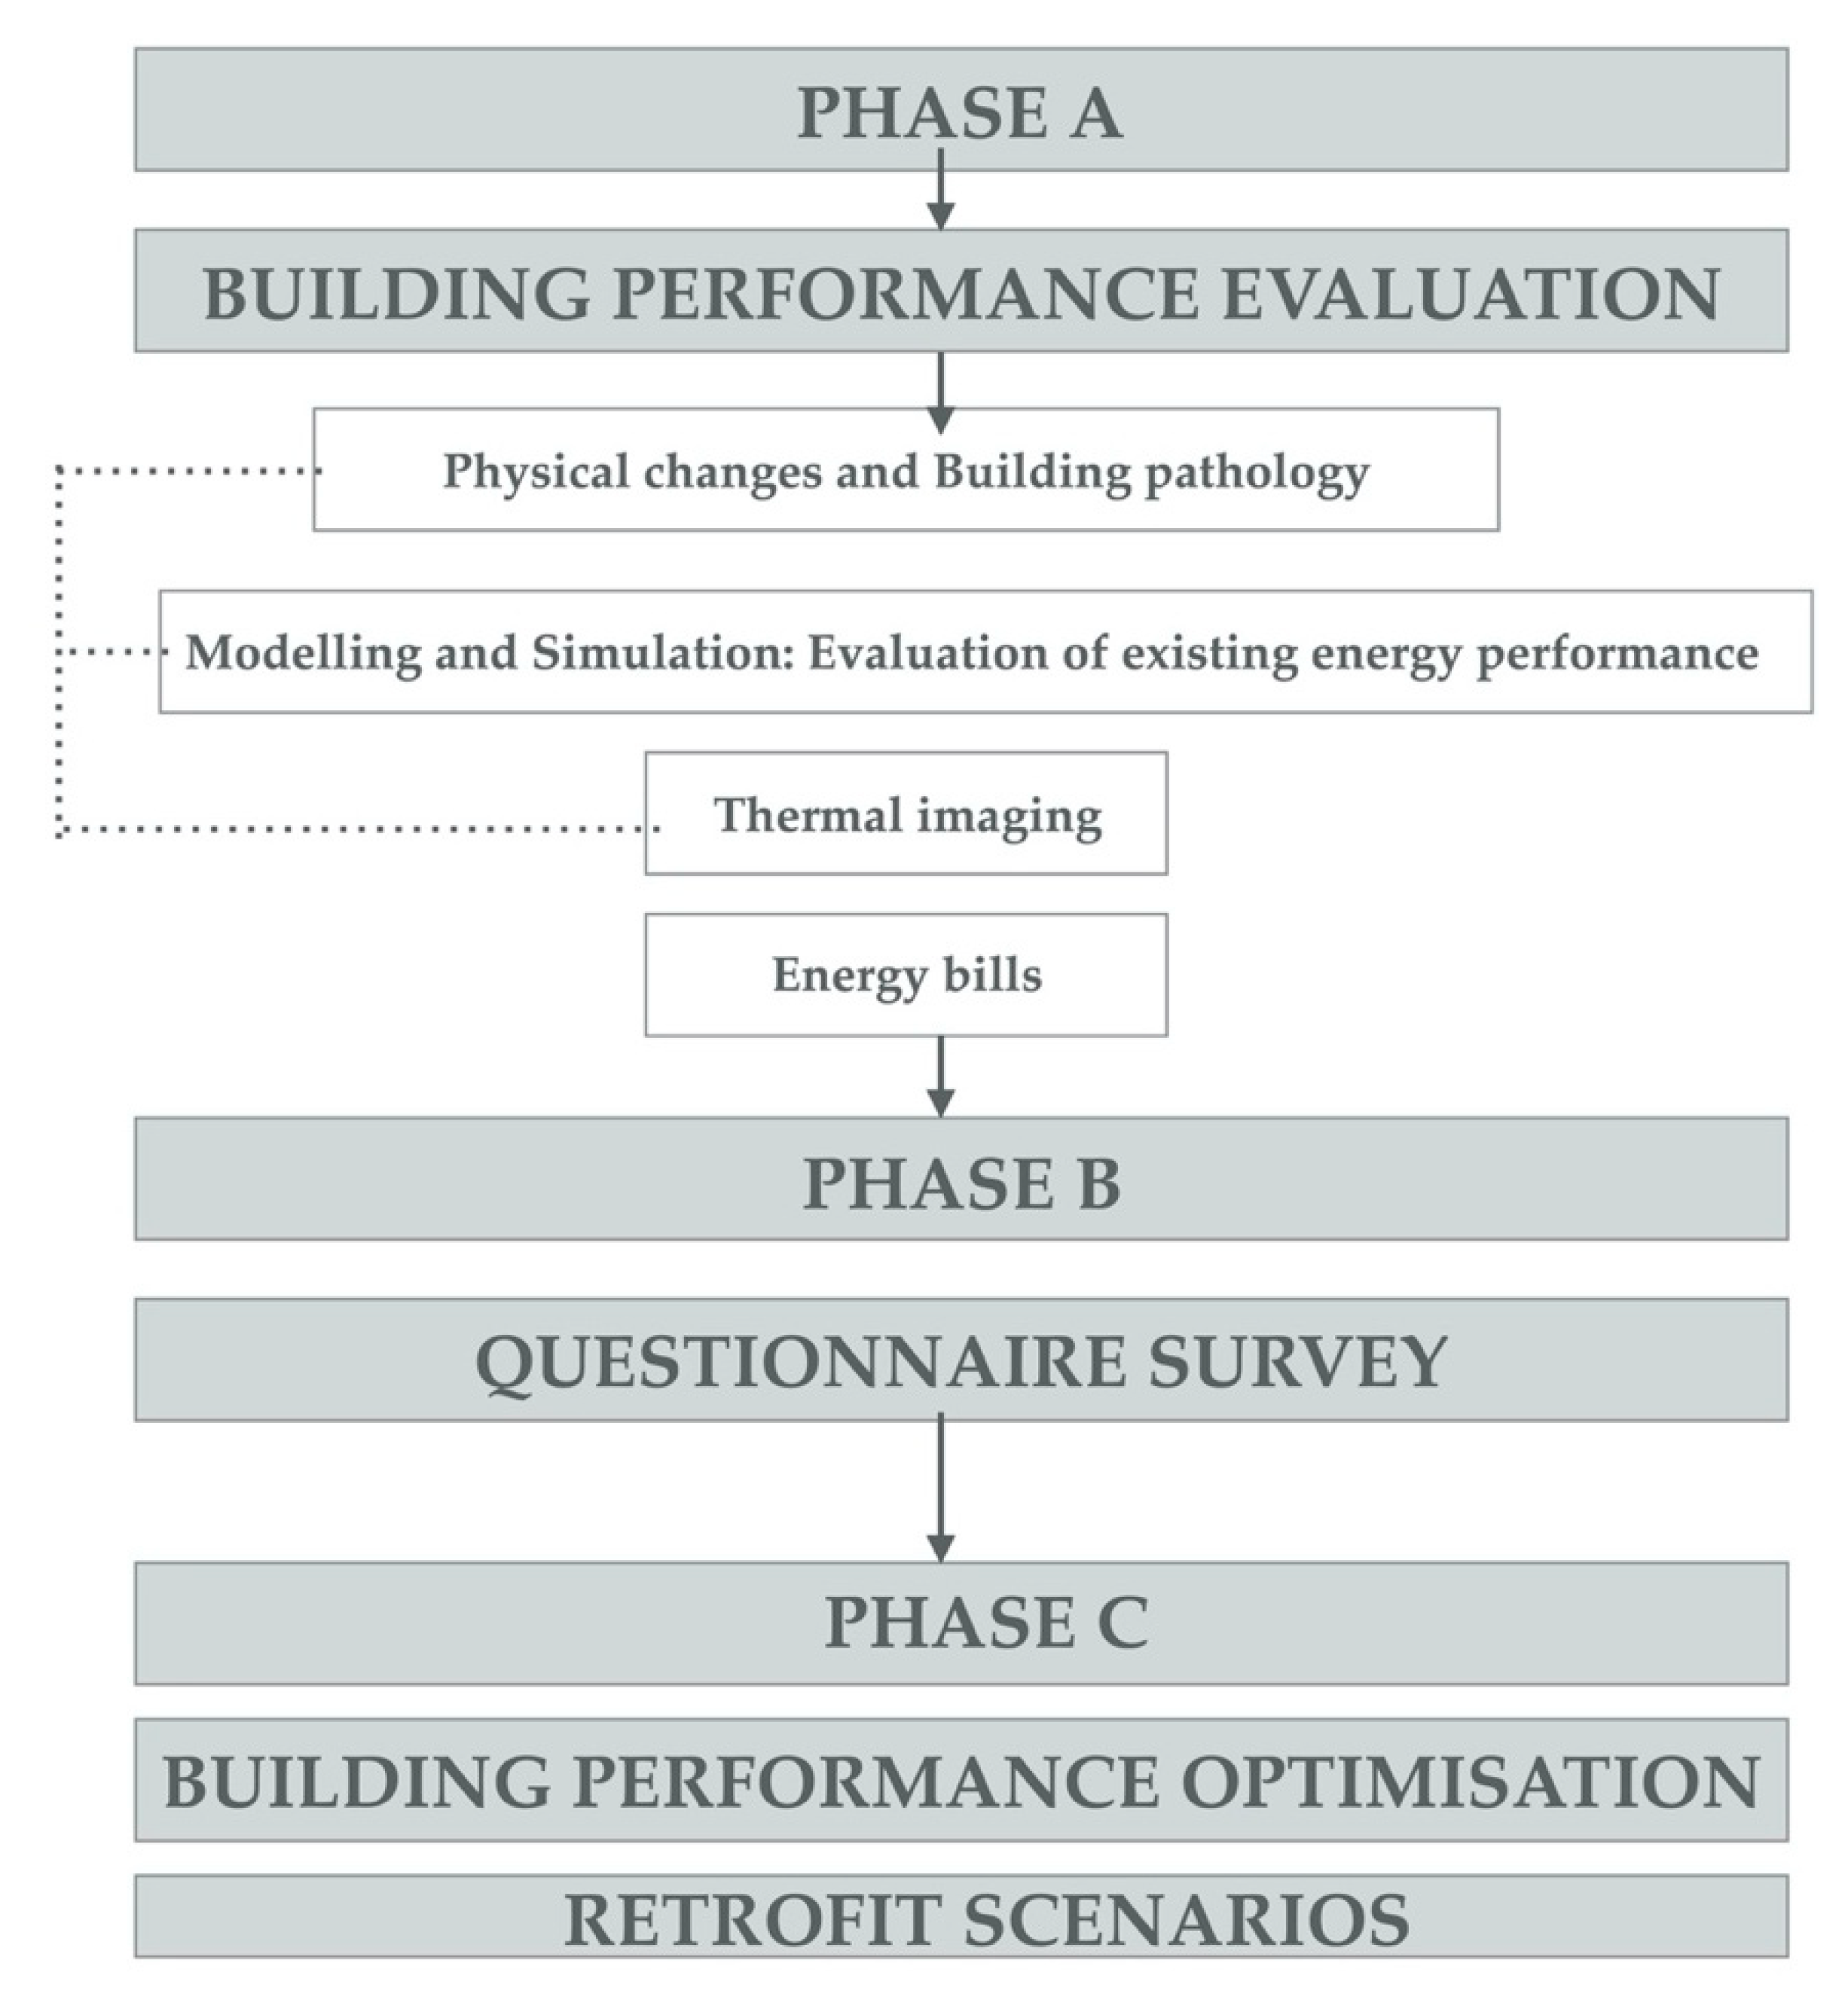
3.3. Conceptual Framework
3.4. Developing a Dynamic Method of Design for Energy Policy
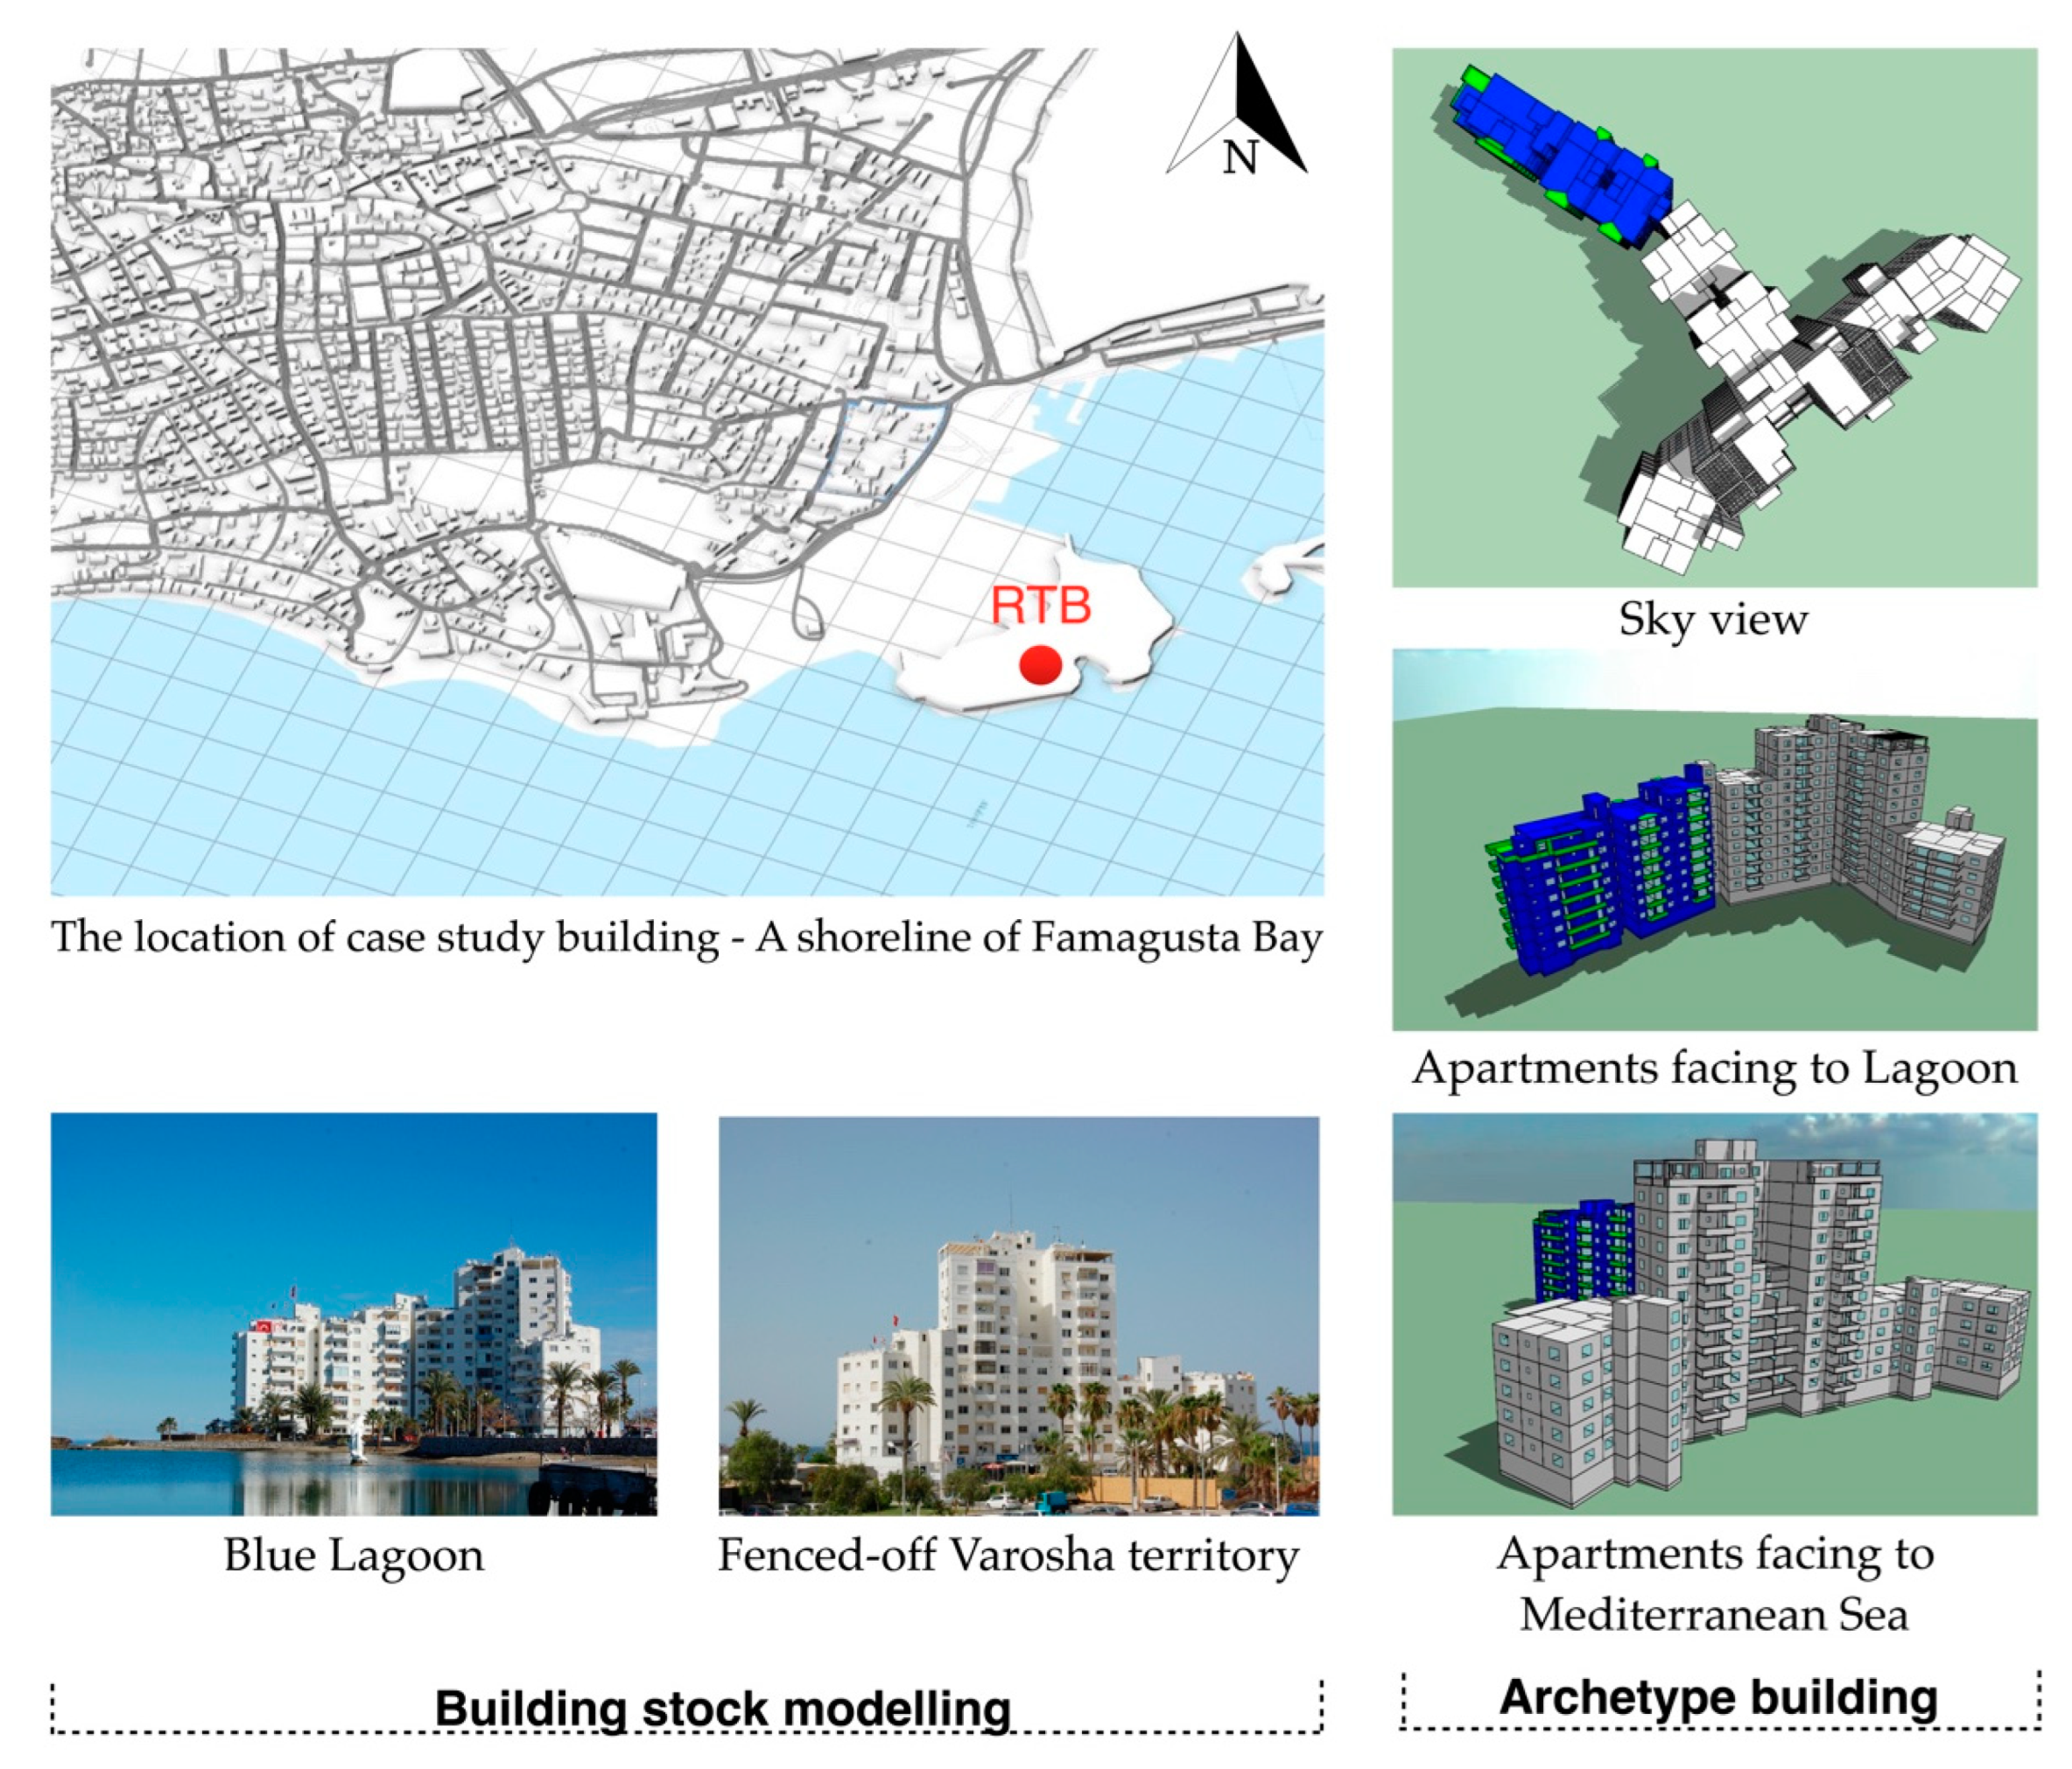
3.4.1. Prototype Residential Tower Block Development as Base-Case Scenario
3.4.2. Building Modelling Simulation
3.4.3. Thermal Properties Assigned to a Building Energy Model
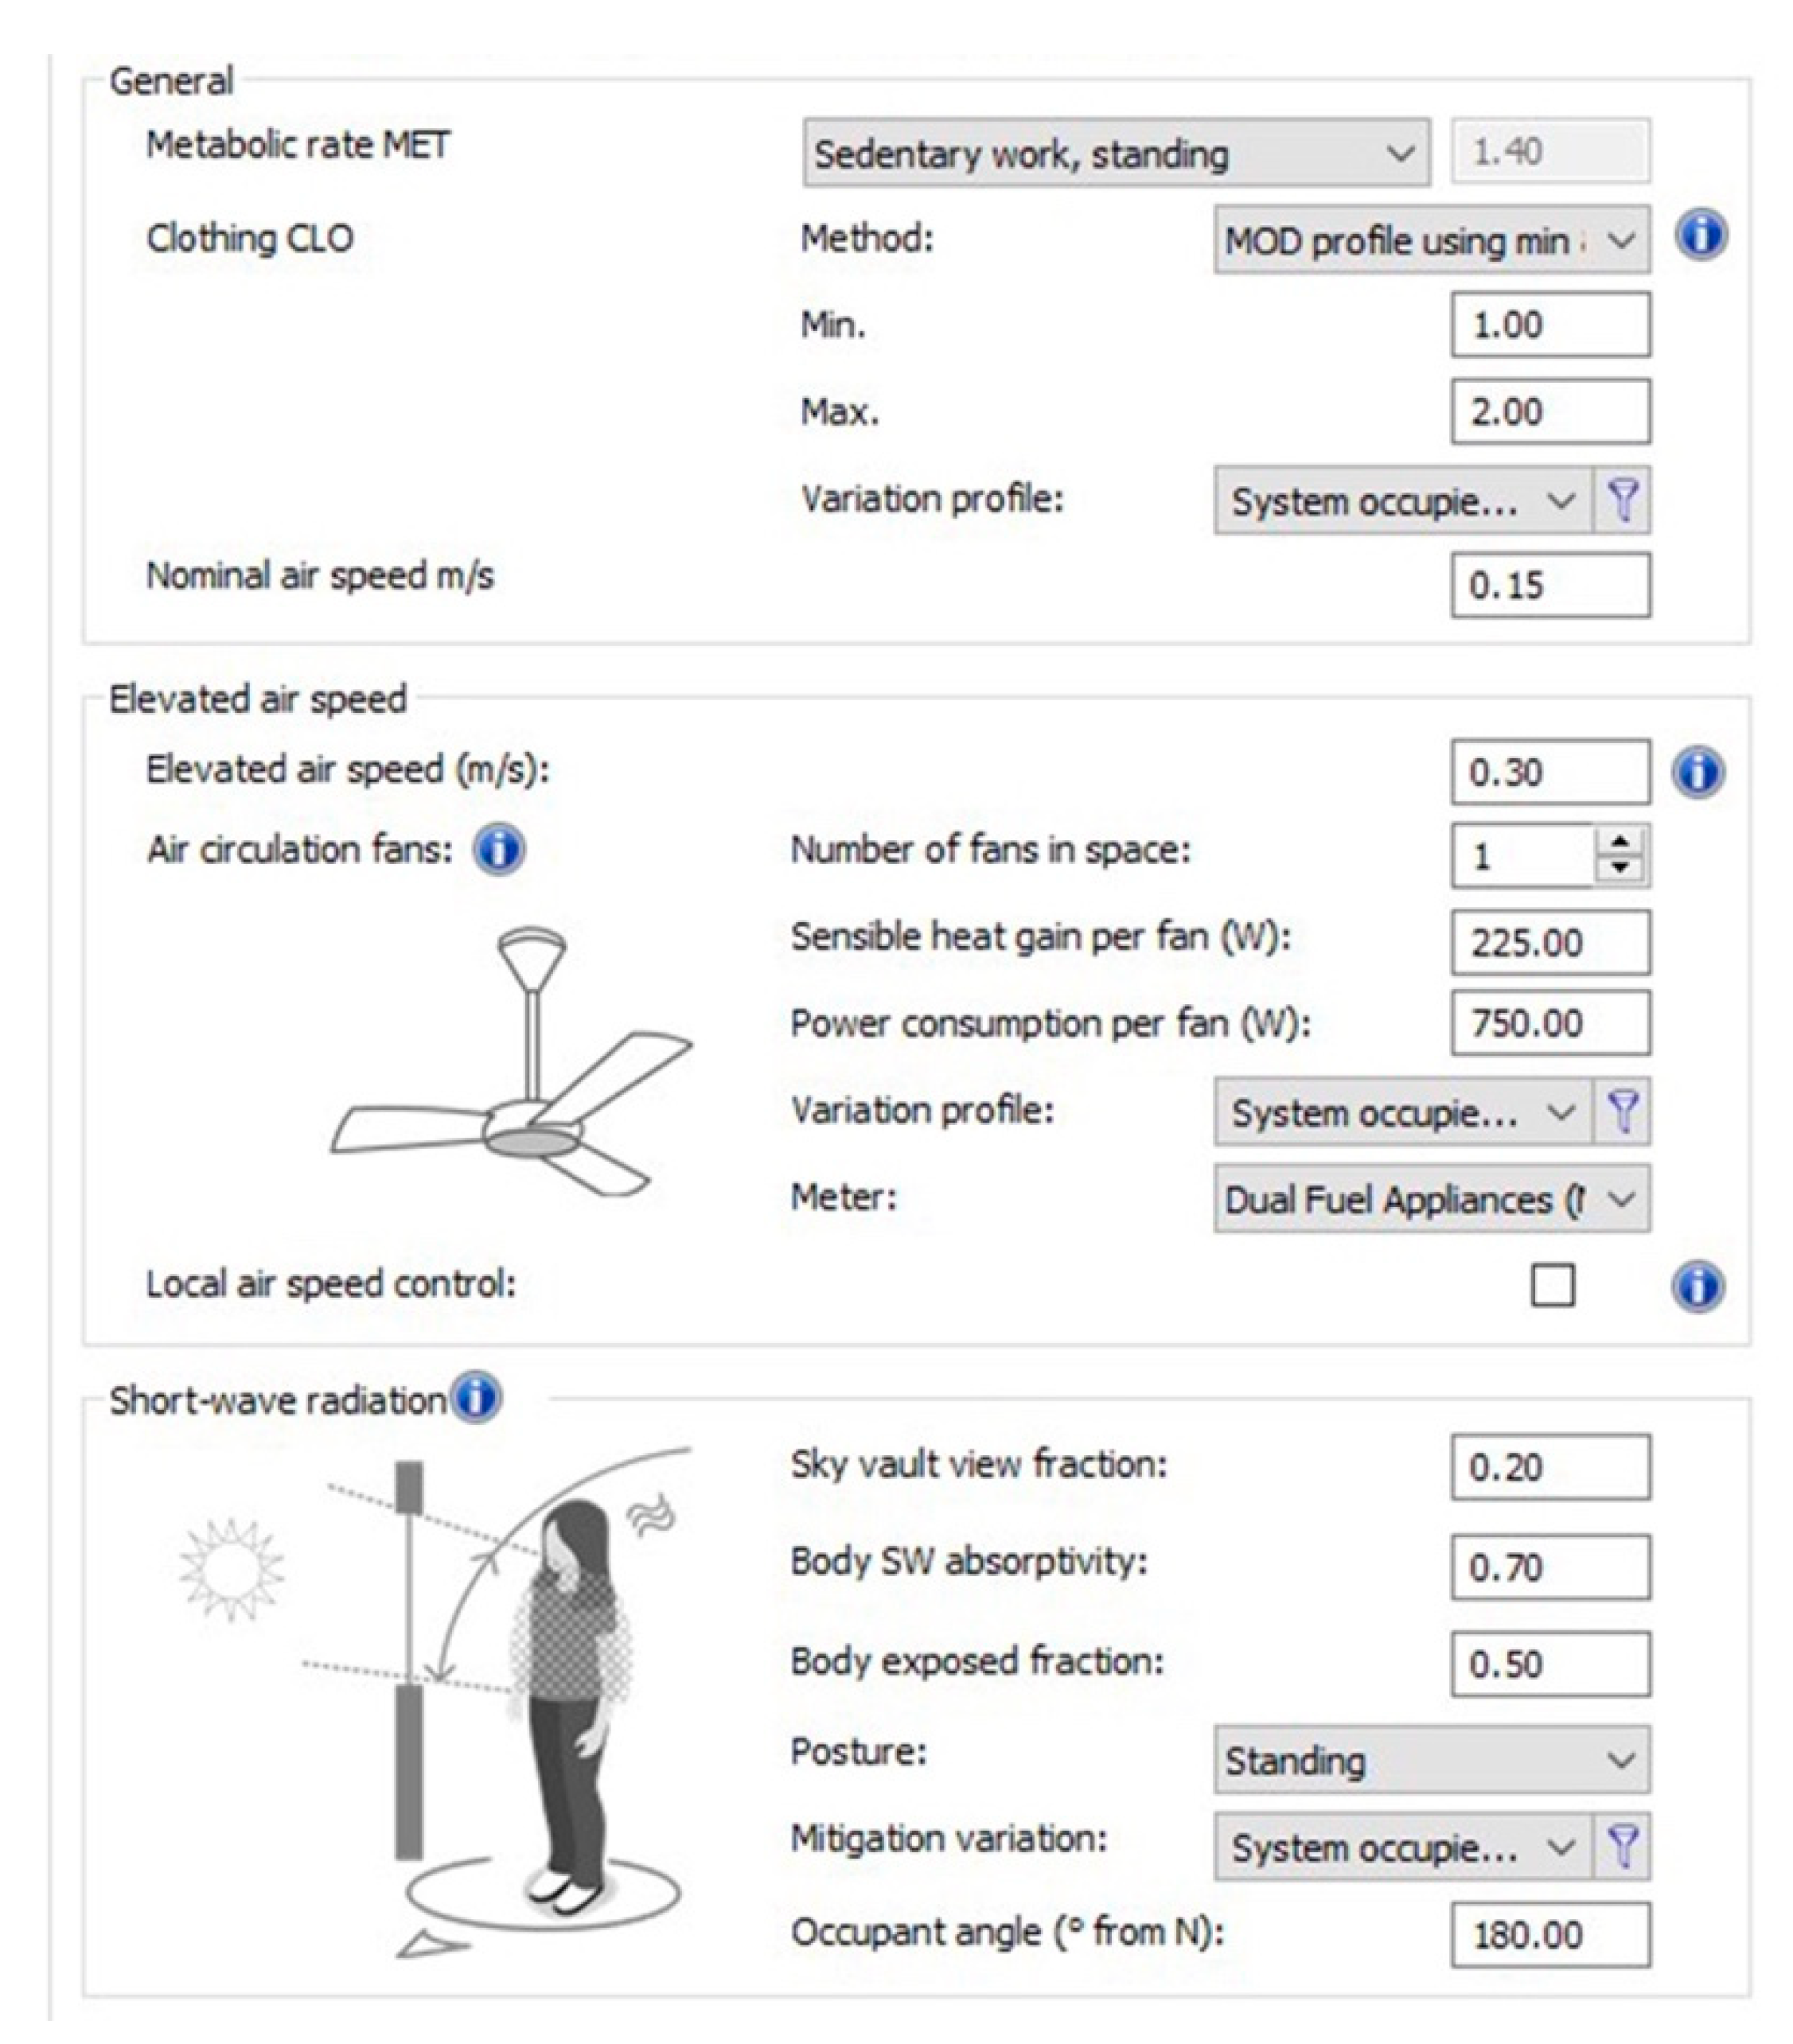
3.4.4. Space Conditioning Data Assigned to the Building Energy Model
3.5. Thermal Imaging Camera
3.6. Questionnaire
3.7. On-Site Environmental Monitoring
3.8. Building Optimisation
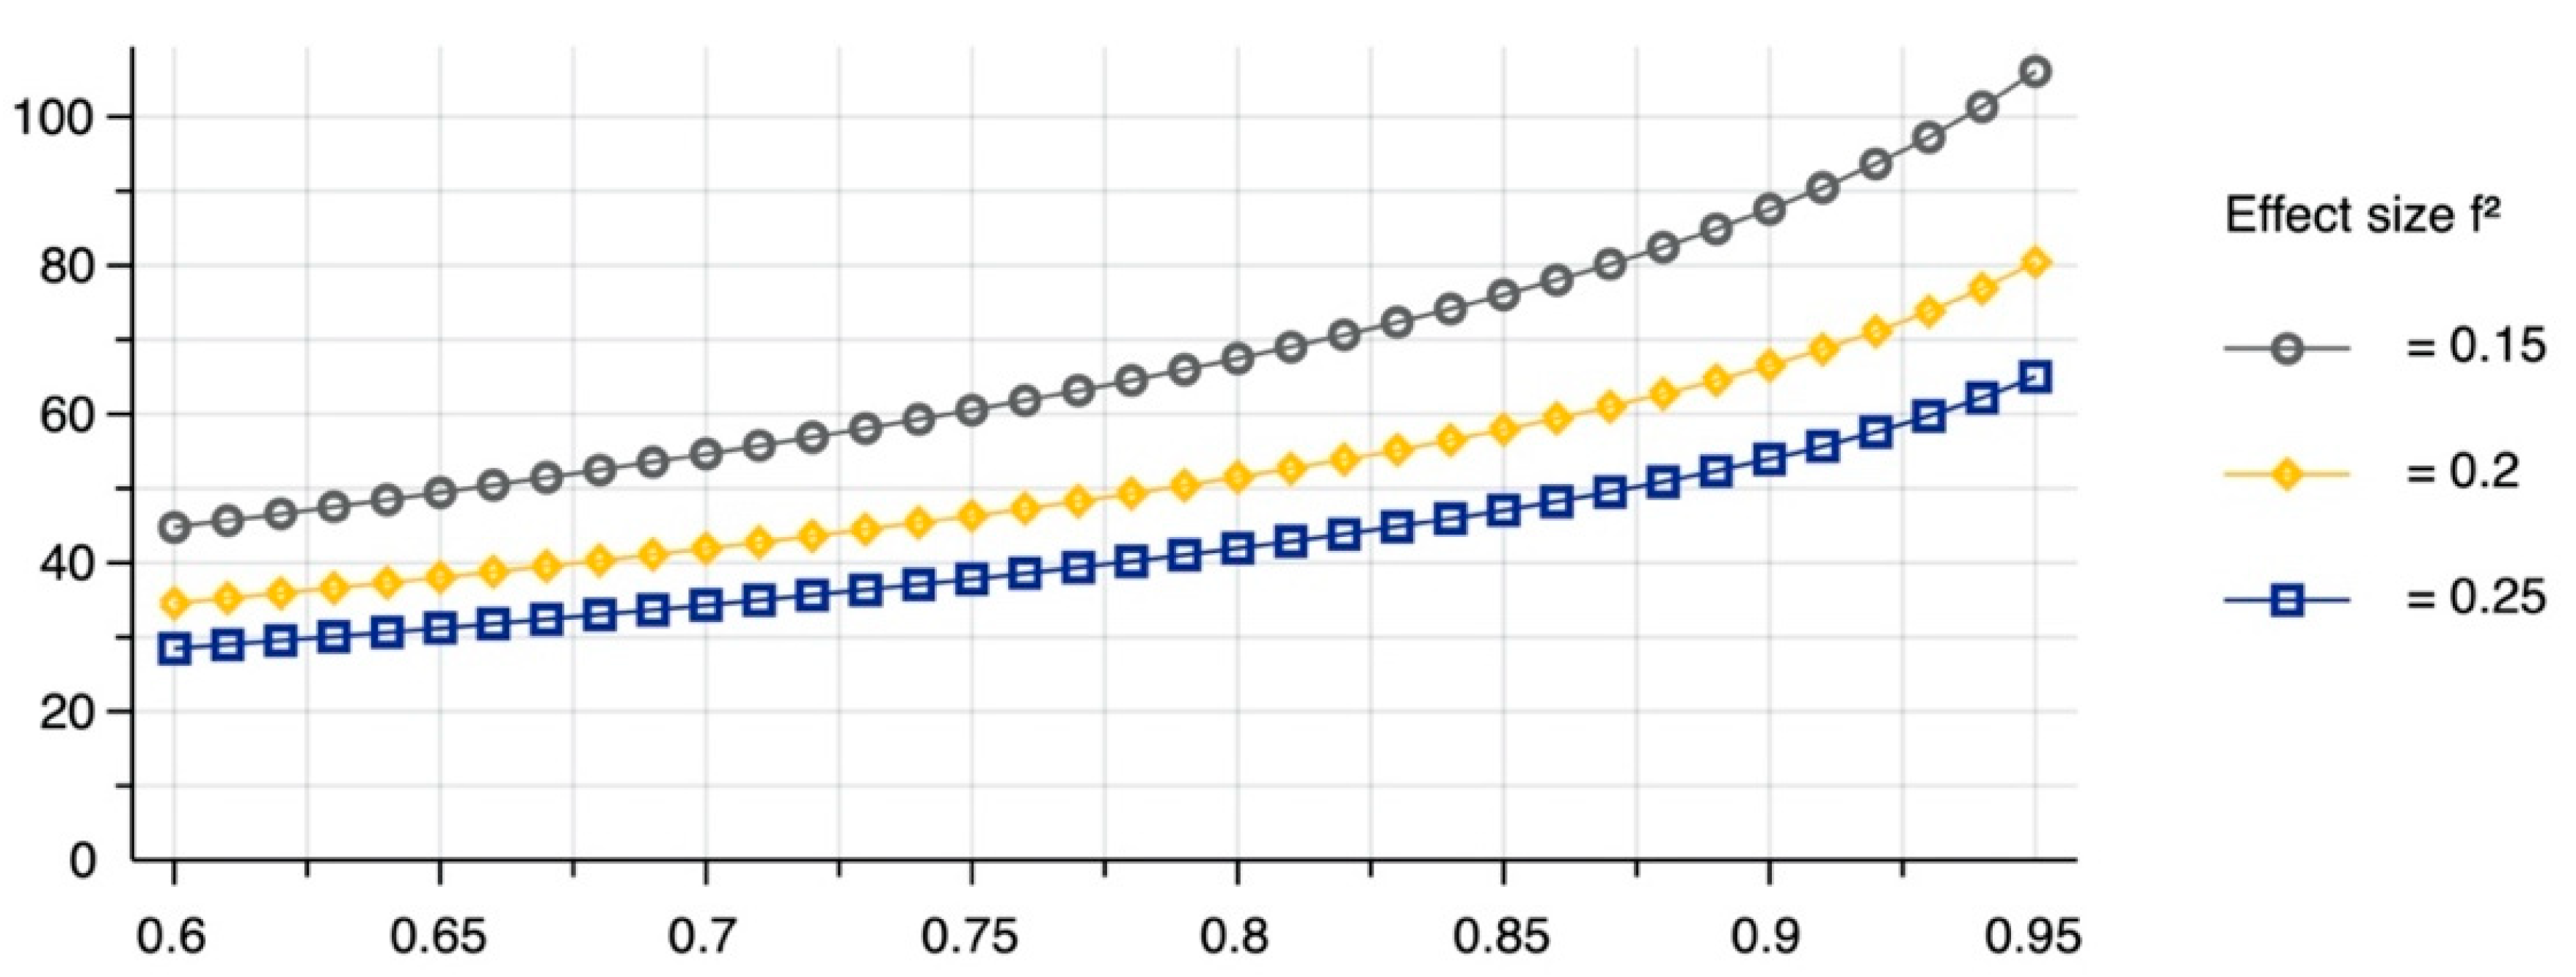
3.9. Statistical Analysis
- perfect if
- very strong if
- strong if is between and
- of medium intensity if is between and
- weak if is between and
- null if
4. Results and Discussion
4.1. Building Diagnostics
- ○
- Building, urban, and location characteristics: orientation, geometry, exposure to sunlight, crossed ventilation, etc.
- ○
- Constructive characteristics of the thermal envelope (facade, windows, roofs, separation with staircases or other blocks and from the ground slab).
- ○
- Non-regulated design interventions made by the occupants on the facade such as replacement of window frames, enclosure of balcony areas, etc.
- ○
- Thermal installations: individual, collective, central cooling systems, and energy type.
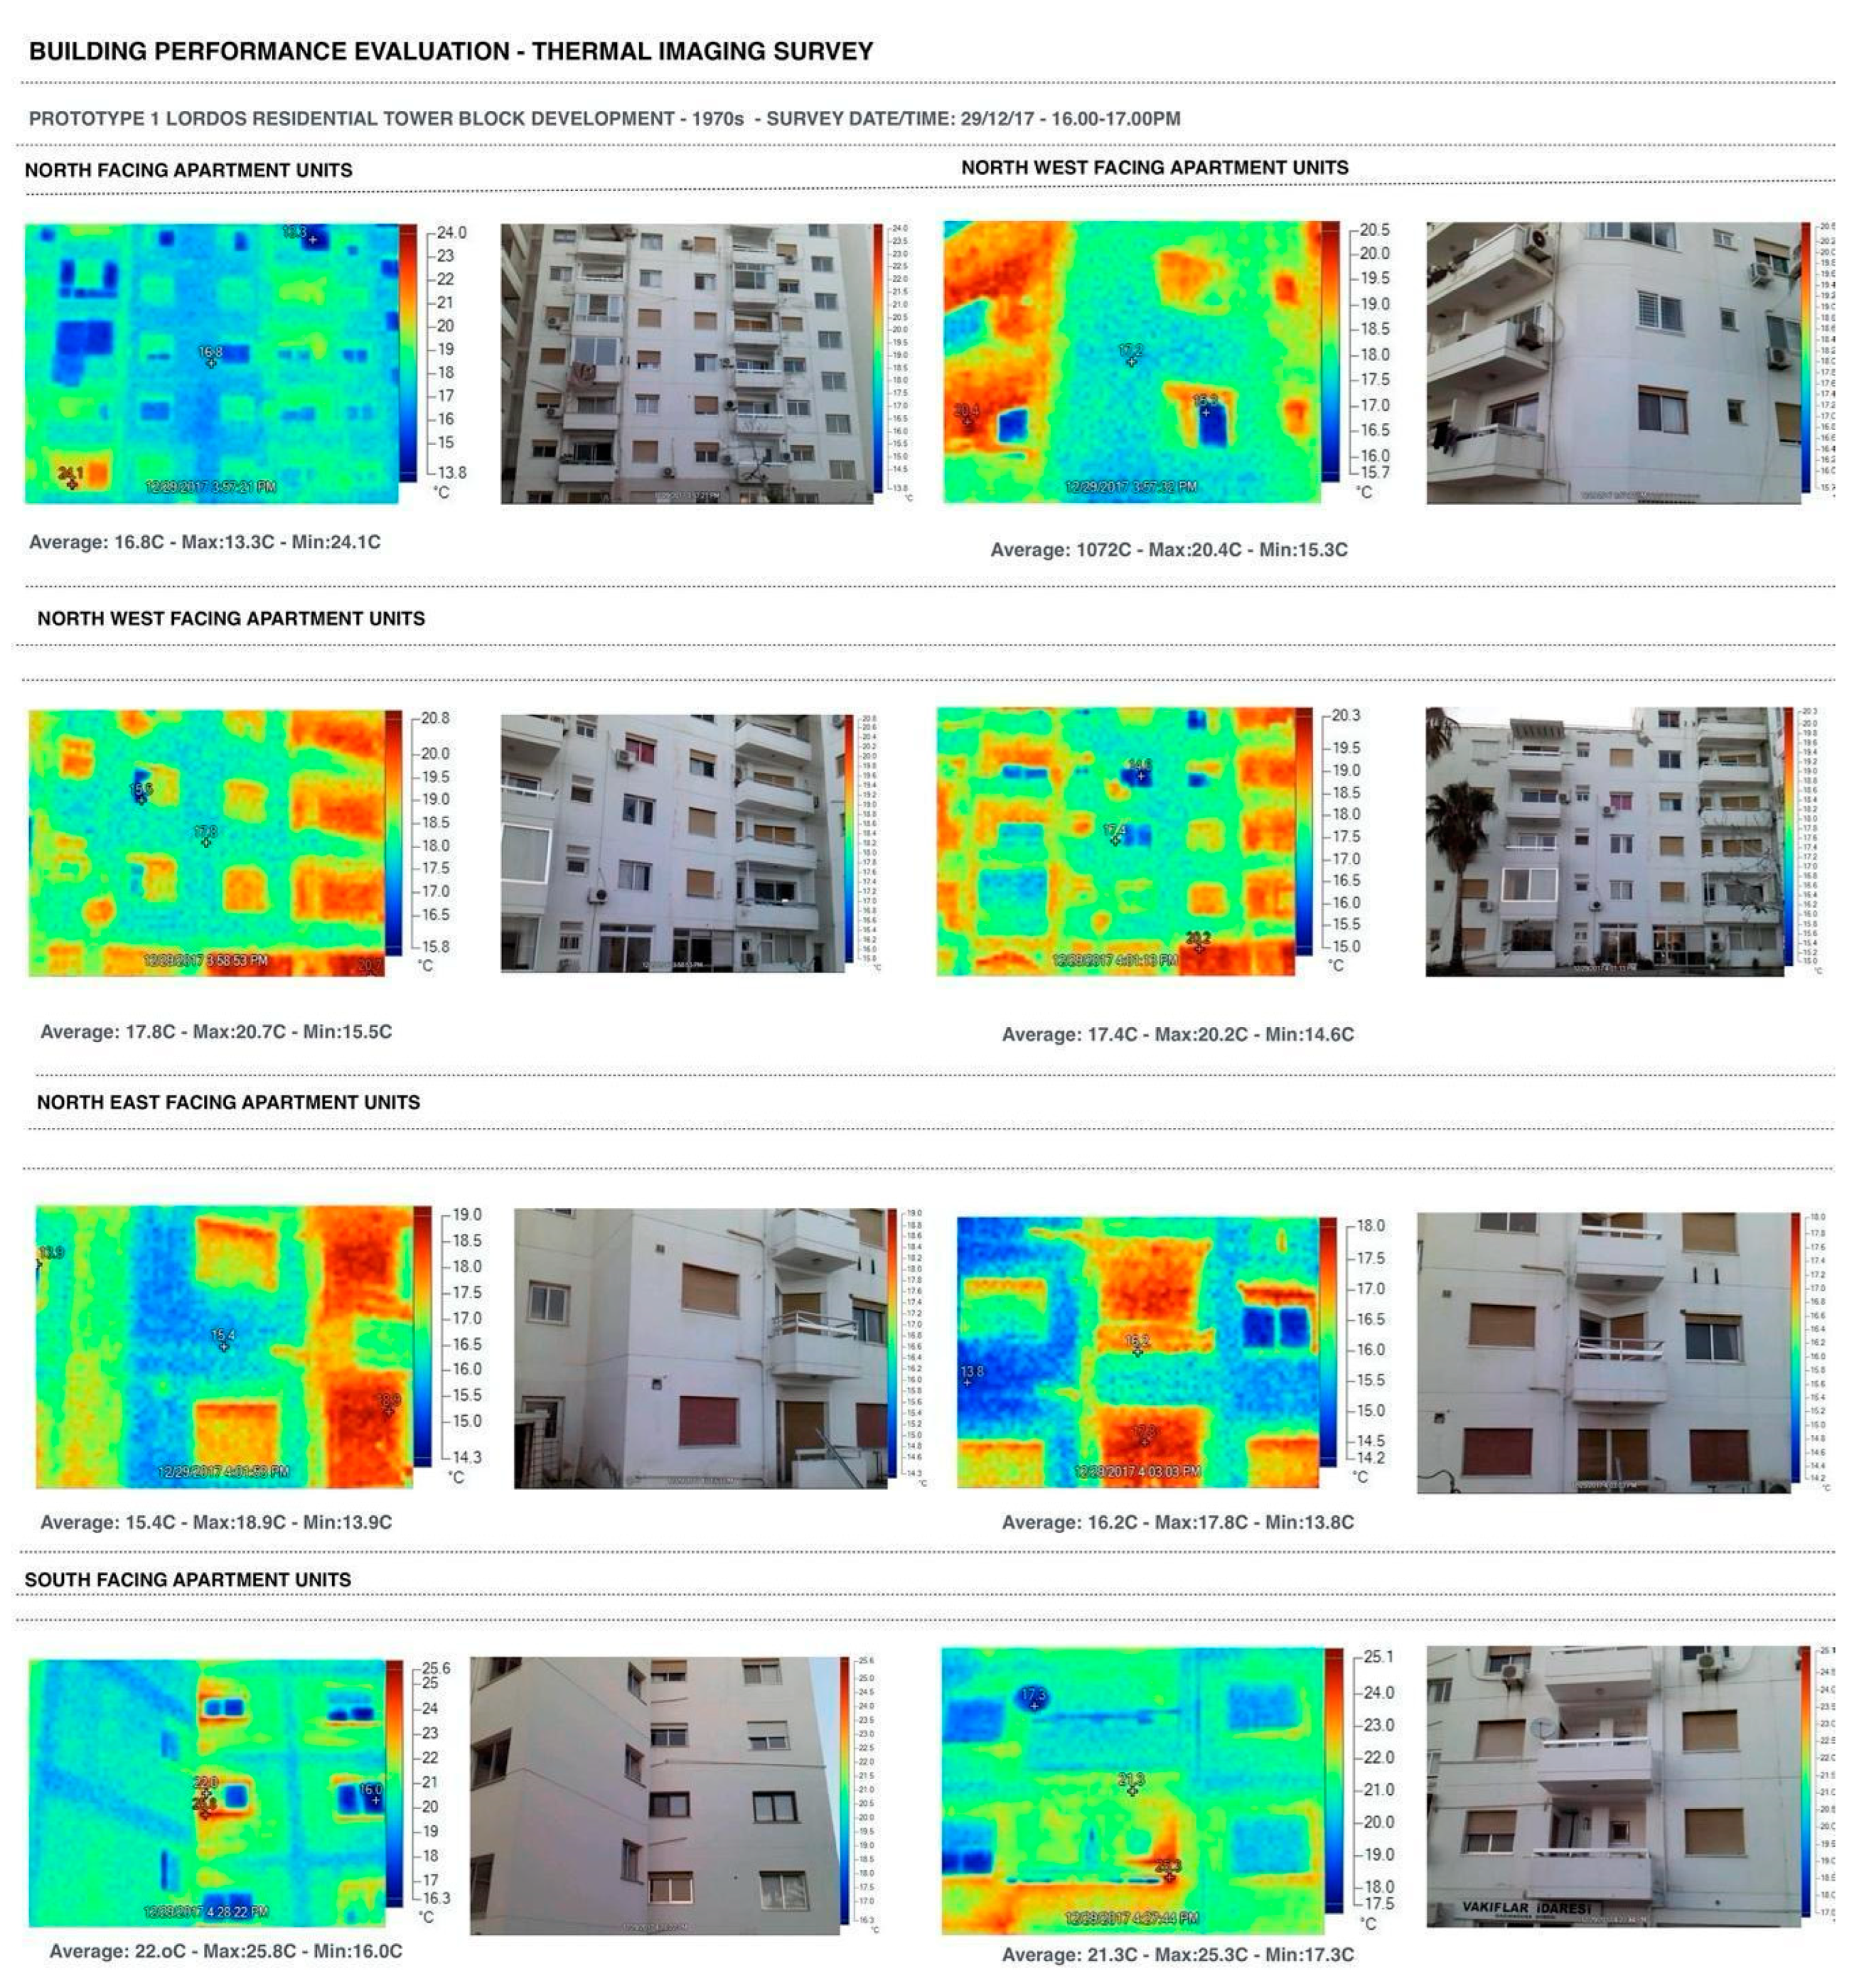
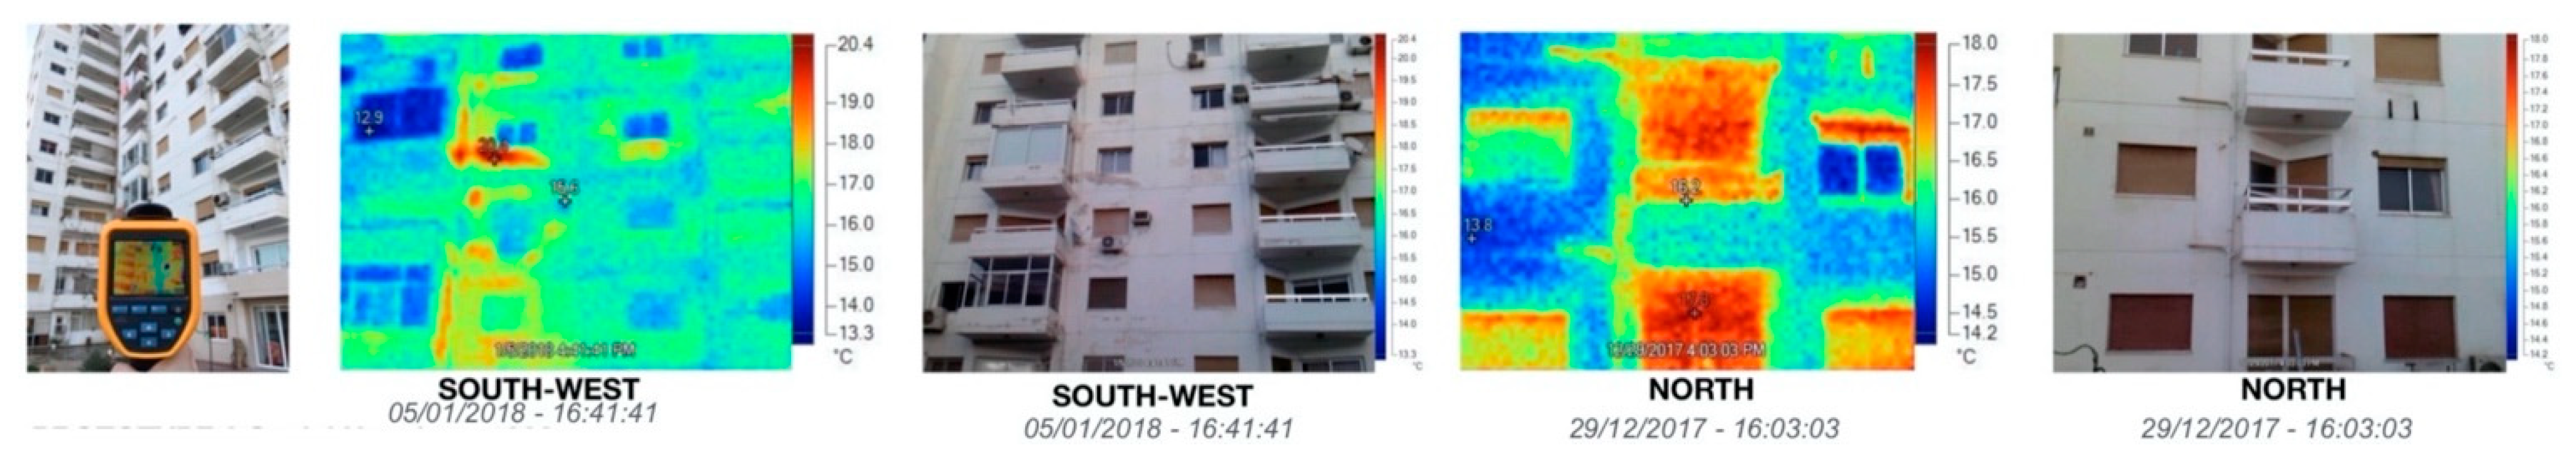
4.2. Thermal Imaging Survey
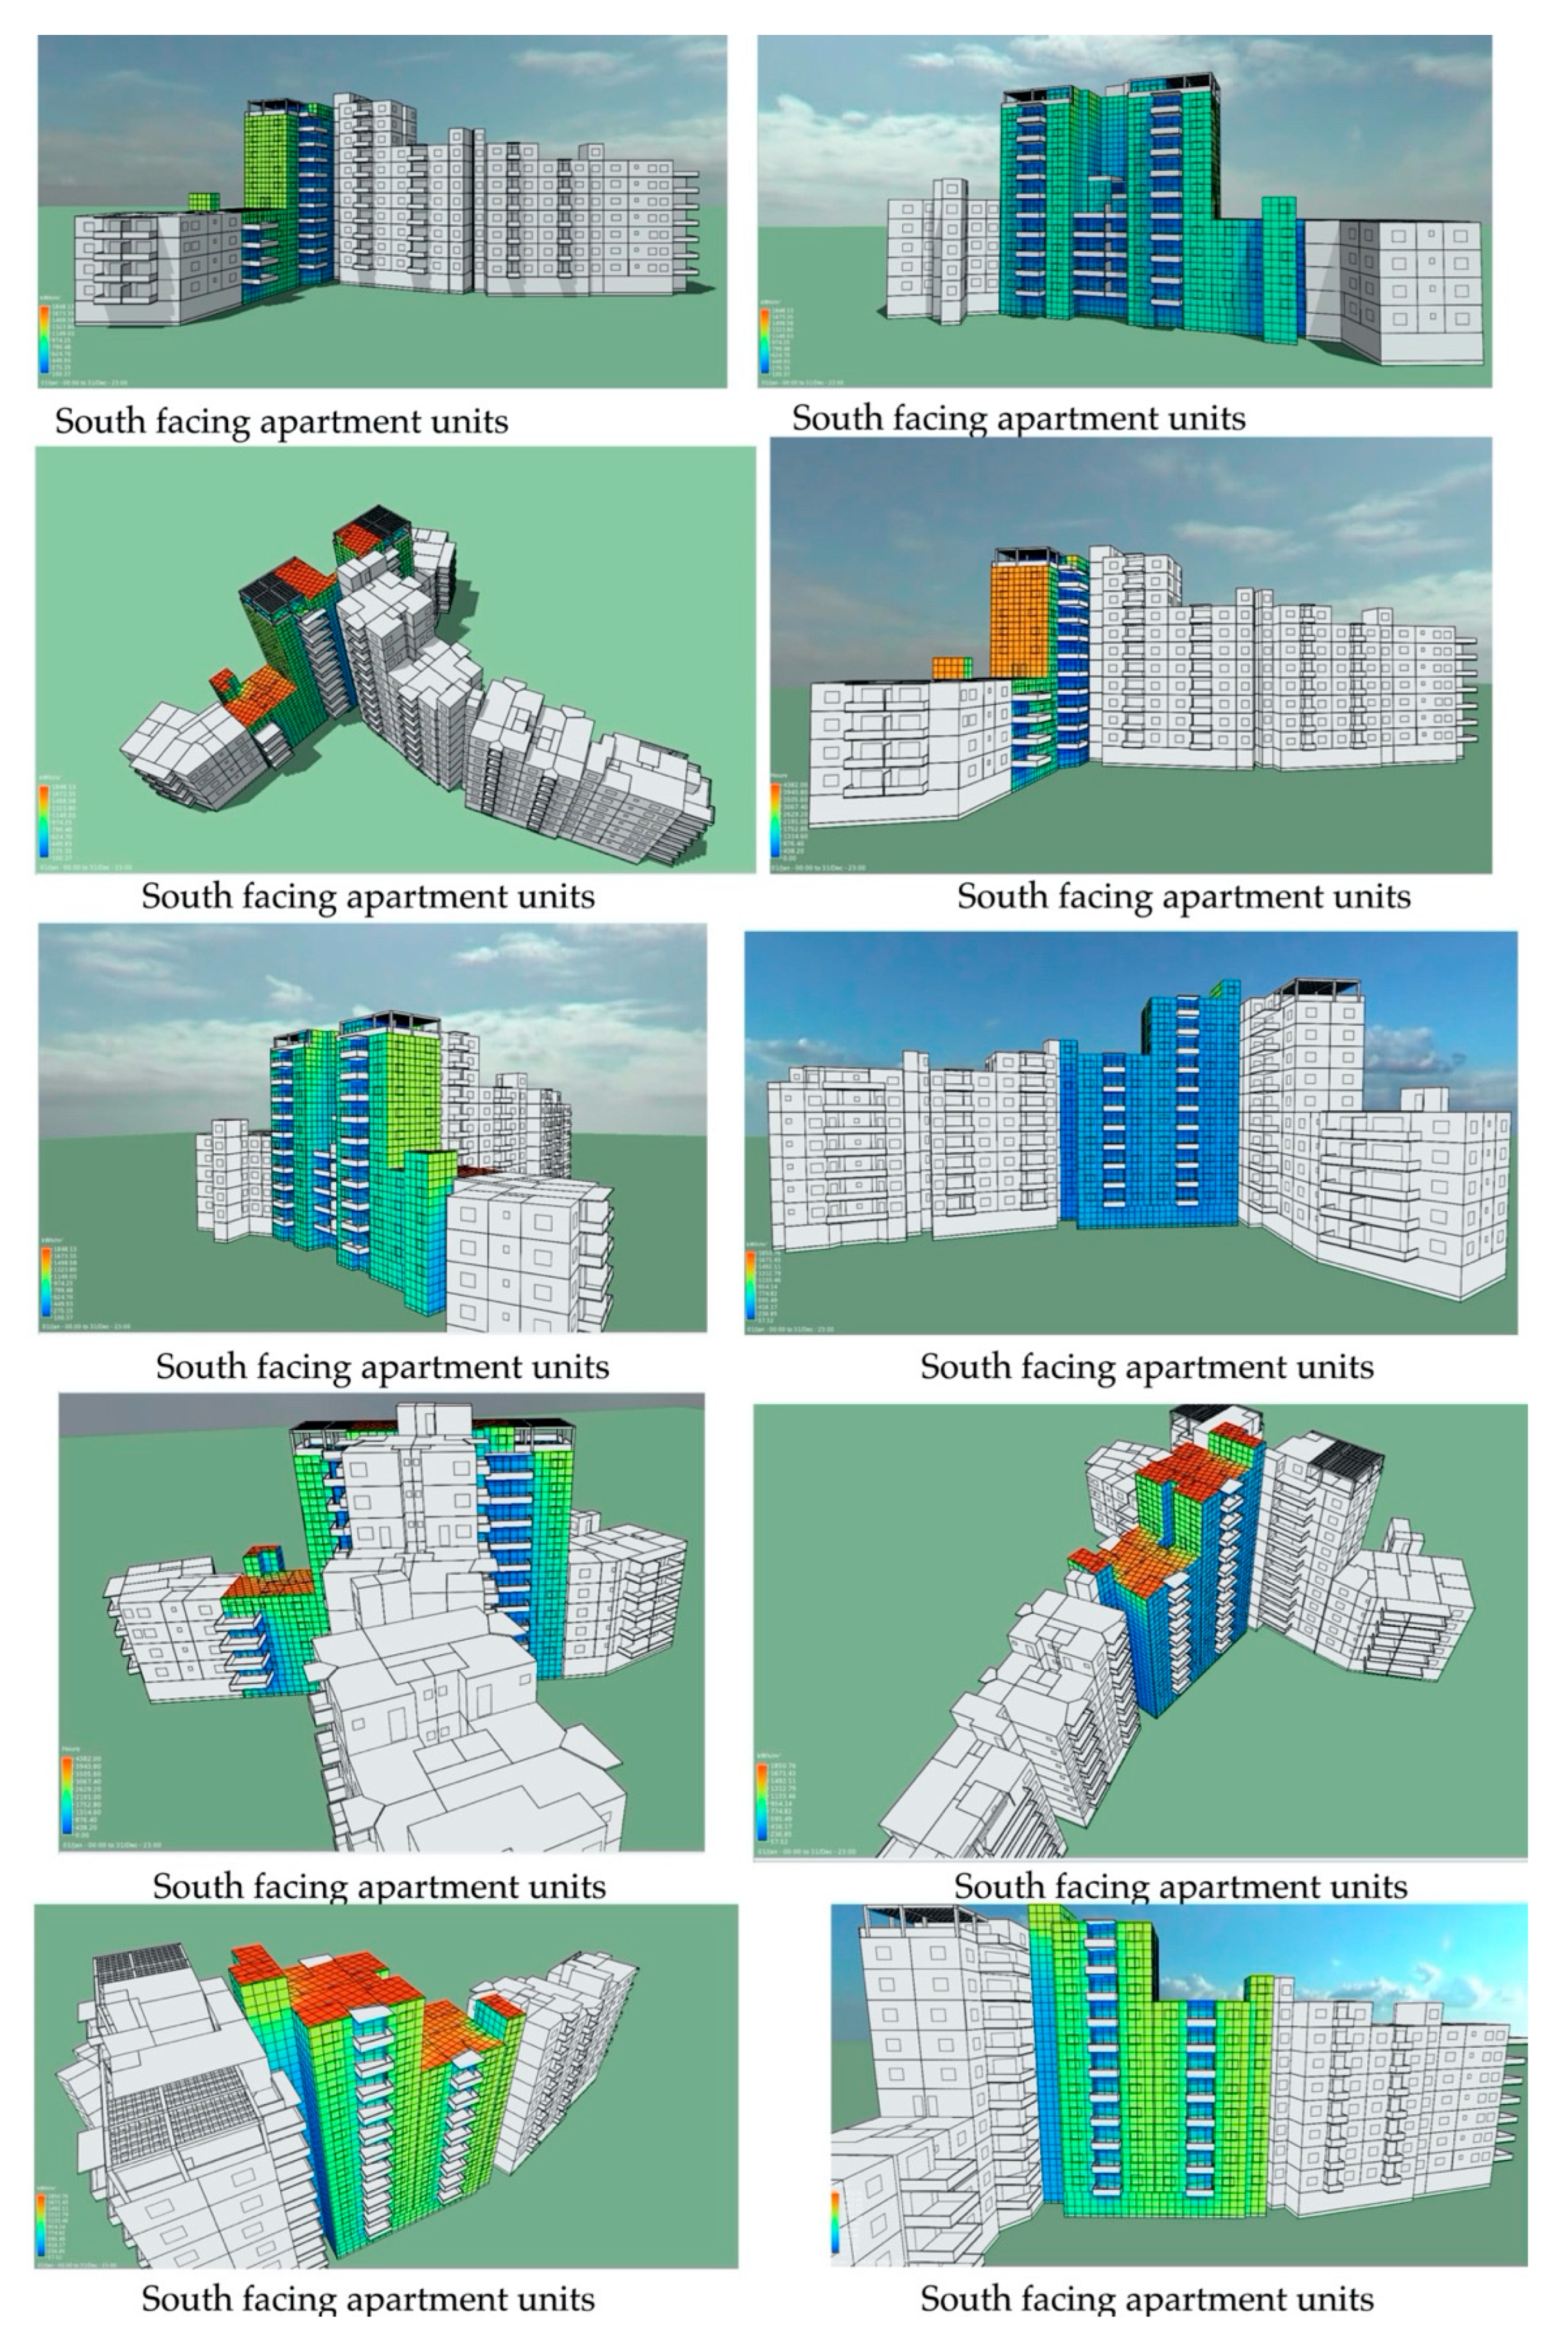
4.3. Solar Exposure Analysis
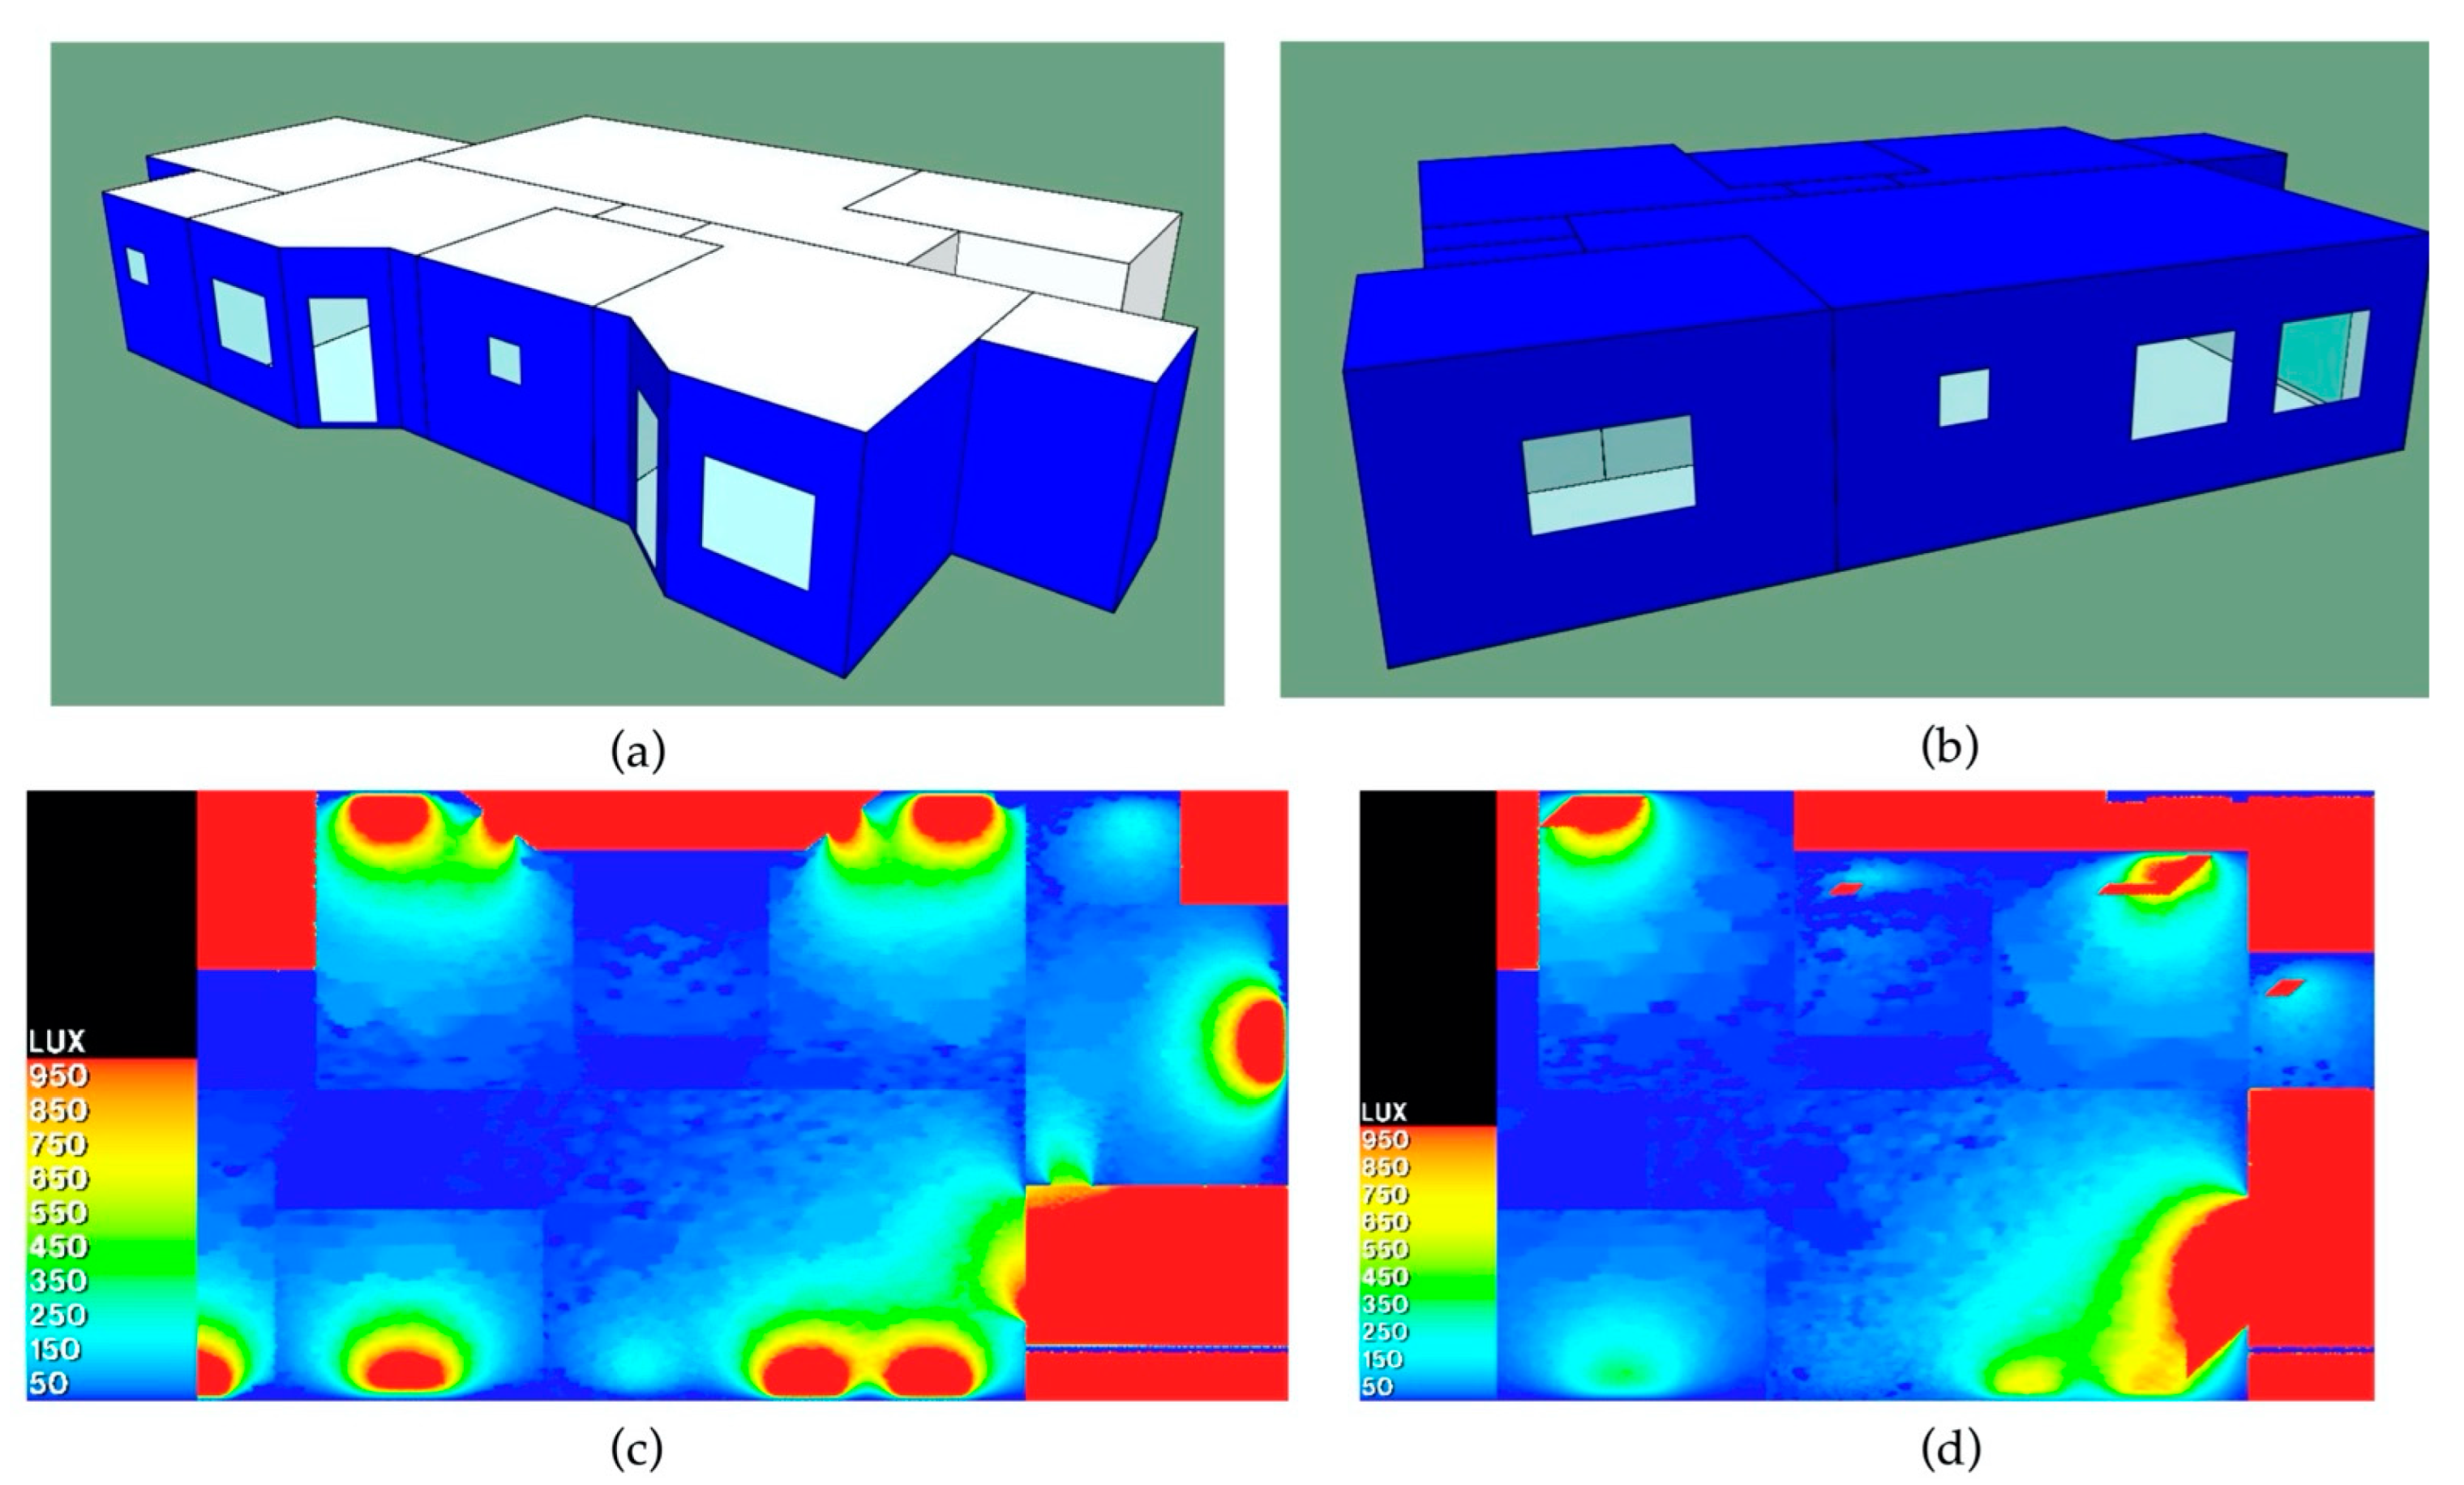
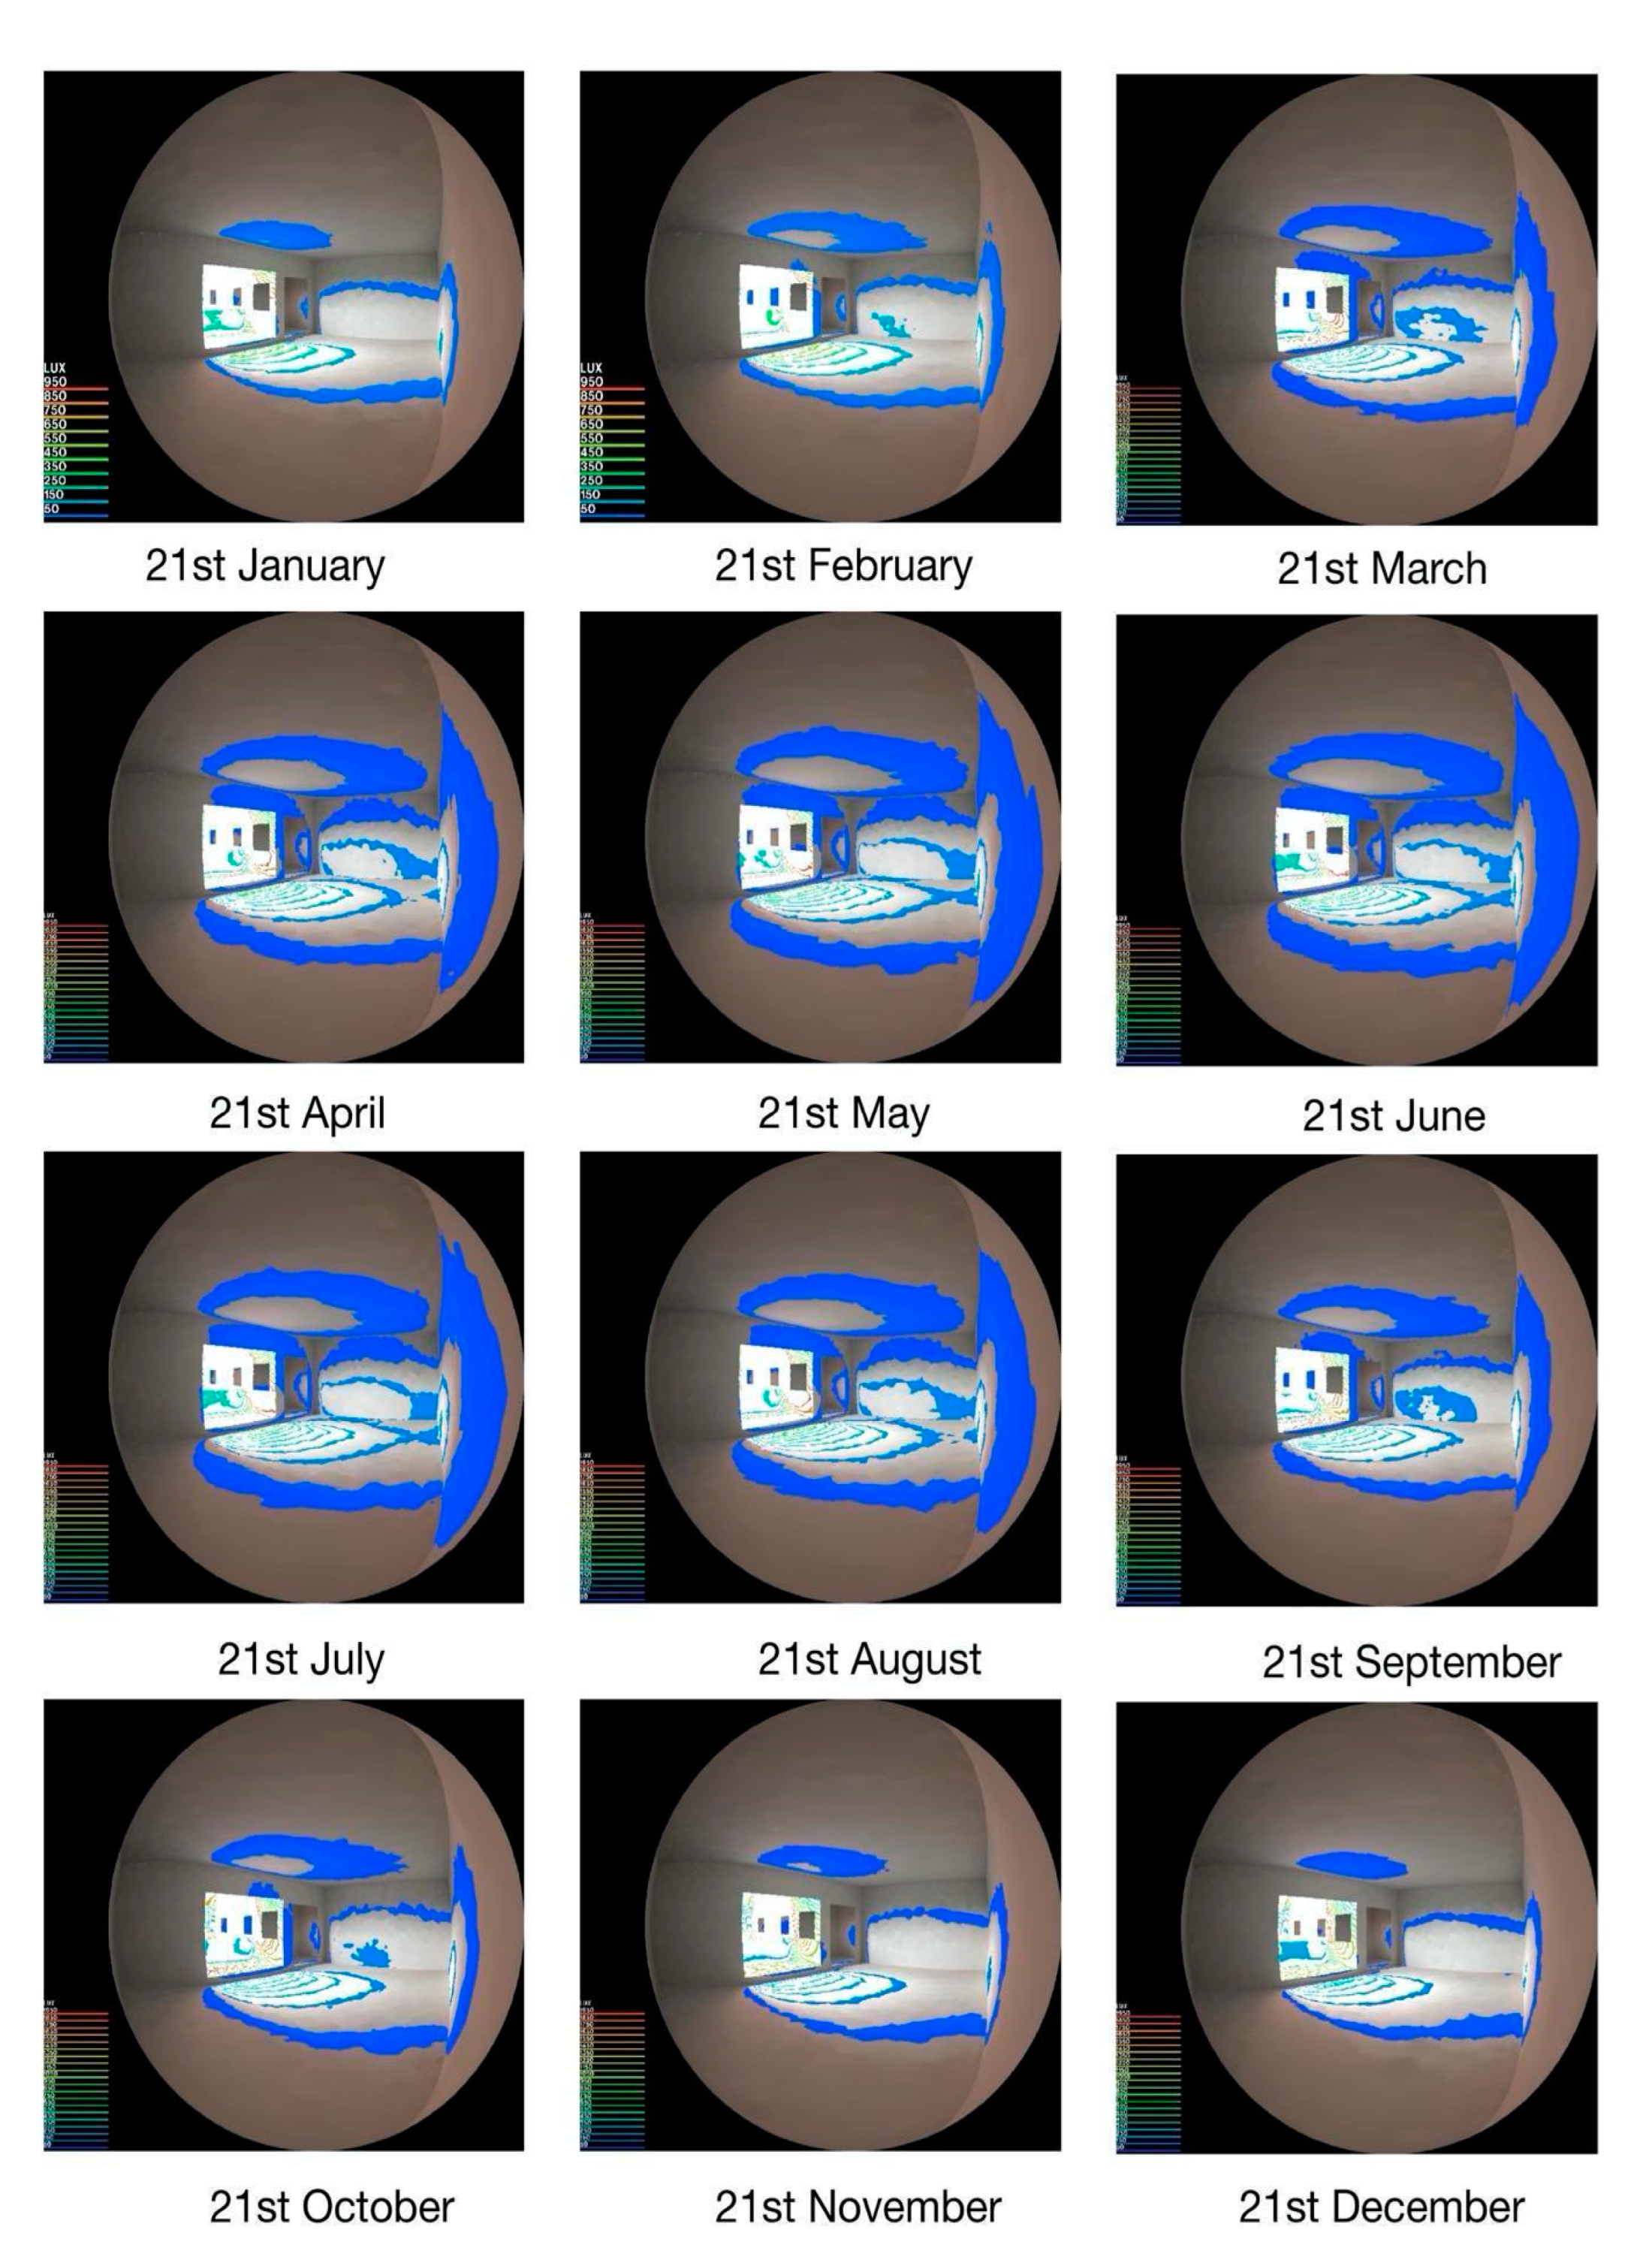
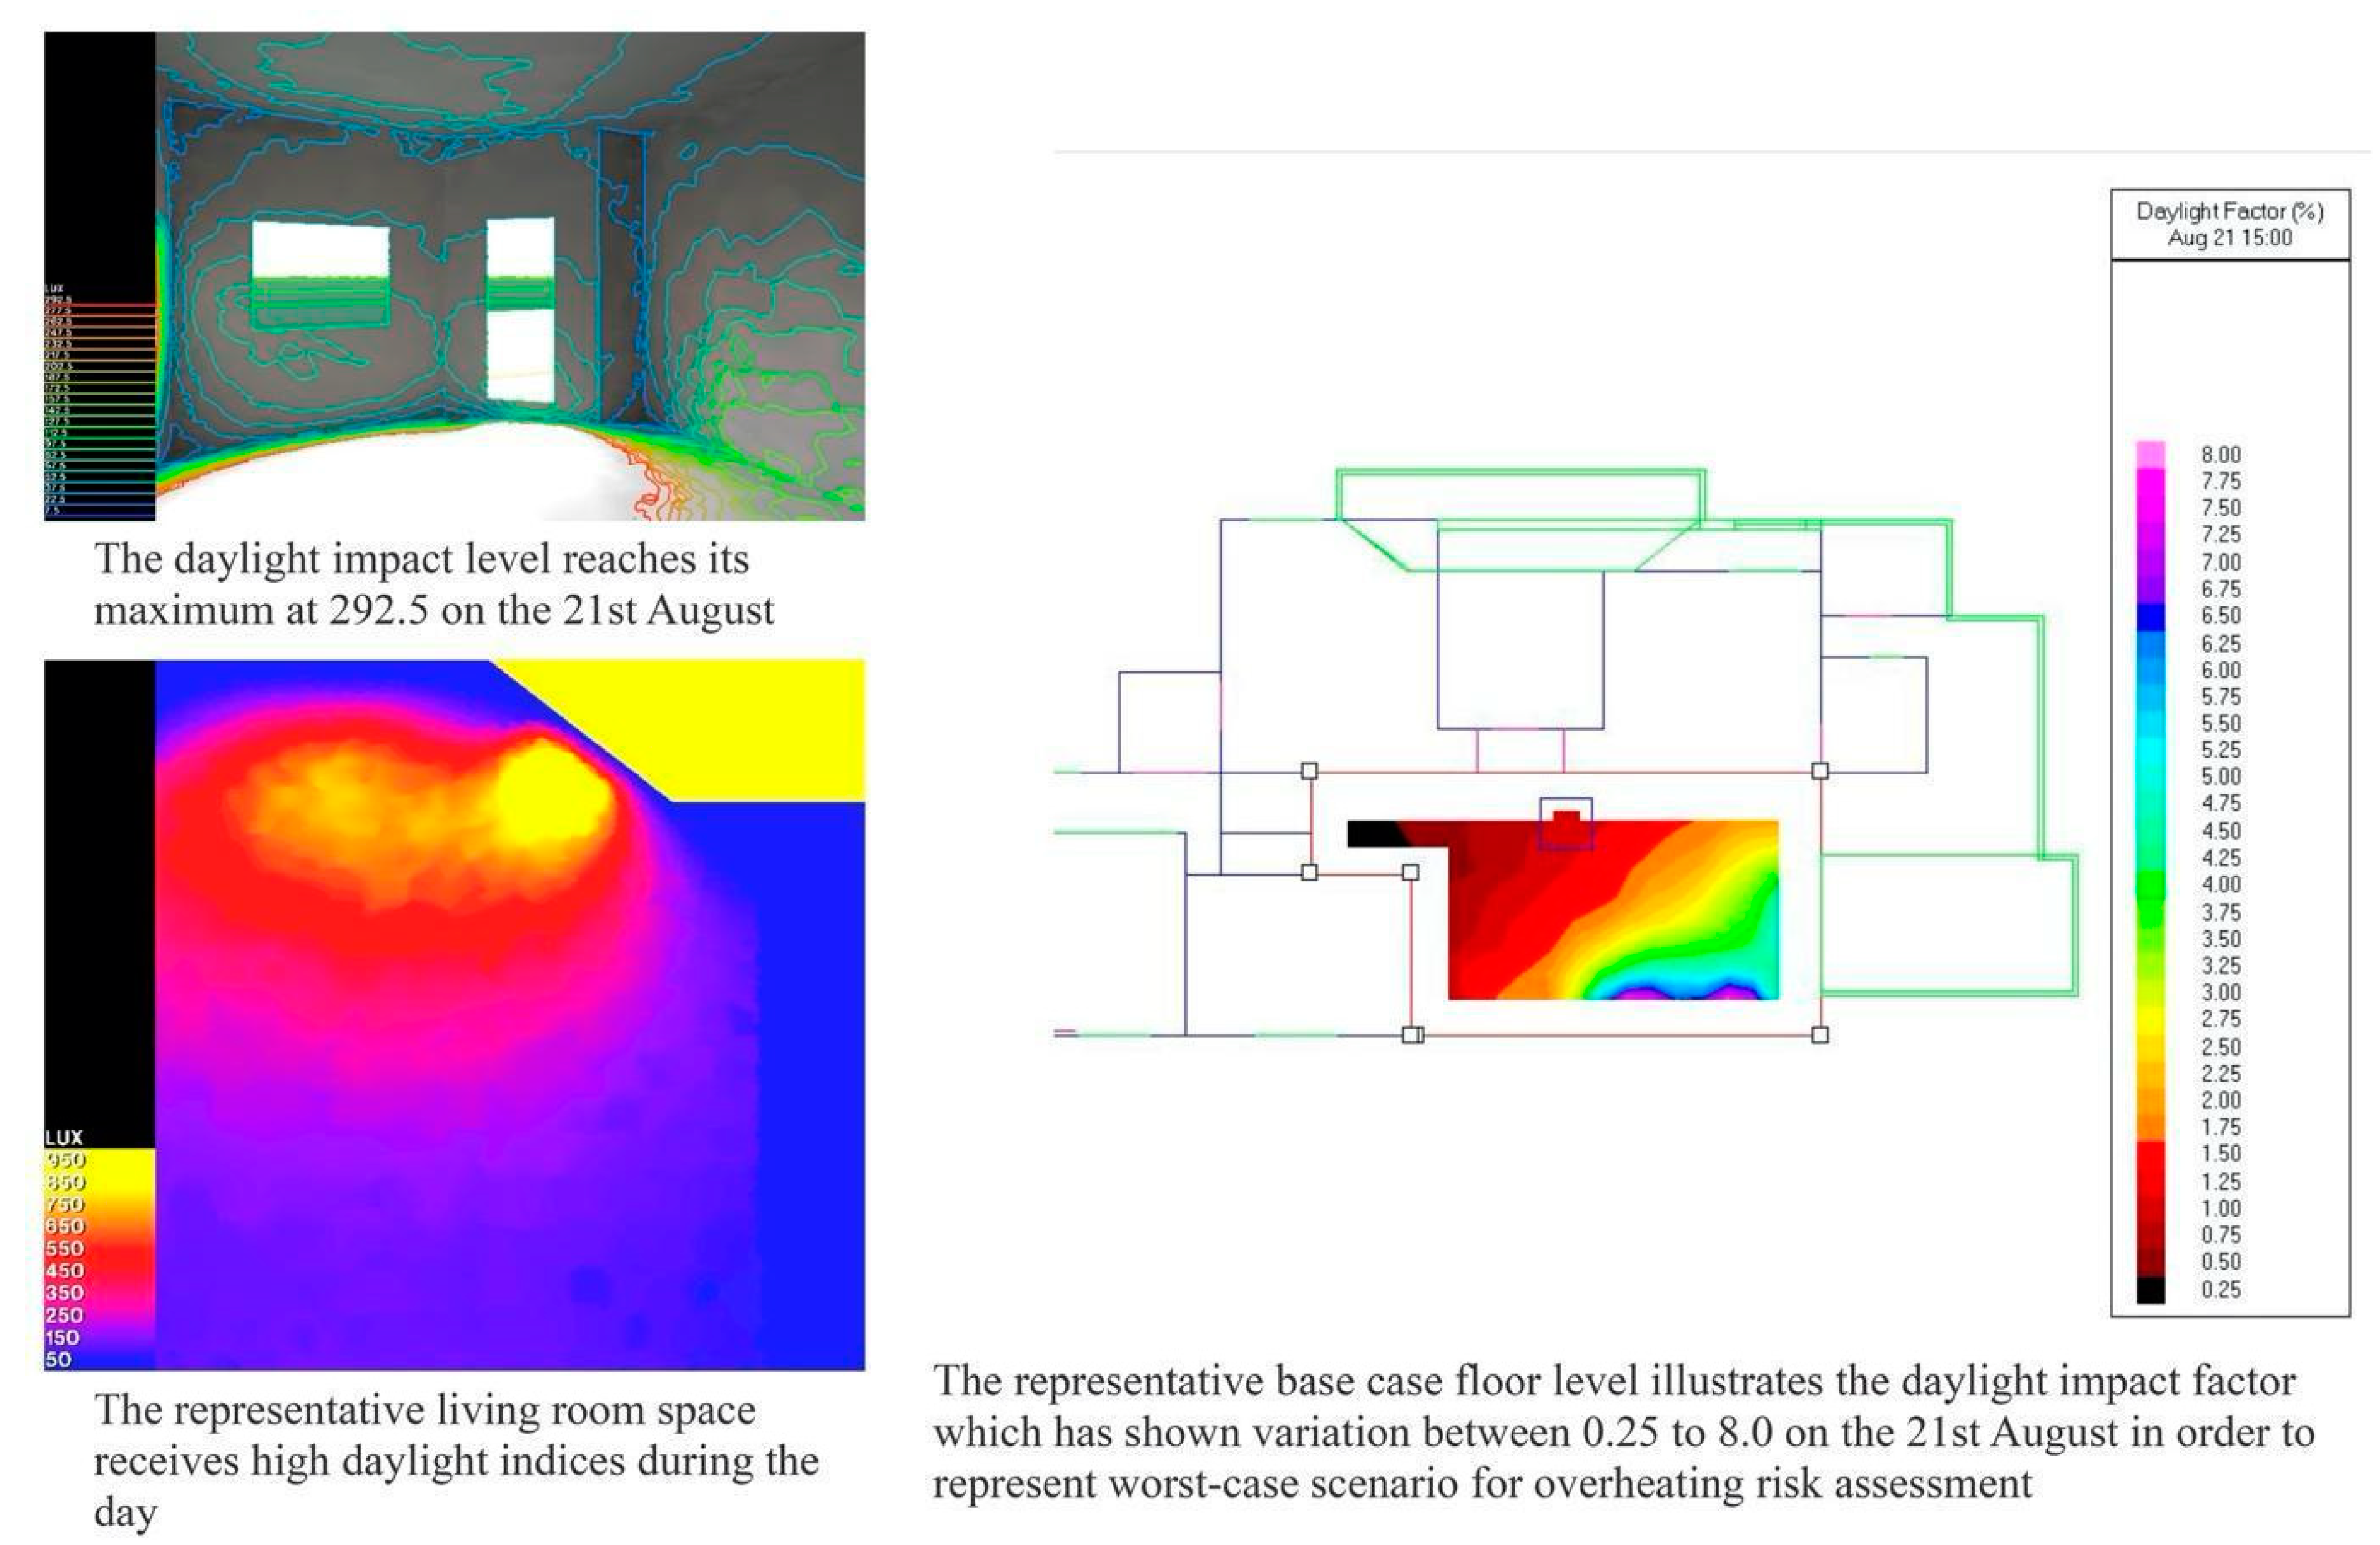
4.4. Daylight Impact Factor on Occupants’ Thermal Comfort and Energy Use
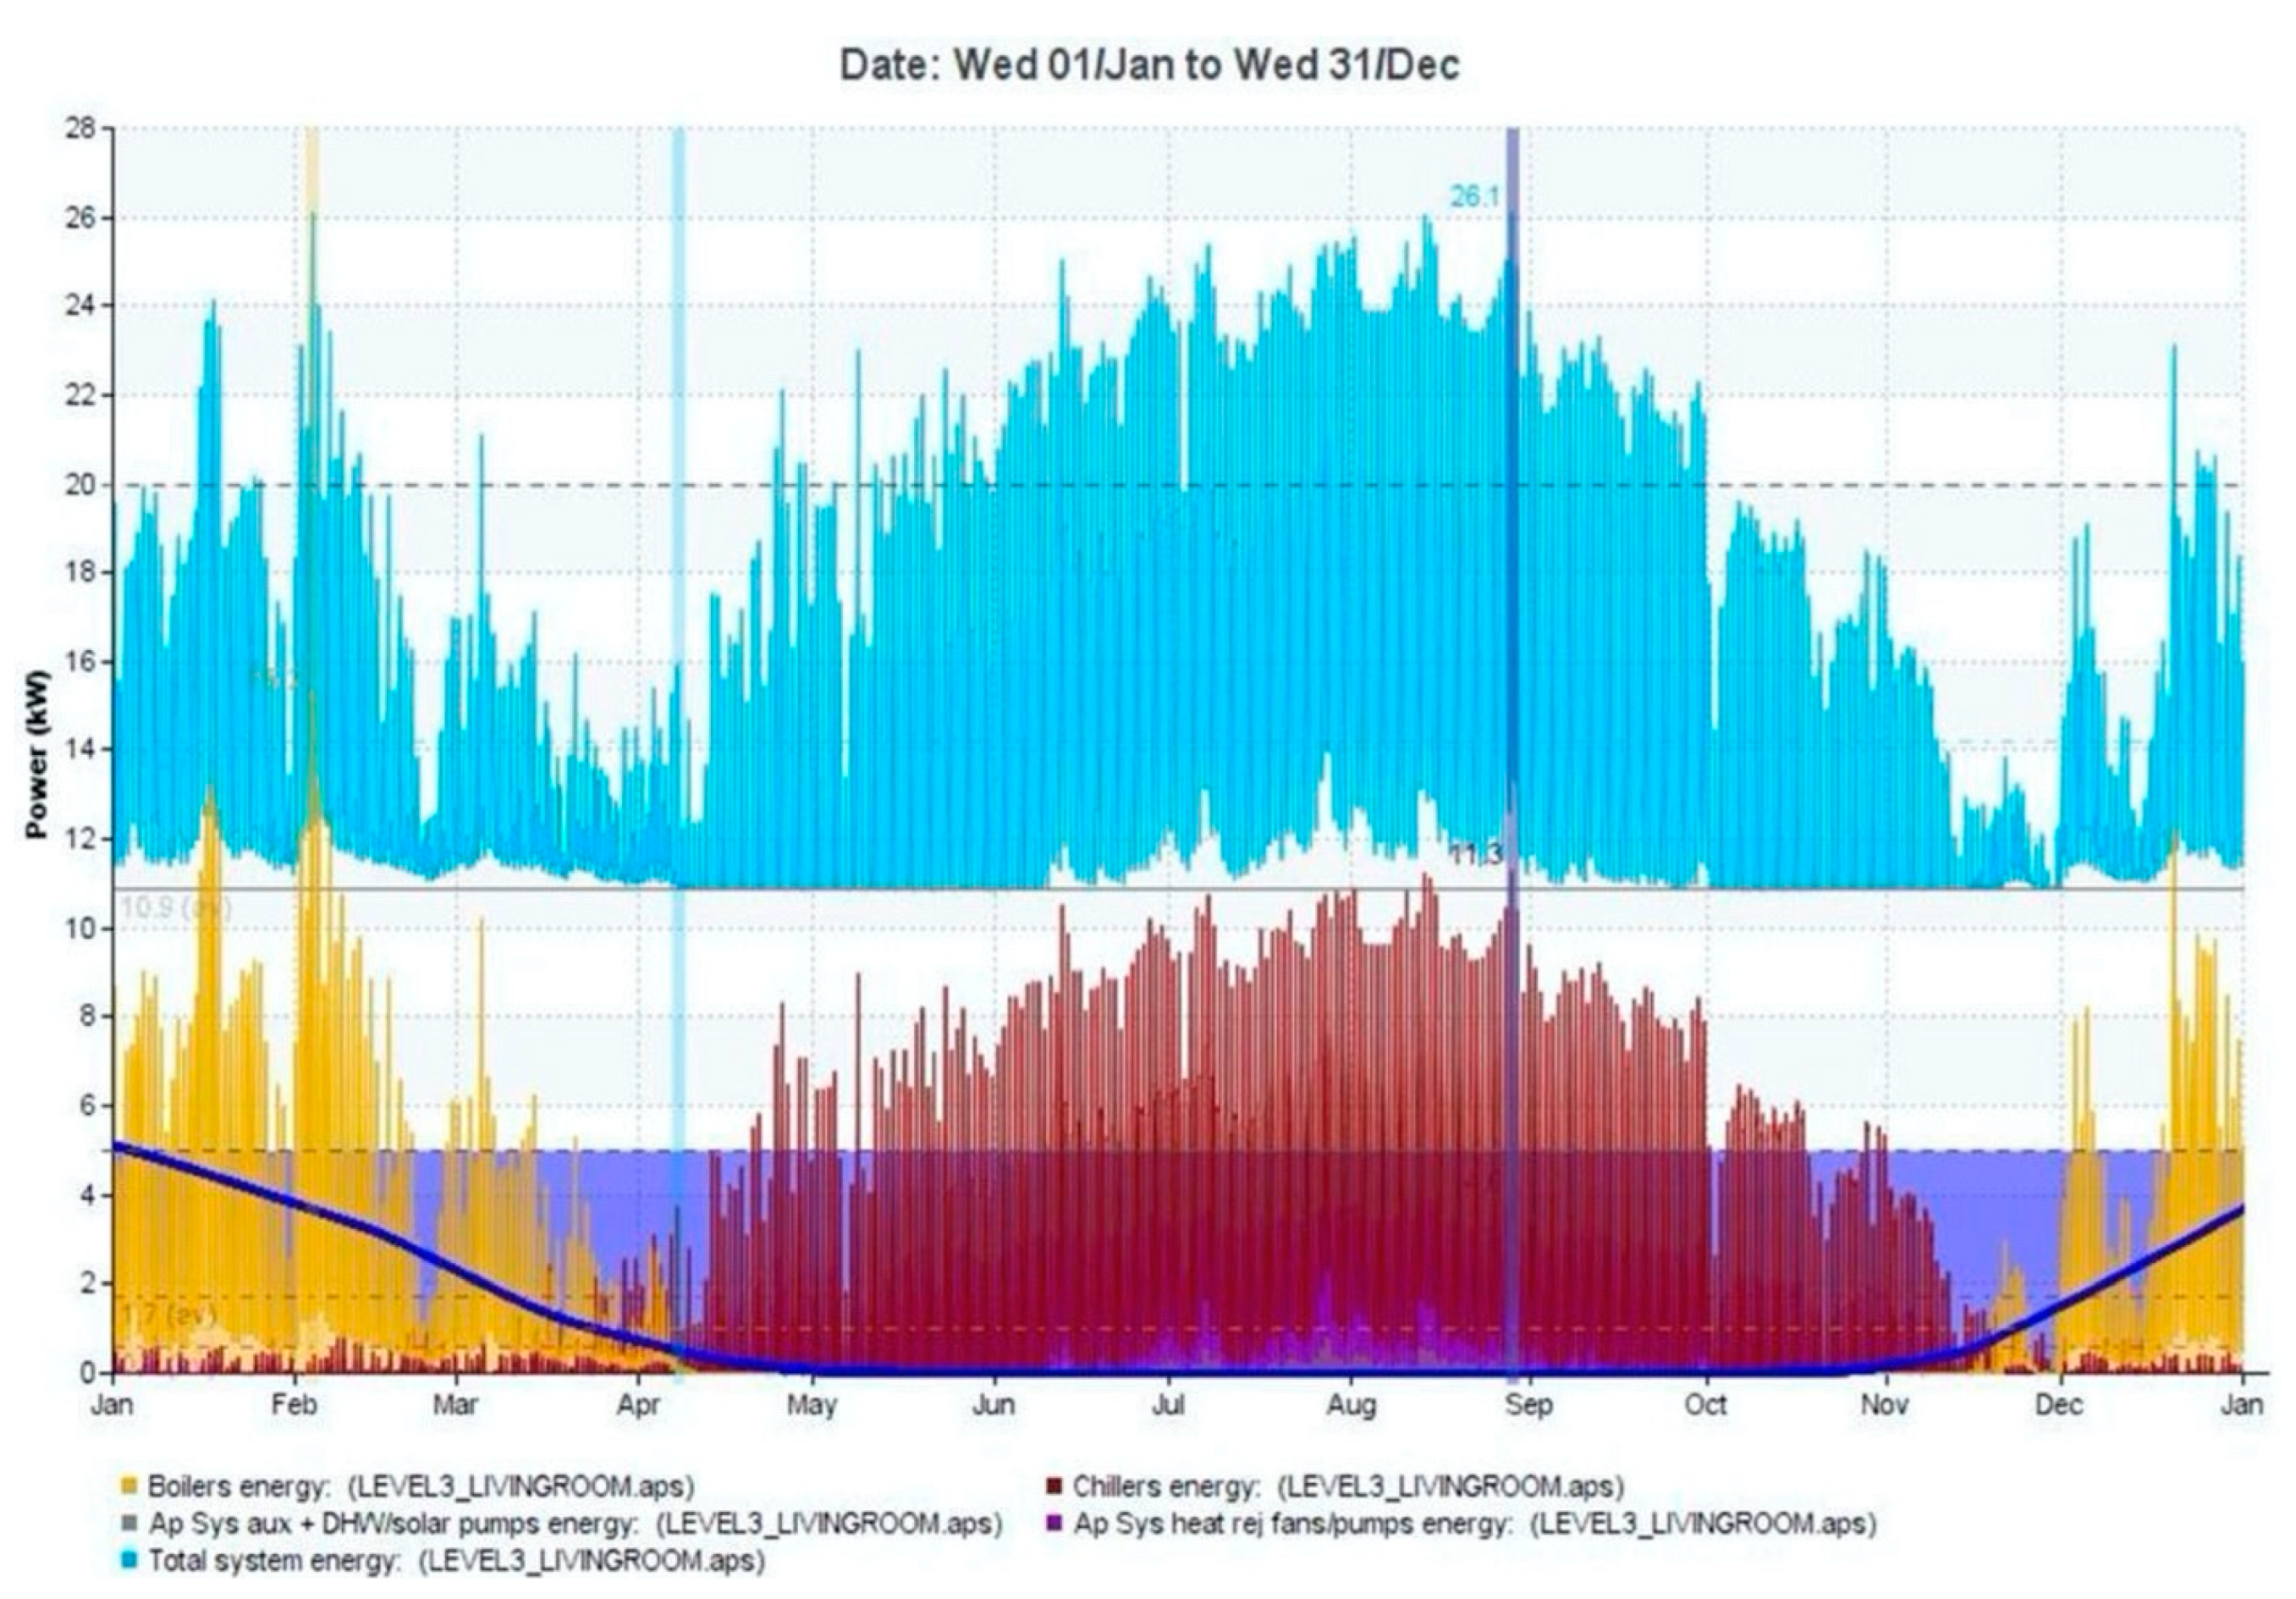
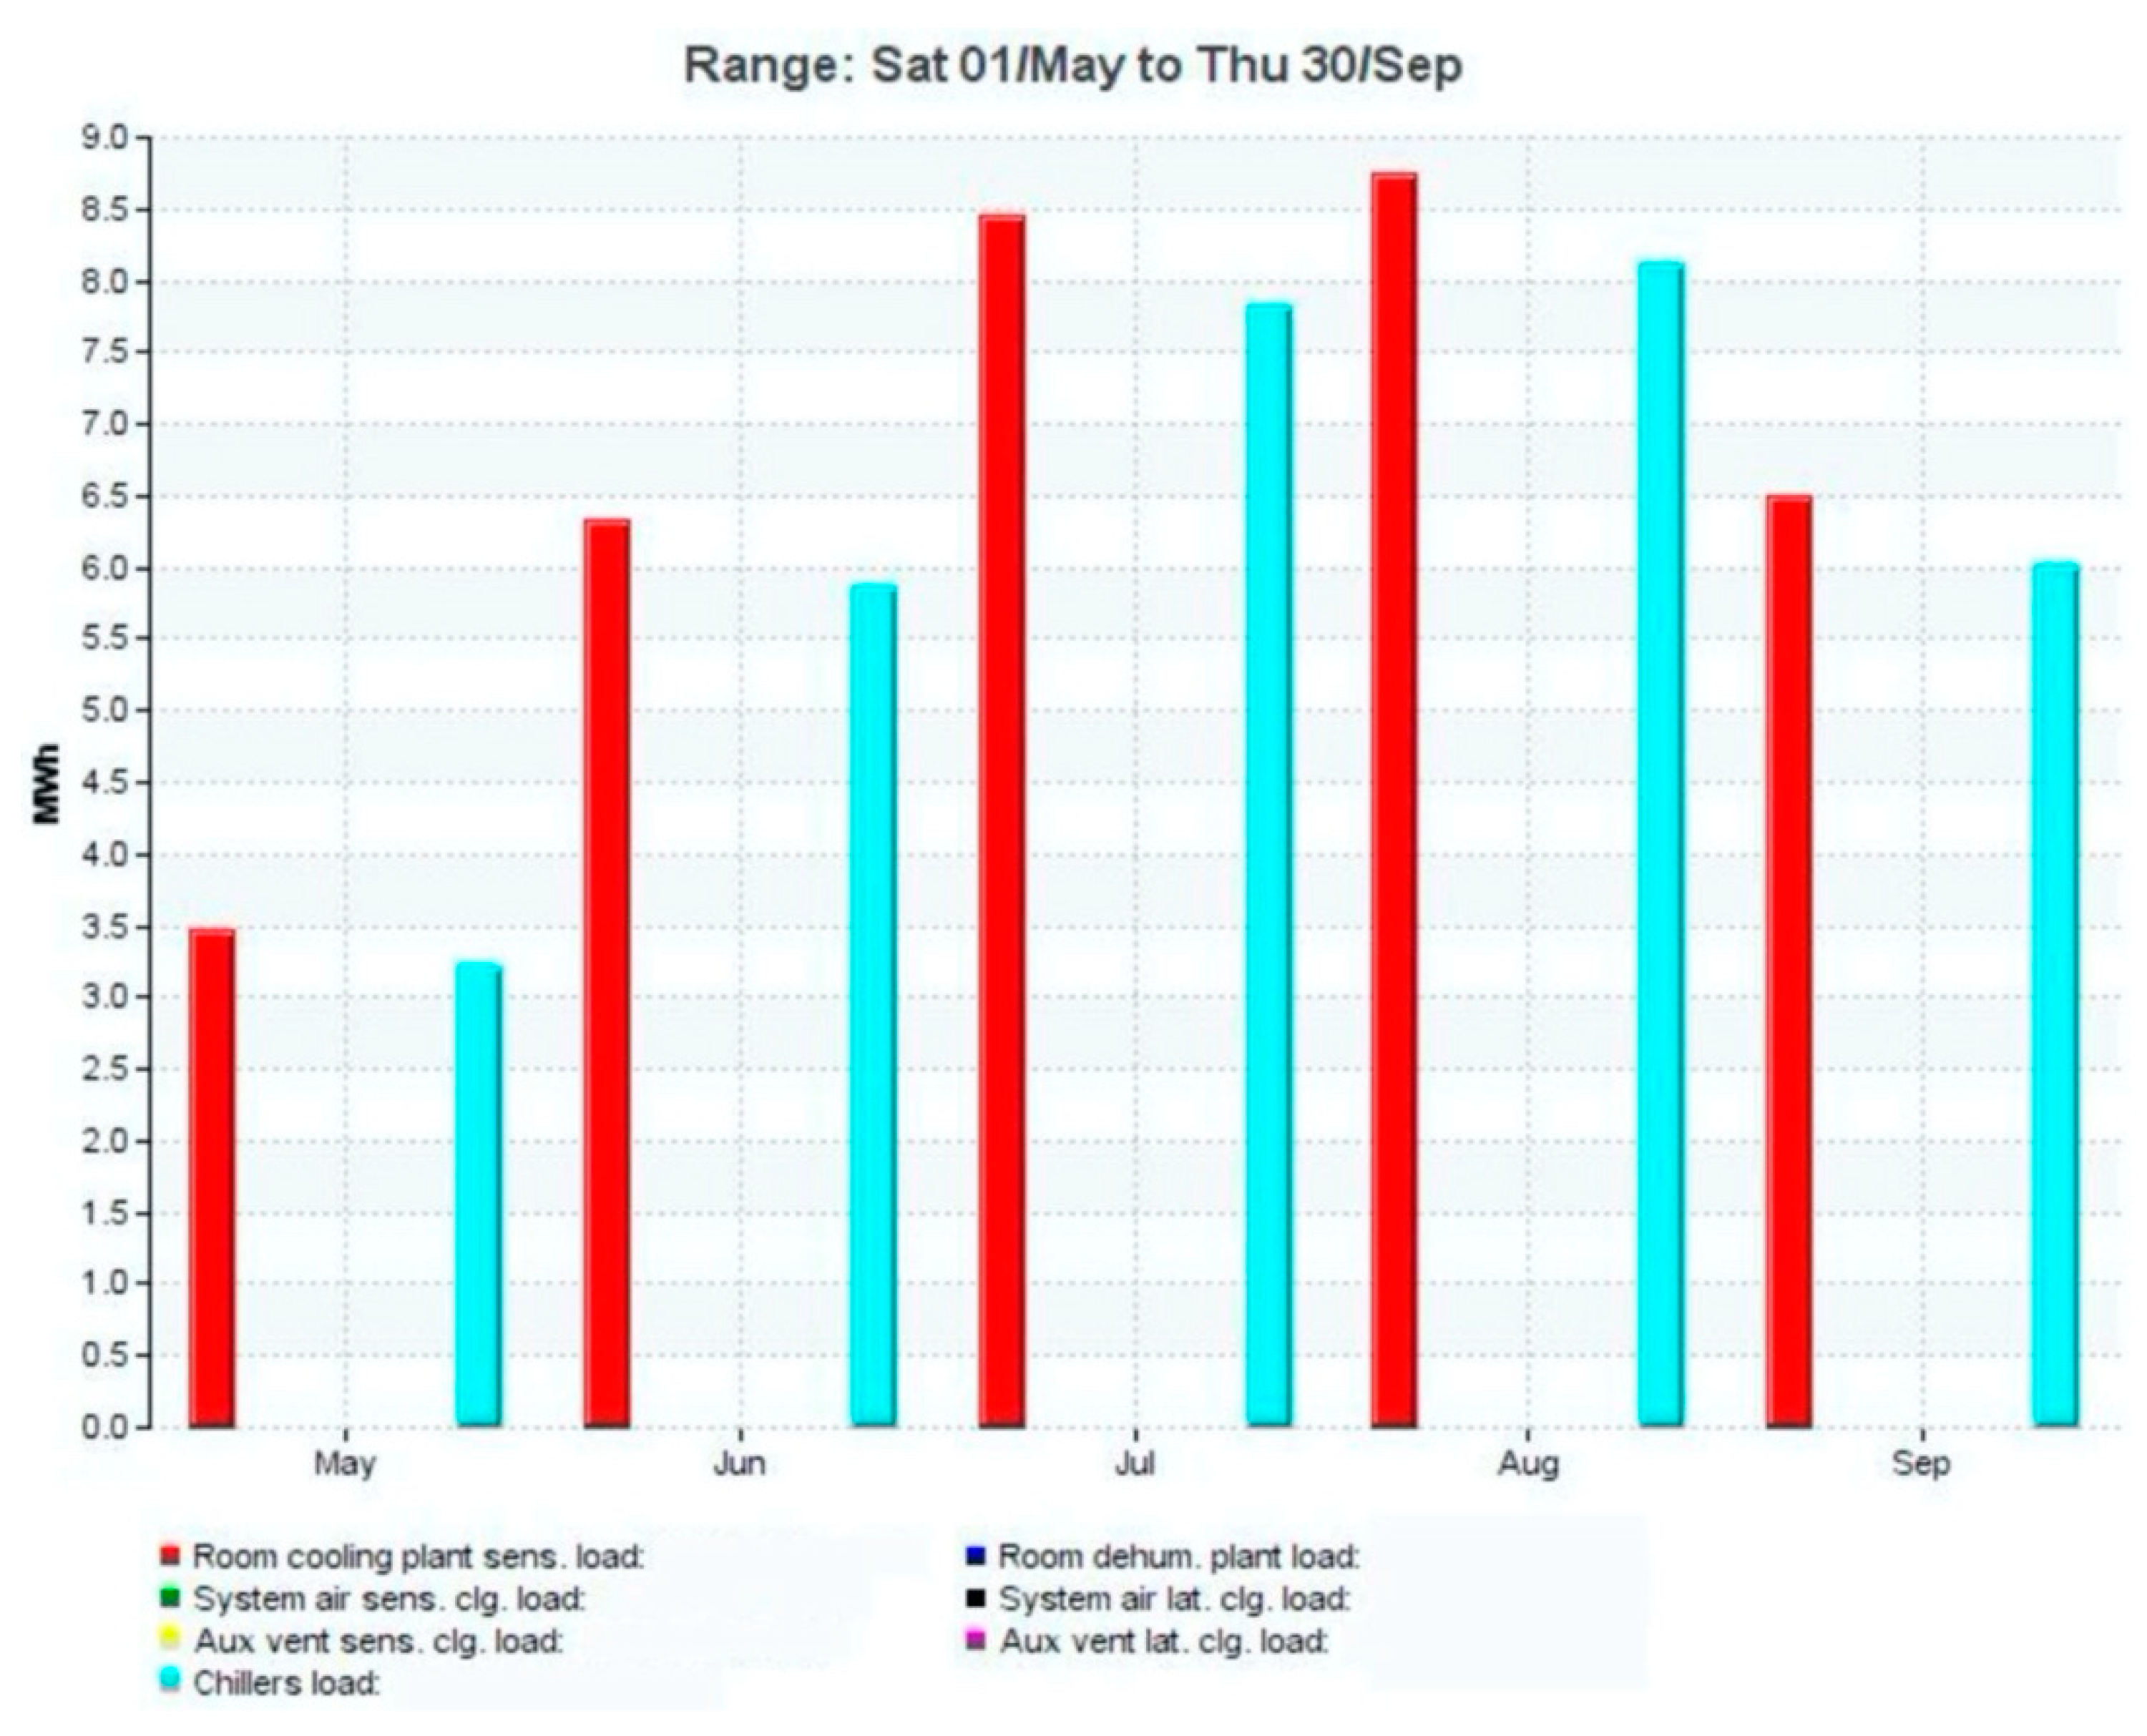
4.5. Energy Use
4.6. Correlation Analysis
4.7. Limitations
- EPC data—Whilst extensive in terms of the number of buildings, the EPC data only comprised the housing stock data, after the implementation of the EPC schemes by the EPBD objectives in 2010 and 2012 for the eastern Mediterranean island of Cyprus, and there is a very little recorded information on understanding the energy rating scheme in Cyprus in comparison to the other EU-27 member states. Additionally, the representative buildings incorporated were also subject to some self-isolation owing to the degree of participation of individual households under the EU project Typology Approach for Building Stock Energy Assessment (TABULA) residential building typologies, which have been developed for 13 European countries.
- Pre-1974 residential buildings—For analysis of the archetypes, a subset of the database for pre-1974 residential buildings was used. The redevelopment findings would be limited to this age group, however, some principals may also be relevant to more recently constructed high-rise housing estates.
- Energy use—The energy calibration analysis was carried out using a comprehensive benchmarking criterion that was compliant with BS EN 15978: 2011—Sustainability of construction works, although it was based on generic material data. There may be some variation where specific products or alternative data are concerned.
- Simulation of thermal performance of the nationally representative archetypes—The households’ in-vivo experiences on energy use were assessed using dynamic thermal simulation methods. The tool used was industry-standard and was compiled with third-party verification, although the underlying calculation methods could vary relative to other tool providers, and it is noted that generally, such tools provide a simplification of the phenomena that exist in building engineering practice in general.
- Retrofitting design schemes—To give a range of reliable results within the verification of households’ actual energy use, a broad selection of residential building design criteria schemes—architectural and structural components—was incorporated, typically based on those observed in the representative RTB prototype. However, these were not comprehensive, and different results may be obtained for other district-scale retrofitting schemes in the southeastern Mediterranean basin.
4.8. Future Recommendations
5. Conclusions
Author Contributions
Funding
Institutional Review Board Statement
Informed Consent Statement
Data Availability Statement
Acknowledgments
Conflicts of Interest
Appendix A

Appendix B
References
- Government Office of Science. Future of Cities: The Science of Cities and Future Research Priorities—A Report by the Project’s Lead Expert Group. GOS/Foresight. 2016. Available online: https://www.gov.uk/government/uploads/system/uploads/attachment_data/file/516407/gs-16-6-future-cities-science-of-cities.pdf (accessed on 1 May 2019).
- Government Office of Science. Future of Cities: Foresight for Cities. GOS/Foresight. 2016. Available online: https://www.gov.uk/government/publications/future-of-cities-foresight-for-cities (accessed on 1 May 2019).
- Ozarisoy, B.; Altan, H. Low-energy design strategies for retrofitting existing residential buildings in Cyprus. In Proceedings of the Institution of Civil Engineers-Engineering Sustainability; Thomas Telford Ltd.: London, UK, 2018; Volume 172, pp. 241–255. [Google Scholar] [CrossRef]
- Ozarisoy, B.; Altan, H. Adoption of energy design strategies for retrofitting mass housing estates in Northern Cyprus. Sustainability 2017, 9, 1477. [Google Scholar] [CrossRef] [Green Version]
- Abokersh, M.H.; Spiekman, M.; Vijlbrief, O.; Goch, T.A.J.; Vallès, M.; Boer, D. A real-time diagnostic tool for evaluating the thermal performance of nearly zero energy buildings. Appl. Energy 2021, 281, 116091. [Google Scholar] [CrossRef]
- Abrahão, A.C.; Fábio, G.; Teixeira, L.; Denise, D.; Silva, H. The recent residential apartment buildings’ thermal performance under the combined effect of the global and the local warming. Energy Build. 2021, 238, 110828. [Google Scholar] [CrossRef]
- Aguacil, S.; Lufkin, S.; Rey, E.; Cuchi, A. Application of the cost-optimal methodology to urban renewal projects at the territorial scale based on statistical data—A case study in Spain. Energy Build. 2017, 144, 42–60. [Google Scholar] [CrossRef] [Green Version]
- Ozarisoy, B.; Altan, H. Energy Performance Development of Non-regulated Retrofit Mass Housing Estates in Northern Cyprus. Des. J. 2017, 20, S1765–S1781. [Google Scholar] [CrossRef]
- Fine, J.P.; Touchie, M.F. A grouped control strategy for the retrofit of post-war multi-unit residential building hydronic space heating systems. Energy Build. 2020, 208, 109604. [Google Scholar] [CrossRef]
- Fokaides, P.A.; Christoforou, E.A.; Kalogirou, S.A. Legislation driven scenarios based on recent construction advancements towards the achievement of nearly zero energy dwellings in the southern European country of Cyprus. Energy 2014, 66, 588–597. [Google Scholar] [CrossRef]
- Kylili, A.; Fokaides, P.A. Policy trends for the sustainability assessment of construction materials: A review. Sustain. Cities Soc. 2017, 35, 280–288. [Google Scholar] [CrossRef]
- Pignatta, G.; Chatzinikola, C.; Artopoulos, G.; Papanicolas, C.N.; Serghides, D.K.; Santamouris, M. Analysis of the indoor thermal quality in low income Cypriot households during winter. Energy Build. 2017, 152, 766–775. [Google Scholar] [CrossRef]
- Michael, A.; Gregoriou, S.; Kalogirou, S.A. Environmental assessment of an integrated adaptive system for the improvement of indoor visual comfort of existing buildings. Renew. Energy 2018, 115, 620–633. [Google Scholar] [CrossRef]
- Åkerman, M.; Halonen, M.; Wessberg, N. Lost in building design practices: The intertwining of energy with the multiple goals of home building in Finland. Energy Res. Soc. Sci. 2020, 61, 101335. [Google Scholar] [CrossRef]
- Arbolino, R.; Boffardi, R.; Ioppolo, G. The effectiveness of European energy policy on the Italian system: Regional evidence from a hierarchical cluster analysis approach. Energy Policy 2019, 132, 47–61. [Google Scholar] [CrossRef]
- Savvides, A.L. The provision of socially minded housing in Cyprus: Examining historical references and addressing recent challenges from an architectural perspective. Crit. Hous. Anal. 2017, 4, 84–98. [Google Scholar] [CrossRef]
- Yapicioglu, B. Management for Resilience: The Case of the North Cyprus Construction Industry. The Faculty of Engineering and Physical Sciences. School of Mechanical. Aerospace and Civil Engineering. University of Manchester. United Kingdom. 2014. Available online: https://www.research.manchester.ac.uk/portal/en/theses/management-for-resilience-the-case-of-the-north-cyprus-construction-industry(2e83e6db-455c-43db-b2a3-7b54f43c7d9e).html (accessed on 1 February 2021).
- Yorucu, V. The Analysis of Forecasting Performance by Using Time Series Data for Two Mediterranean Islands. Rev. Soc. Econ. Bus. Stud. 2003, 2, 175–196. Available online: https://www.researchgate.net/publication/255584205 (accessed on 1 February 2021).
- Yorucu, V.; Keles, R. The construction boom and environmental protection in Northern Cyprus as a consequence of the Annan Plan. Constr. Manag. Econ. 2007, 25, 77–86. [Google Scholar] [CrossRef]
- Yorucu, V. Construction in an Open Economy: Autoregressive Distributed Lag Modeling Approach and Causality Analysis—Case of North Cyprus. J. Constr. Eng. Manag. 2013, 139, 1199–1210. [Google Scholar] [CrossRef]
- Oktay, D. The quest for urban identity in the changing context of the city Northern Cyprus. Cities 2002, 19, 261–271. [Google Scholar] [CrossRef]
- Oktay, D. An analysis and review of the divided city of Nicosia, Cyprus, and new perspectives. Geography 2007, 92, 231–247. [Google Scholar] [CrossRef]
- Pulhan, H.; Numan, I. The transitional space in the traditional urban settlement of Cyprus. J. Archit. Plan. Res. 2005, 22, 160–178. [Google Scholar]
- Pulhan, A.; Yorucu, V.; Sinan Evcan, N. Global energy market dynamics and natural gas development in the Eastern Mediterranean region. Util. Policy 2020, 64, 101040. [Google Scholar] [CrossRef]
- Varoglu, L.; Temel, S.; Yilmaz, A. Knowledge, attitudes and behaviours towards the environmental issues: Case of Northern Cyprus. Eurasia J. Math. Sci. Technol. Educ. 2018, 14, 997–1004. [Google Scholar] [CrossRef]
- British Standards Institution (BSI). Indoor Environmental Input Parameters for Design and Assessment of Energy Performance of Buildings Addressing Indoor Air Quality, Thermal Environment, Lighting and Acoustics; BSI: London, UK, 2007. [Google Scholar]
- Chartered Institution of Buildings Services Engineers (CIBSE). Environmental Design, CIBSE Guide A; Chartered Institution of Building Services Engineers: London, UK, 2016. [Google Scholar]
- Firth, S.K.; Wright, A.J. Investigating the thermal characteristics of English dwellings: Summer temperatures. In Proceedings of the Air Conditioning and the Low Carbon Cooling Challenge, Windsor, UK, 27–29 July 2008. [Google Scholar]
- Ascione, F.; Bianco, N.; Masi, R.F.D.; Mauro, G.M.; Vanoli, G.P. Design of the building envelope: A novel multi-objective approach for the optimisation of energy performance and thermal comfort. Sustainability 2015, 7, 10809–10836. [Google Scholar] [CrossRef] [Green Version]
- Ascione, F.; Bianco, N.; Stasio, C.D.; Mauro, G.M.; Vanoli, G.P. Simulation-based model predictive control by the multi-objective optimization of building energy performance and thermal comfort. Energy Build. 2016, 111, 131–144. [Google Scholar] [CrossRef]
- Ascione, F.; Bianco, N.; Mauro, G.M.; Vanoli, G.P. A new comprehensive framework for the multi-objective optimization of building energy design: Harlequin. Appl. Energy 2019, 241, 331–361. [Google Scholar] [CrossRef]
- Borgeson, S.; Brager, G. Comfort standards and variations in exceedance for mixed-mode buildings. Build. Res. Inf. 2011, 39, 118–133. [Google Scholar] [CrossRef]
- Bianco, V.; Marmori, C. Modelling the deployment of energy efficiency measures for the residential sector. The case of Italy. Sustain. Energy Technol. Assess. 2022, 49, 101777. [Google Scholar] [CrossRef]
- McKenna, R.; Merkel, E.; Fehrenbach, D.; Mehne, S.; Fichtner, W. Energy efficiency in the German residential sector: A bottom-up building-stock-model-based analysis in the context of energy-political targets. Build. Environ. 2013, 62, 77–88. [Google Scholar] [CrossRef]
- Famuyibo, A.A.; Duffy, A.; Strachan, P. Developing archetypes for domestic dwellings—An Irish case study. Energy Build. 2012, 50, 150–157. [Google Scholar] [CrossRef] [Green Version]
- Dear, R.D.; Xiong, J.; Kim, J.; Cao, B. A review of adaptive thermal comfort research since 1998. Energy Build. 2020, 214, 109893. [Google Scholar] [CrossRef]
- CIBSE. CIBSE TM59—Design Methodology for the Assessment of Overheating Risk in Homes; The Chartered Institution of Building Services Engineers: London, UK, 2017. [Google Scholar]
- Fanger, P.O. Assessment of man’s thermal comfort in practice. Occup. Environ. Med. 1973, 30, 313–324. [Google Scholar] [CrossRef] [PubMed] [Green Version]
- Fanger, P.O.; Højbjerre, J.; Thomsen, J.O.B. Thermal comfort conditions in the morning and in the evening. Int. J. Biometeorol. 1974, 18, 16–22. [Google Scholar] [CrossRef] [PubMed]
- Bouden, C.; Ghrab, N. An adaptive thermal comfort model for the Tunisian context: A field study results. Energy Build. 2005, 37, 952–963. [Google Scholar] [CrossRef]
- Cheung, T.; Schiavon, S.; Parkinson, T.; Li, P.; Brager, G. Analysis of the accuracy on PMV—PPD model using the ASHRAE Global Thermal Comfort Database II. Build. Environ. 2019, 153, 205–217. [Google Scholar] [CrossRef] [Green Version]
- Jenkins, D.P.; Gul, M.; Patidar, S.; Banfill, P.F.G.; Gibson, G.; Menzies, G. Designing a methodology for integrating industry practice into a probabilistic overheating tool for future building performance. Energy Build. 2012, 54, 73–80. [Google Scholar] [CrossRef]
- Jenkins, D.P.; Ingram, V.; Simpson, S.A.; Patidar, S. Methods for assessing domestic overheating for future building regulation compliance. Energy Policy 2013, 56, 684–692. [Google Scholar] [CrossRef]
- Nicol, F. Adaptive thermal comfort standards in the hot-humid tropics. Energy Build. 2004, 36, 628–637. [Google Scholar] [CrossRef]
- Nicol, F.; Wilson, M.; Chiancarella, C. Using field measurements of desktop illuminance in European offices to investigate its dependence on outdoor conditions and its effect on occupant satisfaction, and the use of lights and blinds. Energy Build. 2006, 38, 802–813. [Google Scholar] [CrossRef]
- Nicol, J.F.; Hacker, J.; Spires, B.; Davies, H. Suggestion for new approach to overheating diagnostics. Build. Res. Inf. 2009, 37, 348–357. [Google Scholar] [CrossRef]
- Ozarisoy, B.; Altan, H. Significance of occupancy patterns and habitual household adaptive behaviour on home-energy performance of post-war social-housing estate in the South-eastern Mediterranean climate: Energy policy design. Energy 2022, 244, 122904. [Google Scholar] [CrossRef]
- Beizaee, A.; Lomas, K.J.; Firth, S.K. National survey of summertime temperatures and overheating risk in English homes. Build. Environ. 2013, 65, 1–17. [Google Scholar] [CrossRef] [Green Version]
- Böhm, M.; Beránková, J.; Brich, J.; Polášek, M.; Srba, J.; Němcová, D.; Černý, R. Factors influencing envelope airtightness of lightweight timber-frame houses built in the Czech Republic in the period of 2006–2019. Build. Environ. 2021, 194, 107687. [Google Scholar] [CrossRef]
- Gupta, R.; Gregg, M. Preventing the overheating of English suburban homes in a warming climate. Build. Res. Inf. 2013, 41, 281–300. [Google Scholar] [CrossRef]
- Sameni, S.M.T.; Gaterell, M.; Montazami, A.; Ahmed, A. Overheating investigation in UK social housing flats built to the Passivhaus standard. Build. Environ. 2015, 92, 222–235. [Google Scholar] [CrossRef] [Green Version]
- Alavirad, S.; Mohammadi, S.; Hoes, P.J.; Xu, L.; Hensen, J.L.M. Future-Proof Energy-Retrofit strategy for an existing Dutch neighbourhood. Energy Build. 2022, 260, 111914. [Google Scholar] [CrossRef]
- Cabeza, L.F.; Chàfer, M. Technological options and strategies towards zero energy buildings contributing to climate change mitigation: A systematic review. Energy Build. 2020, 219, 110009. [Google Scholar] [CrossRef]
- Calì, D.; Andersen, R.K.; Müller, D.; Olesen, B.W. Analysis of occupants’ behavior related to the use of windows in German households. Build. Environ. 2016, 103, 54–69. [Google Scholar] [CrossRef] [Green Version]
- Ascione, F.; Bianco, N.; Iovane, T.; Mauro, G.M.; Napolitano, D.F.; Ruggiano, A.; Viscido, L. A real industrial building: Modeling, calibration and Pareto optimization of energy retrofit. J. Build. Eng. 2020, 29, 101186. [Google Scholar] [CrossRef]
- Ascione, F.; Borrelli, M.; Masi, R.F.D.; Vanol, G.P. Nearly zero energy target and indoor comfort in Mediterranean climate: Discussion based on monitoring data for a real case study. Sustain. Cities Soc. 2020, 61, 102349. [Google Scholar] [CrossRef]
- Ozarisoy, B. Energy effectiveness of passive cooling design strategies to reduce the impact of long-term heatwaves on occupants’ thermal comfort in Europe: Climate change and mitigation. J. Clean. Prod. 2022, 330, 129675. [Google Scholar] [CrossRef]
- Belaïd, F.; Ranjbar, Z.; Massié, C. Exploring the cost-effectiveness of energy efficiency implementation measures in the residential sector. Energy Policy 2021, 150, 112122. [Google Scholar] [CrossRef]
- Bertoldi, P.; Mosconi, R. Do energy efficiency policies save energy? A new approach based on energy policy indicators (in the EU Member States). Energy Policy 2020, 139, 111320. [Google Scholar] [CrossRef]
- Cristino, T.M.; Lotufo, F.A.; Delinchant, B.; Wurtz, F.; Neto, A.F. A comprehensive review of obstacles and drivers to building energy-saving technologies and their association with research themes, types of buildings, and geographic regions. Renew. Sustain. Energy Rev. 2021, 135, 110191. [Google Scholar] [CrossRef]
- Cunha, P.; Neves, S.A.; Marques, A.C.; Serrasqueiro, Z. Adoption of energy efficiency measures in the buildings of micro-, small- and medium-sized Portuguese enterprises. Energy Policy 2020, 146, 111776. [Google Scholar] [CrossRef]
- Din, A.U.; Brotas, L. The Impacts of Overheating Mitigation within the Life Cycle Carbon of Dwellings Under UK Future Climate. Procedia Environ. Sci. 2017, 38, 836–843. [Google Scholar] [CrossRef]
- Din, A.; Brotas, L. Assessment of climate change on UK dwelling indoor comfort. Energy Procedia 2017, 122, 21–26. [Google Scholar] [CrossRef]
- Ozarisoy, B.; Altan, H. Regression forecasting of ‘neutral’ adaptive thermal comfort: A field study investigation in the south-eastern Mediterranean climate of Cyprus. Build. Environ. 2021, 202, 108013. [Google Scholar] [CrossRef]
- Ascione, F.; Bianco, N.; Mauro, G.M.; Napolitano, D.F. Effects of global warming on energy retrofit planning of neighborhoods under stochastic human behavior. Energy Build. 2021, 250, 111306. [Google Scholar] [CrossRef]
- Fokaides, P.A.; Christoforou, E.; Ilic, M.; Papadopoulos, A. Performance of a Passive House under subtropical climatic conditions. Energy Build. 2016, 133, 14–31. [Google Scholar] [CrossRef]
- Brotas, L.; Nicol, F. Estimating overheating in European dwellings. Archit. Sci. Rev. 2017, 60, 180–191. [Google Scholar] [CrossRef]
- Brotas, L.; Nicol, F. Using Passive Strategies to prevent overheating and promote resilient buildings. In Proceedings of the 32th International Conference on Passive and Low Energy Architecture: Cities, Buildings, People: Towards Regenerative Environment, Los Angeles, CA, USA, 11–13 July 2016; pp. 135–142. [Google Scholar]
- Din, A.; Brotas, L. Exploration of life cycle data calculation: Lessons from a Passivhaus case study. Energy Build. 2016, 118, 82–92. [Google Scholar] [CrossRef]
- Gupta, R.; Kapsali, M.; Howard, A. Evaluating the influence of building fabric, services and occupant related factors on the actual performance of low energy social housing dwellings in UK. Energy Build. 2018, 174, 548–562. [Google Scholar] [CrossRef] [Green Version]
- Gupta, R.; Gregg, M. Assessing energy use and overheating risk in net zero energy dwellings in UK. Energy Build. 2018, 158, 897–905. [Google Scholar] [CrossRef] [Green Version]
- Gupta, R.; Gregg, M. Assessing the magnitude and likely causes of summertime overheating in modern flats in UK. Energies 2020, 13, 5202. [Google Scholar] [CrossRef]
- Ozarisoy, B.; Altan, H. Bridging the energy performance gap of social housing stock in south-eastern Mediterranean Europe: Climate change and mitigation. Energy Build. 2022, 258, 111687. [Google Scholar] [CrossRef]
- Martins, T.A.d.L.; Faraut, S.; Adolphe, L. Influence of context-sensitive urban and architectural design factors on the energy demand of buildings in Toulouse, France. Energy Build. 2019, 190, 262–278. [Google Scholar] [CrossRef]
- Sbrogiò, L.; Bevilacqua, C.; De Sordi, G.; Michelotto, I.; Sbrogiò, M.; Toniolo, A.; Tosato, C. Strategies for Structural and Energy Improvement in Mid-Rise Unreinforced Masonry Apartment Buildings. A Case Study in Mestre (Northeast Italy). Sustainability 2021, 13, 8819. [Google Scholar] [CrossRef]
- Shi, W. An Investigation into Energy Consumption Behaviour and Lifestyles in UK Social Housing, Reducing Operational Retrofit. Ph.D. Thesis, University of East London, London, UK, 2018. [Google Scholar] [CrossRef]
- Simson, R.; Thomsen, K.E.; Wittchen, K.B.; Kurnitski, J. A Comparative Analysis of NZEB Energy Performance Requirements for Residential Buildings in Denmark, Estonia and Finland. In Proceedings of the E3S Web of Conferences, Tallinn, Estonia, 18–21 April 2021. [Google Scholar]
- Uidhir, T.M.; Rogan, F.; Collins, M.; Curtis, J.; Gallachóir, B.P.Ó. Improving energy savings from a residential retrofit policy: A new model to inform better retrofit decisions. Energy Build. 2020, 209, 109656. [Google Scholar] [CrossRef]
- Tuck, N.W.; Zaki, S.A.; Hagishima, A.; Rijal, H.B.; Zakaria, M.A.; Yakub, F. Effectiveness of free running passive cooling strategies for indoor thermal environments: Example from a two-storey corner terrace house in Malaysia. Build. Environ. 2019, 160, 106214. [Google Scholar] [CrossRef]
- Masi, R.F.D.; Gigante, A.; Vanoli, G.P. Are nZEB design solutions environmental sustainable? Sensitive analysis for building envelope configurations and photovoltaic integration in different climates. J. Build. Eng. 2021, 39, 102292. [Google Scholar] [CrossRef]
- Claude, S.; Ginestet, S.; Bonhomme, M.; Moulène, N.; Escadeillas, G. The Living Lab methodology for complex environments: Insights from the thermal refurbishment of a historical district in the city of Cahors, France. Energy Res. Soc. Sci. 2017, 32, 121–130. [Google Scholar] [CrossRef]
- Charmpis, D.C.; Kyriakidis, A.; Michael, A.; Ioannou, I.; Illampas, R. Thermal performance and embodied energy of standard and retrofitted wall systems encountered in Southern Europe. Energy 2018, 161, 1016–1027. [Google Scholar] [CrossRef]
- Constantinidou, K.; Zittis, G.; Hadjinicolaou, P. Variations in the simulation of climate change impact indices due to different land surface schemes over the Mediterranean, Middle East and Northern Africa. Atmosphere 2019, 10, 26. [Google Scholar] [CrossRef] [Green Version]
- Zittis, G.; Bruggeman, A.; Camera, C. 21st century projections of extreme precipitation indicators for Cyprus. Atmosphere 2020, 11, 343. [Google Scholar] [CrossRef] [Green Version]
- Balkiz, Y.; Therese, L.-W. Small but Complex: The Construction Industry in North Cyprus. Procedia Soc. Behav. Sci. 2014, 119, 466–474. [Google Scholar] [CrossRef] [Green Version]
- Kottek, M.; Grieser, J.; Beck, C.; Rudolf, B.; Rubel, F. World map of the Köppen-Geiger climate classification updated. Meteorol. Z. 2006, 15, 259–263. [Google Scholar] [CrossRef]
- Rubel, F.; Brugger, K.; Haslinger, K.; Auer, I. The climate of the European Alps: Shift of very high resolution Köppen-Geiger climate zones 1800–2100. Meteorol. Z. 2017, 26, 115–125. [Google Scholar] [CrossRef]
- CMO (Cyprus Meteorological Office of Republic of Cyprus). Annual Report of Meteorology. Department of Meteorology. Cyprus Institute. 2020. Available online: http://weather.cyi.ac.cy/en/ (accessed on 1 January 2021).
- CMS (Cyprus Meteorological Service of Northern Cyprus). Meteorological Statistical Data for Cyprus: The Annual Report. Department of Meteorology. 2020. Available online: http://kktcmeteor.org/verianaliz/Analyze-sic (accessed on 1 January 2021).
- Ciftcioglu, G.C. Social preference-based valuation of the links between home gardens, ecosystem services, and human well-being in Lefke Region of North Cyprus. Ecosyst. Serv. 2017, 25, 227–236. [Google Scholar] [CrossRef]
- Mehmet, O.; Yorucu, V. Explosive construction in a micro-state: Environmental limit and the Bon curve: Evidence from North Cyprus. Constr. Manag. Econ. 2008, 26, 79–88. [Google Scholar] [CrossRef]
- Evcil, A. An estimation of the residential space heating energy requirement in Cyprus using the regional average specific heat loss coefficient. Energy Build. 2012, 55, 164–173. [Google Scholar] [CrossRef]
- Evcil, A.; Vafaei, L.E. A comparative survey of the energy performances of dwellings across Cyprus. Energy Build. 2017, 148, 15–22. [Google Scholar] [CrossRef]
- Amasyali, K.; El-Gohary, N.M. A review of data-driven building energy consumption prediction studies. Renew. Sustain. Energy Rev. 2018, 81, 1192–1205. [Google Scholar] [CrossRef]
- Ascione, F.; Bianco, N.; Iovane, T.; Mastellone, M.; Mauro, G.M. Is it fundamental to model the inter-building effect for reliable building energy simulations? Interaction with shading systems. Build. Environ. 2020, 183, 107161. [Google Scholar] [CrossRef]
- Bayomi, N.; Nagpal, S.; Rakha, T.; Fernandez, J.E. Building Envelope Modeling Calibration using Aerial Thermography. Energy Build. 2020, 233, 110648. [Google Scholar] [CrossRef]
- Caro, R.; Sendra, J.J. Are the dwellings of historic Mediterranean cities cold in winter? A field assessment on their indoor environment and energy performance. Energy Build. 2021, 230, 110567. [Google Scholar] [CrossRef]
- Encinas, F.; De Herde, A. Sensitivity analysis in building performance simulation for summer comfort assessment of apartments from the real estate market. Energy Build. 2013, 65, 55–65. [Google Scholar] [CrossRef]
- Tian, W.; Heo, Y.; De Wilde, P.; Li, Z.; Yan, D.; Park, C.S.; Feng, X.; Augenbroe, G. A review of uncertainty analysis in building energy assessment. Renew. Sustain. Energy Rev. 2018, 93, 285–301. [Google Scholar] [CrossRef] [Green Version]
- Bracht, M.K.; Melo, A.P.; Lamberts, R. A metamodel for building information modeling-building energy modeling integration in early design stage. Autom. Constr. 2021, 121, 103422. [Google Scholar] [CrossRef]
- Khamis, H. Measures of association: How to choose? J. Diagn. Med. Sonogr. 2008, 24, 155–162. [Google Scholar] [CrossRef] [Green Version]
- Guerra-Santin, O.; Tweed, C.; Jenkins, H.; Jiang, S. Monitoring the performance of low energy dwellings: Two UK case studies. Energy Build. 2013, 64, 32–40. [Google Scholar] [CrossRef]
- Gupta, R.; Barnfield, L.; Gregg, M. Overheating in care settings: Magnitude, causes, preparedness and remedies. Build. Res. Inf. 2016, 45, 83–101. [Google Scholar] [CrossRef]
- Griffiths, I.D. Thermal Comfort in Buildings with Passive Solar Features: Field Studies; Report to the Commission of the European Communities, EN3S-090 UK; University of Surrey Guildford: Guildford, UK, 1990. [Google Scholar]
- Kyprianou, I.; Serghides, D.K.; Varo, A.; Gouveia, J.P.; Kopeva, D.; Murauskaite, L. Energy poverty policies and measures in 5 EU countries: A comparative study. Energy Build. 2019, 196, 46–60. [Google Scholar] [CrossRef]
- Loga, T.; Stein, B.; Diefenbach, N. TABULA building typologies in 20 European countries—Making energy-related features of residential building stocks comparable. Energy Build. 2016, 132, 4–12. [Google Scholar] [CrossRef]
- López-Moreno, H.; Núñez-Peiró, M.; Sánchez-Guevara, C.; Neila, J. On the identification of Homogeneous Urban Zones for the residential buildings’ energy evaluation. Build. Environ. 2022, 207, 108451. [Google Scholar] [CrossRef]
- Lowe, R.; Chiu, L.F. Innovation in deep housing retrofit in the United Kingdom: The role of situated creativity in transforming practice. Energy Res. Soc. Sci. 2020, 63, 101391. [Google Scholar] [CrossRef]
- Krüger, E.L.; Tamura, C.A.; Bröde, P.; Schweiker, M.; Wagner, A. Short- and long-term acclimatization in outdoor spaces: Exposure time, seasonal and heatwave adaptation effects. Build. Environ. 2017, 116, 17–29. [Google Scholar] [CrossRef]
- Kim, Y.J.; Lee, S.J.; Jin, H.S.; Suh, I.A.; Song, S.Y. Comparison of linear and nonlinear statistical models for analyzing determinants of residential energy consumption. Energy Build. 2020, 223, 110226. [Google Scholar] [CrossRef]
- Ličina, V.F.; Cheung, T.; Zhang, H.; Dear, R.d.; Parkinson, T.; Arens, E.; Chun, C.; Schiavon, S.; Luo, M.; Brager, G.; et al. Development of the ASHRAE Global Thermal Comfort Database II. Build. Environ. 2018, 142, 502–512. [Google Scholar] [CrossRef] [Green Version]
- Geraldi, M.S.; Ghisi, E. Building-level and stock-level in contrast: A literature review of the energy performance of buildings during the operational stage. Energy Build. 2020, 211, 109810. [Google Scholar] [CrossRef]
- Roccotelli, M.; Rinaldi, A.; Fanti, M.P.; Iannone, F. Building Energy Management for Passive Cooling Based on Stochastic Occupants Behavior Evaluation. Energies 2020, 14, 138. [Google Scholar] [CrossRef]
- Lawrence, C.J.R.; Richman, R.; Kordjamshidi, M.; Skarupa, C. Application of Surrogate Modelling to Improve the Thermal Performance of Single-Family Homes Through Archetype Development. Energy Build. 2021, 237, 110812. [Google Scholar] [CrossRef]
- Rodrigues, T.L.; Gillot, M. Climate resilience of a low energy prototype house. Proc. Inst. Civ. Eng. —Eng. Sustain. 2013, 166, 337–350. [Google Scholar] [CrossRef]
- Roaf, S.; Crichton, D.; Nicol, F. Adapting Buildings and Cities for Climate Change—A21st Century Survival Guide, 2nd ed.; Routledge: Abingdon-on-Thames, UK, 2009. [Google Scholar]
- Stazi, F.; Marinelli, S.; Perna, C.D.; Munafò, P. Comparison on solar shadings: Monitoring of the thermo-physical behaviour, assessment of the energy saving, thermal comfort, natural lighting and environmental impact. Sol. Energy 2014, 105, 512–528. [Google Scholar] [CrossRef]
- Stopps, H.; Touchie, M.F. Managing thermal comfort in contemporary high-rise residential buildings: Using smart thermostats and surveys to identify energy efficiency and comfort opportunities. Build. Environ. 2020, 173, 106748. [Google Scholar] [CrossRef]
- Ballarini, I.; Corrado, V.; Madonna, F.; Paduos, S.; Ravasio, F. Energy refurbishment of the Italian residential building stock: Energy and cost analysis through the application of the building typology. Energy Policy 2017, 105, 148–160. [Google Scholar] [CrossRef]
- Castaño-Rosa, R.; Solís-Guzmán, J.; Marrero, M. Energy poverty goes south? Understanding the costs of energy poverty with the index of vulnerable homes in Spain. Energy Res. Soc. Sci. 2020, 60, 101325. [Google Scholar] [CrossRef]
- Monzón-Chavarrías, M.; López-Mesa, B.; Resende, J.; Corvacho, H. The nZEB concept and its requirements for residential buildings renovation in Southern Europe: The case of multi-family buildings from 1961 to 1980 in Portugal and Spain. J. Build. Eng. 2021, 34, 101918. [Google Scholar] [CrossRef]
- Kruskal, W.; Mosteller, F. Representative Sampling, IV: The History of the Concept in Statistics, 1895–1939. Int. Stat. Rev. 1980, 48, 169–195. [Google Scholar] [CrossRef]


| References | A. Study Location | B. Building Type | C. Sampling Size | D. Primary Aim of Model | E. Methodology | F. Main Findings |
|---|---|---|---|---|---|---|
| Bianco and Marmori (2021) [33] | Italy | Single and Multi-family houses | Typology 6 was selected as an archetype to represent housing stock built after 2005—represents 8000 new buildings per year |
|
|
|
| McKenna et al. (2013) [34] | Germany |
|
|
|
|
|
| Famuyibo et al. (2012) [35] | Ireland | Residential buildings | 13 representative archetypes were identified for the statistical analysis |
|
| The linear regression indicates a coefficient of determination, 0.391, indicating 39.1% of the variance in household total energy use. |
| Building Performance Factors | Internal Heat Gains in the Simulation | |
|---|---|---|
| Number of floors | 12 | Occupants: 3 W/m2 |
| Area-to-volume ratio [m−1] | 0.33 | Appliance equipment: 8 W/m2 |
| Floor surface of a typical tested room | 32.5 (m2) | Lighting: 2 W/m2 |
| Room volume of a typical tested room | 102.7 (m3) | |
| Window size | 1.5 × 1.2 (m2) per window opening | |
| Exterior window ratio | 0.21 | |
| Number of subjects involved | 1 male and 1 female (parents), 1 boy and 1 girl | |
| Age of the subjects | Between 2 and 40 | |
| S[cm] | U [W/(m2K)] | M [kg/m2] | C [kJ/(m2K)] | |
|---|---|---|---|---|
| Vertical walls | 35.0 | 0.98 | 305 | 264 |
| Roof | 36.0 | 0.91 | 317 | 302 |
| Windows | N/A | 2.91 | N/A | 258 |
| Internal floors | 28.50 | 1.63 | 298 | 256 |
| Internal walls | 11.0 | 1.57 | 92 | 84 |
| Room Occupancy | Peak Occupancy |
|---|---|
| Materials | Glazing type, ceiling finish, floor finish, partitions, doors |
| Lighting | Source, fitting type, number of fittings |
| Space conditioning | Ventilation type, cooling type, space control method |
| Parameter | Instrumentation Model | Range | Accuracy | Accuracy Requirements CIBSE 2015b |
|---|---|---|---|---|
| Air temperature | Fluke 63 Infrared Thermometer | −25–85 °C | ±0.5 °C (for range 0–40 °C) | Minimum: ±0.5 °C Ideal: ±0.2 °C |
| Relative humidity | Fluke 63 Infrared Thermometer | 0–95% | ±3% (at 25 °C) | ±5% |
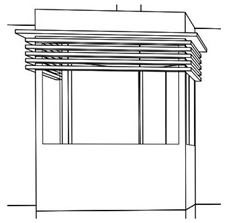
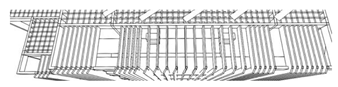
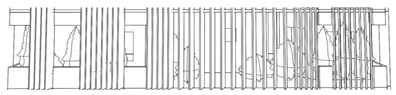
| Sunscreen Fixed Blade (S1) | Venetian Blinds (S2) | Overhang (S3) | Venetian Blind—Roller Blind (S3) |
|---|---|---|---|
 |  |  |  |
|
|
|
|
| Vertical Sunscreen (S4) | Fixed overhang (S5) | ||
 |  | ||
|
| ||
| Variables TSVs | Living Room | Kitchen | Bedroom 1 | Bedroom 2 | Bedroom 3 | Orientation | Floor Level | |
|---|---|---|---|---|---|---|---|---|
| Living Room | Cramer’s V/Pearson’s correlation | 1 | 0.462 ** | 0.302 ** | 0.146 | 0.200 * | 0.226 | 0.236 |
| Significance | — | 0.000 | 0.002 | 0.147 | 0.046 | 0.432 | 0.376 | |
| Kitchen | Cramer’s V/Pearson’s correlation | 0.462 ** | 1 | 0.133 | 0.205 * | 0.220 * | 0.279 | 0.222 |
| Significance | 0.000 | — | 0187 | 0.041 | 0.028 | 0.077 | 0.467 | |
| Bedroom 1 | Cramer’s V/Pearson’s correlation | 0.302 ** | 0.133 | 1 | 0.763 ** | 0.724 ** | 0.274 | 0.177 |
| Significance | 0.002 | 0187 | — | 0.000 | 0.000 | 0.210 | 0.949 | |
| Bedroom 2 | Cramer’s V/Pearson’s correlation | 0.146 | 0.205 * | 0.763 ** | 1 | 0.829 ** | 0.272 | 0.194 |
| Significance | 0.147 | 0.041 | 0.000 | — | 0.000 | 0.222 | 0.884 | |
| Bedroom 3 | Cramer’s V/Pearson’s correlation | 0.200 * | 0.220 * | 0.724 ** | 0.829 ** | 1 | 0.263 | 0.221 |
| Significance | 0.046 | 0.028 | 0.000 | 0.000 | — | 0.143 | 0.478 | |
| Orientation | Cramer’s V | 0.226 | 0.279 | 0.274 | 0.272 | 0.263 | 1 | 0.197 |
| Significance | 0.432 | 0.077 | 0.210 | 0.222 | 0.143 | — | 0.234 | |
| Floor Level | Cramer’s V | 0.236 | 0.222 | 0.177 | 0.194 | 0.221 | 0.197 | 1 |
| Significance | 0.376 | 0.467 | 0.949 | 0.884 | 0.478 | 0.234 | — | |
Publisher’s Note: MDPI stays neutral with regard to jurisdictional claims in published maps and institutional affiliations. |
© 2022 by the authors. Licensee MDPI, Basel, Switzerland. This article is an open access article distributed under the terms and conditions of the Creative Commons Attribution (CC BY) license (https://creativecommons.org/licenses/by/4.0/).
Share and Cite
Altan, H.; Ozarisoy, B. An Analysis of the Development of Modular Building Design Elements to Improve Thermal Performance of a Representative High Rise Residential Estate in the Coastline City of Famagusta, Cyprus. Sustainability 2022, 14, 4065. https://doi.org/10.3390/su14074065
Altan H, Ozarisoy B. An Analysis of the Development of Modular Building Design Elements to Improve Thermal Performance of a Representative High Rise Residential Estate in the Coastline City of Famagusta, Cyprus. Sustainability. 2022; 14(7):4065. https://doi.org/10.3390/su14074065
Chicago/Turabian StyleAltan, Hasim, and Bertug Ozarisoy. 2022. "An Analysis of the Development of Modular Building Design Elements to Improve Thermal Performance of a Representative High Rise Residential Estate in the Coastline City of Famagusta, Cyprus" Sustainability 14, no. 7: 4065. https://doi.org/10.3390/su14074065
APA StyleAltan, H., & Ozarisoy, B. (2022). An Analysis of the Development of Modular Building Design Elements to Improve Thermal Performance of a Representative High Rise Residential Estate in the Coastline City of Famagusta, Cyprus. Sustainability, 14(7), 4065. https://doi.org/10.3390/su14074065