Article

Modeling and Evaluating Beneficial Matches between Excess Renewable Power Generation and Non-Electric Heat Loads in Remote Alaska Microgrids

1
Alaska Center for Energy and Power, University of Alaska Fairbanks, Fairbanks, AK 99775, USA
2
Department of Civil and Environmental Engineering, Stanford University, Stanford, CA 94305, USA
3
Department of Civil, Geological and Environmental Engineering, College of Engineering and Mines, University of Alaska Fairbanks, Fairbanks, AK 99775, USA
*
Author to whom correspondence should be addressed.
Sustainability 2022, 14(7), 3884; https://doi.org/10.3390/su14073884
Submission received: 18 February 2022 / Revised: 17 March 2022 / Accepted: 24 March 2022 / Published: 25 March 2022

Abstract

:
Many Alaska communities rely on heating oil for heat and diesel fuel for electricity. For remote communities, fuel must be barged or flown in, leading to high costs. While renewable energy resources may be available, the variability of wind and solar energy limits the amount that can be used coincidentally without adequate storage. This study developed a decision-making method to evaluate beneficial matches between excess renewable generation and non-electric dispatchable loads, specifically heat loads such as space heating, water heating and treatment, and clothes drying in three partner communities. Hybrid Optimization Model for Multiple Electric Renewables (HOMER) Pro was used to model potential excess renewable generation based on current generation infrastructure, renewable resource data, and community load. The method then used these excess generation profiles to quantify how closely they align with modeled or actual heat loads, which have inherent thermal storage capacity. Of 236 possible combinations of solar and wind capacity investigated in the three communities, the best matches were seen between excess electricity from high-penetration wind generation and heat loads for clothes drying and space heating. The worst matches from this study were from low penetrations of solar (25% of peak load) with all heat loads.

1. Introduction

Rural communities in Alaska face the highest energy costs in the nation. This is partly due to the transportation cost of delivering diesel and heating fuel to remote communities by plane or boat. These communities regularly encounter electricity costs of $1/kWh or higher [1]. In addition to the practical need to reduce the cost of electricity, the Alaska state legislature has stated a non-binding goal of reaching 50% renewable power generation in Alaska by 2025 [2]. Currently, approximately 27% of the utility-scale power generation in the state is from hydroelectric power generation [2].
Alaska has a diverse renewable resource profile. The Aleutian Islands and west coast of Alaska regularly record wind speeds over 8.5 m/s at an elevation of 80 m [3]; interior Alaska receives over 20 hours of sunlight daily during the summer; and geothermal wells between 100 °F and 200 °F are located across the state, with several wells exceeding 300 °F [4]. The annual photovoltaic solar resource across Alaska averages from 3–4 kWh/m2/day [5]. Although renewable resources in Alaska are available, many renewable generation profiles do not synchronously complement community electric loads. For example, electric loads such as space heating and lighting are at a maximum during the winter when the daylight hours are fewer than seven hours per day in Juneau and nonexistent in Utqiagvik, where the sun does not rise above the horizon from mid-November until late January [6]. The introduction of energy storage and dispatchable loads to existing power generation infrastructure are possible approaches to integrate higher penetrations of renewable energy production in the nearly 200 electrically islanded Alaska power systems, or microgrids [7].
It would be useful to have a method to quickly determine if beneficial matches exist between an array of possible renewable energy sources and non-electric dispatchable loads on a community scale. Studies have considered the correlation between renewable energy and heating or cooling loads. For example, Jacobson (2021) analyzed future climate and weather predictions in cold regions and found that wind power availability is positively correlated with building heat loads and negatively correlated with solar availability [8]. However, because Jacobson’s investigation was regional in scale, the results may not be directly applicable to rural islanded microgrids in Alaska or other regions. Additionally, Jacobson did not explore the nuances of a variety of potential building heat loads, concentrating instead on modeled space heating loads.
In a similar study, Beyer and Niclasen (2019) focused on the correlation between wind and northern European space heating loads and found that the monthly wind generation and space heating needs were well correlated in many regions [9]. Their method calculated a normalized root mean square error between heating degree days and wind speed, and thus introduced a simple way to check the broad correlation of available wind power and space heating needs [9]. The study did not investigate other heating loads or generation sources. Although the method was performed at monthly resolution, they did present a case study at 10 min resolution to illustrate the need for further analysis and storage sizing.
A number of studies performed Hybrid Optimization Model for Multiple Electric Renewables (HOMER) optimization for hybrid renewable generation and a heating load [10,11]. In general, they optimized a community hybrid generation system with a given electric and thermal load. However, they did not investigate multiple potential heating loads.
Thermal loads are often met with combustion of heating oil or biomass (wood), and thus are typically not included in electric microgrid analyses. While there are analyses of thermal dispatch technologies with renewable energy [12], there are no studies that analyze the integration of all the specific heating loads with renewable energy in a remote Arctic microgrid. A quick way to decide which of several possible thermal loads is most likely to provide the optimal results would be useful as a precursor to this type of study. While several studies have explored matches with dispatchable electric loads for communities in Alaska [13,14,15,16,17], none have considered all aggregated heating loads in the entire microgrid. This paper is unique in providing a method to quickly analyze the match of excess electricity available from multiple potential renewable energy sources to a variety of thermal loads at a community level.
In this paper, we developed a decision-making method to specifically evaluate beneficial matches between excess renewable power generation and non-electric dispatchable loads. We then demonstrated the method′s application in three remote and rural communities in Alaska. We chose communities that span a typical range in size and load profile, of varying populations and climatic conditions. The primary loads considered were existing heat loads such as water treatment, space heating, and water heating. The available energy to meet this load was assumed to be excess renewable energy generation, which was modeled after the electric load of the community was met. This is in line with the established practice in rural Alaska microgrids where meeting the electric demand is given a priority due to its higher economic value before considering any available excess renewable power to generate heat. In rural Alaska microgrids, the excess renewable generation from intermittent resources is commonly used to generate heat (whether or not this heat is needed) as an integration mechanism instead of curtailment or battery storage [1]. For example, excess power has been used to power electrothermal stoves in Chaninik wind group communities in Alaska [18].
In Section 2, the communities used to demonstrate this method are described followed by the determination of the excess generation and thermal load profiles and the numerical evaluation of beneficial matches. Results are then provided in tabular form with sample plots and discussion.

2. Materials and Methods

2.1. Community Profiles

A combination of measured and simulated data were used to determine whether beneficial matches exist between renewable energy sources and potentially dispatchable heat loads in three test case communities. These test case communities are typical of Alaskan communities in size and load profile. The population, geography, climate, and base loads of each community are different, reflecting the diversity of communities across the state (Table 1), and the results for each community could be compared to determine if there are generalizable trends to good matches.

2.1.1. Community 1

Community 1 is a 200-person community in interior Alaska on a major river (continental subarctic climate). Four diesel generators meet the community′s electrical load with a combined rated capacity of 1375 kW, and five 425,000 Btu/hour cordwood-fired biomass boilers serve commercial heat loads. Three of the boilers provide heat for the washeteria (the community building with a laundromat and public showers), reducing the building’s heating oil consumption by approximately 50%. The average annual electric load is 71 kW and the peak is 133 kW. Although this community is located on a river, hydrokinetic resources were not considered for this method, as it is not as mature a technology as solar and wind.

2.1.2. Community 2

Community 2, with a population of 400, is on the southwest coast of Alaska (maritime subarctic climate). Community 2 has diesel generation and five 95 kW wind turbines. The turbines installed in this model reflect similar installations made by the Chaninik Wind Group in western Alaska to reduce high fuel and electricity rates and were purposefully oversized for the electric needs of communities [18]. The existing wind turbines meet approximately 30% of the community electric demand, and the excess energy is diverted to residential thermal stoves, acting as a storage buffer and reducing heating oil consumption by 30%. Community 2 does not have centralized plumbing and relies on the local washeteria for water, laundry, and bathing facilities. The average annual electric load in Community 2 is 105 kW and the peak is 226 kW.

2.1.3. Community 3

Community 3 is located on a large lake in southwest Alaska (continental climate) with a population of 70. This community has diesel generation (3, 65 kW generators) and has investigated solar, installed small wind turbines, and developed a hydrokinetic energy project. In the absence of data from the community’s renewable generation, the base generation was modeled as diesel generators for this paper. The average annual electric load is 50 kW and the peak is 120 kW.

2.2. Method Development

Hybrid Optimization Model for Multiple Electric Renewables (HOMER) Pro software (v. 3.14.2, [19]) was used to find the potential excess electricity generated from renewable energy sources that are first used to meet the existing electric load. Heat load data were compiled or modeled for each community. The method then compared the excess generation numerically with each heat load at an appropriate timescale. These steps are described in greater detail below.

2.2.1. Excess Renewable Generation

A single HOMER Pro model was created for each of the three rural communities in Alaska. HOMER Pro is industry standard software and has been validated by renewable energy data and other numerical models [14,20]. Each HOMER model used community electric loads based on actual data from Alaska, either gathered in the studied community or scaled from another community in the same region. In some cases, community electric load data was downsampled to a lower resolution and/or gap-filled using a moving average routine, when portions of data were not recorded due to measurement sensor and communication faults. Resource data provided by HOMER were used and included wind data from National Aeronautics and Space Administration (NASA) Prediction of Worldwide Energy Resource (POWER) [21] and solar global horizontal irradiance (GHI) resource data from the National Renewable Energy Laboratory (NREL) database [22]. A generic autosized diesel generator was selected for each model as the community’s electric power source, which allowed the generator to be sized appropriately with the addition of renewable generation. Minimum loading on the diesel generator was set at 15%, which is lower than usually recommended, but in an allowable range in high-penetration renewable systems for short time periods. Default HOMER operating reserves of 10% were used for load. No operating capacity was reserved for solar and wind power.
The peak electric load for each community was used to determine the sizes of renewable energy generation installations. Generic flat plate photovoltaic (PV) panels from the HOMER library were used for modeling solar PV integration. The solar installations were modeled with installed capacities sized to range from 25% to 225% of the peak community electric load, in steps of 25% between each model iteration. The installed wind was modeled as an integer number of 100 kW Xant M-21 turbines from the HOMER library, from one unit up to enough units to equal approximately 225% of the peak community electric load. This turbine was chosen as it is a size (100 kW) that is well represented in similar communities in Alaska and a brand that has been installed in the state. With this limited modularity in the case of wind, fewer capacities were explored than for solar in each of the communities, especially for those with smaller load. The community electric load was set as the primary load in each HOMER simulation and any generation above the community load was recorded as excess electricity production to be used in the evaluation below.

2.2.2. Heat Loads

Heat loads have inherent thermal storage, making them an advantageous match for excess renewable energy generated in systems that lack sufficient energy storage. For example, the thermal capacitance of building materials allows for the storage of energy from space heating, and the thermal capacitance of water allows for storage in water heating applications.
The availability of high-resolution heat data is a limiting factor in this method and estimated or simulated daily heat loads were used as alternatives. There are varying amounts of publicly available heat load data for each of the three communities. The Alaska Housing Finance Corporation (AHFC) has completed 327 energy audit reports for community buildings across Alaska [23]. Of these audits, two were for the health clinic and water treatment facility in Community 2, and three were for the school, water treatment facility, and water pump house in Community 1. Included in these reports were equipment efficiencies and modeled monthly fuel requirements, which have been used to calculate the heat load for various buildings, domestic water heating, process heat for the domestic water supply system, and hydronic heat supplied to community washeteria clothes dryers. Water supply process heat loads include raw intake water heating and water storage tank heating.
Heat load data were not publicly available for Community 3. Since there is no substantial industry or large commercial activity in this community, it was assumed that the main heat load is building space heating. An estimated heat load for each building type identified in Community 3 was modeled using the approach described below in Equations (1) and (2). Each of the heat loads investigated is currently served by a non-electric source: diesel, heating oil, and/or biomass.
Where data for community heating loads were unavailable, the energy required for space heating was calculated by determining the building’s overall heat loss factor (UA) from the annual heating fuel consumption—publicly available for each community in Alaska [24]. This method is shown in Equation (1):
UAB [BTU/h-°F] = (Heat Rate [BTU/gal])(Annual Fuel Use [gal])/(HDD × 24 h/day),
where the thermal transmittance of a building (UAB) is equal to the annual fuel consumption (BTU) divided by the annual heating degree days (HDD).
Using Equation (1) and known fuel consumption, the thermal heat loss can be calculated for each building type in the community. The electric equivalent of the heat load as a function of HDD is defined by Equation (2):
Heat Load [kWh] = (UAB)(HDD)(24 h/day)/(3412 BTU/kWh).
Efficiencies of the heat system were not considered in this model since electric heating is assumed to be 100% efficient for modeling purposes.
Hourly weather station or typical meteorological year (TMY) temperature data, in theory, allows the calculation of an hourly heat load profile. However, given the thermal storage capacity inherent in the systems studied, heat loads for Community 3 were calculated at daily resolution with the assumption that this is on the order of the effective duration of the thermal energy storage. The modeled heat load data available from public sources for Communities 1 and 2 were only resolved monthly and these have been linearly interpolated to create estimated daily heat loads for the purposes of this study. All load simulations were steady state.

2.2.3. Beneficial Matches

In the HOMER models, generation from renewable sources and diesel generators first serves the primary community electric load. HOMER reports generation beyond the primary load as ‘excess electrical production’, which can be compared with deferrable heat loads. Excess renewable generation can be modeled on a diurnal basis, consistent with typical thermal storage capacity of the analyzed loads, for integration with electric heating loads [16]. If the available excess generation is more than the heat load, it is able to meet that load, with some waste. If the excess generation is less than the heat load, it is not able to meet the heat load and additional energy is needed.
The metric chosen to evaluate the coincidence of excess renewables and heating was the root of the sum of the squares of the differences in energy between excess generation and heat load, in each time increment of the year—a root mean square error (RMSE). The RMSE was then normalized to the mean of the excess generation profile data (Equation (3)). This normalized RMSE (NRMSE) would evaluate to 0 for a perfect match between the two curves; would approach 1 for a heating demand much less than the available excess generation at all times; and would be very large for a heating demand much greater than the available excess generation at all times. As the loads and generation vary at different time scales, this relationship may change slightly, but generally the NRMSE can be used to indicate beneficial matches with lower values (ideally less than one), which can be investigated with additional analysis to determine which is most feasible technically, socially, and economically. The NRMSE is shown quantitatively in Equation (3):
NRMSE = i = 1 N Heat   demand kWh i Energy   Generation kWh i 2   Average   Energy   Generation kWh i
where the subscript i refers to the daily values over the year which was the resolution chosen for the heat loads, but hourly or another appropriate temporal scale could be considered; and N is the total number of timesteps in a year. All calculations of NRMSE to compare matches between excess generation and heat loads must use the same timestep, i, and number of timesteps, N. The appropriate timescale for this analysis was a few hours to daily given the thermal storage inherent in water tanks and buildings. Due to the resolution of the data available, we used daily resolution in this analysis.

3. Results

The method of evaluating beneficial matches by NRMSE (Equation (3)) was applied to the output of the three community models. There were 236 possible combinations of heat loads and renewable generation sources with the datasets investigated. Table 2 presents the NRMSE for a subset of the matches, including some of the best matches, from each community model for three heat load types: space heating, domestic water, and clothes drying. For Community 1, the water heat load was process heat, added to the community water treatment system raw water. For Community 2, the water heat load was for domestic water heating. Domestic water heating load data were not available for Community 3 and it did not have a community laundry facility. Space heating loads shown below are for residential buildings in Communities 1 and 3 (water heating was included with the heating load for Community 1) and for a combined function (water treatment plant, office, and accommodations) building in Community 2. The data presented in Table 2 highlights some of the best matches found in this study for each community and resource.
The best (lowest) NRMSE value calculated in this study was 0.6 for the beneficial match between wind generation and clothes drying heat loads in Community 2 and wind and space heating in Community 3. In both of these cases, the daily excess wind energy was often nearly the same magnitude as the heat load. The worst (highest) NRMSE value from this study was 2558.4 from the combination of solar generation and clothes drying in Community 2 (not shown). In this case, the clothes drying load was as high in magnitude as the winter space heating load but was nearly constant throughout the year, and the excess solar generation evaluated was the lowest level (25% of the peak community electric load). The daily heat load in this case was always much higher than the excess solar generation.
The reduction to a single NRMSE metric is useful to quickly compare and find low values corresponding to better matches; however, details are obfuscated as the loads and generation vary such that combinations of these relationships occur at different times. Plots of the excess generation and heat load curves can allow visual interpretation of the details of this relationship, such as times when the resource is generally adequate to meet the load and times where it is not. 
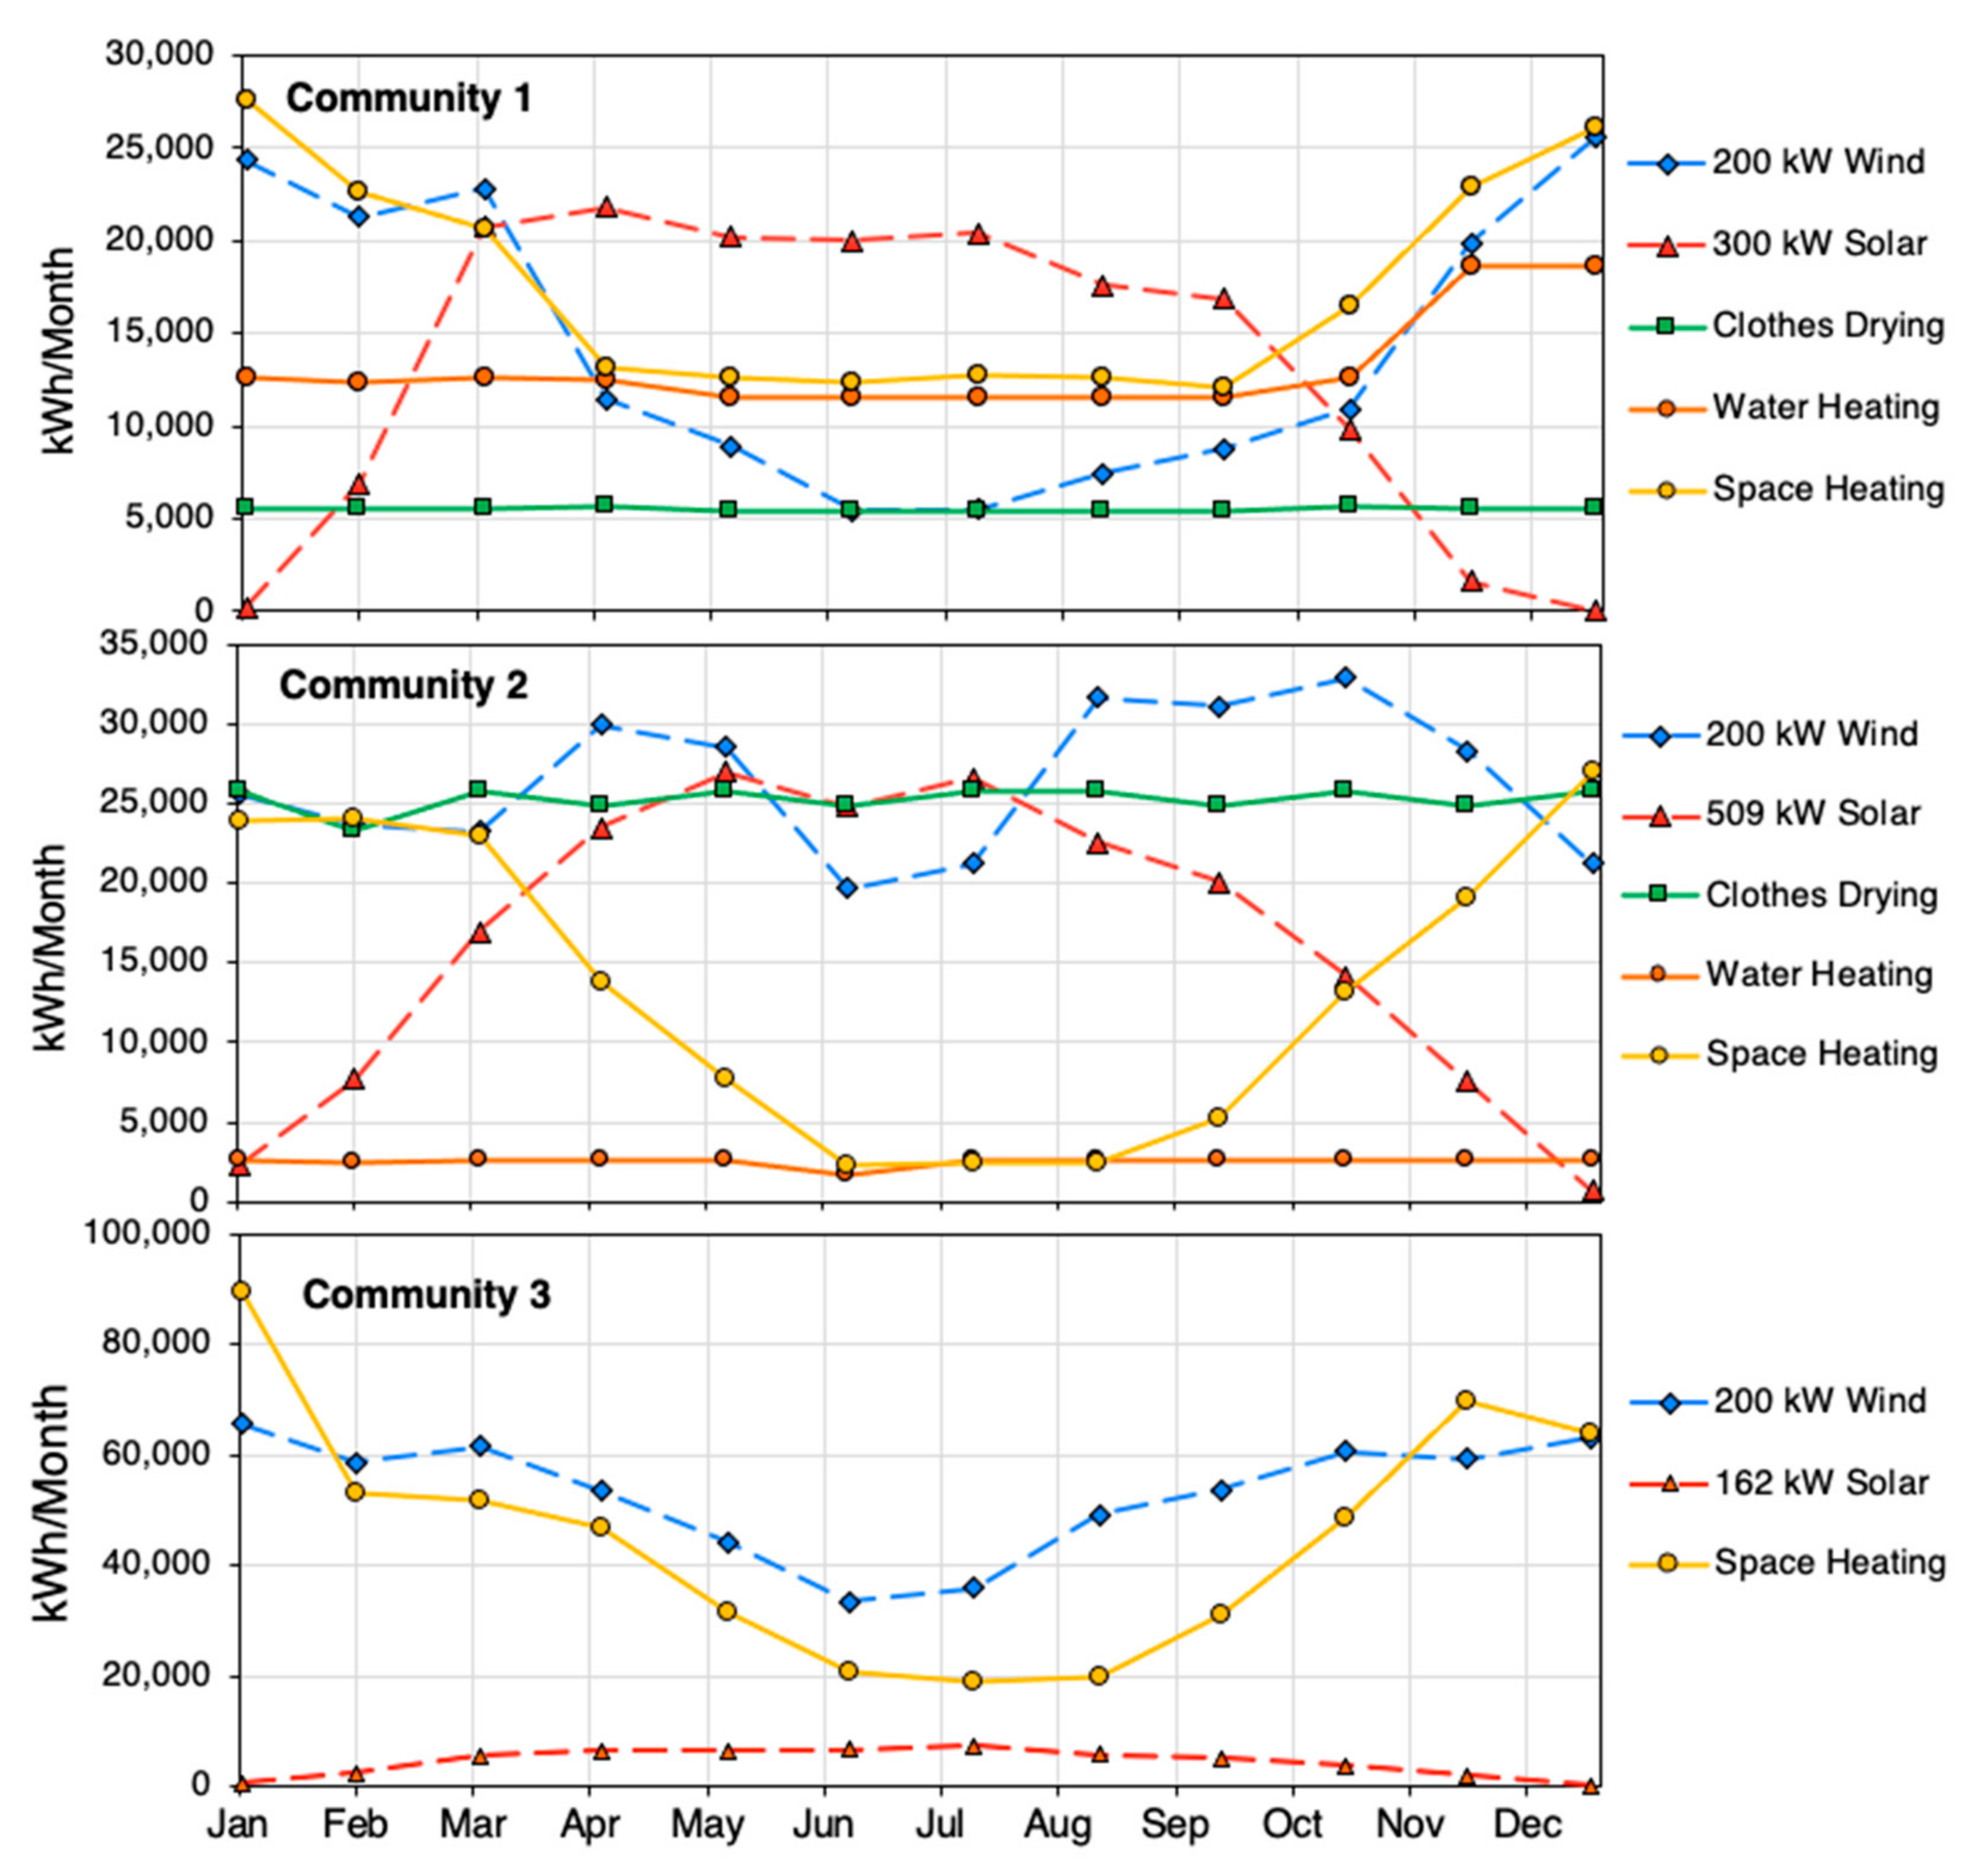
Figure 1 shows plots of the excess generation and loads from 
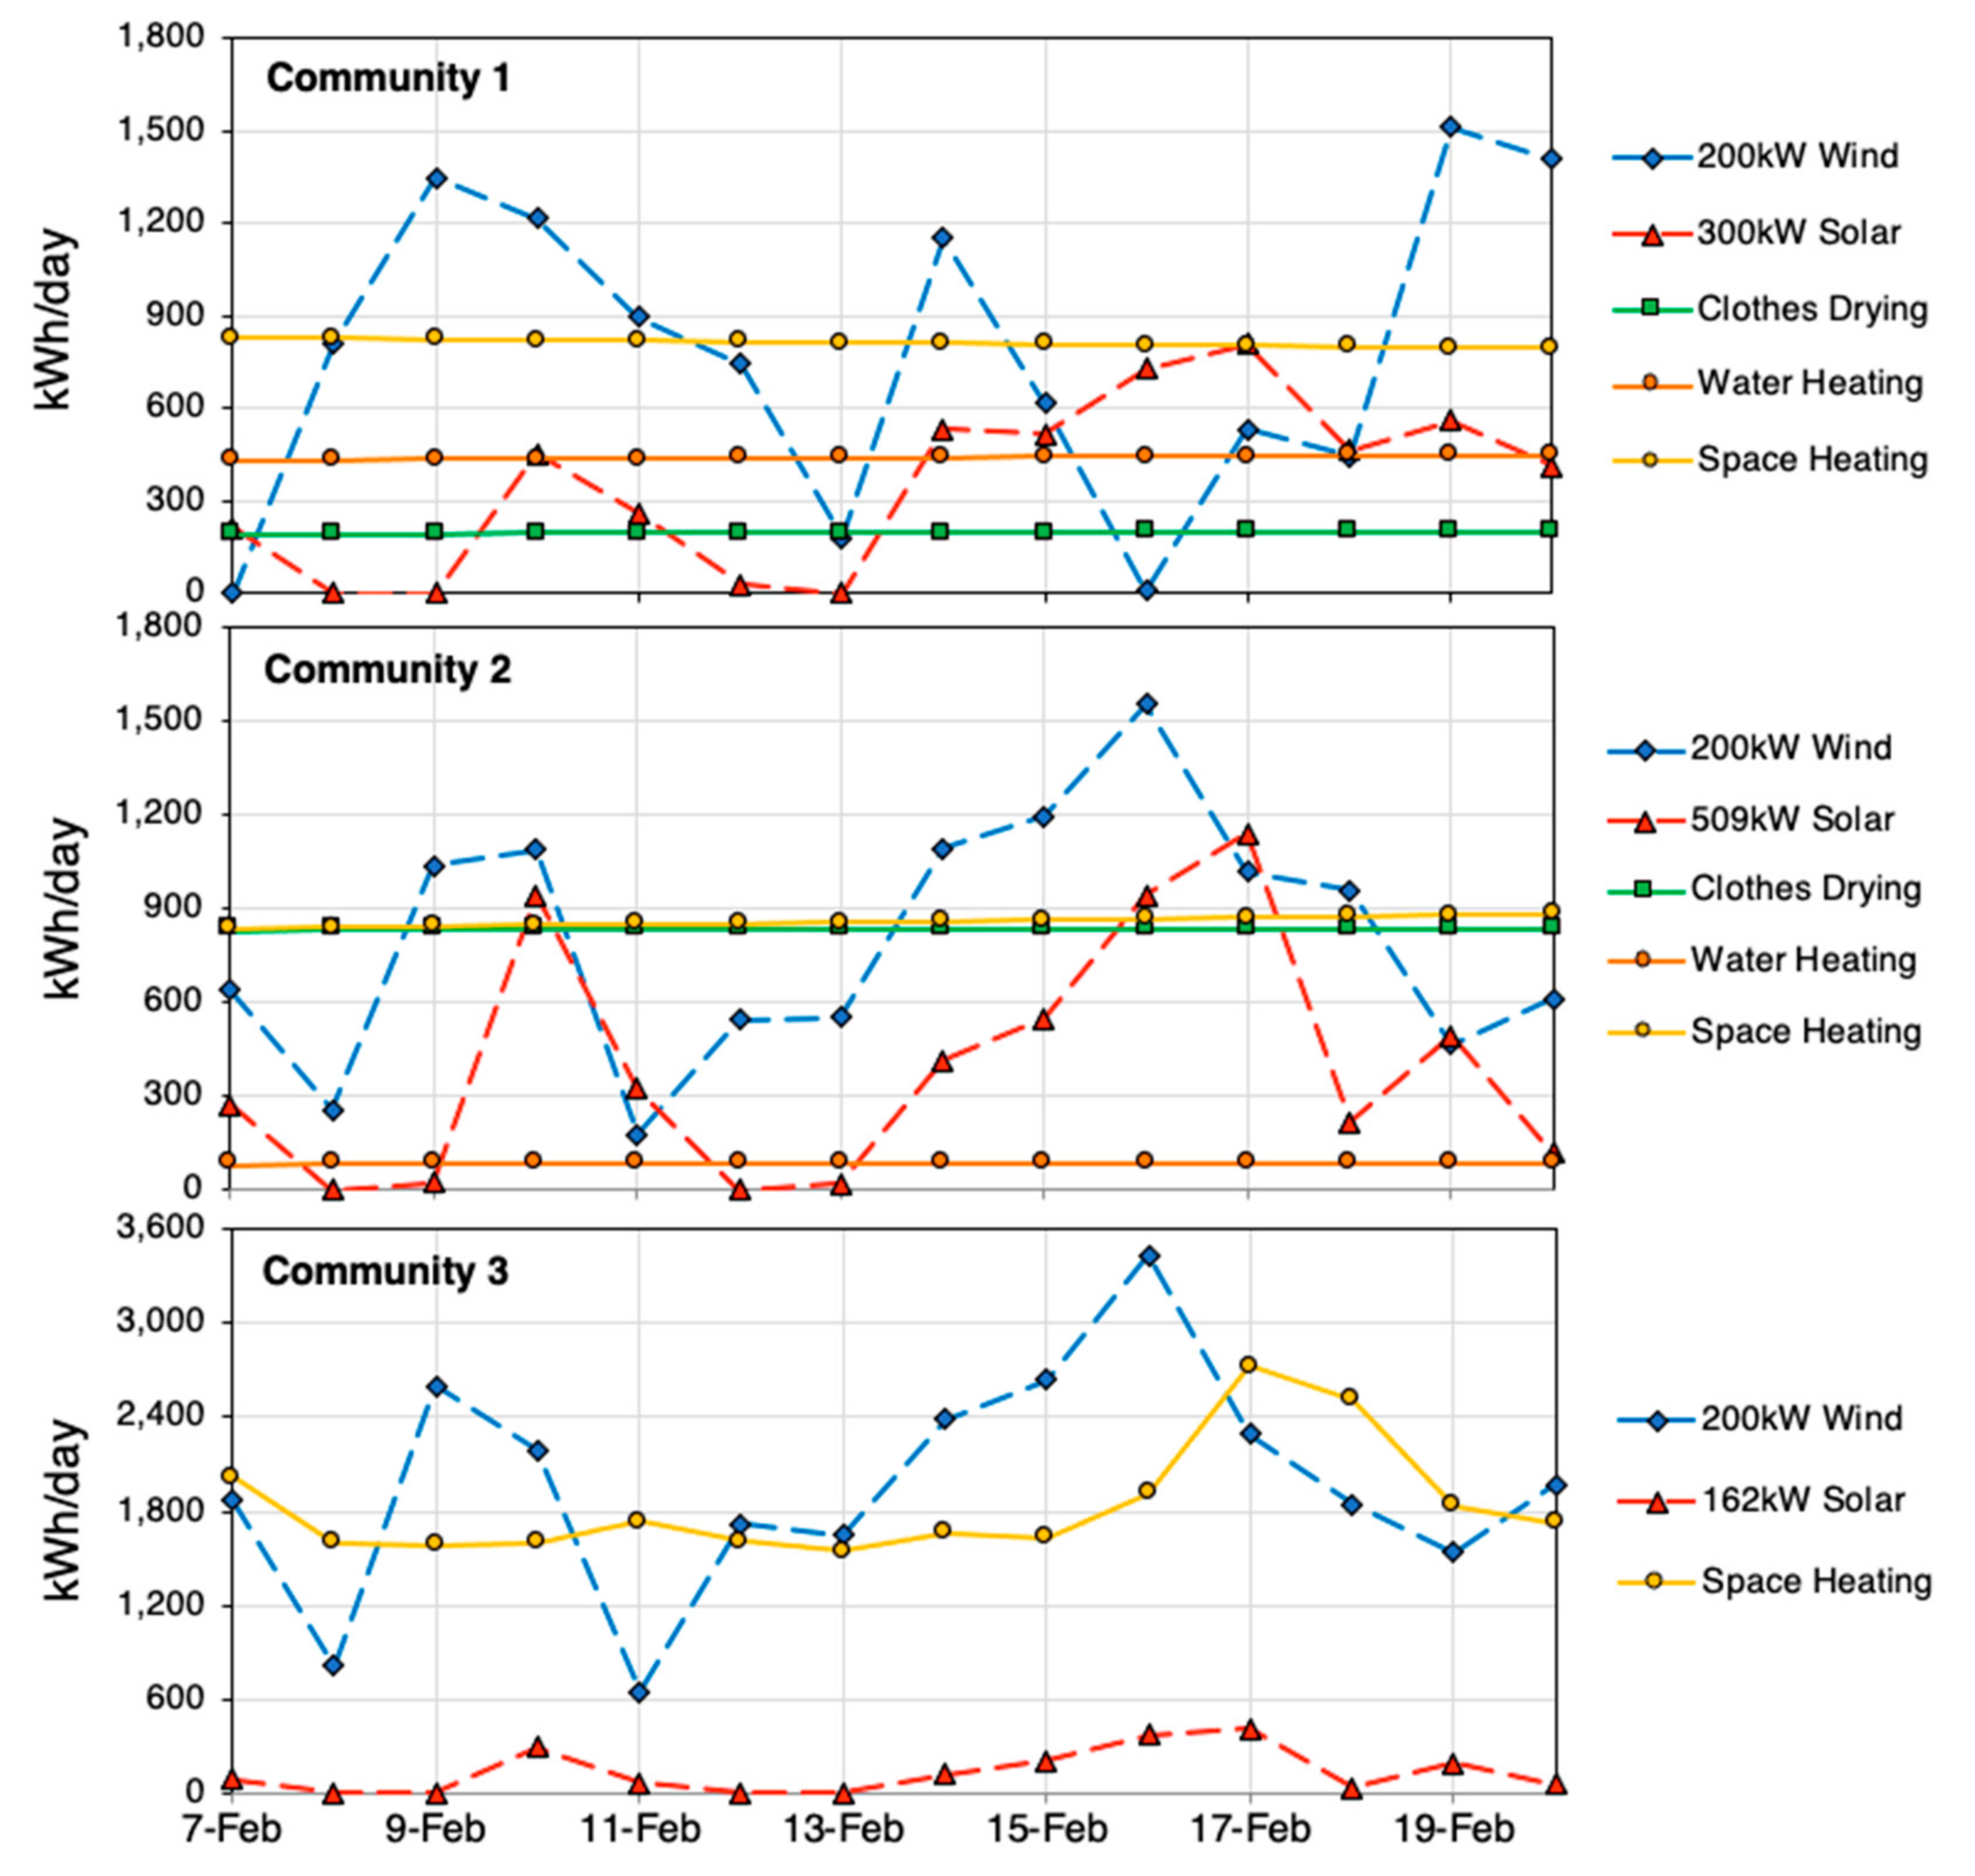
Table 2 at monthly resolution, and Figure 2 shows the plots of two weeks of the same generation and loads at daily resolution (the same resolution used in the NRMSE calculation). Although the NRMSE calculation was performed at daily resolution, the plot at monthly scale in Figure 1 allows for better visualization of the annual pattern of agreement among profiles. For instance, it is apparent from Figure 1 that monthly space heating loads, which are higher in the colder months, are generally shaped like the excess generation for wind curves, and opposite to the shape of excess solar generation curves, which are highest in the summer. However, Figure 2 shows that at daily resolution, the high variability of wind and solar ensure that either resource could be adequate for a heating load one day and not the next. While the excess generation of the resource may be more likely to be adequate day-to-day in certain months, days of low wind or solar resource happen throughout the year. The two-week period chosen for Figure 2 illustrates many of the variations of this behavior.
The results of Table 1 and Figure 1 are consistent in indicating that wind is a better fit to the heat loads than solar, especially for space heating. The space heating profile was nearly opposite of the solar generation profile, while the wind profile was typically closer to the same shape. The results were influenced by both the general shape (e.g., both high in winter and low in summer) and magnitude. Even if the shapes match, if the heat load chosen is much smaller than the excess generation curve, the fit could be as numerically bad as a shape-mismatched profile. Given the different wind resources, loads, and building types studied in each of the communities, it is likely coincidental that 200 kW of installed wind gave the best matches with a thermal load in each community, although it is probably a general result for Alaska that wind is a better match to the winter-peaking and constant thermal loads analyzed here. Communities 2 and 3 both had flatter annual wind curves at monthly resolution than Community 1, which had very low summer production. These flatter wind curves are a better fit to the reasonably constant monthly heating load for domestic water and clothes drying.
Although caution should be used in transferring results between locations, high penetrations of wind (88% or more by capacity of the community’s average load) generally are the best match with heat loads in the communities, and among the loads studied. The investigated heat loads were all either reasonably constant throughout the year, or strongly peaked in the winter. Excess wind generation profiles varied in the communities, often peaking in spring or early summer, but in all cases also maintained appreciable winter capacity at monthly resolution. Solar, however, always had a spring and summer peak with virtually no mid-winter production, as expected. Other heat loads can be imagined that might prove better matches with the solar generation, such as absorption chilling for cooling purposes. Although summer temperatures in Alaska are not yet high enough to warrant air-conditioning in most buildings in most communities in Alaska (large commercial buildings in urban areas being the main counterexample), summer fish processing and other food preservation activities are a summer cooling load, which has been quantified in prior work [15] and can be investigated in future work.
All of the communities in this study had a winter peaking electric load. However, a community that had a strong summer peaking load (such as from the summer fish processing industry) would have a very different excess electricity profile with less excess electricity available in the summer and more in the winter, and this could lead to very different beneficial matches.

4. Discussion

In this analysis, we did not determine the economic or engineering feasibility of renewable energy integration but instead sought to find thermal loads that are temporally aligned with excess power production. This method can be used as a starting point for deciding which communities and which renewable energy sources may be good matches for using heating as a dispatchable load. The results from this work can inform economic and technical feasibility studies that should be undertaken before moving forward with an actual installation. More extensive field data collection for refinement and verification, as well as full economic and engineering feasibility studies would be needed to evaluate possible implementation. There is a cost to overbuilding renewable generation and having ‘wasted’ energy, just as there is a cost to having to supplement heating provided by excess electricity from this generation with oil or biomass heating. We did not investigate those costs here; however, the method presented in this paper allows for a rapid assessment of many combinations of renewable generation and heat loads, finding the best combinations to study in more depth.
The lack of instrumentation and high-resolution heat data is a limiting factor in this work and many other studies in Alaska. Modeled heat demands were used as alternatives. However, measured heat loads that corresponded temporally to a measured wind and solar resource data would add much to this approach. Renewable resource data would ideally be high-quality ground-based data; however, in lieu, satellite data with adequate temporal and spatial resolution at northern latitudes can be used. The appropriate timescale for this analysis depends on the amount of thermal storage available with any heat load. For some applications, hourly data may be preferable to the daily resolution used here. Additional community data, especially from existing wind to heat systems, would also allow validation of this method.
Although not investigated in this paper, this NRMSE method can be used with composite resources and/or loads; e.g., a combination of wind and solar could be compared to a heat load that includes all water treatment plant heating for water, space, and clothes drying, instead of the single components. This is likely to lead to even better matches than those found. One question of interest for many applications of variable renewable energy is whether the wind and solar resource in a location may be generally complementary, i.e., more wind power is available when less solar power is available and vice versa. Figure 1 shows that seasonally, this is broadly true. On a daily scale, Figure 2 seems to indicate that the daily peaks and valleys in solar and wind resources happen at approximately the same time; however, this is based on HOMER resource data and not an actual year of simultaneous data collected in the communities. Local wind and solar data collected simultaneously would need to be used to determine complementariness of the wind and solar resources for a community.
This paper focused on electric resistance heat. However, if a heat pump were to be utilized instead of electric resistance heating, that would change the heat load curve used in the match by the temperature-dependent coefficient of performance at any point in time. Generally, less electricity would be needed during warmer parts of the heating season to meet the heat load. Due to the near instantaneous dispatchability of electric resistance heat, we have not considered this in the present analysis, but if heat pumps are found to be suitably dispatchable, the analysis may be carried out with an added temperature-dependent coefficient of performance to investigate a thermal load met by an electric heat pump.

5. Conclusions

We developed a method to determine whether a community has a good match between an excess renewable energy resource and a heat load. HOMER models were developed for three test case communities of varying populations and climatic conditions to simulate current and possible renewable energy generation. NRMSE values were calculated to compare the excess electricity in a community from renewable energy generation and heat loads such as space or water heating. The lowest NRMSE values indicated possible beneficial matches that may significantly reduce the demand for fossil fuel-based heat generation. Of 236 possible combinations investigated in three communities, the best matches were seen between excess electricity from high-penetration wind generation and heat loads for clothes drying and space heating. The worst (highest) NRMSE values from this study were from low penetrations of solar (25% of peak load) with the heat loads studied.

Author Contributions

Conceptualization, G.B., M.W., E.W. and D.H.; methodology, G.B. and M.W.; validation, G.B. and M.W.; formal analysis, G.B. and M.W.; investigation, G.B. and M.W.; writing—original draft preparation, G.B., M.W., D.H. and D.J.S.; writing—review and editing, M.W., D.H., D.J.S., S.A. and E.W.; visualization, S.A.; supervision, M.W., D.H. and E.W. All authors have read and agreed to the published version of the manuscript.

Funding

This material is based upon work supported by the National Science Foundation under Grant No. 1740075.

Institutional Review Board Statement

Not applicable.

Informed Consent Statement

Not applicable.

Data Availability Statement

Not applicable.

Acknowledgments

The authors would like to acknowledge Richard W. Wies and the support of the MicroFEWs group.

Conflicts of Interest

The authors declare no conflict of interest.

References

  1. Holdmann, G.P.; Wies, R.W.; Vandermeer, J.B. Renewable Energy Integration in Alaska’s Remote Islanded Microgrids: Economic Drivers, Technical Strategies, Technological Niche Development, and Policy Implications. Proc. IEEE 2019, 107, 1820–1837. [Google Scholar] [CrossRef]
  2. Alaska State Energy Profile Analysis, U.S. Energy Information Administration (EIA). Available online: https://www.eia.gov/state/analysis.php?sid=AK (accessed on 9 May 2021).
  3. WINDExchange: Alaska 80-Meter Wind Resource Map, Office of Energy Efficiency and Renewable Energy. Available online: https://windexchange.energy.gov/maps-data/1 (accessed on 1 December 2020).
  4. REAP Renewable Energy Atlas, Renewable Energy Alaska Project. Available online: https://alaskarenewableenergy.org/library/renewable-energy-atlas/ (accessed on 1 December 2020).
  5. RE Atlas, National Renewable Energy Laboratory. Available online: https://maps.nrel.gov/re-atlas/ (accessed on 9 May 2021).
  6. Sunrise and Sunset Times in Utqiaġvik, Time and Date. Available online: https://www.timeanddate.com/sun/usa/utqiagvik?month=11 (accessed on 1 June 2021).
  7. Alaska Center for Energy and Power (ACEP). Available online: https://acep.uaf.edu/ (accessed on 1 December 2021).
  8. Jacobson, M.Z. On the Correlation between Building Heat Demand and Wind Energy Supply and How It Helps to Avoid Blackouts. Smart Energy 2021, 1, 100009. [Google Scholar] [CrossRef]
  9. Beyer, H.G.; Niclasen, B.A. Assessment of the option “wind power to heat for buildings” with respect to meteorological conditions. Meteorol. Z. 2019, 28, 79–85. [Google Scholar] [CrossRef]
  10. Das, B.K.; Hasan, M. Optimal Sizing of a Stand-Alone Hybrid System for Electric and Thermal Loads Using Excess Energy and Waste Heat. Energy 2021, 214, 119036. [Google Scholar] [CrossRef]
  11. Kahwash, F.; Maheri, A.; Mahkamov, K. Integration and Optimisation of High-Penetration Hybrid Renewable Energy Systems for Fulfilling Electrical and Thermal Demand for off-Grid Communities. Energy Conv. Manag. 2021, 236, 114035. [Google Scholar] [CrossRef]
  12. Pourmousavi, S.A.; Patrick, S.N.; Nehrir, M.H. Real-Time Demand Response through Aggregate Electric Water Heaters for Load Shifting and Balancing Wind Generation. IEEE Trans. Smart Grid 2014, 5, 769–778. [Google Scholar] [CrossRef]
  13. Whitney, E.; Schnabel, W.E.; Aggarwal, S.; Huang, D.; Wies, R.W.; Karenzi, J.; Huntington, H.P.; Schmidt, J.I.; Dotson, A.D. MicroFEWs: A Food–Energy–Water Systems Approach to Renewable Energy Decisions in Islanded Microgrid Communities in Rural Alaska. Environ. Eng. Sci. 2019, 36, 843–849. [Google Scholar] [CrossRef] [PubMed] [Green Version]
  14. Sambor, D.; Wilber, M.; Whitney, E.; Jacobson, M. Development of a Tool for Optimizing Solar and Battery Storage for Container Farming in a Remote Arctic Microgrid. Energies 2020, 13, 5143. [Google Scholar] [CrossRef]
  15. Chamberlin, M.J.; Sambor, D.J.; Karenzi, J.; Wies, R.; Whitney, E. Energy Distribution Modeling for Assessment and Optimal Distribution of Sustainable Energy for On-Grid Food, Energy, and Water Systems in Remote Microgrids. Sustainability 2021, 13, 9511. [Google Scholar] [CrossRef]
  16. Sambor, D.J.; Bishop, S.C.M.; Dotson, A.; Aggarwal, S.; Jacobson, M.Z. Optimizing Demand Response of a Modular Water Reuse System in a Remote Arctic Microgrid. J. Clean. Prod. 2022, 346, 131110. [Google Scholar] [CrossRef]
  17. Her, C.; Sambor, D.J.; Whitney, E.; Wies, R. Novel Wind Resource Assessment and Demand Flexibility Analysis for Community Resilience: A Remote Microgrid Case Study. Renew. Energy 2021, 179, 1472–1486. [Google Scholar] [CrossRef]
  18. Meiners, D. Chaninik Wind Group Wind Heat Smart Grids Final Report; Chaninik Wind Group: Anchorage, AK, USA, 2013. [Google Scholar]
  19. HOMER—Hybrid Renewable and Distributed Generation System Design Software. Available online: https://www.homerenergy.com/ (accessed on 1 February 2020).
  20. Baneshi, M.; Hadianfard, F. Techno-economic feasibility of hybrid diesel/PV/wind/battery electricity generation systems for non-residential large electricity consumers under southern Iran climate conditions. Energy Convers. Manag. 2016, 127, 233–244. [Google Scholar] [CrossRef]
  21. NASA POWER: Prediction of Worldwide Energy Resources. Available online: https://power.larc.nasa.gov/ (accessed on 2 February 2021).
  22. NSRDB Data Viewer, National Renewable Energy Laboratory. Available online: https://maps.nrel.gov/nsrdb-viewer/ (accessed on 9 May 2021).
  23. Armstrong, R.S.; Armstrong, C.R.S. White Paper on Energy Use in Alaska’s Public Facilities; Alaska Housing Finance Corporation: Anchorage, AK, USA, 2012. [Google Scholar]
  24. Alaska Affordable Energy Model. Alaska Energy Data Gateway. Available online: https://akenergygateway.alaska.edu/ (accessed on 10 January 2020).
Figure 1. The monthly cumulative excess generation profiles for wind and solar generation in each community. The average monthly heat loads for space heating, domestic water, and clothes drying were included, where available. The monthly totals corresponding to the daily NRMSE values for the matches are presented in Table 2.
Sustainability 14 03884 g001
Figure 2. The daily cumulative excess generation profiles for wind and solar generation in each community. The interpolated daily heat loads for space heating, domestic water, and clothes drying were included, where available, for two weeks in February. The displayed profiles correspond to the results presented in Table 2.
Sustainability 14 03884 g002
Table 1. Profiles of each partner community.
CommunityPopulationPeak Electric Load (kW)Annual HDD (Base 65 °F)LatitudeClimateRenewable ResourcePredominant Heat Load(s)Other
Comments
120013314,77765.2°Continental Subarctic (dry; warm summers, cold winters)Biomass Solar under investigationCommunity buildings, domestic hot waterBiomass is used for heat only, behind the meter
240022612,947 60.0°Maritime Subarctic (cold and windy)WindCommunity buildings, washeteriaMost people do not have piped water, so washeteria load is important
37012011,03159.3°TransitionalHydrokinetic, solarCommunity buildings,
domestic hot water, greenhouse
High-end tourism
Table 2. Normalized RMSE values for a subset of generation and load combinations in the three communities, including some of the best matches for each community. Low NRMSE values indicate beneficial matches and high NRMSE values represent less or non-beneficial matches.
CommunityGeneration Capacity Addition% of Peak Community LoadSpace Heating (NRMSE)Domestic Water (NRMSE)Washeteria Clothes Drying (NRMSE)
1200 kW Wind150%1.01.11.3
300 kW Solar225%1.41.11.2
2200 kW Wind88%0.81.10.6
509 kW Solar225%1.51.41.3
3200 kW Wind278%0.6--
162 kW Solar162%11.2--
Publisher’s Note: MDPI stays neutral with regard to jurisdictional claims in published maps and institutional affiliations.

