1. Introduction
A significant amount of research focused on increasing energy efficiency and reducing energy costs in the manufacturing industry. Several studies focused on energy efficiency, and analysis models have been developed to optimize total energy use. A typical analysis model is a machine learning approach that requires training data to predict the power profile, which is based on the correlation of the power profile with the operating conditions. A smart factory solution is established, and power meters are equipped with machine controllers to increase the availability of data collection. However, the collected data set shows only the power profile without relation to other factors and is not well-structured to be applied to machine learning models. Hence, classification methods for the energy use of each machine or of each operation are still conducted manually to date.
The energy data set is collected for data analysis and exhibits a different structure from other data sets acquired for other purposes. Energy management studies have started to estimate the overall energy consumption of a factory line. An energy management system is a specialized information system of an energy-intensive industry, and it can be defined as the energy management model of the entire production line at a primitive level [
1]. Carlos attempted to separate the energy model into factors, line, and machinery [
2]. Haruhiko and Tetsuo proposed an energy processing profile related to toolpath, feed rate, and spindle speed for machine tools [
3]. Duflou et al. suggested an approach to classify energy types via distinguishing them in unit processes [
4]. Specifically, various artificial intelligence algorithms, such as profile regression or classification, have been applied to single machine tool processes [
5]. Among the regression models, time-series energy data were recommended to attempt energy regression over a recurrent neural network [
6]. Given that different energy models were developed, various data sets are required for deep learning models.
Hence, pre-processing of a customized data set involves a series of manual operations, including classifying the processing mode, labeling operation conditions, and storing them in a time-series order. However, this pre-processing is time-consuming. Moreover, although the data set is successfully collected, the challenges in data pre-processing involve synchronizing delayed signals and compressing a large amount of sensor data. In the case of an old machine, another challenge corresponds to limited access to controller data except for a user display monitor. Hence, a structured and common pre-processing of energy data collection is required.
The motivation for this study is to construct a common data pipeline for power analysis, such that the power of various production machines can be predicted under different operating conditions. This requires the development of classification algorithms that distinguish each power profile as well as estimation algorithms that generate possible power profiles of alternative programs of machine controllers. Herein, we define a structured pipeline to integrate sensor data with a controller program via deep learning classification and regression to obtain data-driven operation, auto-labeling, and profile generation, which are necessary for energy optimization.
This paper presents a method to automate the data set construction for predicting unit-process power from time-series profile data coming from multiple sensors. Specifically, the proposed method aims to produce three models: a deep learning model that automatically identifies the type of each unit-process and splits the whole profile into unit data; a compression model that reduces the size of time-series data from multiple sensors with deep learning; and a power prediction model that generates an expected power profile along with the sequence of unit-processes. The proposed method enables the construction of a reverse engineering pipeline through the mapping of numerical power data with their corresponding unit-process types in the on-line phase, and the inference of power profiles along with the manufacturing operations assigned in the execution phase for energy prediction and optimization in the planning phase.
The paper is organized as follows:
Section 2 introduces the existing research on power analysis and prediction, looking at current trends and critical issues.
Section 3 describes the steps of data pipeline, including pre-processing, data filtering, operation classification, and profile regression.
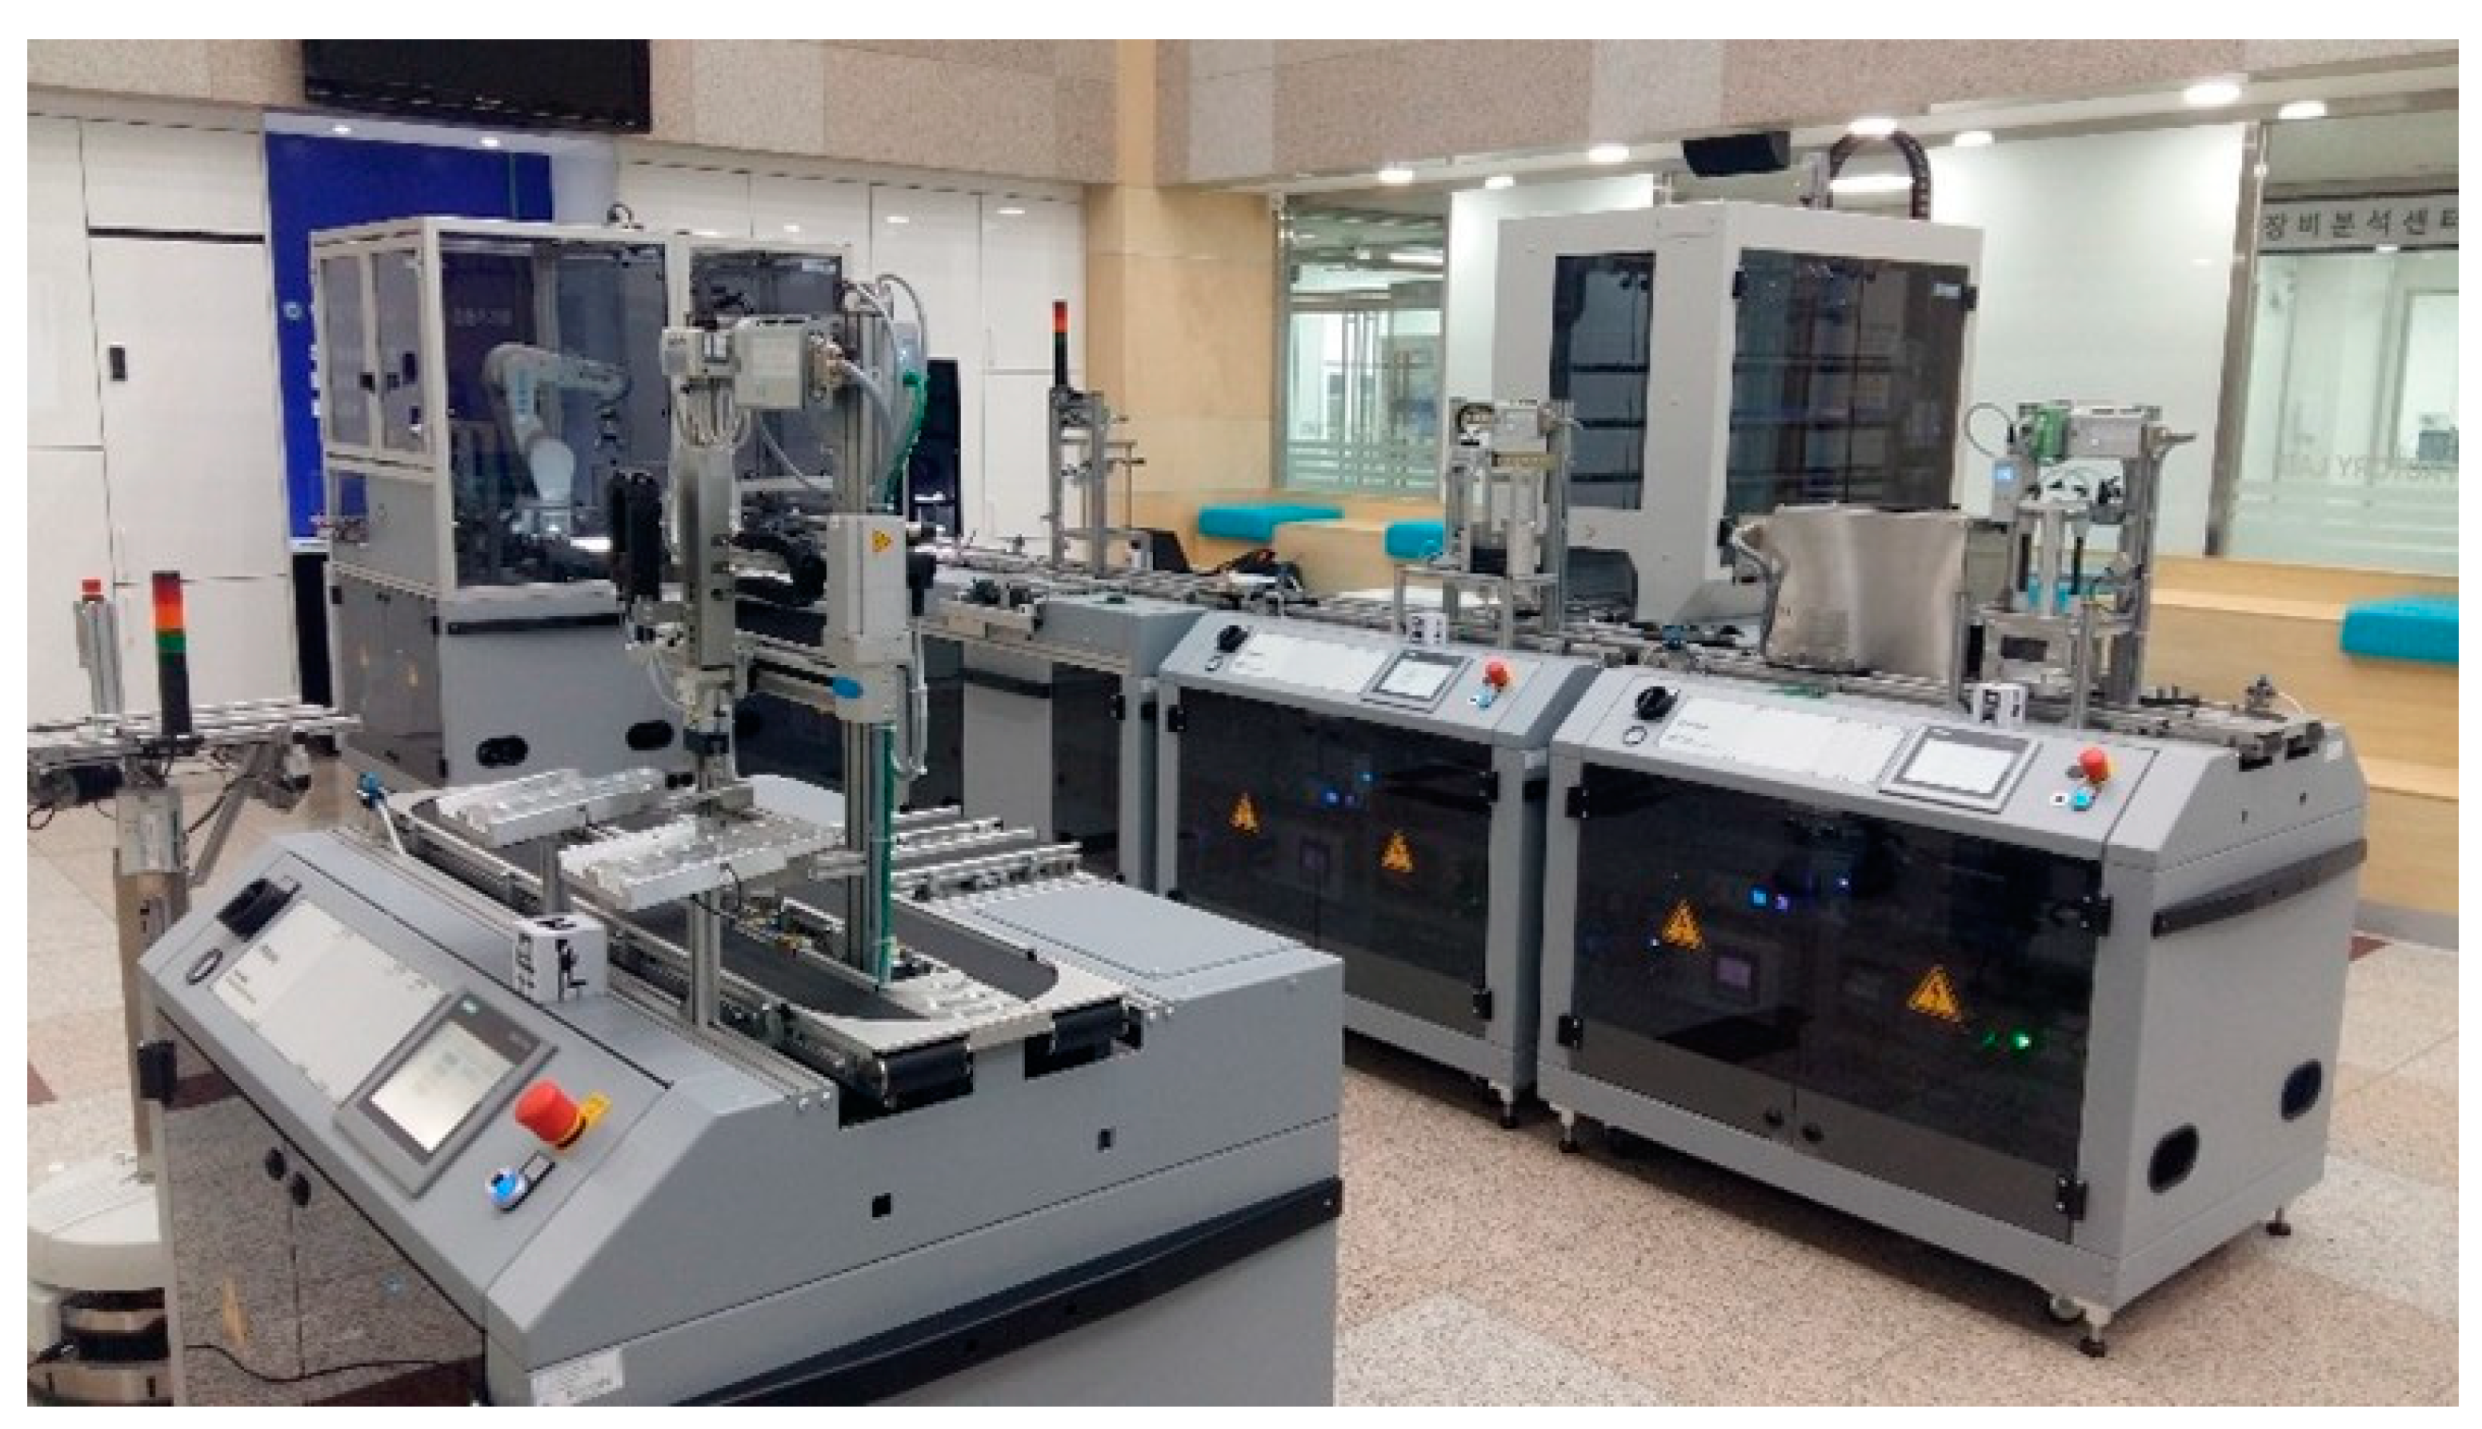
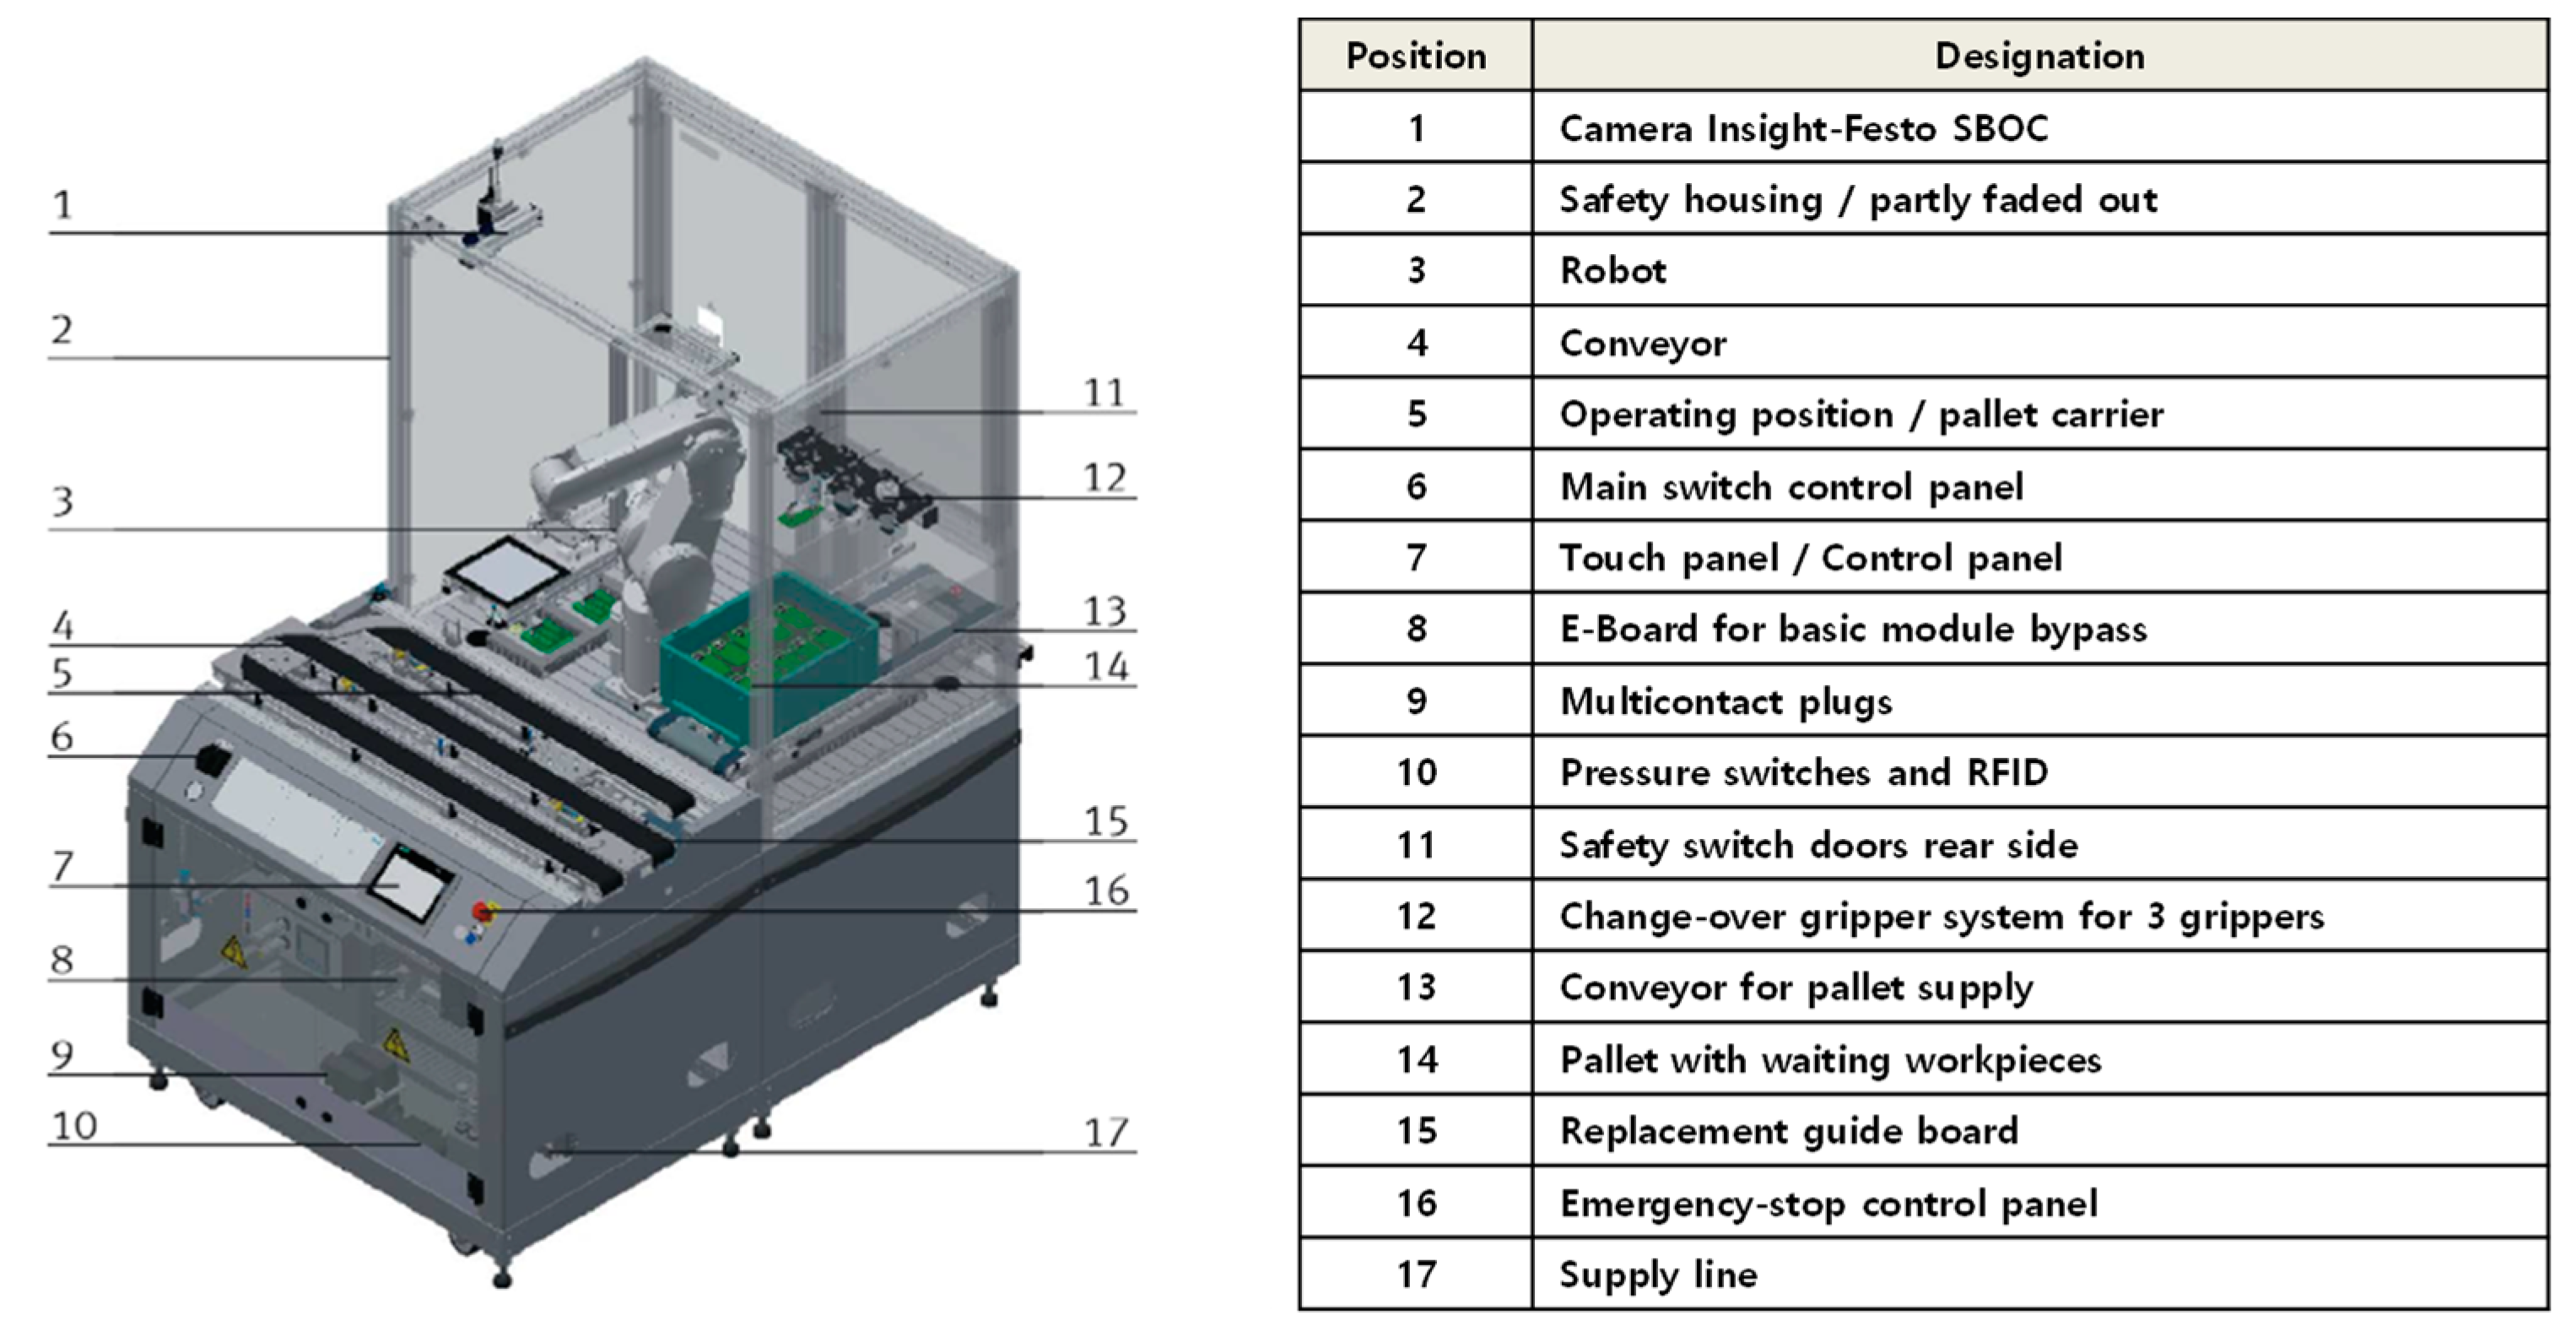
Section 4 explains an experimental case study using a modular cyber-physical factory to verify the feasibility of the proposed method.
Section 5 discusses the experimental results, and
Section 6 concludes the remarks.
2. Literature Survey
In this section, we discuss relevant studies on collection methods and an analysis model of energy use using a data pipeline framework. The concept of data analysis for energy consumption was established via application of energy-intensive industries [
7]. Lee et al. developed a prototype system for data analysis and proposed a cyber-physical system based on the fundamental framework of a five-component pyramid [
8]. This prototype is composed of steps circulated from data collection, analysis, storage, and learning. ‘Data collection’ and ‘storage’ include issues on what information is necessary while ‘data analysis’ and ‘learning’ include topics on how to process the information. Among the components, in this section, we review energy data collection and power analysis.
2.1. Energy Collection
Data collection methods for energy use were developed from static data sets to dynamic data sets and generated data sets. Previous methods that were used to evaluate environmental impact utilize the life cycle inventory, which stores all impact factors of all processes captured in standardized static conditions. The emerging Internet of Things (IoT) accelerated the development of innovative methods to capture energy monitoring. Specifically, IoT sensors allow observations of time-series profiles using power meters. Subsequently, unit-block decomposition of the time-series power profile was proposed to detect correlation with machine process parameters. Recently, neural network methods have been improved; thus, data-driven methods, such as machine learning and virtual sensors, have been applied to power analysis.
2.1.1. Life Cycle Inventory
The production system is a crucial process that results in a high rate of energy consumption in the life cycle of typical manufactured products. Life cycle assessment shows that manufacturing processes typically significantly impact the entire life cycle. However, the process plan is too complicated to be represented by a simple data set of the life cycle inventory. Specifically, modular factories producing discrete products exhibit many rapid power peaks that are not represented in the static power model used in the life cycle inventory. Hence, power models based on different aspects were proposed. In terms of discrete part manufacturing, CO2PE (cooperative effort on process emissions in manufacturing) was developed as a methodology for systemic analysis of manufacturing unit process life cycle inventory [
9].
2.1.2. Unit Block to Discretize the Whole Power Profile
There exist approaches to representing energy consumption that use a data model of unit blocks. The data model is used for storing and analyzing the collected data. A method of analyzing complicated changes during the manufacturing process involves separating the energy use profile into unit processes. Duflou et al. proposed an approach to discretize the power profile into unit blocks [
9]. The unit block approach is useful for determining the correlation between energy use and machine parameters. This was also used to evaluate the laser cutting process, re-program industrial robot cells, and observe the process characteristics of wired welding in terms of energy consumption.
2.1.3. Application of Artificial Intelligence and Virtual Sensor
Since 2019, artificial intelligence has been applied to power analysis as the prediction model of energy consumption particularly. Although the power measurement device provides real-time data collection, the limitation of process technology and measurement technology is a barrier to capturing the correlation between critical process parameters and energy consumption [
10]. Hence, machine learning corresponds to an alternative for estimating energy use, which occurs in a given time or place wherein it is difficult for a measurement device to capture the energy consumption. Additionally, specific models of machine learning are defined as ’virtual sensors’, capturing unknown energy use where any sensor is not attached. Physical models and data-driven models enable virtual sensors to estimate power profiles such as physical sensors.
2.2. Energy Use Analysis
Previous models of energy use analysis of manufacturing resources and specifically for simple operations were proposed in different aspects. Subsequently, some methods and strategies for deriving high-quality and high-level information of power data, which is a key input for the calculation of energy consumption, are introduced from the perspective of power use analysis. However, the mixed signals observed by power meters contain power used by the external system, which is outside the analysis domain. Thus, refinement of complex power profiles improves the accuracy of energy use analysis.
2.2.1. Data Quality
Data quality is an issue that should be addressed in data analysis to increase the reliability of the results. For example, late time records of event analysis can lead to unexpected gaps with other sensor data and lower the accuracy of data analysis. Woodall et al. proposed a list of critical information to improve the data quality [
11]. ISO 8000-61 is termed as DAQUA-MASS and it standardized the data quality management methodology for sensor data [
12,
13]. The tagging of data causes potential problems, and ISO 8000-61 was proposed as a method to address the inaccuracy of the information system. These methods involve fundamental data processes such as noise detection or sensor activation, and missing data or diversity of data representation [
14].
2.2.2. High-Level Information
Beyond the issue of data quality, the context of manufacturing operations is a critical factor to evaluate changes in energy use. High-level information on energy use is the context that involves process recipes, the machine status, process parameters, the status of work-in-process, and ambient conditions. Specifically, the controller program of each manufacturing facility significantly affects energy consumption, although the change can be predicted by evaluating machine programs written in vendor-specific languages.
To overcome the vendor-specific process, standardization of energy use supports the normalization of power data. A standardized data model is required to compare and optimize the process plan in terms of energy use. The process plan directly affects the energy use of the production system. A process plan is different for each factory and product. The energy use also varies with changes in the process plan, although the manufacturing facility is identical to that of the previous process plan. The International Standard Organization organized a committee to establish guidelines to compare energy consumption between different manufacturing systems. Specifically, ISO 50001 provides the overall procedure of a closed loop to improve energy efficiency through a series of organizational activities [
15]. The data quality of data analysis is discussed by ISO 8000-61, which provides guidelines to improve data collection for energy use analysis [
12]. ISO 14955 summarizes the key performance indicators that are important to verify the overall energy efficiency of the production line [
16]. In terms of the micro process used for individual machine tools, ISO 14649 part 201 defines the standard power model of the unit process that occurs in the milling and turning process [
17].
In a manner similar to ISO 14649-201, the relationship between the machine process and power sensor provides evidence to estimate the power profile [
17]. Um et al. developed a method to integrate process data and machine specifications [
18]. The deep learning approach is proposed as a means to recognize the hidden correlations of multi-sensor data and process parameters. Blume et al. demonstrated the application of deep learning and machine learning to estimate the energy use of cooling towers [
19]. Recent studies indicated the identification of each operation and unnecessary signal.
2.3. Summary and Opportunities
The following conclusions were obtained from the literature review:
Complex behaviors observed in multi-functional facilities, such as machining centers, require multiple data sets of individual functions.
Automatic identification of the unit process in the entire power profile is required.
Signal screening algorithm against the energy use of external systems is still a challenge.
The aforementioned observations indicate an opportunity to motivate the energy estimation of automatic labeling and energy simulation for discrete production lines. In addition to a clear need for alternative technological solutions in this area, the pipeline of power prediction will ensure that the new development will provide benefits in the production plan based on energy management.
3. System Architecture of Power Analysis for Modular Factory
3.1. System Architecture
This study proposes a new system architecture of the power analysis for a whole modular factory. The benefits of the proposed architecture led to a structured approach of data collection and analysis. The strength of the system improves data quality to generate high-level information. In addition to data quality, the structured approach allows data analysts to identify where each machine learning algorithm is applied.
The energy-based production planning procedure consists of power monitoring, data integration, profile identification, power modeling, formulation of scheduling model, and optimization [
20]. The challenges addressed in
Section 2 are happening in power monitoring, data integration, profile identification, and scheduling model.
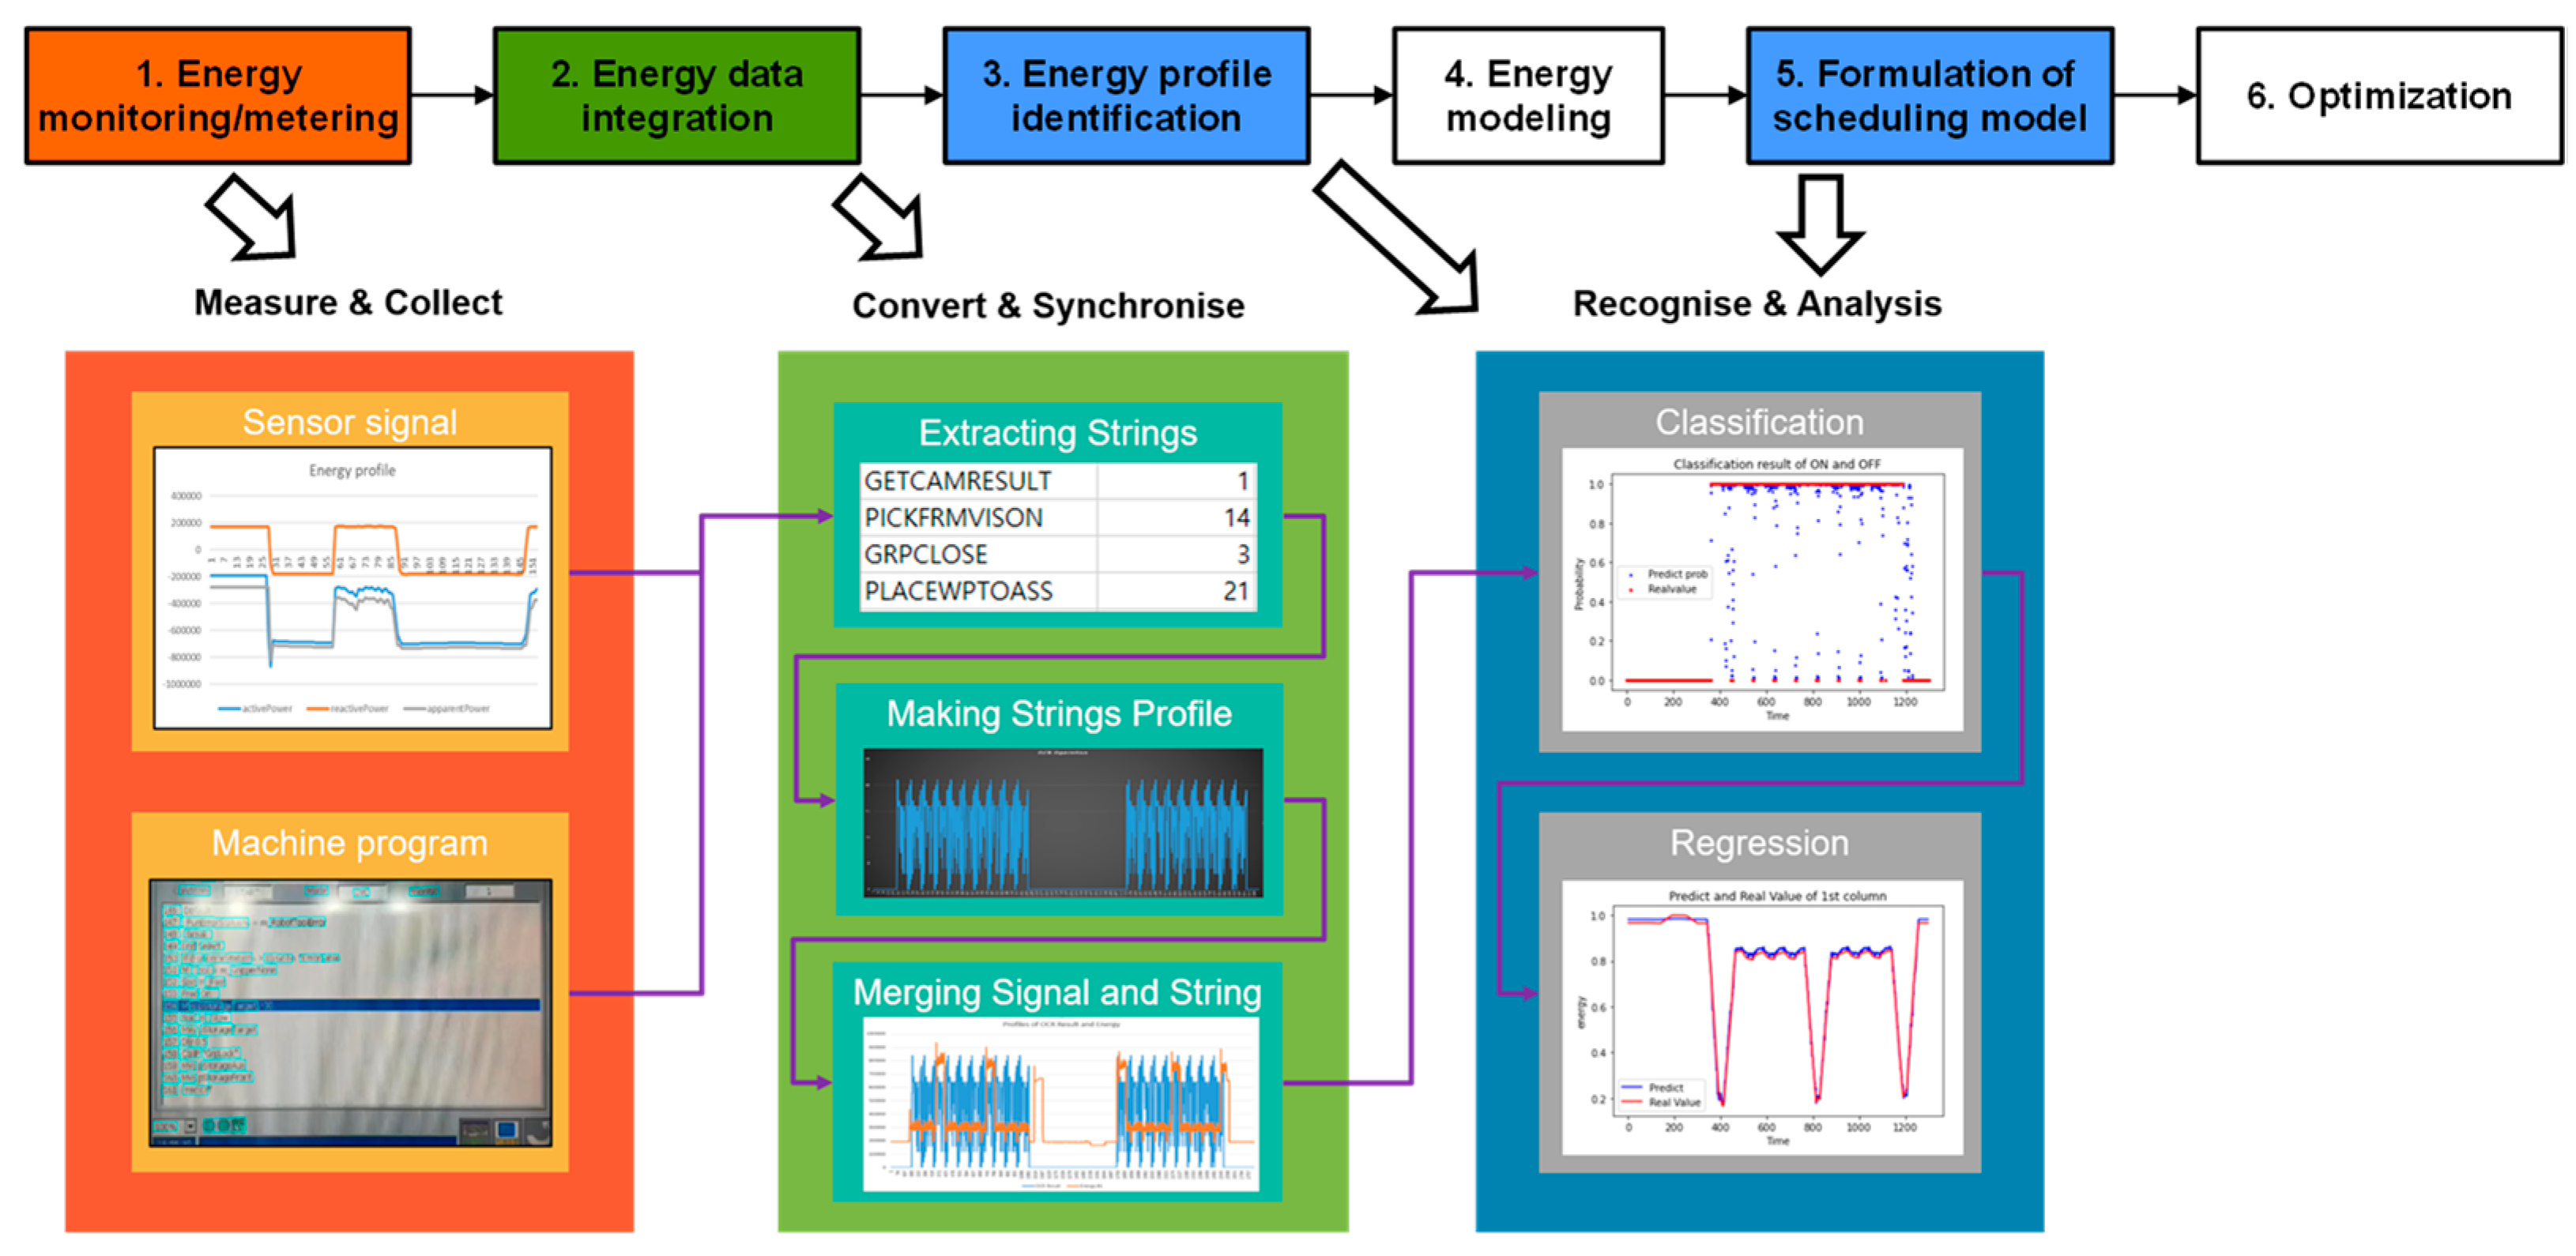
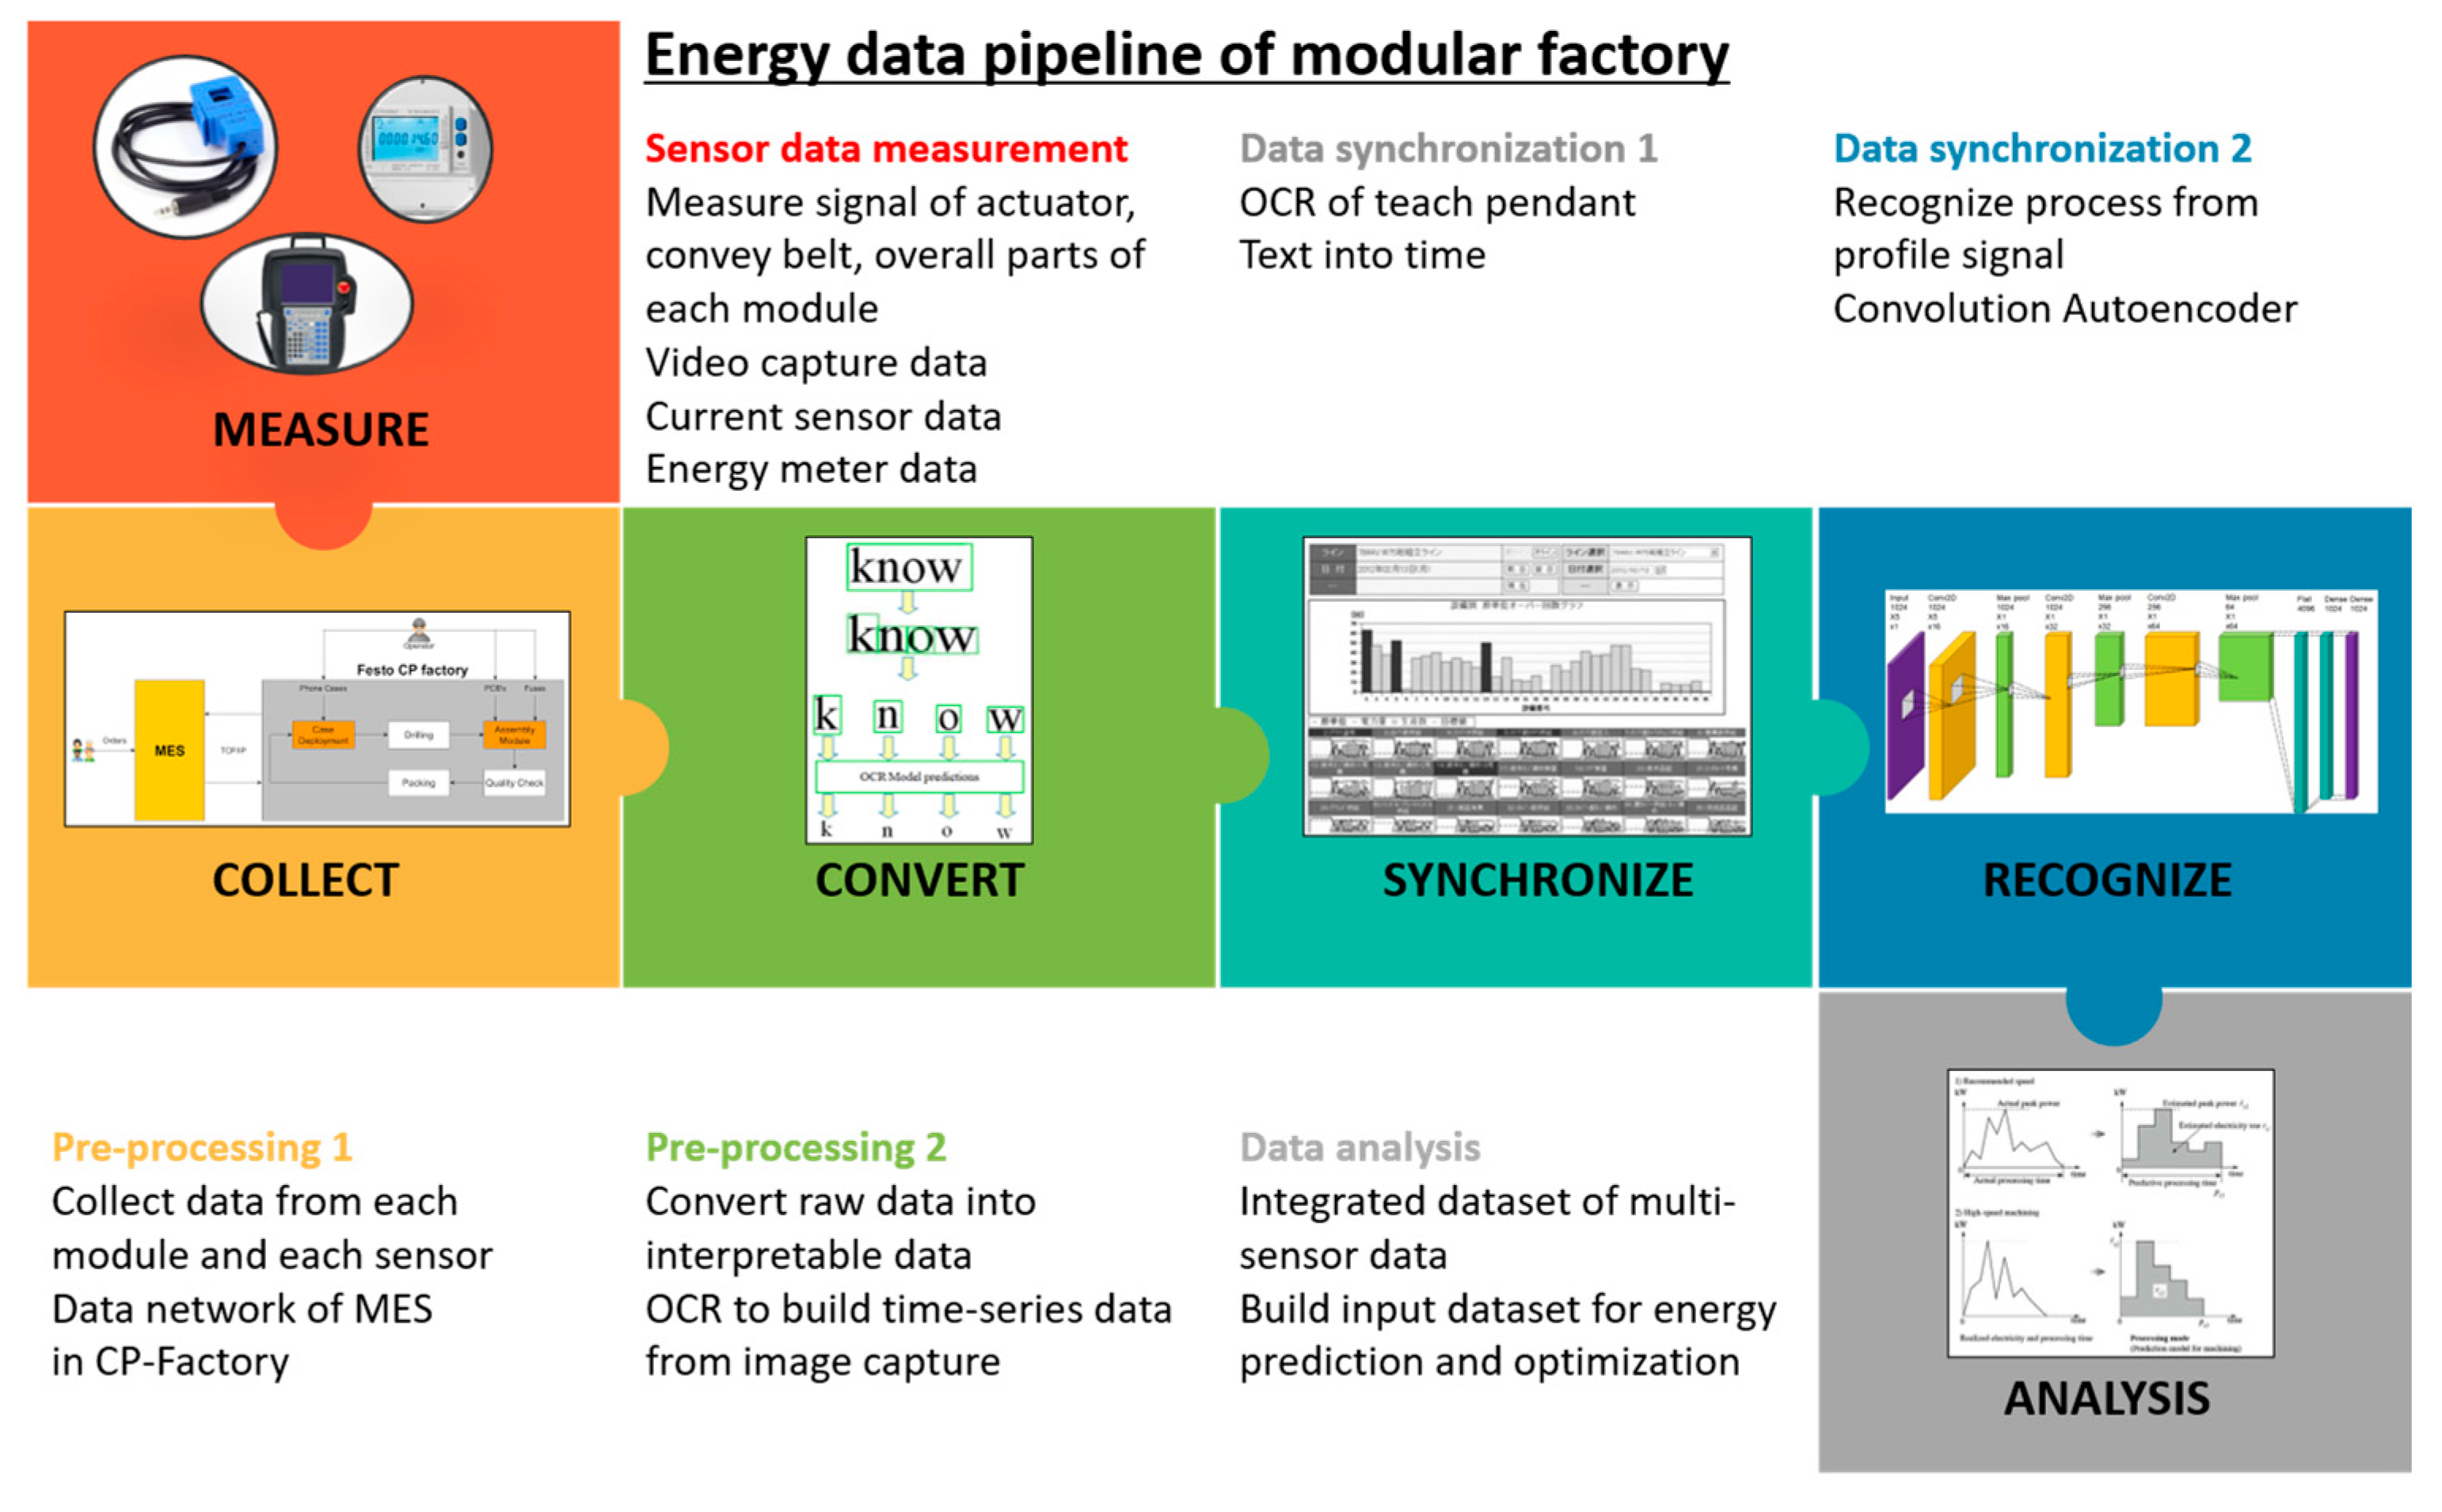
Figure 1 elucidates the proposed architecture. The proposed architecture provides, at first, the acquisition method to connect with the controller interface directly and to collect screen images of the controller as the indirect way. It secondly pre-processes data to merge all data into time-series data by synchronizing data coming from multiple sources. The last process is to recognize and re-produce the power profile by using the deep learning model that is trained with the relationship between power profiles and operation types. Accordingly, the proposed architecture consists of a three-stage model, which entails measurement collection, conversion and synchronization, and recognition analysis.
The first stage corresponds to the measurement collection layer, which allows us to measure physical quantity via sensors and collect operation data that was not previously collected. The physical quantity collected from all sources is measured by sensors and integrated for analysis. Many controllers do not typically provide operational information. Therefore, the layer collects operational data in a round-about manner, such as using optical character recognition (OCR), after obtaining video files or mathematical algorithms to track the operation in reverse.
The second stage is the conversion and synchronization layer. The total power corresponds to the result of the accumulation of many power consumers. Hence, it is necessary to build a digital twin that reflects all the signals and data coming from actual machines in real time. This layer (where the data analysis platform manipulates all the data) manages the digital twin. The digital twin provides completeness to roll back to a certain power profile of a specific time. An additional function involves searching for the moment when a similar power profile occurs.
Finally, recognition and analysis are established to optimize energy consumption. Essentially, this layer is for summarizing the power profiles of several machines. From the data of the conversion and synchronization layer, the layer estimates energy consumption and draws the power profile of what-if scenarios of alternative process plans. Improved resilience against external and internal disturbances is realized via rearranging the production line and modifying the process plan.
3.2. Overall Pipeline of Power Analysis
To resolve the limitation of multi-fusion data collection of the power profile, the resolution of the following issues is necessary:
Collected data are unsynchronized.
Unstructured data, such as video streams, require an additional recognition process.
A modular factory consists of controllers producing discrete profile behaviors.
Comprehensive training using multiple data sources is required simultaneously.
The pipeline of data flow shown in
Figure 2 is designed to resolve issues that occur in the data collection of energy use. The overall procedure follows the layers of the proposed architecture described in
Section 3.1. Machine data are converted to event data by pre-processing and stored in a database. The raw data directly from the machine are not suitable for data analysis. For example, a video stream is not directly used for data analysis and it needs to be converted into time-series event data. Even though data are collected in the database, all the data should be synchronized to derive the correlation with information from multiple sources. After data synchronization is completed, the accumulated data set is utilized to predict the power profile of alternative process plans. A data set of identical operations is used for training the drawing profile. Planning and analysis are utilized to optimize the total energy use by using the prediction model.
3.3. Data Connection
In this section, the procedure is described for each module controller in the database. The first step of the data pipeline corresponds to the start in the individual production module. Specifically, more data are involved in understanding the context relative to the data in simple energy use.
Most data sources of each module correspond to the programmable logic controller (PLC) and its power meter that measures power consumption of each machine. The power meter transmits the measured power into the Open Platform Communications Unified Architecture (OPC-UA) server, which publishes messages with periodical event data. The event describing the operation of a production module arrives in the data flow managed by Node-Red via the MQTT (Message Queuing Telemetry Transport) message broker where the centralized data flow mechanism collects all data into a single power database. In the case of video and sound, their streaming data are handled by a dedicated web server to distribute the load of data processing of unstructured data. In the study, the human–machine interface (HMI) screen of the module controller is used as the data source for operation events. The PLC program also corresponds to the baseline to train the neural network of operation classification and profile regression. The video stream is converted into a test event using OCR processing. The centralized database of the PLC program is used to collect all the data. The individual power consumption of production modules is composed of the total energy use of the production line. A simple summation of energy use is not sufficient to optimize the process plan because the sequence of the production line affects all the motions of each module. Hence, a line topology, which describes the physical connections of all modules, is required. The data structure of the centralized database is detailed in
Section 3.4.
3.4. Data Conversion
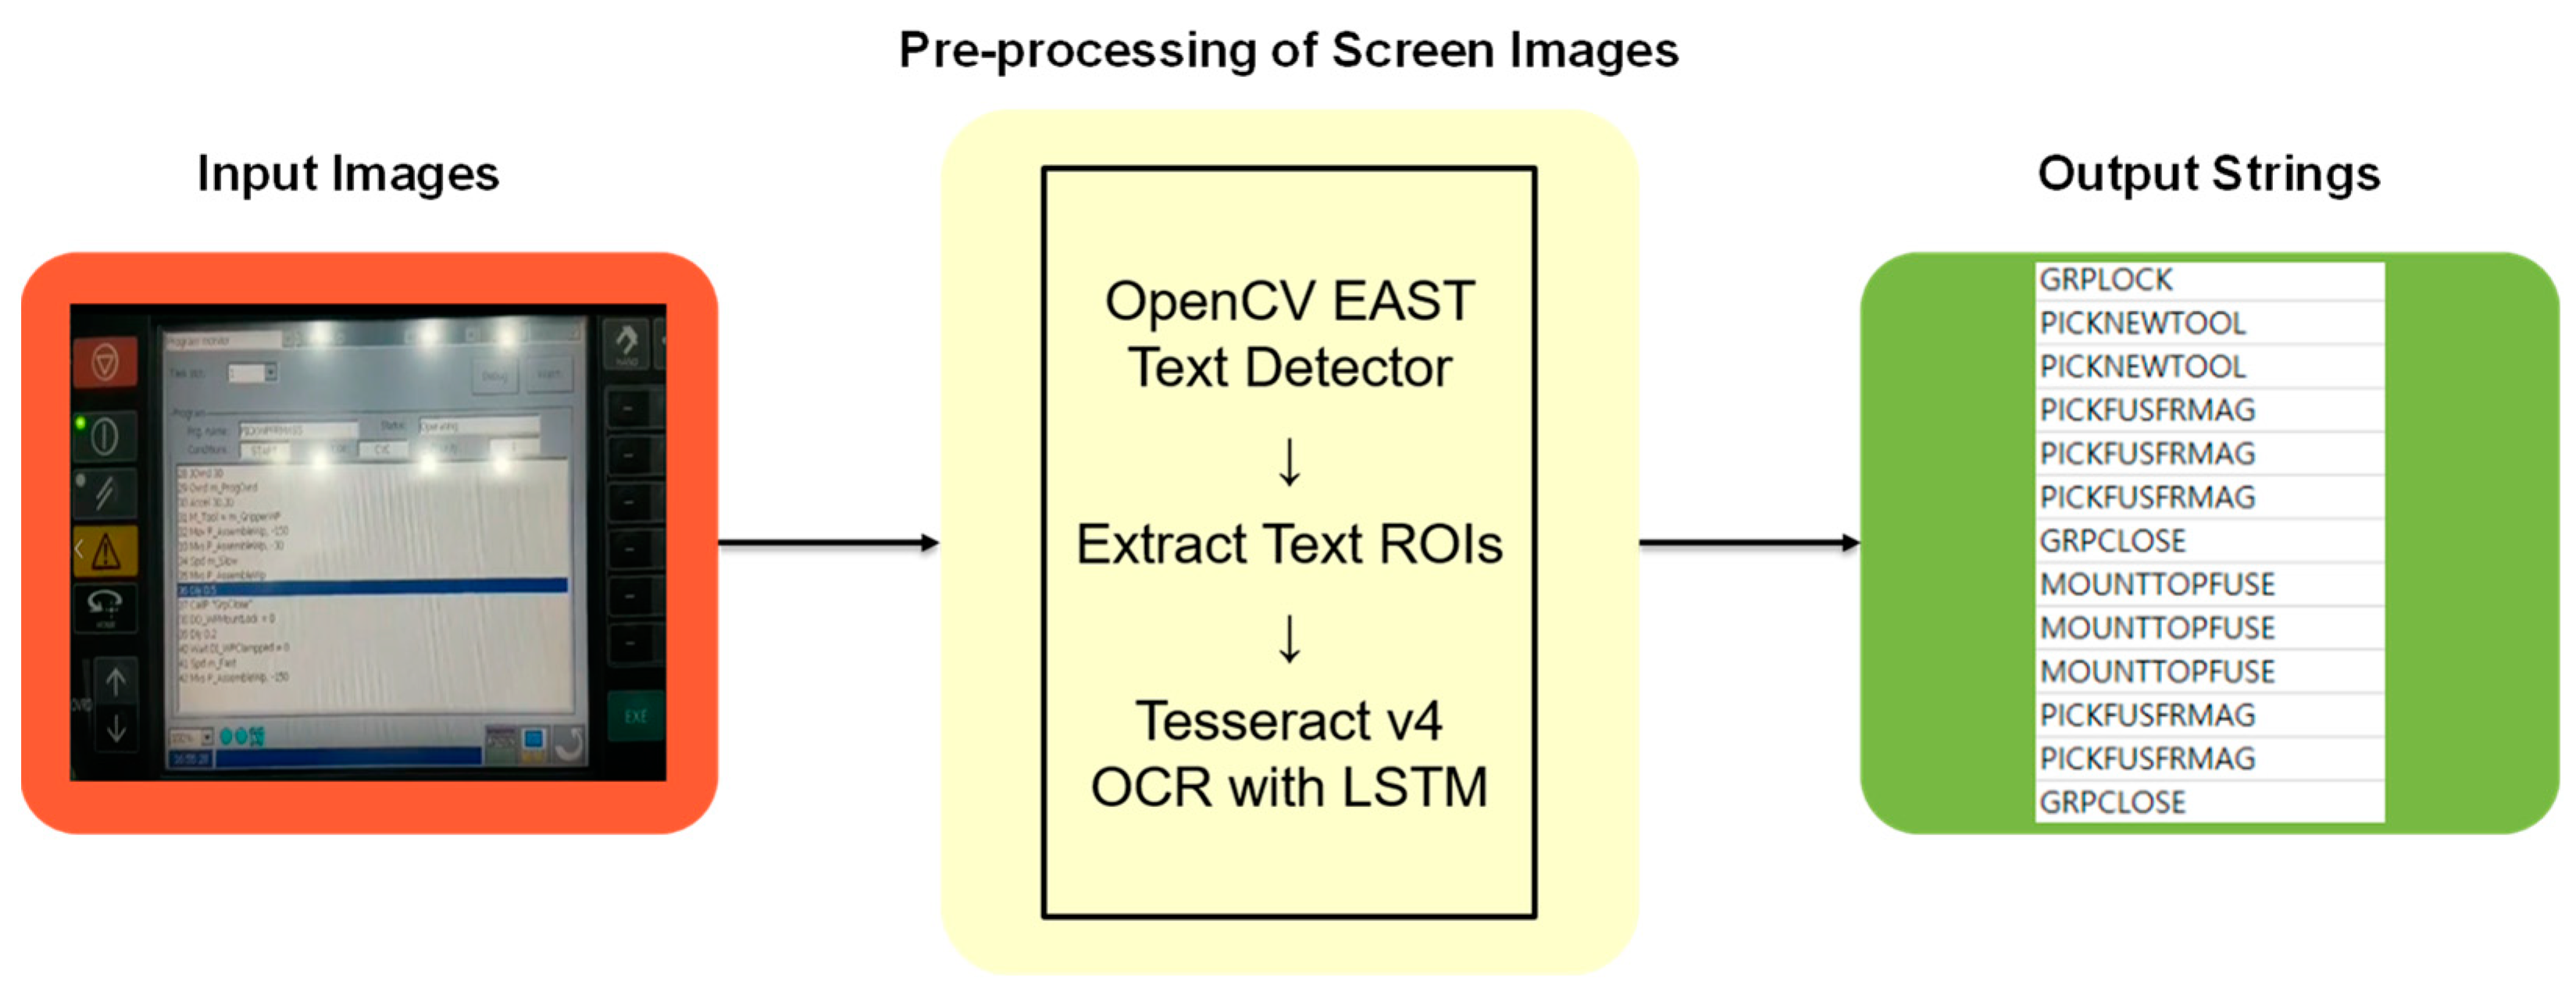
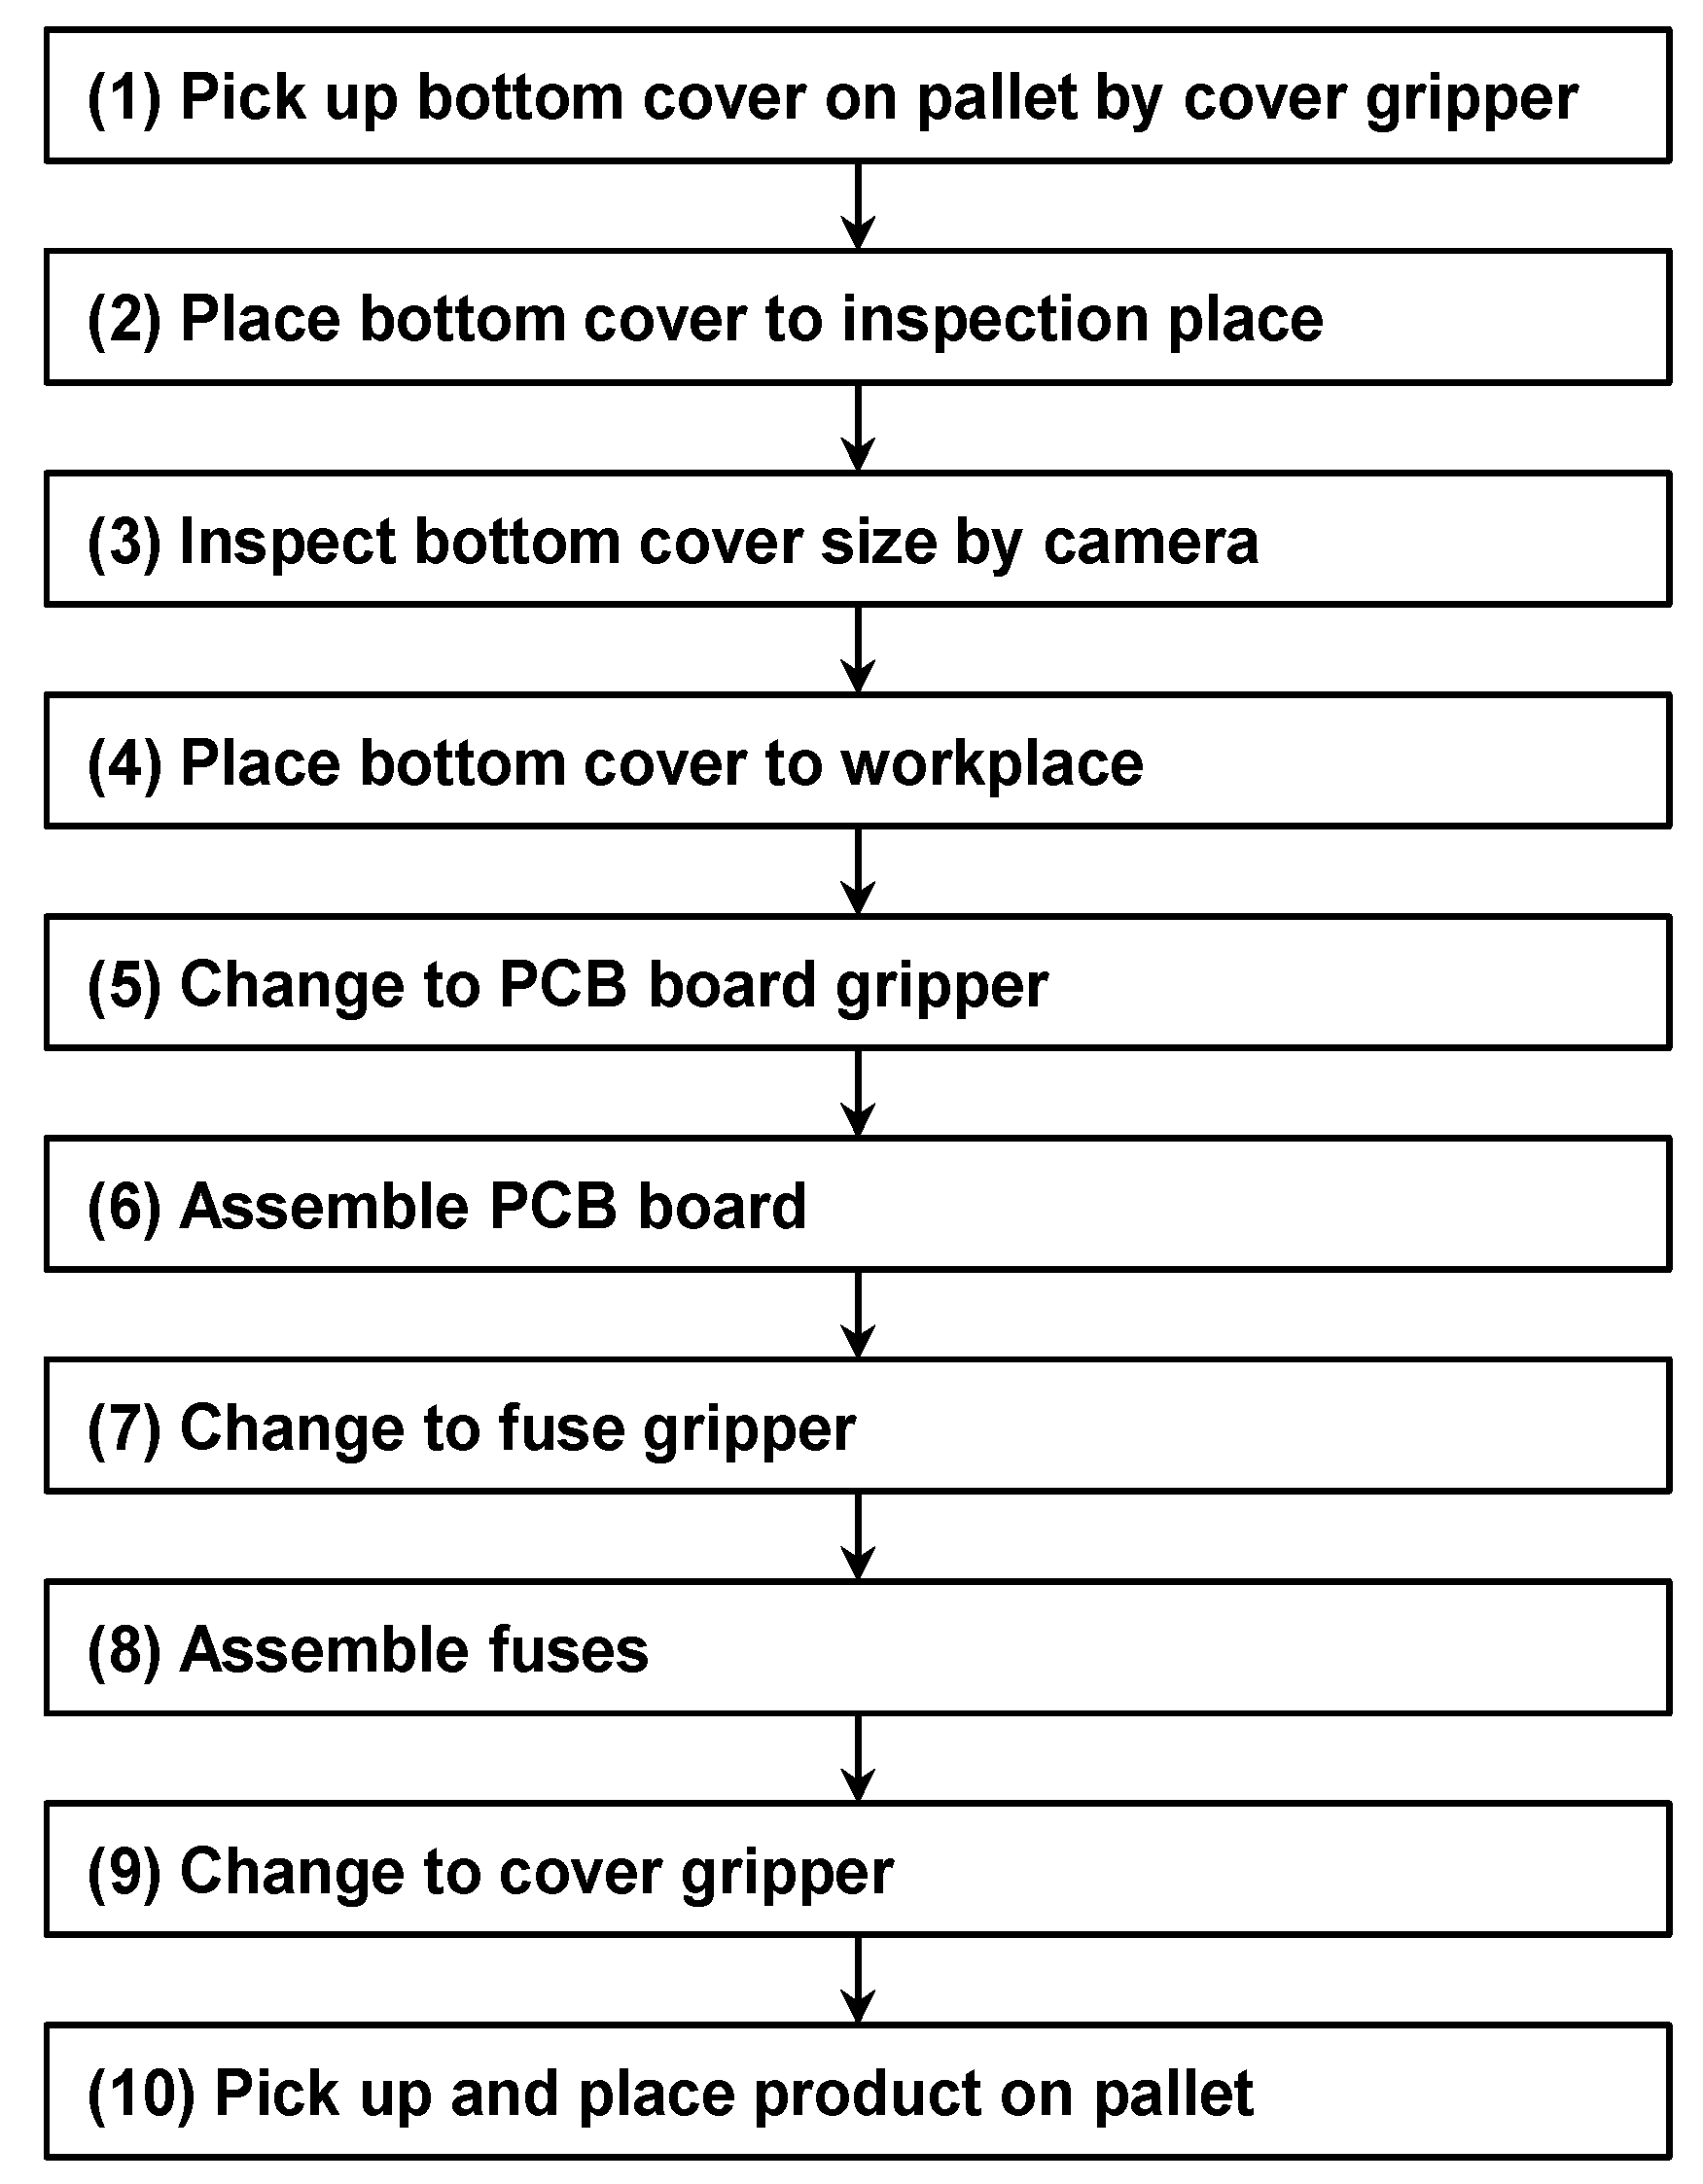
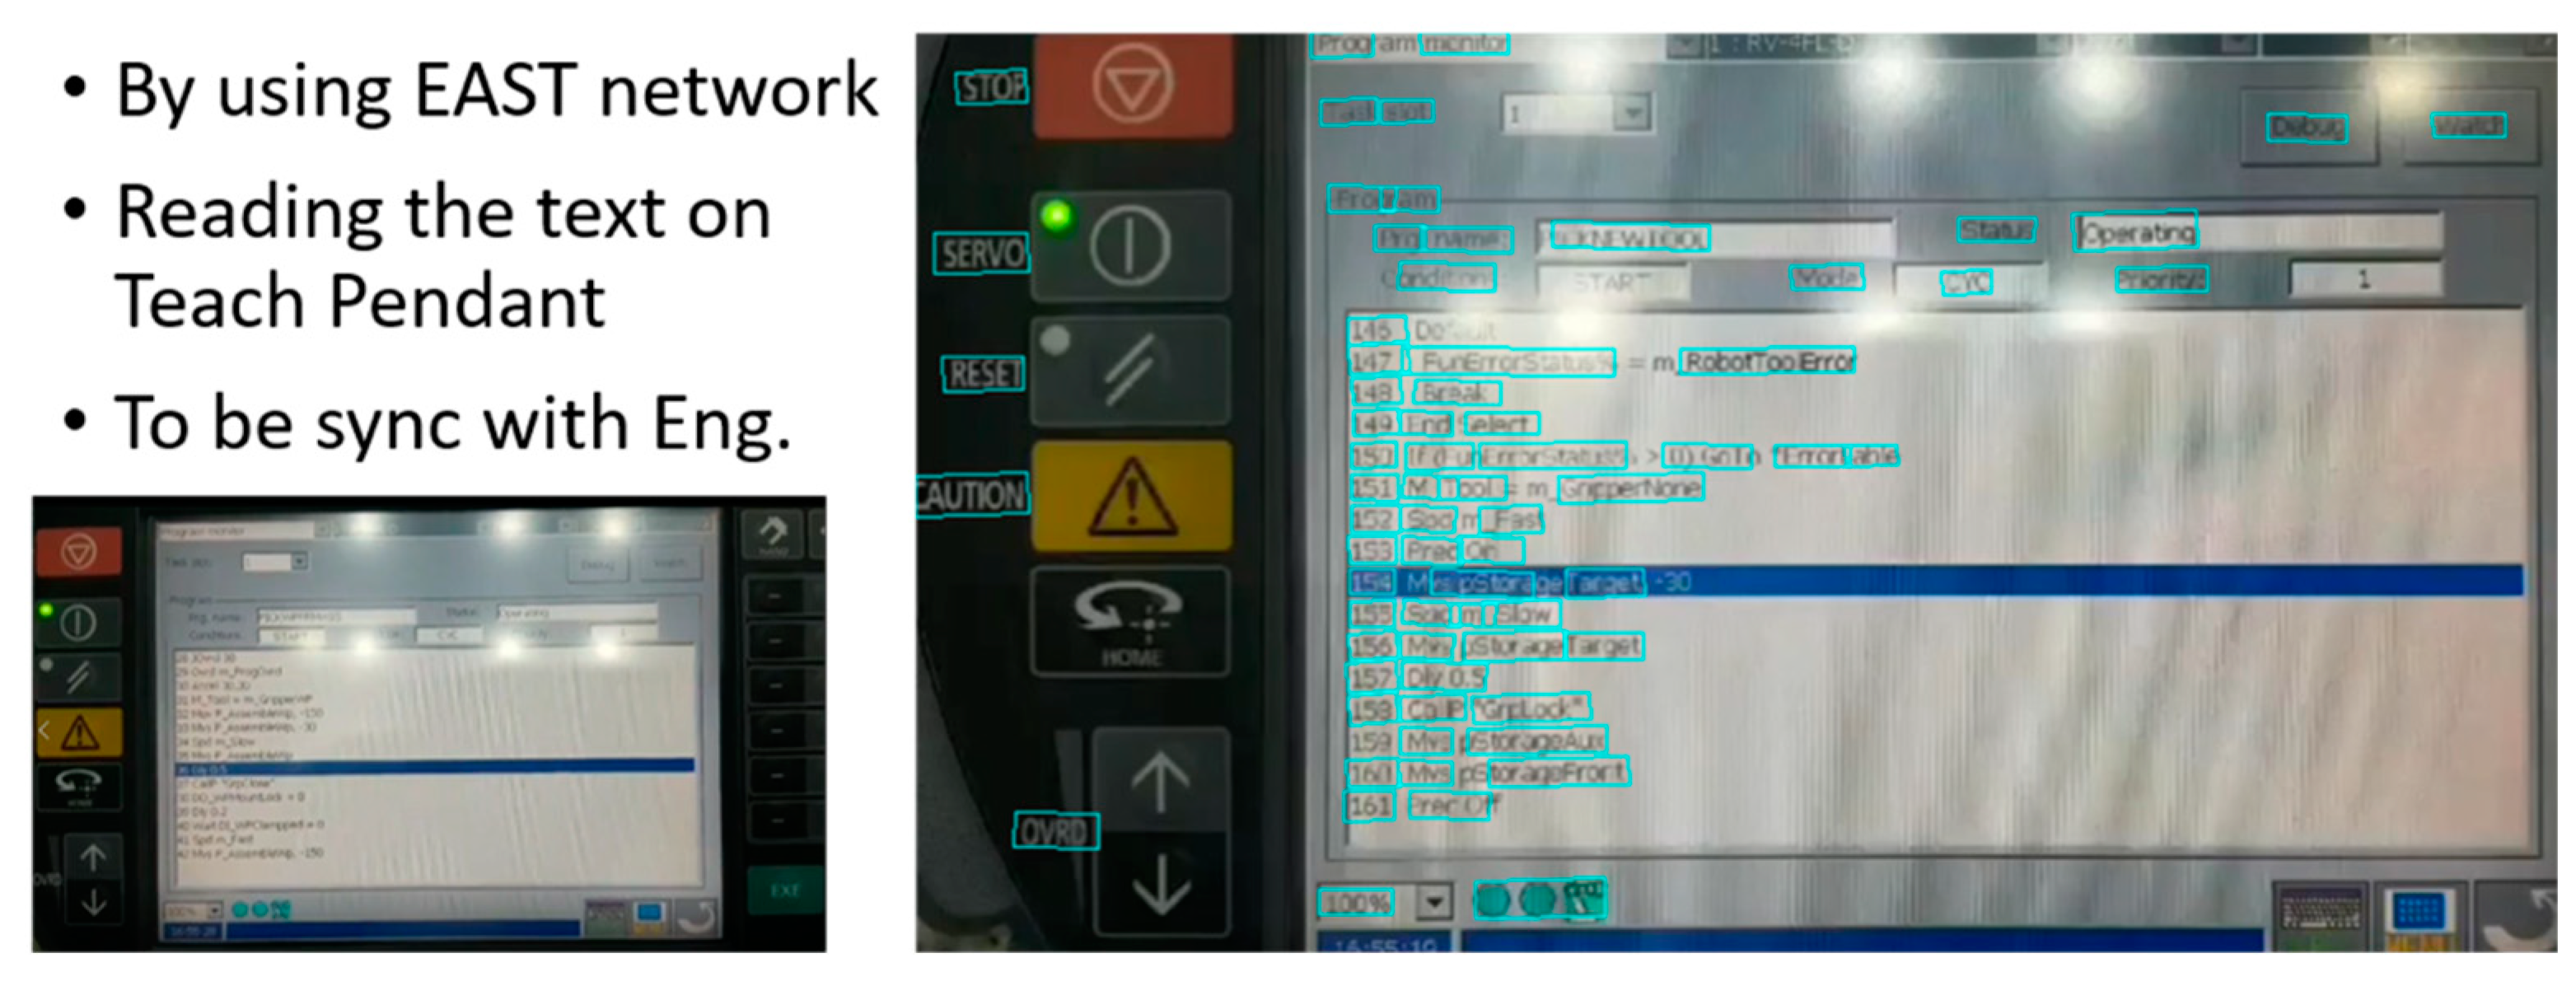
3.4.1. Pre-Processing of Unstructured Data: Text Recognition of Teach Pendant
Unstructured data are not suitable for direct application to data analysis models. Additional pre-processing is required to build a comprehensive data set of energy consumption. In the case of a modular factory, a video stream is useful for capturing the actual motion that occurs on the conveyor belt and for recording the controller status of the auxiliary machine.
The reason for using video stream data to capture controller status is to keep a single and unique approach for all kinds of screen layouts of different machines. The attempts to automate the classification of text messages of HMI can incur failures in the transition to another machine. For example, the simple rule, like classifying operations with thresholds, is updated whenever a new machine comes. Meanwhile, the proposed method contains the automated adjustment of levels. The main functionalities of the proposed methods are: adapting to different numbers of operation types, easy shifting to a different set of programming languages of different machine controllers, and connecting with old types of machine controller providing only a vendor specific interface.
In the study, the screen of the teach pendant is captured such that the changes in the robot program are shown in real time. To trace the robot control, it is necessary to extract the text message from the screen. The small screen allows display of the chunks of macro-programming sets and jumps the lines across the macro-program every second. The required functions to complete the series of pre-processing involves (1) recording the screen of the teach pendant, (2) converting the video file into single images, (3) clipping the text part of the screen, and (4) detecting text data. The fixed position of the camera mounted on the opposite side of the teach pendant maintains the location of the text message on the screen. With respect to the image processing, as shown in
Figure 3, OpenCV—an image processing library developed by Intel as an open-source project—is employed for pre-processing [
21]. The OpenCV module splits frames into single images and prepares the same for inputting text classification with a list of images. This is followed by processing with a step-by-step pipeline termed as the Tesseract engine developed by HP [
22]. The steps are as follows:
A connected component analysis gathers outlines together into binary large object (Blobs) nested purely.
Blobs are merged into text lines. The lines and regions are investigated for fixed pitch or proportional text.
The two-pass recognition processes proceed. The first pass involves recognizing each word, while the second pass involves recognizing words that are not sufficiently recognized over the image.
3.4.2. Classification and Synchronization with Power Profile
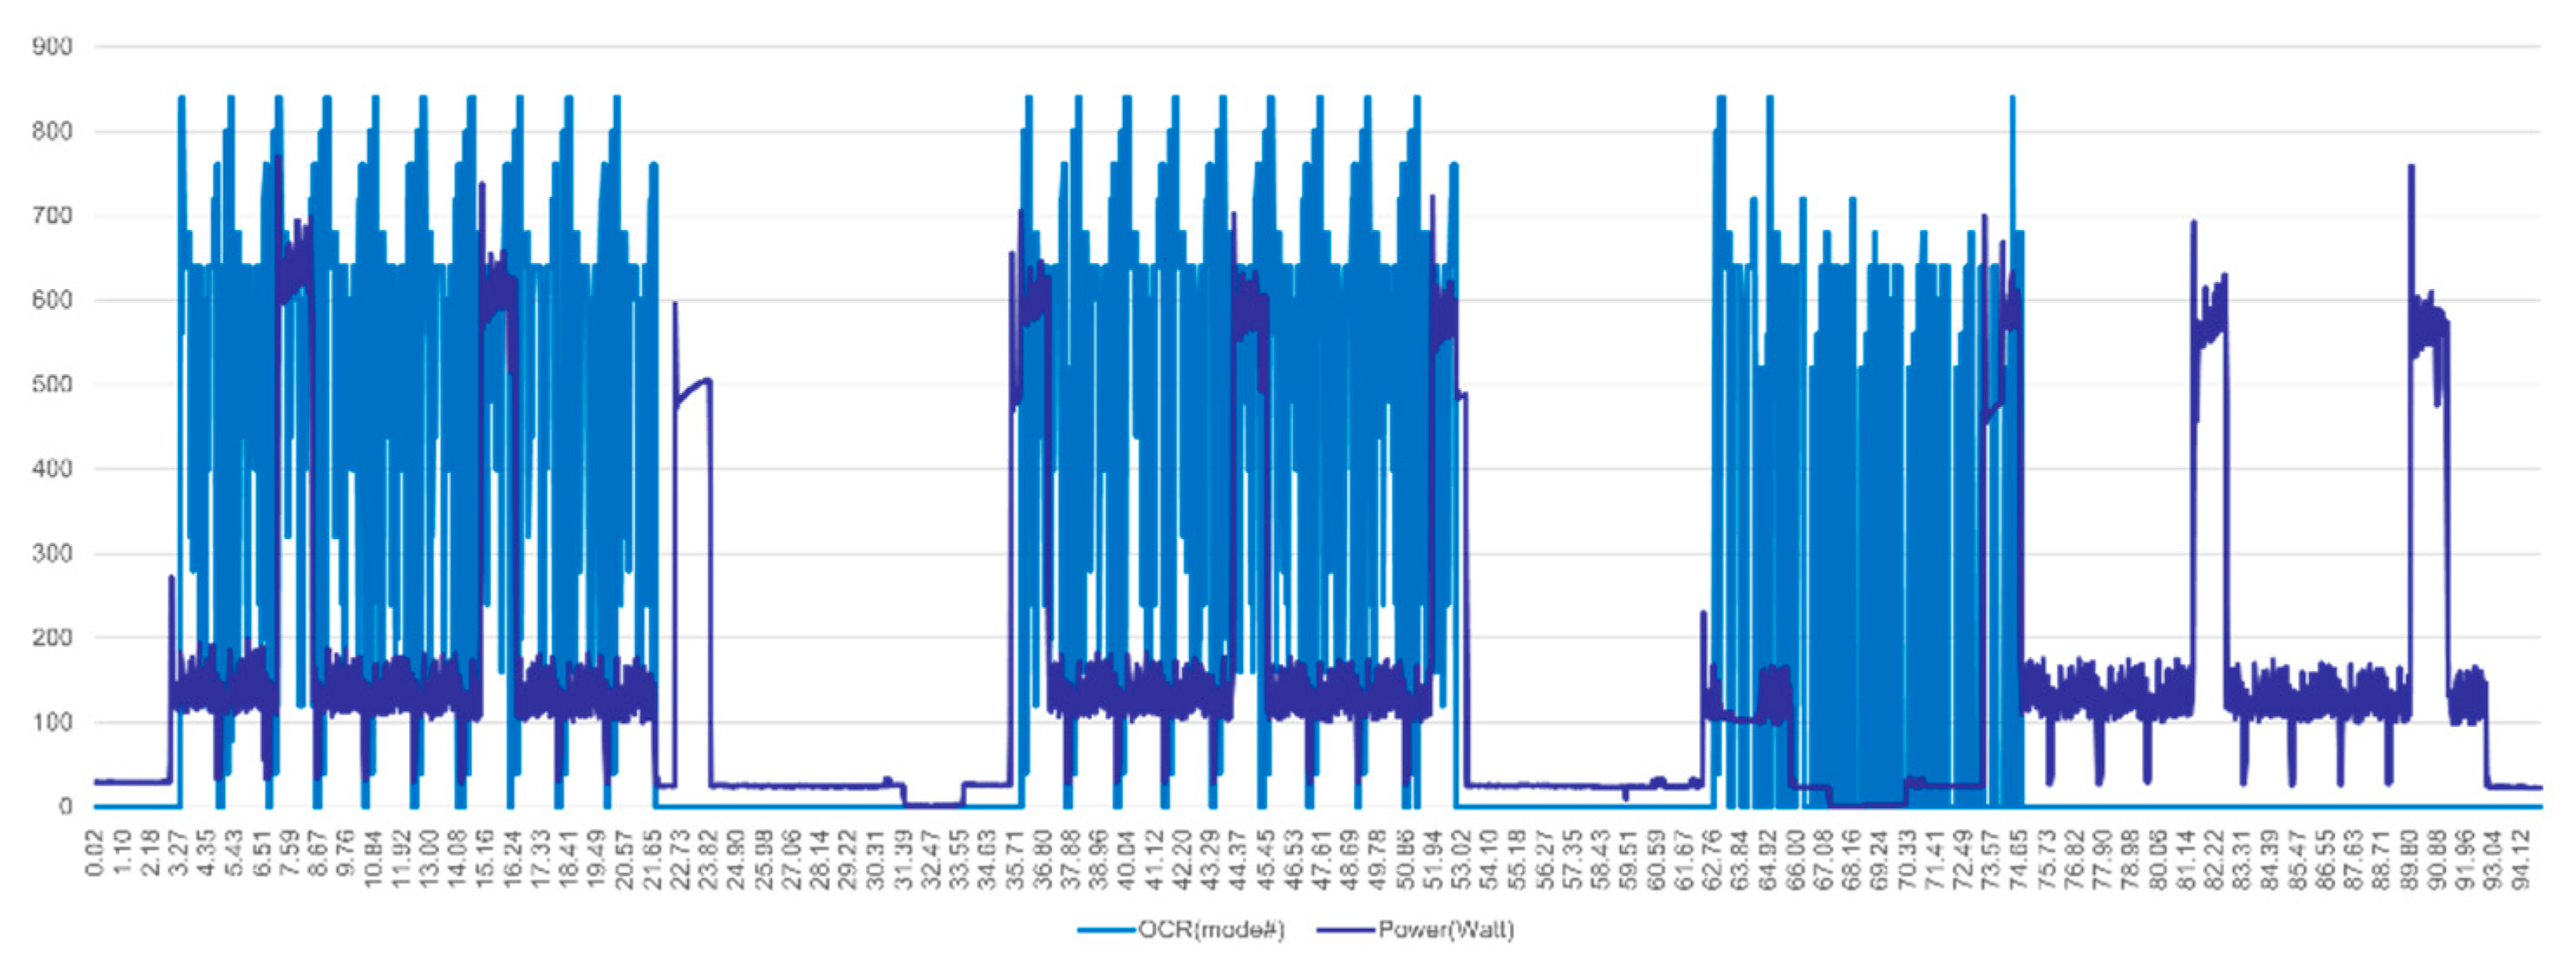
Typically, sensor data go through their respective processing before reaching data storage. This causes different delays of all individual data and misalignment of all data sets. Hence, the synchronization process is necessary along a single timeline. The classification and synchronization steps are as follows:
Split time-series data by a fixed window: The first question for resolving the gap of asynchronous signals involves determining the gap between two more data pipelines. A power meter provides time-series data related to power values at a certain measuring interval (1 s in the experiment described in
Section 4). Such time-series data need to be split for operation detection using a time window that ranges from a lower to an upper threshold (−5 s to +5 s in the experiment).
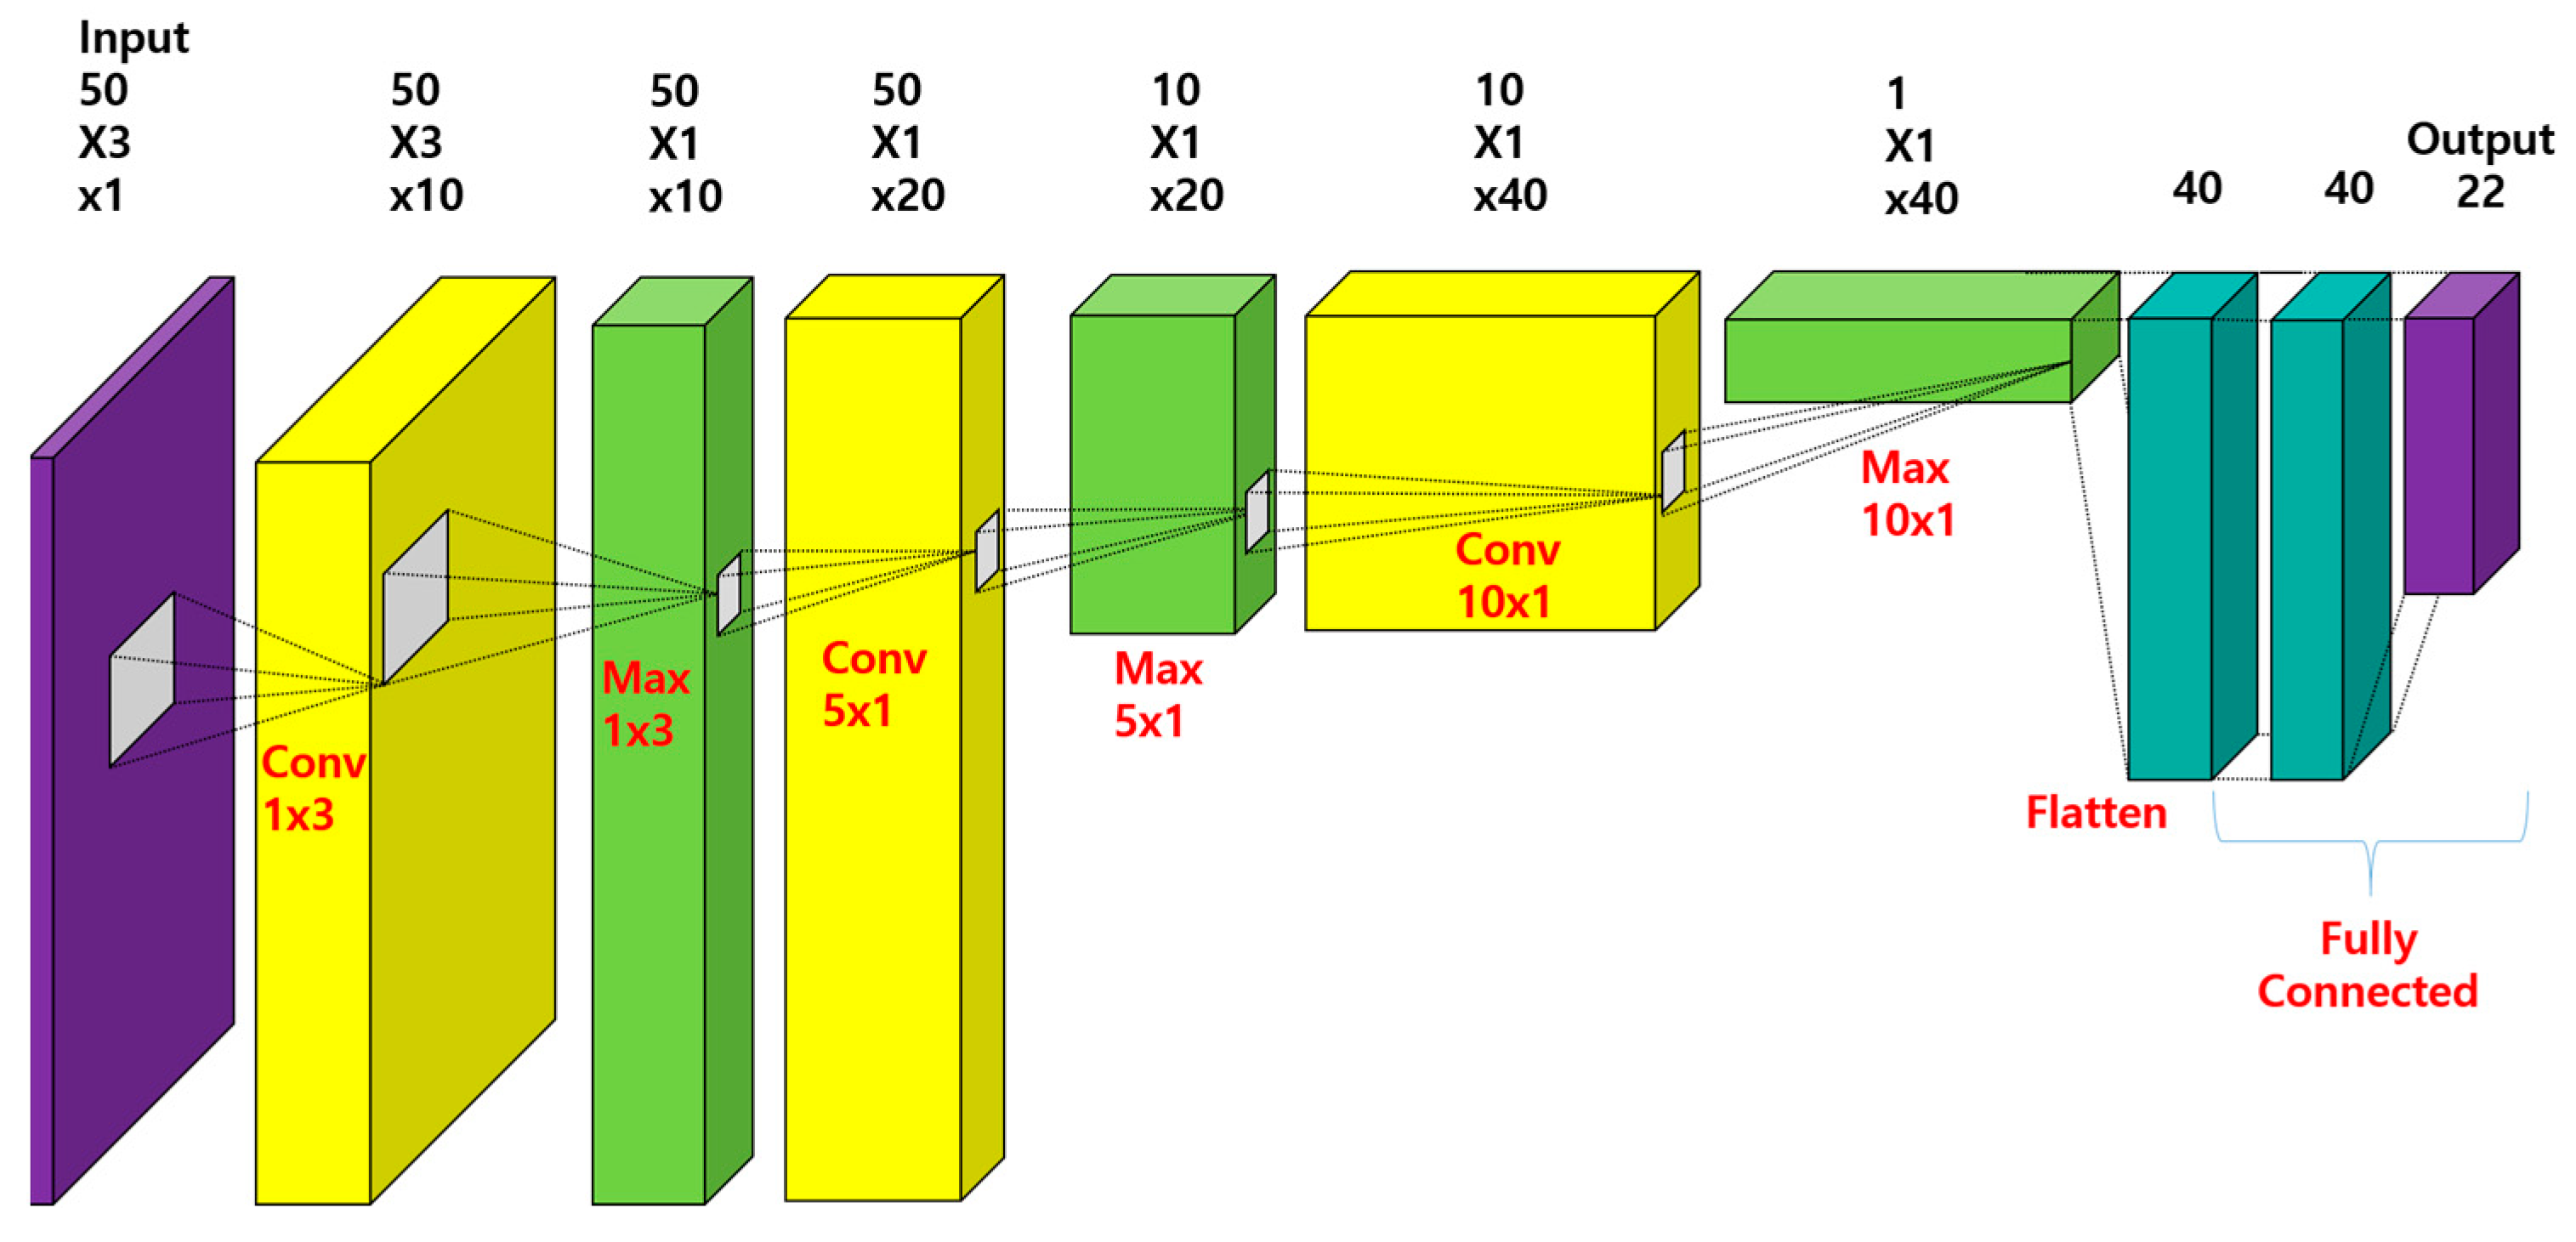
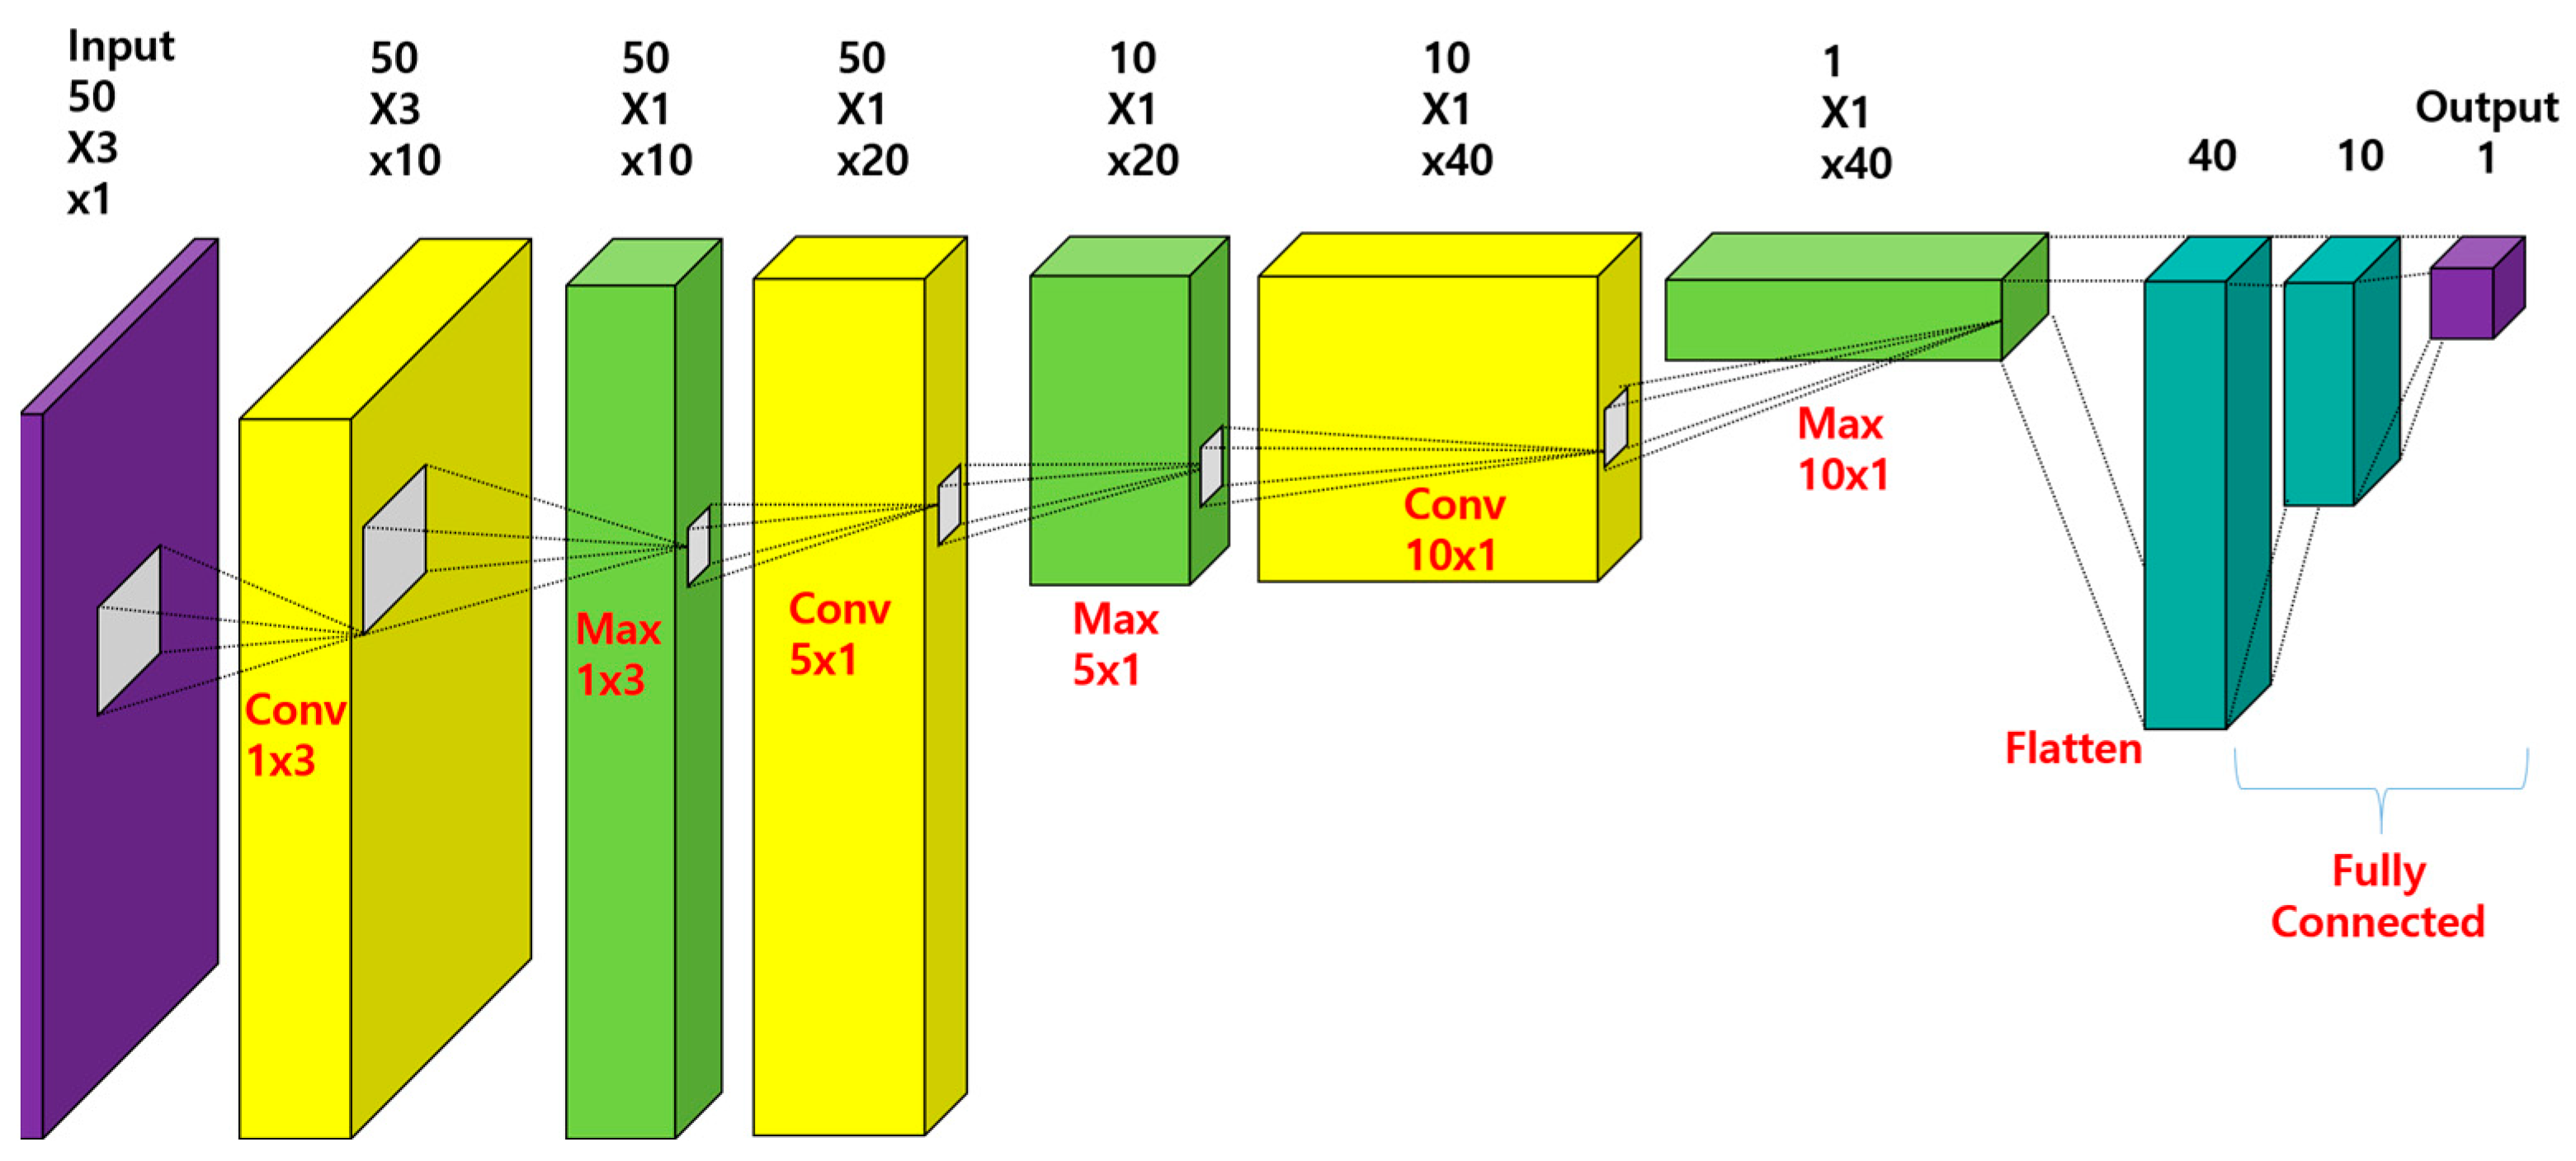
Identify the start and the end of each operation: Before collecting sensor data, it is essential to prepare for the data set of each operation type, find the start and end of each operation, and then store each type into its data set. Identifying each operation is conducted by a 1D convolution neural network algorithm, which is trained with 3D data of all sensor data with the time window. Regarding screen images visualized in the HMI display, an OCR algorithm puts the labels of each moment corresponding to its operation type, giving the connection with the single data line where all sensor data are merged. Regarding data storage, we employ a new approach to store only latent space extracted from an autoencoder in order to reduce the size of a data set. The autoencoder is trained by an upcoming profile, thereby compressing the dimension of the data set. This compression model is reused when the data set is called by data analysis tools.
Interpolate other data along the reference data: Although all data are aligned in a single timeline, some signal data are shorter or longer. This leads to the issue of integrating both data into a single data set. One of the data sources is selected as the reference data for synchronization. Other data are extended or squeezed along the reference data in order to fit the start and the end of each operation with all data sources.
3.5. Cognition and Configuration
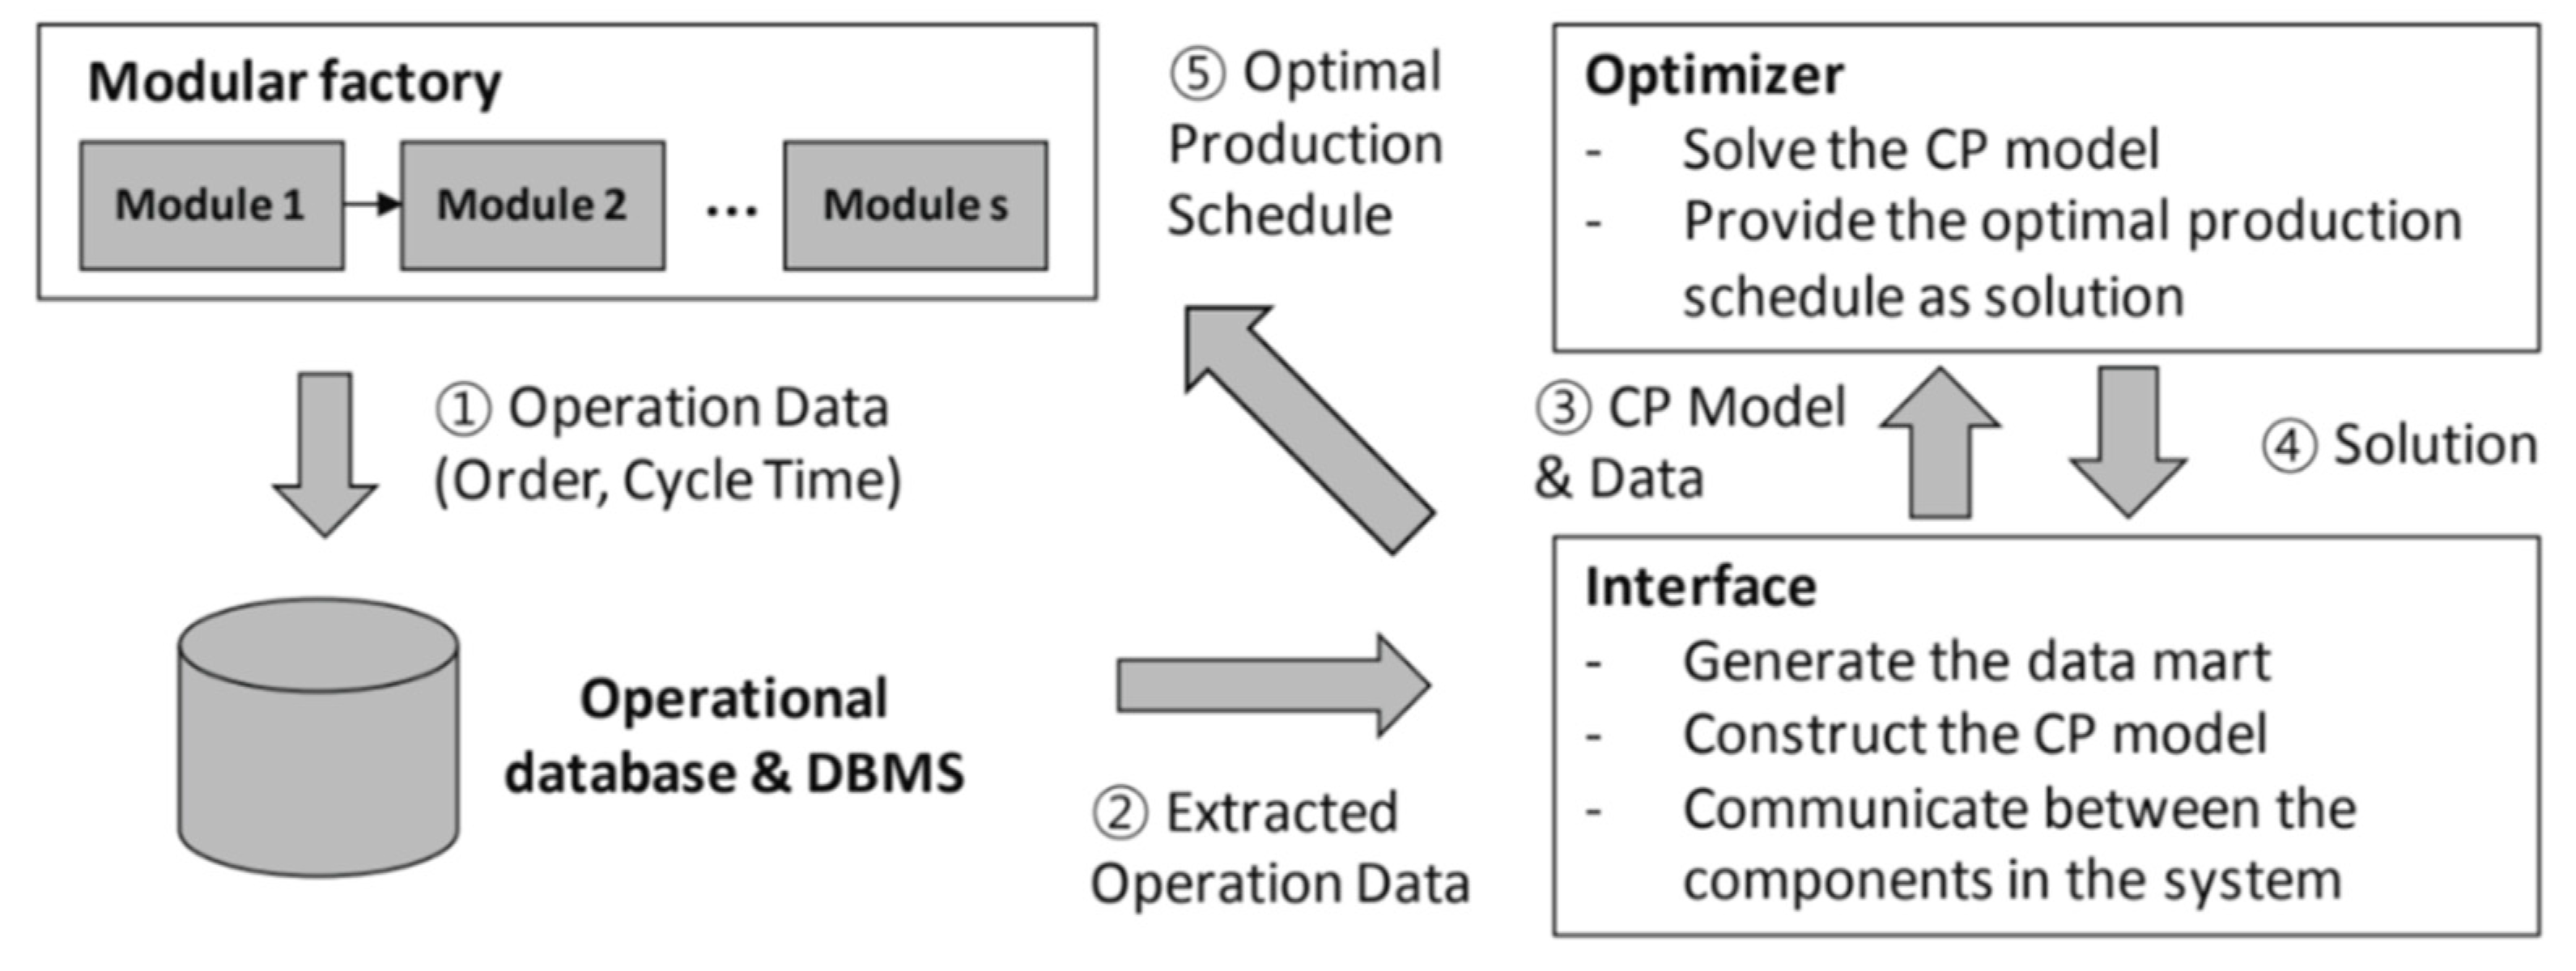
Park et al. [
23] introduced an overall procedure to optimize the power consumption in process planning for modular factories. They included scheduling options by changing the production order and changing module operations.
Figure 4 shows their procedure from data collection to data extraction of database, constraint programming, and comparison of alternative solutions. Within this procedure, the proposed method plays a role in providing labeled power profiles to a database system and estimating power profiles of each alternative solution as the prerequisite for the optimization.
The entire power data set contains signals unrelated to the process plan because they are the result of other signals and superimposed results. Thus, machine learning immediately indicates a low accuracy. This is caused by the interruption of signals unrelated to the process plan. For example, a learning model that directly uses the entire power data can fail to draw an accurate power profile because the power data can contain the data generated during stand-by in a module.
Thus, it is vital to generate a power recognition model that includes the process of separating the data set associated directly with the process plan. Based on the characteristics of the discrete process, classification is performed according to operation status and process type, and signals of the same conditions are classified as data sets and utilized for learning. The cognition and configuration steps are as follows:
A classification is necessary to distinguish whether the target module is stand-by or in-process. This classification eliminates meaningless data, such as stand-by state data, unrelated to the process plan.
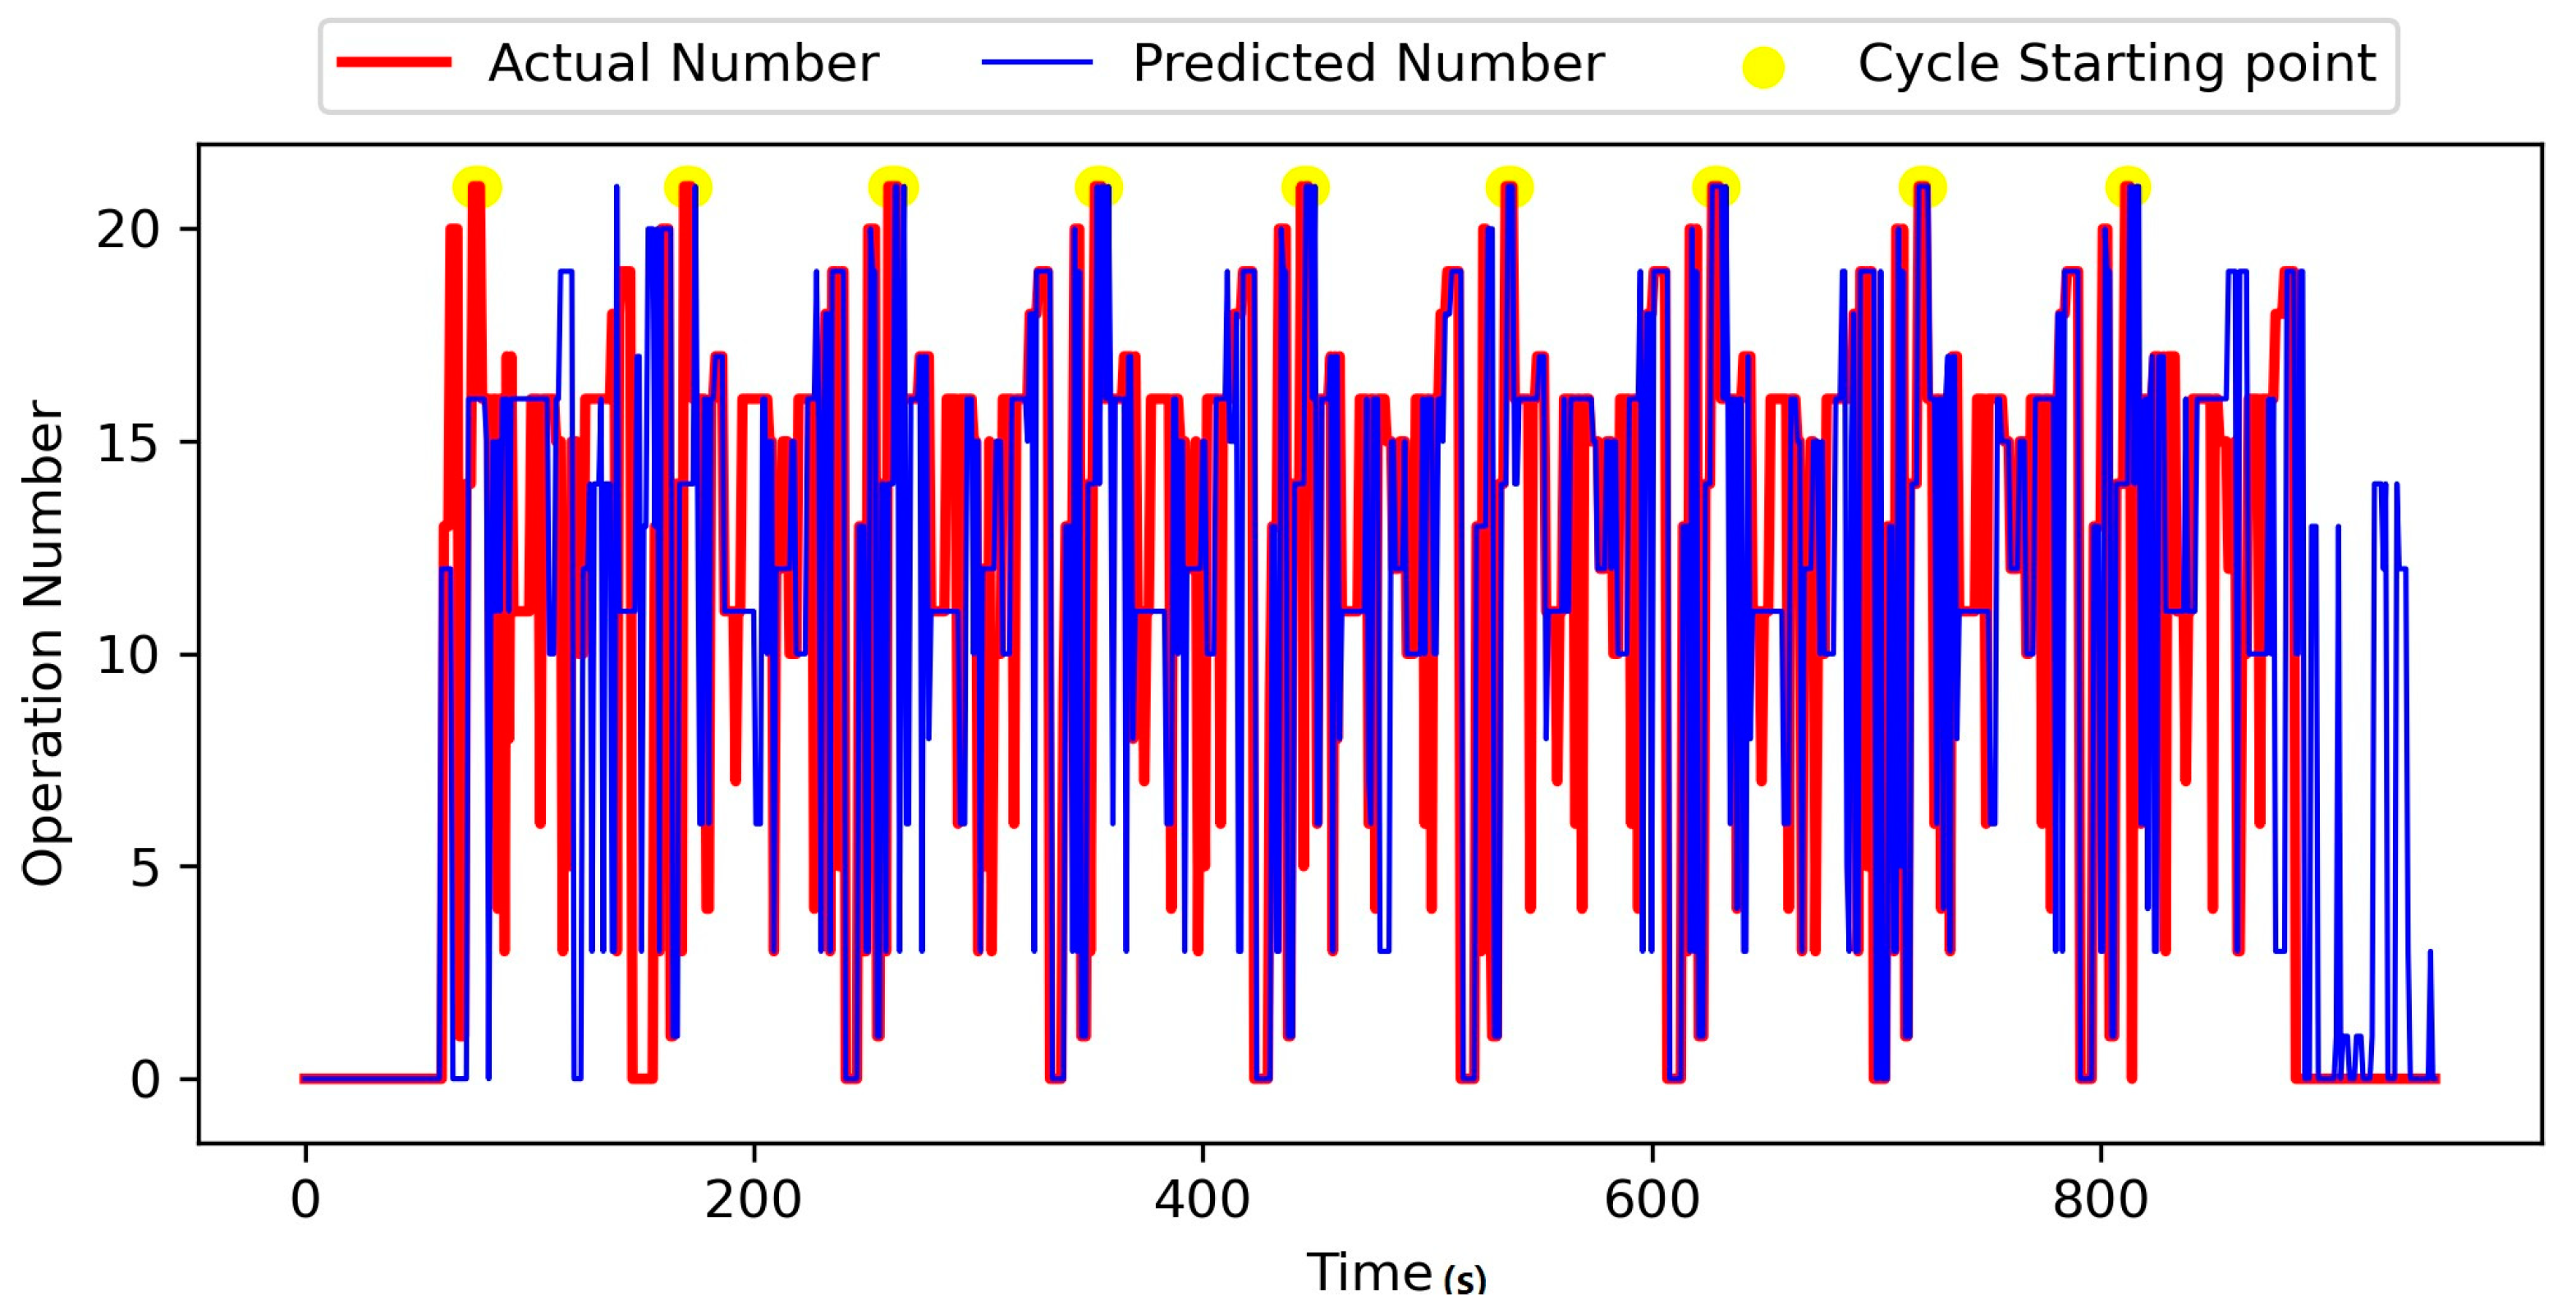
Another classification is needed to classify the current activity. Time-series profile data are created to learn power profiles by mapping a process planning program with characters to an integer. For example, each line of the robot program is classified into the type of robot operation and merged with the process plan profile data by changing them to a specific number.
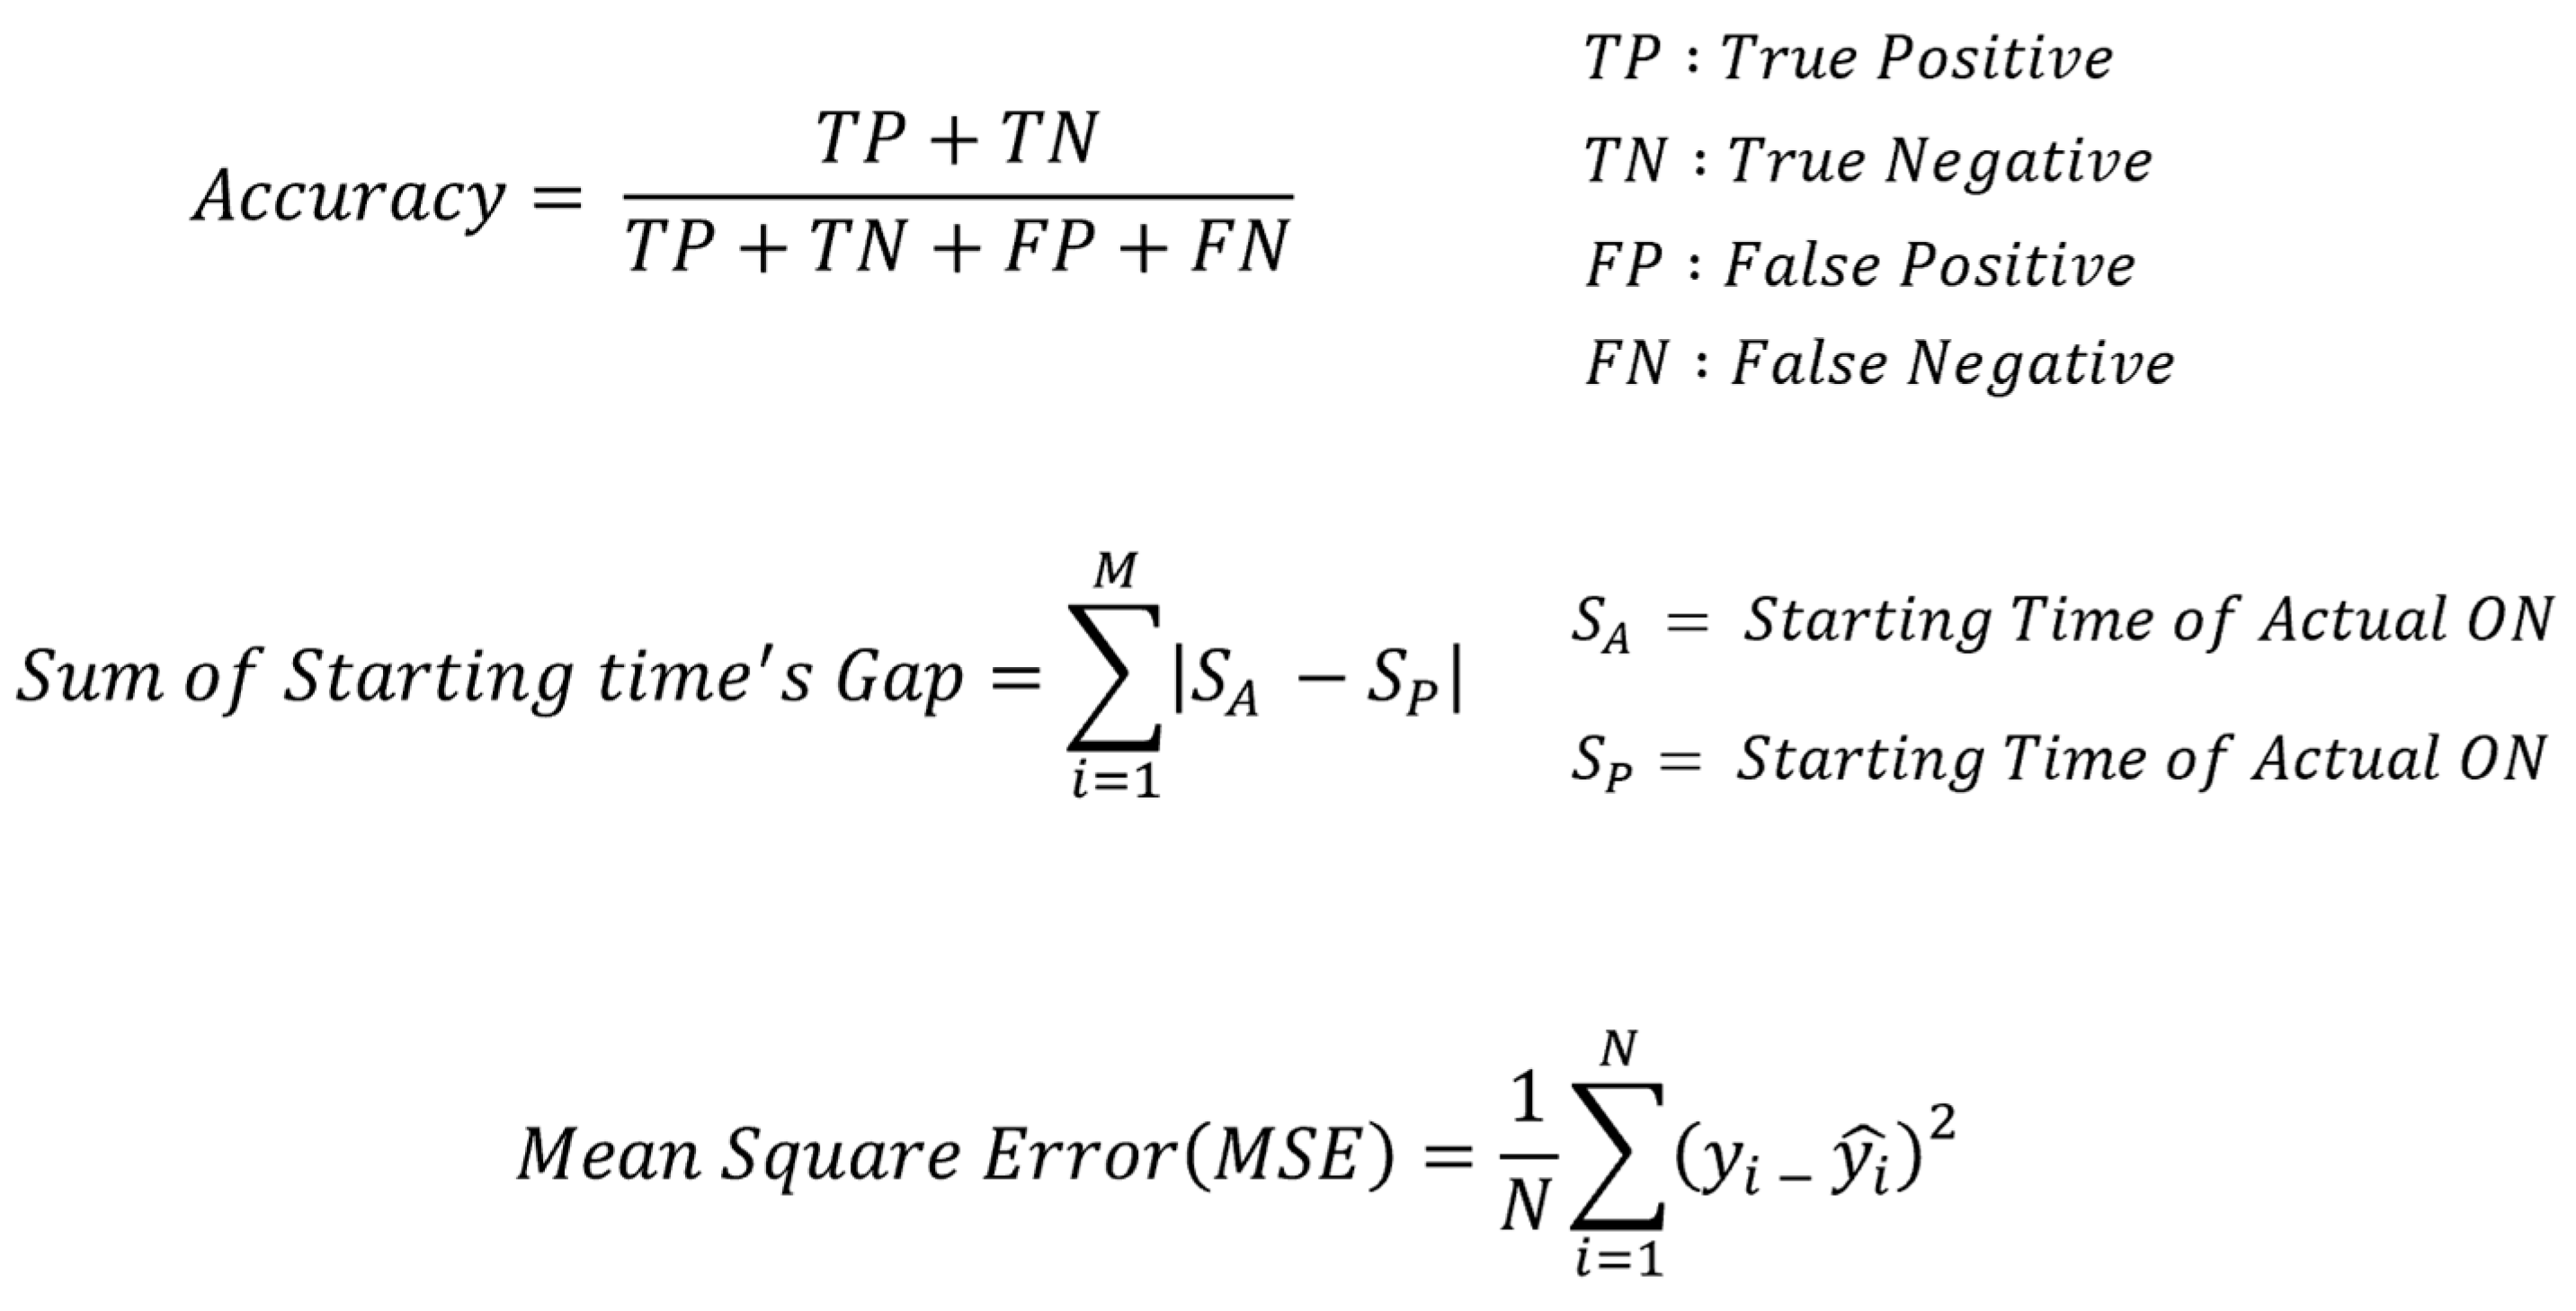
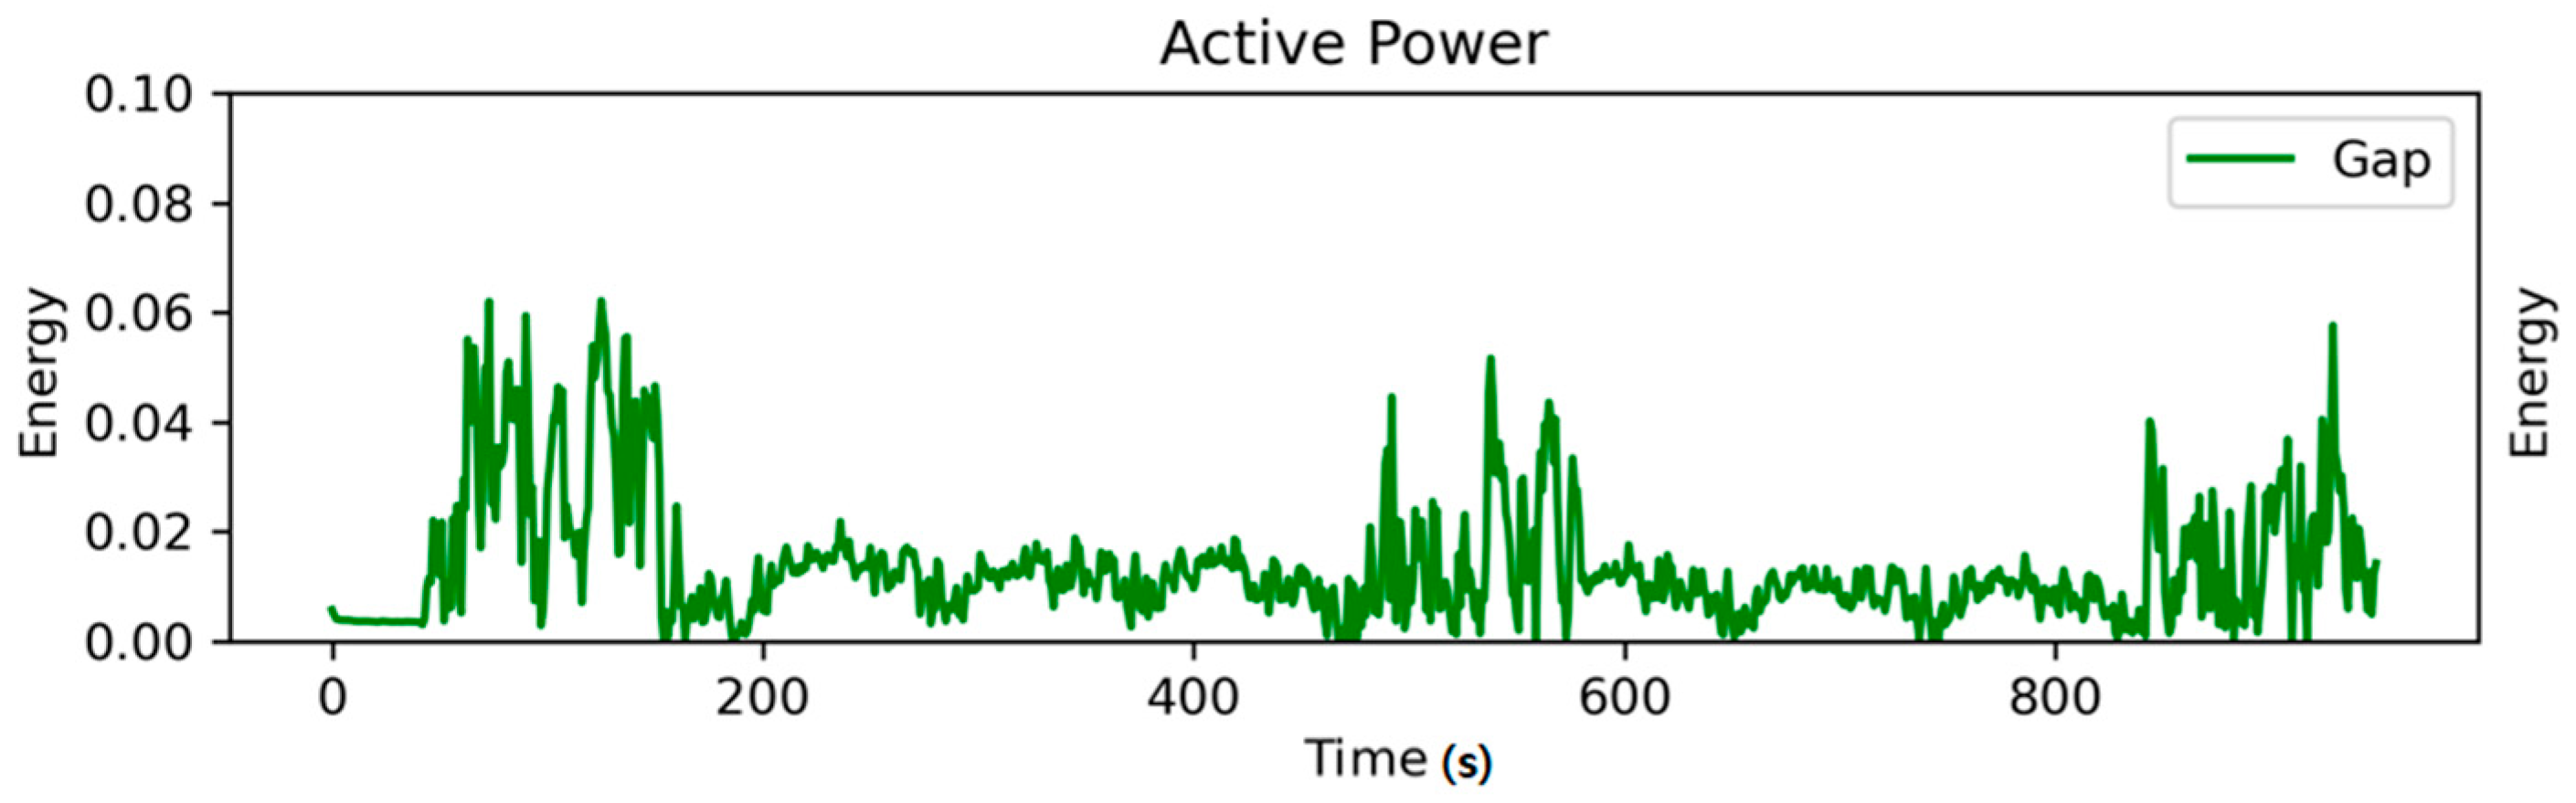
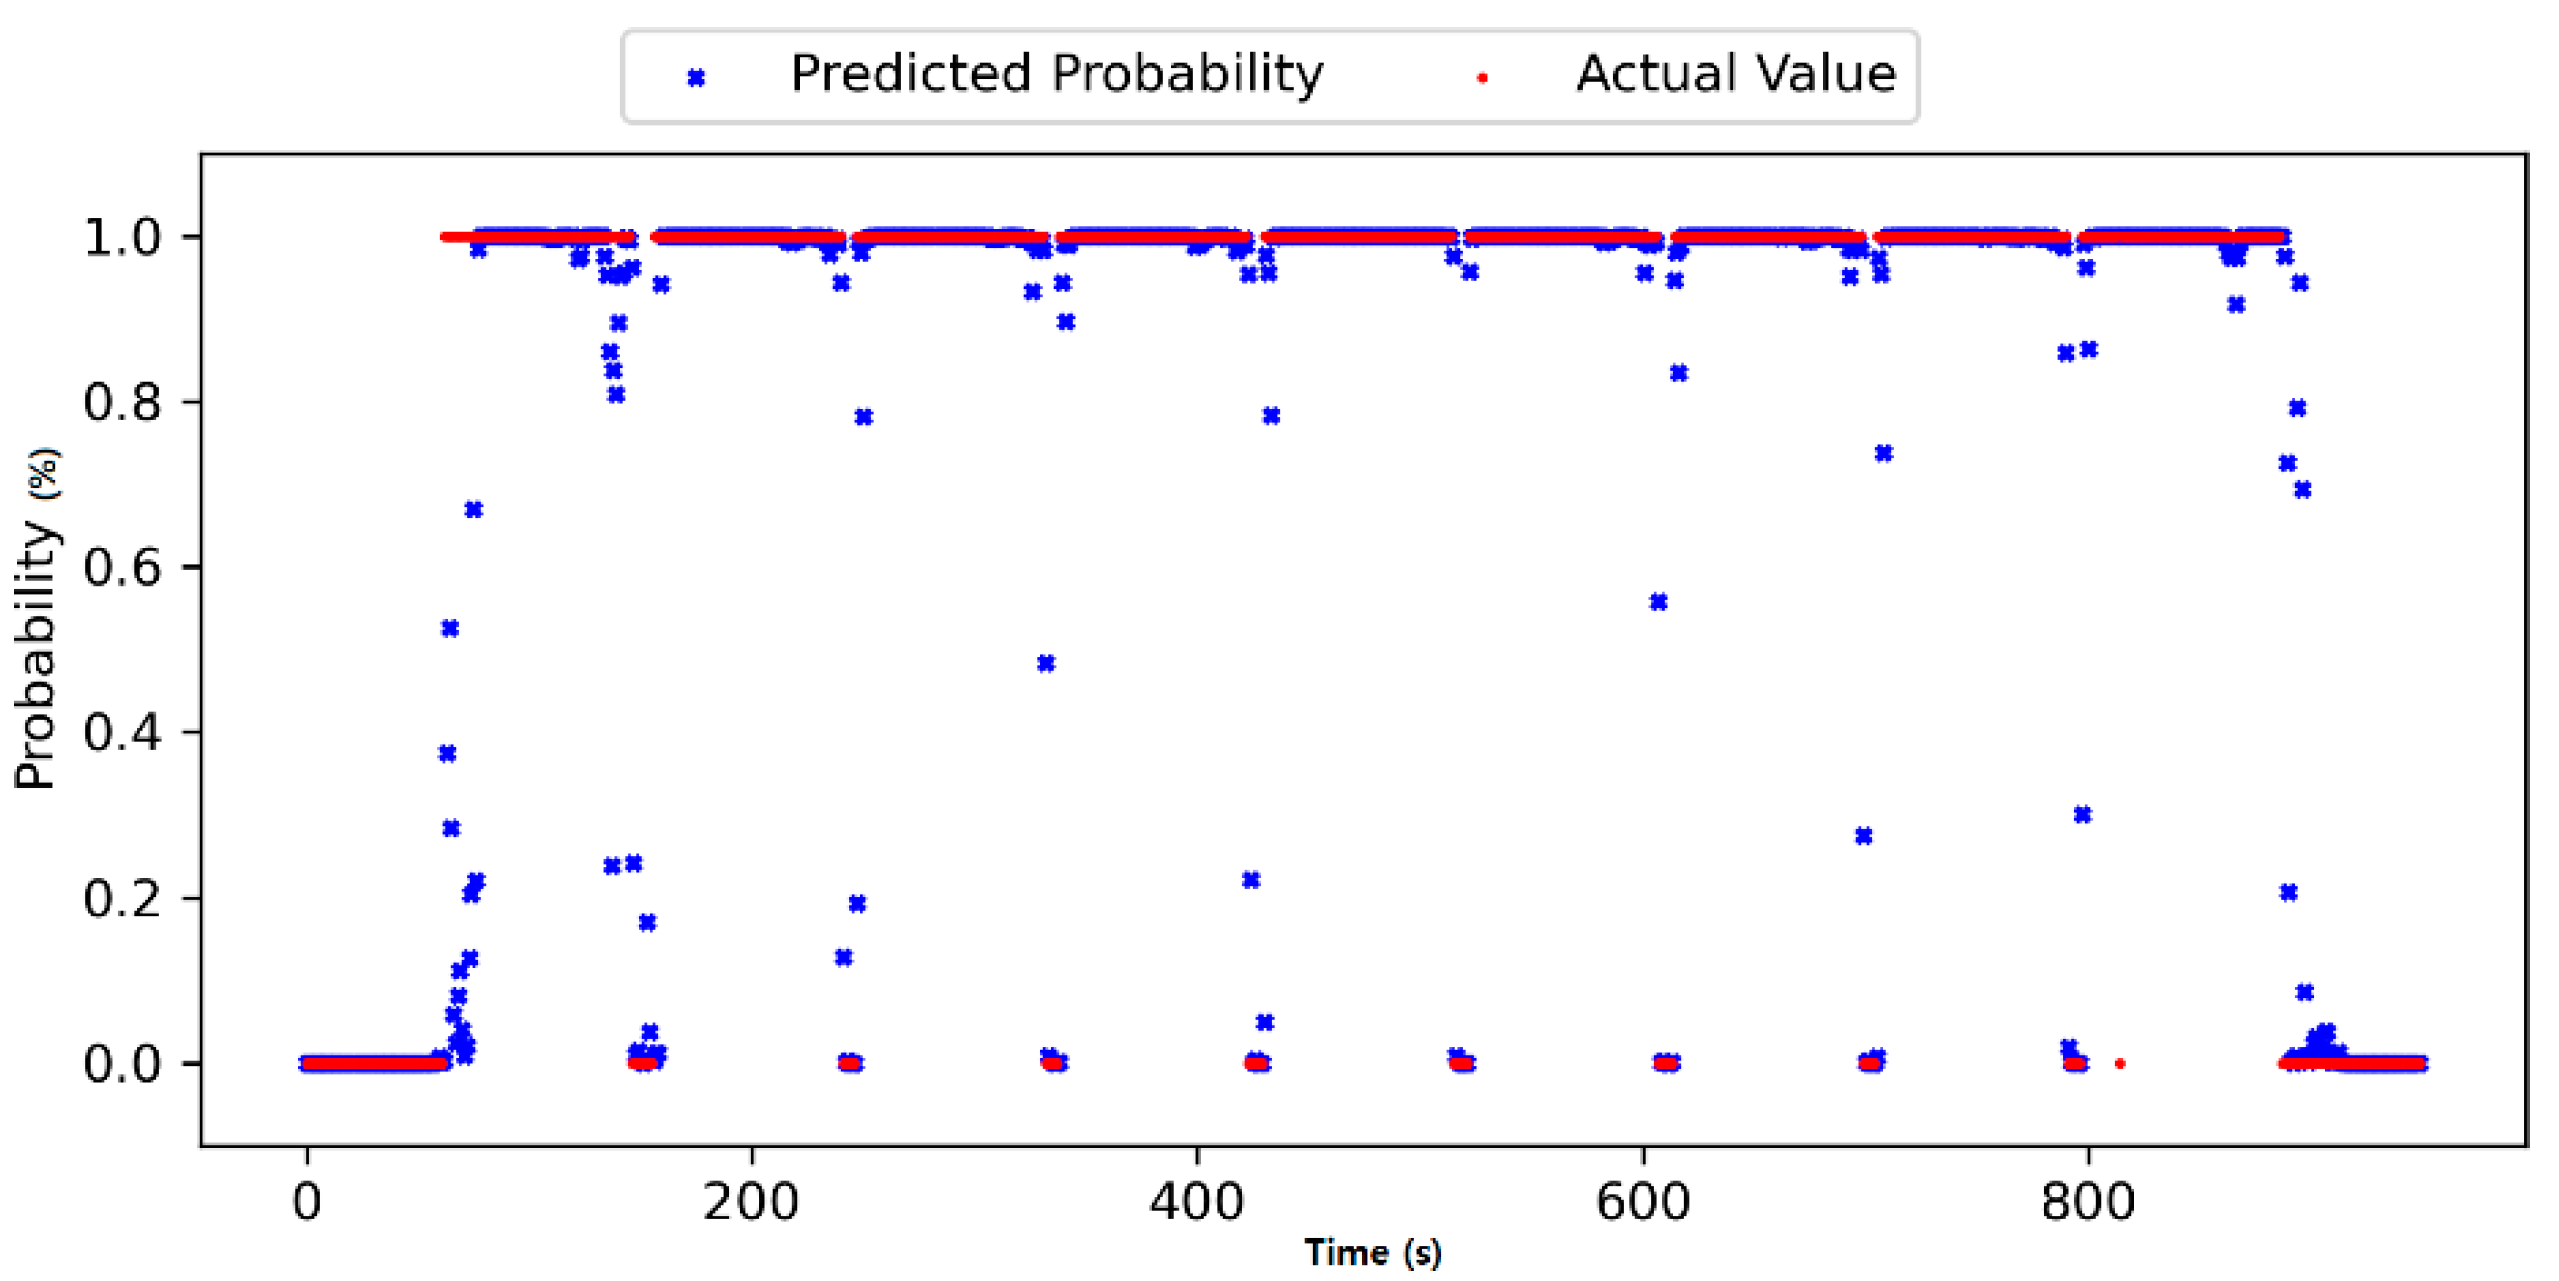
The other classification is required to classify power peaks caused by other devices. These peaks can be recognized by checking the gap between an actual profile and a predicted profile. An unexpected peak is found and is marked as the noise automatically.
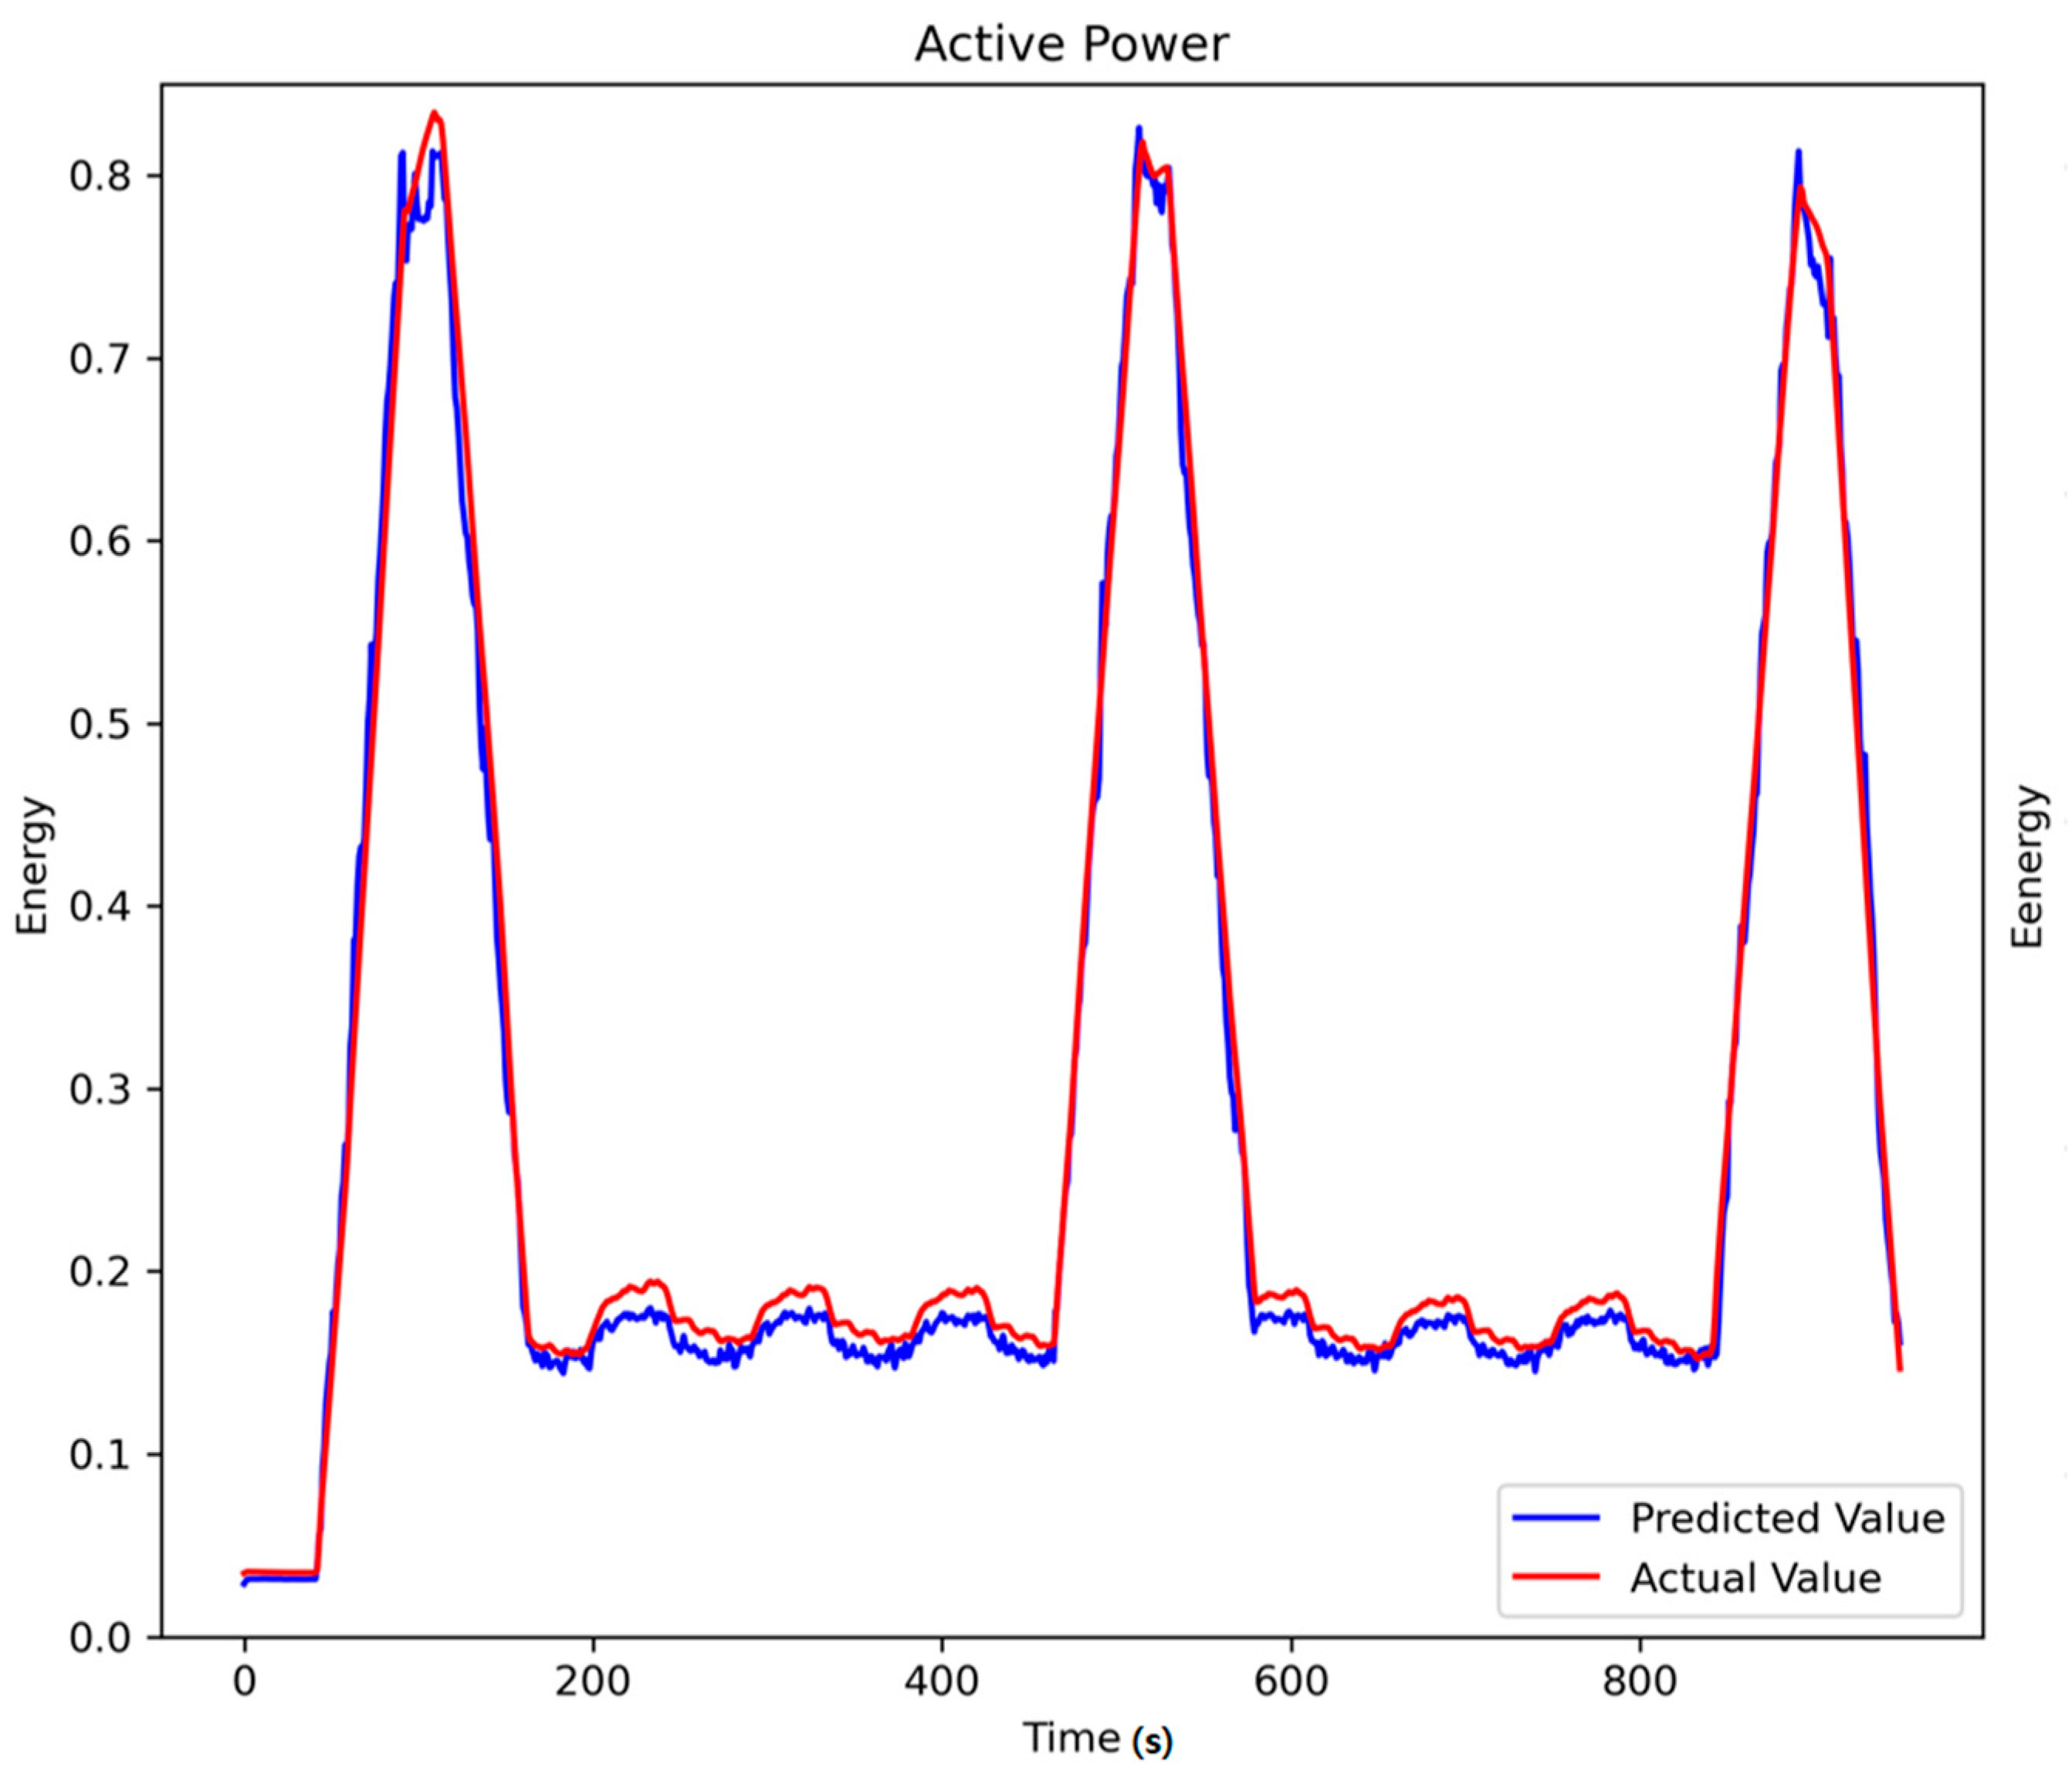
A pattern that is repeatedly performed in a process plan is defined as a unit of data set. Power data are partitioned and stored to fit a recurring pattern process. The power profile is stored separately during the repetition period specified in the process plan, and the learned regression model is applied to the process plan.
Particularly, the proposed method is designed to classify power profiles using deep learning. In our preliminary analysis, a simple machine learning model showed less accuracy in profile classification of raw power profiles, while the accuracy of a deep learning model becomes higher. A simple machine learning model identifies the type of process with the specific threshold or the cluster of specific factors. A power profile fluctuates in certain range typically and can seldom be classified into each type of process with the specific boundary value. Although the sequence of processes relates to the type of processes, clustering models using simple machine learning tend to ignore the relationship of the previous process to the next processes. Applying simple machine learning models to another machine facility causes wholesale change in thresholds and models. Due to these reasons, simple machine learning models are limited to generalize power profile classification. In this sense, a classification model was developed using a deep learning model in this study. The proposed method includes the series of deep learning models that are adaptable to complex process sequences with a generalized model that identifies high-level classification criteria. The proposed method is designed to use an identical model, from binary classification of classifying stand-by mode and working mode to multiple process-type classification.
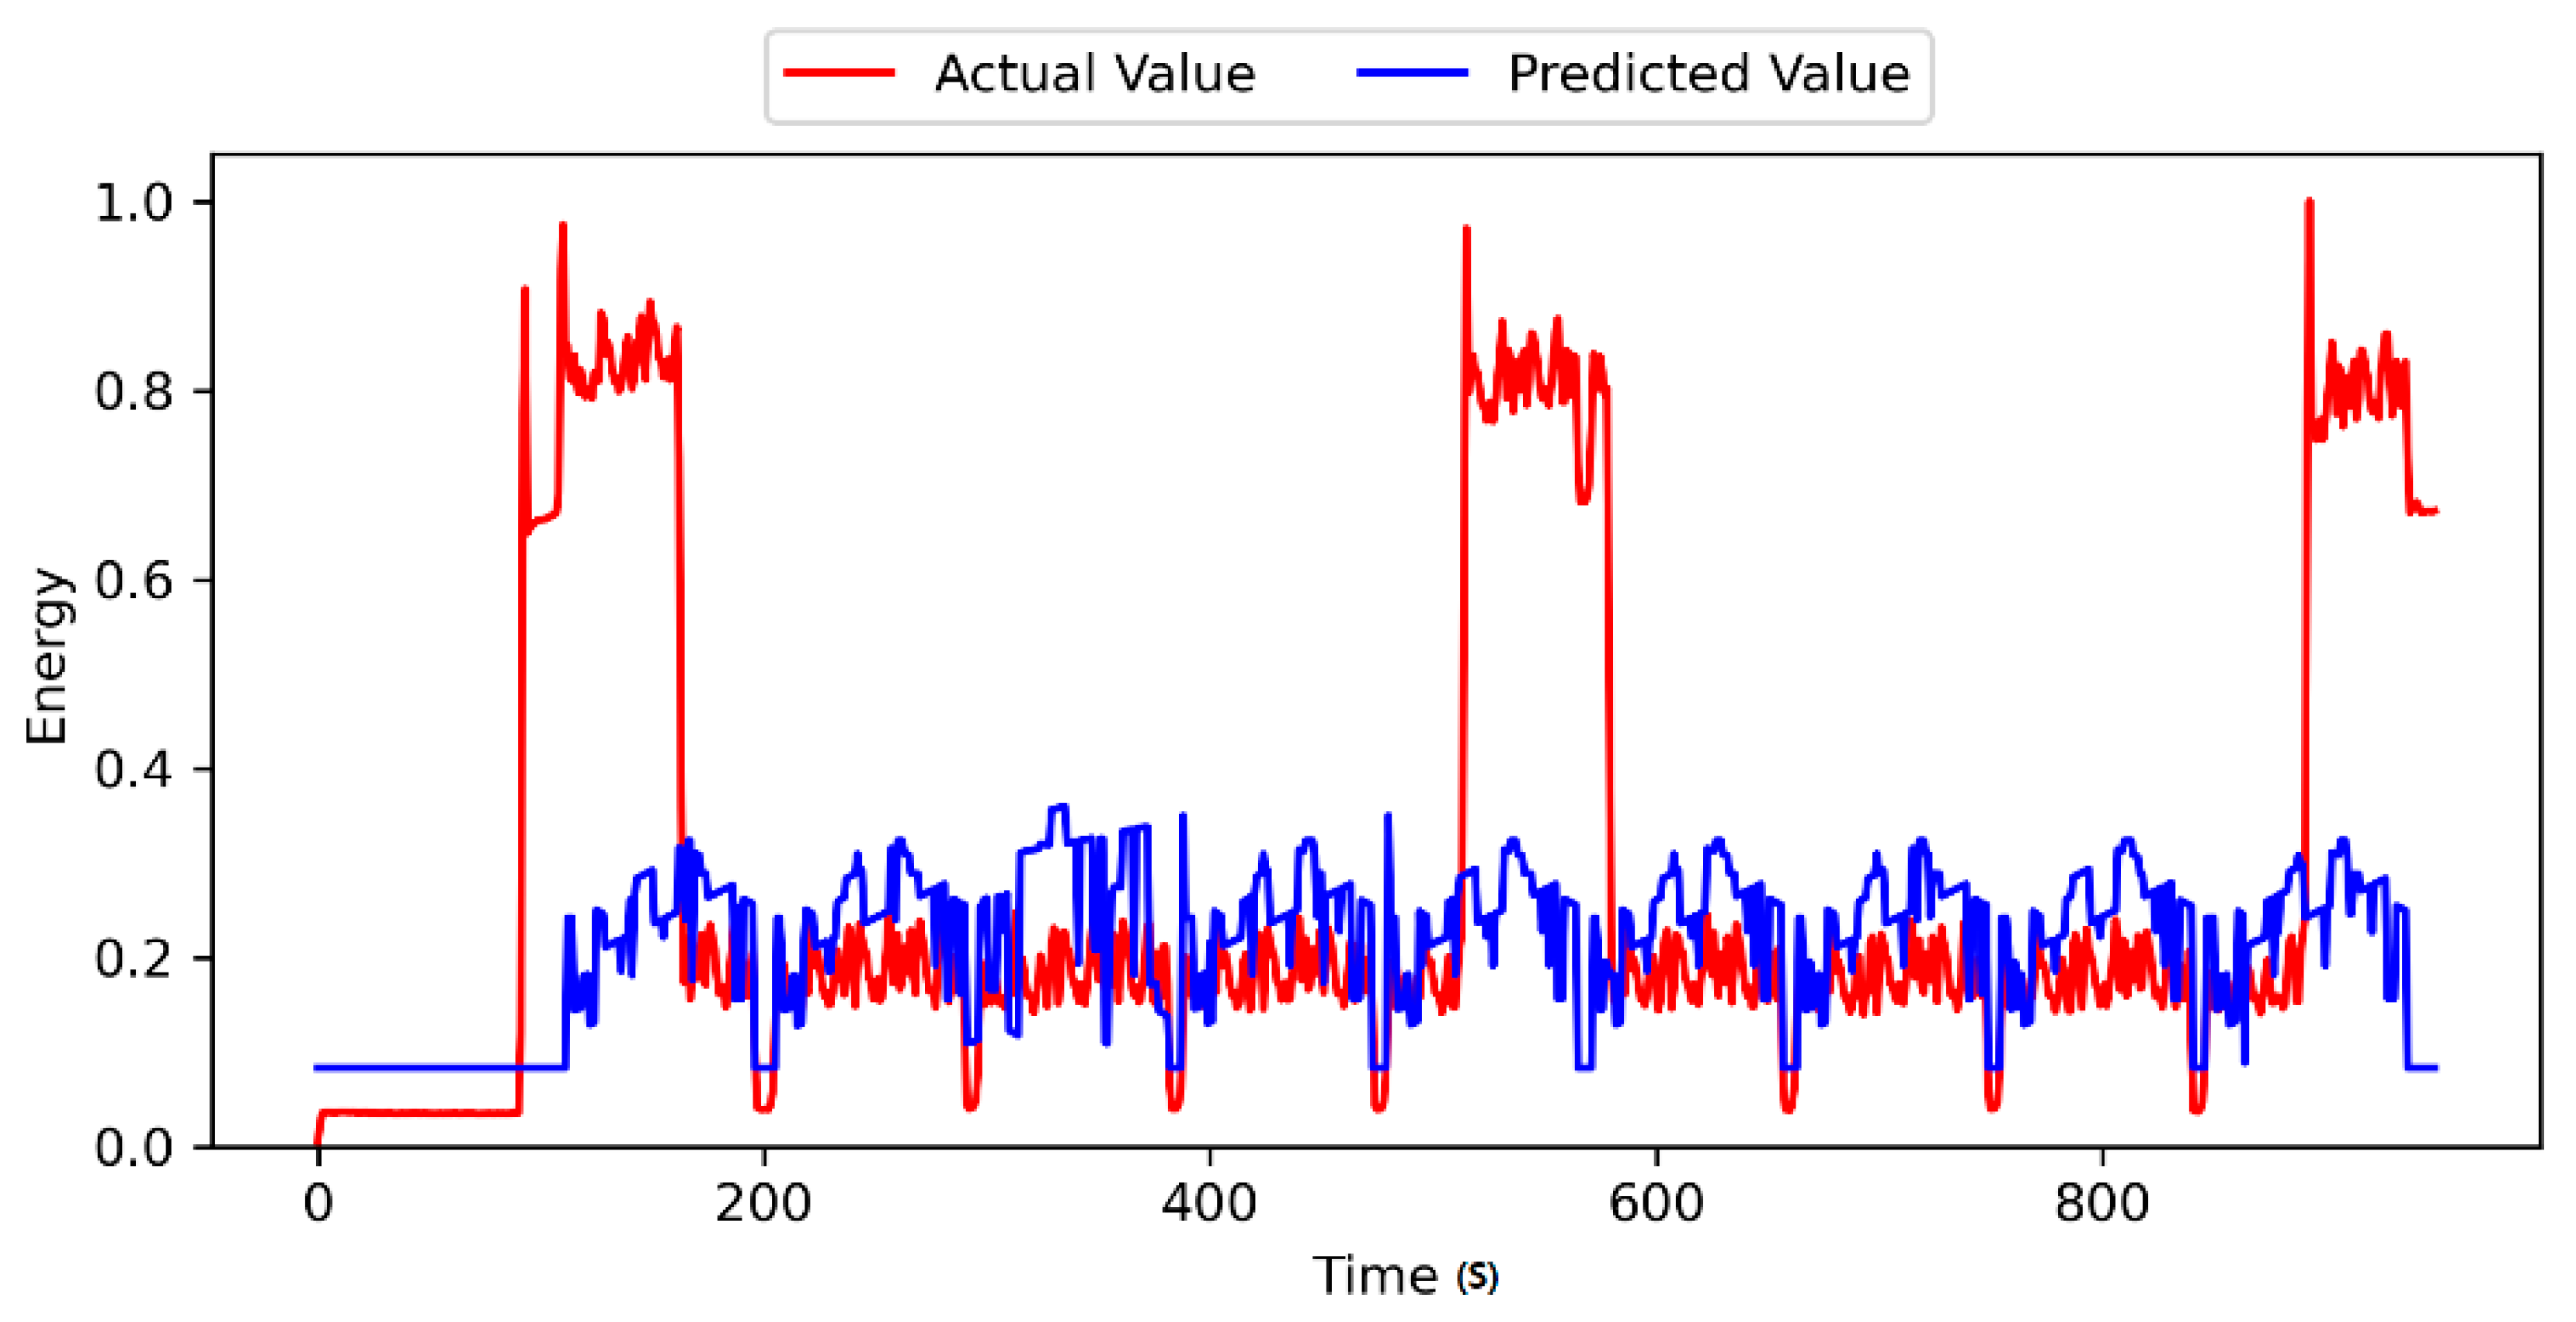
Thus, it is possible to determine what kind of operation type runs at each moment when obtaining a power profile. This enables synchronization between the power and OCR. The operations that result in high-power profiles can also be specified through classifying types of the robot arm. The power profile can be significantly splashed by elements other than the teach pendant. In this case, the power profile generated by the teach pendant can be accurately screened relative to the results of the pre-trained algorithms that predict the usual power profile through operation.
5. Discussion
The proposed pipeline provides a data-driven power analysis encompassing pre-processing, on/off identification, operation classification, and profile regression to verification. This pipeline can aid in implementing an innovative EMS based on a cyber-physical system. The proposed pipeline also resolves the difficulty in power prediction for the entire production line. The results of the experiment implied that an EMS can be evolved if power analysis accommodates the following functionalities:
Extract power values for a specific machine or specific process from multiple machines or processes, and re-organize process plans by detecting power peak times to avoid excessive power consumption in a short interval.
Synchronize the data obtained from multi-sensors, including a power meter and teach pendant, which may be connected with IoT networks on a shop floor, along timestamps to compose a well-prepared data set for energy prediction and optimization.
Identify the amount of power consumption in each machine program and correlate the power with the machine program.
Compress power profile data by using the latent space of the auto-encoder to reduce the size of data sets, thereby reducing the burden of a database.
This study demonstrated the possibility of the application of deep learning to power prediction. However, a limitation is that the proposed pipeline should be developed whenever a new manufacturing facility is deployed. To overcome the limitation, a method to generalize the learning model using data entities as defined in ISO standards is needed.
6. Conclusions
In the study, a method and experiments were provided to predict power consumption, to compress large amounts of power data effectively, and to predict power consumption by classification of operation types. The proposed method enabled an automated data pipeline for power estimation. The advantages of the proposed method are as follows: (1) power consumption is estimated using a machine program, (2) multiple sensor data coming from a multi-machine production line are separated to the power data for a specific machine or process, (3) the starting and ending points of each operation from a continuous power profile are identified to synchronize the operation with other sensor data or machine programs, and (4) a data set’s size is reduced by using the latent space of the auto-encoder.
However, the limitations of the proposed method are as follows: only the robot cell module was applied in the experiments, and scheduling algorithms were not integrated to embody the whole process of power-optimized process planning. We will attempt to consider all modules of the factory in future studies. Correction of data synchronization will be subsequently performed by increasing the resolution of power data.


