Article

Organic Waste Generation and Its Valorization Potential through Composting in Shashemene, Southern Ethiopia

1
Wondo Genet College of Forestry and Natural Resources, Hawassa University, Shashemene P.O. Box 128, Ethiopia
2
Department of Natural Resource Management, College of Agriculture, Wolaita Sodo University, Wolaita Sodo P.O. Box 138, Ethiopia
3
Forschungszentrum Jülich GmbH, Institute of Bio- and Geosciences (IBG-3, Agrosphere), 52425 Jülich, Germany
*
Authors to whom correspondence should be addressed.
Sustainability 2022, 14(6), 3660; https://doi.org/10.3390/su14063660
Submission received: 22 February 2022 / Revised: 15 March 2022 / Accepted: 16 March 2022 / Published: 21 March 2022
(This article belongs to the Section Waste and Recycling)

Abstract

:
Composting organic waste and human excreta could significantly reduce the amount of waste dumped and increase soil fertility and agricultural yields. However, studies focusing on the replacement of mineral fertilizer with compost from these resources are rare. The presented study quantifies the potential of human excreta and other organic waste for compost production. During wet and dry seasons, the generation and composition of household solid waste (HSW) was measured from three wealth categories: poor, medium, and rich, as well as the organic waste generated from 20 commercial facilities. Furthermore, the amount of human excreta, when converting unimproved into ecological sanitation facilities, was assessed. The HSW generation was significantly higher in the wet (0.77 ± 0.07 kg fresh weight (FW) cap−1 day−1) compared to the dry season (0.54 ± 0.04 kg FW cap−1 day−1). Organic waste was the main component of HSW in the dry and wet seasons, accounting for 84% and 76% of the total HSW, respectively. Annually, about 6824 Mg of organic dry matter could be collected from households, 212 Mg from commercial units, and 12,472 Mg from ecological sanitation. With these resources, 11,732 Mg of compost could be produced annually and used for fertilizing 470 ha of farmland, completely replacing mineral fertilizer.

1. Introduction

Waste management affects everyone, but the most vulnerable in society are the most affected by the negative impacts of poor waste management. Most often, these groups suffer from pollution-related severe health problems, e.g., due to attracted disease vectors, pathogens, or toxic compounds [1,2,3]. It is thus alarming to hear that the global municipal solid waste generation rate of 2.1 × 10⁹ Mg year−1 (data from 2016) is expected to double by 2050, with the largest increase in countries with insufficient waste management systems [3,4].
Municipal solid waste (MSW) is characterized as materials that are discarded from residential, commercial, institutional, and industrial (without non-process waste) sources. Hence, the term “MSW” normally refers to all types of waste generated in a community, except for waste generated by municipal services, treatment plants, and industrial and agricultural processes [5]. Household solid waste (HSW), i.e., domestic waste or residential waste, in turn, is defined as materials discarded from residential areas only [5,6].
Compared to the average global waste production rate of 0.74 kg cap−1 day−1, the daily waste production rate of countries in sub-Saharan Africa (SSA) is the lowest in the world at 0.46 kg cap−1 day−1. However, although 174 x 106 Mg of waste was generated in SSA in 2016, this is amount is expected to quadruple by 2050. Thus, this increase in waste production occurs at a higher rate than for any other region in the world [3,7]. The main factors contributing to the high projected amount of solid waste in SSA in 2050 are its fast-growing population, rapid urbanization, a growing middle class, the rising import and consumption of packed products, and a growing tourism sector, but also global waste trade and trafficking [3,8].
Ethiopia had one of the lowest average waste generation rates in SSA in 2016, at 0.18 kg cap−1 day−1 [3]. Globally, the waste generation rates of urban areas are significantly higher than the countries’ average [1]. For Ethiopian urban areas, the waste generation rates range from 0.17 to 0.56 kg cap−1 day−1 (Table 1).
In developing countries, HSW usually contributes 75% of the total MSW generated [20]. Wealthier areas within a city usually contribute a significantly larger share of HSW cap-1 day-1 compared to poorer areas, with HSW generation rates ranging from 0.11 to 1.57 kg cap−1 day−1 [3] (Table 1).
Similar to the observations worldwide, in Ethiopian cities, HSW contributes the largest proportion of all MSW generated, accounting for 70–87%, followed by commercial waste, ranging from 9 to 13% [13,19].
Improper waste management has a huge impact on health, climate, the environment, and even the economy, which means that the costs of dealing with the damage caused is higher than the initial cost of proper waste management [6,20]. For this reason, Coffey [21] states that solid waste management is one of the top five challenges city governments face almost everywhere in the world.
In Ethiopia, as in many other SSA countries, waste disposal is characterized by uncontrolled dumping and open burning, with limited disposal in sanitary landfills, or the diversion of waste away from landfills towards reuse, recycling, and recovery [19]. This is in line with the average MSW recycling rate in SSA of only 4% due to a lack of public recycling systems [8].
In SSA, organic waste, such as food waste, animal manure, and human excreta, undergo the same fate as the rest of the MSW. Human excreta are even discarded into open water bodies without any further treatment, as less than 25% of all wastewater in SSA (except for the Republic of South Africa) is treated in a hygienically safe way [22]. This does not only lead to environmental pollution, but also to a spread of neglected tropical diseases and diarrhea [23,24]. Child mortality due to diarrhea, which is caused by a lack of safe drinking water, hygiene, and access to clean toilets, is consequently highest in SSA [25,26]. This is all the more true for Ethiopia with its lack of proper sanitation and safe disposal or recycling of human excreta, and with the rural population being most vulnerable to infectious diseases, including pneumonia, diarrhea, and malaria [26].
On the other hand, human excreta are not only a threat to human health and the environment. Following the approach of “Ecological Sanitation”, they can instead be considered a nutrient-rich resource that could help to meet the demand of smallholder farmers in developing countries for affordable complete fertilizers, if treated safely [27,28,29,30]. One method for the safe treatment of organic waste, including human excreta, is thermophilic composting [30,31,32]. Due to the high microbial activity and the high temperatures of a proper thermophilic composting process, organic matter will be transformed into humus, while pathogens and weed seeds will be eliminated and a wide range of organic pollutants degraded [31,33,34,35]. Another advantage of composting is the decrease in the mass and volume of the composted materials. During thermophilic composting, a significant mass loss of the fresh matter can occur due to (i) water evaporation, (ii) the release of carbon dioxide due to the intense microbial degradation and humification processes, and (iii) losses of nutrients through volatilization, leaching, and run-off [36]. However, nutrient losses via leaching and run-off can be minimized in a roofed composting facility, as long as the appropriate moisture content of the compost piles of 40–65% is maintained [32,37]. For hygienization, turning the compost piles during the thermophilic phase should be mandatory, especially when composting human excreta [31,32]. Taking these requirements into account, recycling the nutrients from urban organic waste (including animal manure and human excreta) via thermophilic composting and using this compost as a fertilizer and soil amendment for agriculture could be a means of closing the loop of nutrients between urban and rural environments [31,38,39,40]. Supplying the produced compost to smallholders could not only help to increase soil fertility and food security, but also tackle climate change by the concomitant humus build-up in soil [30,38,41,42,43].
Despite these advantages, the recycling of organic waste and human excreta is only practiced to a limited extent, most often due to a lack of awareness, infrastructure, responsible institutions, and landownership [8,40,41]. Furthermore, as Muheirwe et al. [44] pointed out, effective policymaking and implementation relies on adequate data. However, for SSA in general and Ethiopia in particular, regular data on solid waste management are lacking, and sometimes the methods used are inconsistent or not documented [44,45].
Holistic studies that evaluate the amount, composition, and seasonal variability of different organic wastes to identify the potential of nutrient recycling between urban and rural environments by integrated waste management and the application of ecological sanitation are rare, especially for SSA [8,40,46]. To the authors’ knowledge, no study has analyzed and reflected on these aspects in the Ethiopian context. Therefore, a holistic approach was applied in this study by analyzing different waste management parameters and evaluating the potential for recycling the organic waste fraction in a typical, fast growing town in Ethiopia, i.e., Shashemene. In such a city, the consequential effects of rapid urbanization and economic development led to a rapid increase in waste and waste management problems [6]. The main objectives of this study were to quantify and identify (i) the generation and composition of HSW in different seasons and socioeconomic groups, (ii) the organic waste generated from commercial facilities, (iii) the human excreta generated from unimproved sanitation facilities, and (iv) to explore the potential to produce compost from these different types of organic waste.

2. Materials and Methods

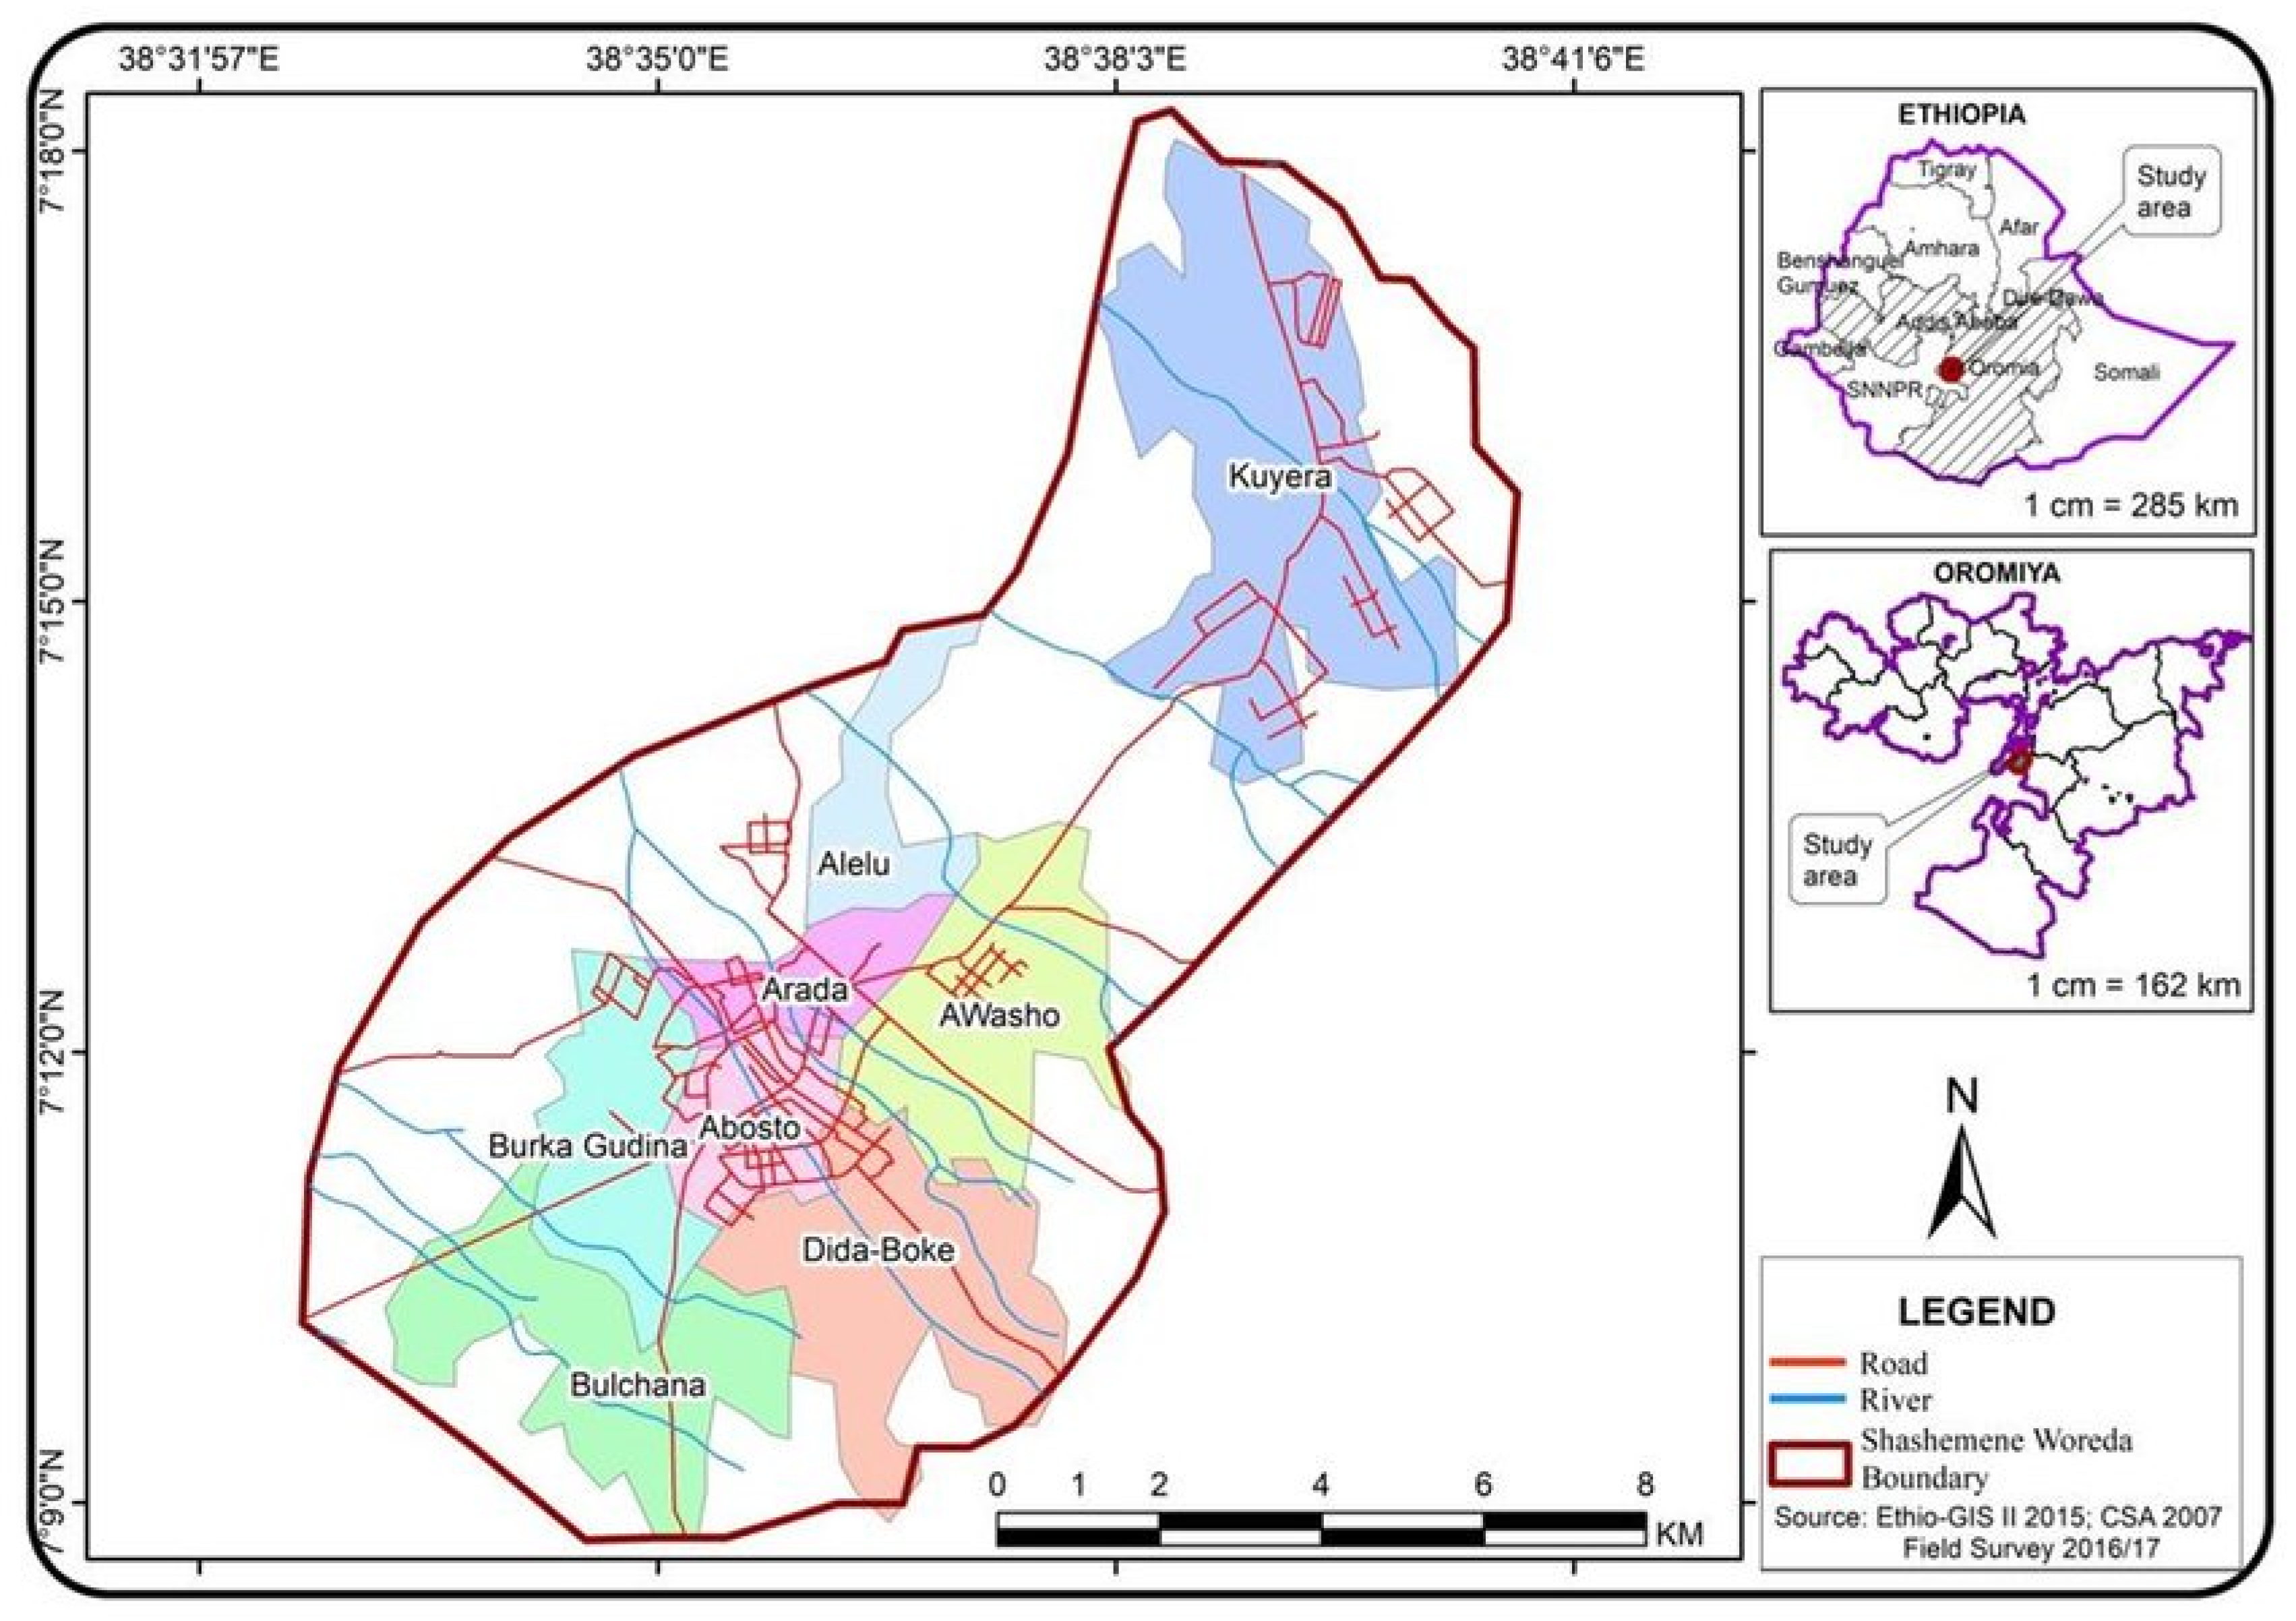
2.1. Description of the Study Area

The study was conducted in Shashemene town, West Arsi zone, in southern Ethiopia (Figure 1). Geographically, it is located between 7°9′ N to 7°18′ N latitude and 38°32′ E to 38°40′ E longitude, with an average altitude of 1918 m above sea level within the Ethiopian Rift Valley.
According to Shashemene municipality [47], the total population of Shashemene was 264,780 in 2016. Shashemene town is situated on a route used for trade, which connects Ethiopia with Kenya [48]. The town is located in a strategic position, connecting several cities in the southern part of Ethiopia, which enabled it to become a commercial center in the region. The climate is characterized by a bimodal distribution with a small wet season from March to May, the main wet season from June to September, and a dry season from October to February (due to the small amount of rain in March, April, and May, we defined the dry season in this study from October to May). Temperatures range from 12 to 28 °C and annual rainfall varies from 1500 to 2000 mm [49]. Cities in Ethiopia have the following organizational scheme: city, sub-city, woreda, kebele. Sub-city is the term for a district within a bigger Ethiopian city. Shashemene consists of eight sub-cities, namely Arada, Abosto, Burka Gudina, Alelu, Kuyera, Awasho, Bulchana, and Dida Boke (Figure 1). The low-income sub-cities (Arada, Abosto, and Burka Gudina), where the majority of the residents live, are associated with heavily crowded neighborhoods and poor infrastructure and services. In the middle-income sub-cities (Alelu and Kuyera), planned and moderate housing types dominate, but with small compounds and being less crowded compared to the low-income areas. Here, there is limited access to public facilities such as paved roads and electricity. In contrast, the high-income sub-cities (Awasho, Bulchana, and Dida Boke) consist of well-planned houses with large compounds and paved, clean surroundings, as well as good infrastructure like roads, sewage tanks, water, and electricity. Residents in these areas have a comparatively high socioeconomic status and most of them are engaged in business activities.

2.2. Socioeconomic Surveys

To assess the current situation of sanitation and waste management in Shashemene, socioeconomic surveys, interviews, and field surveys were conducted. Socioeconomic surveys for identifying the current situation of sanitation and waste management consisted of (a) four expert interviews with the following governmental institutions: two expert interviews with municipality workers and two experts with employees of the health office, (b) a survey with 90 households (HH), and (c) field walks with five key informant interviews.
For the HH survey, a two-stage sampling design was used. In the first stage, residential areas were clustered based on the socioeconomic status of the population (low, middle, and high-income areas based on information from the city municipality). Following the classification, out of the eight sub-cities of Shashemene, the three sub-cities of Arada, Alelu, and Bulchana were randomly selected to represent low, middle, and high-income areas, respectively. In the second stage, 90 HH were selected randomly from the three sub-cities based on the socioeconomic category of the three selected residential areas. In order to do so, a list of residents obtained from the Kebele (i.e., the smallest administrative unit in Ethiopia) was used. In total, 30 HH were selected from each income class (i.e., from residential areas of the respective sub-cities), as recommended by Nordtest [50].
The expert interviews covered the topics of (i) existing sanitation conditions, i.e., access to toilets and sanitation type, and (ii) waste management system, i.e., waste collection types, disposal sites, and challenges in waste management.
During the field surveys, key informant interviews were carried out with individuals who were knowledgeable about their community situation, the culture of the community, and were willing to share their knowledge [51]. From each selected sub-city, five key informants participated in the interviews to supplement and substantiate the findings from the interviews with the municipality and HH. These systematic walks with key informants were conducted to observe the current sanitation and waste management practices in the town.

2.3. Field Surveys

For collecting quantitative data, field surveys on the amount and composition of waste from (a) 90 HHs from three sub-cities and additionally from (b) 20 commercial facilities (hotels, restaurants, and juice bars) were conducted.

2.3.1. Survey on Amount and Composition of HSW

The minimum number of HSW samples for waste analysis was determined using Equation (1) [52].
n = [ z ( SD ) / R ]   2
where:
  • n = minimum number of samples for waste analysis;
  • z = value for a selected alpha level of each tail = 1.96 (the t-value for the alpha level of 0.05 is 1.96 for the sample size selected; the alpha level of 0.05 indicates the level of risk the researcher is willing to take that true margin of error may exceed the acceptable margin of error);
  • SD = standard deviation of the population, equal to the standard deviation of the preliminary sample;
  • R = acceptable margin of error for mean being estimated (5%) at the 95% confidence level.
At z = 1.96, SD = 0.59 and R = 0.05 (estimate of standard deviation in the population), n = 540 samples of solid waste. Hence, this number of solid waste samples was collected. The sampling of waste was carried out in both the dry (October in 2018 to May 2019) and the wet season (June to September 2019). The two different seasons were selected because of their potential effect on the composition, quantity, and peak days of HSW [53].

2.3.2. HSW Collection and Processing

For characterizing the composition of the HSW, two polyethylene bags of 100 L volume were supplied to each HH for the separation of organic and all other wastes. The classification of the different types of waste followed the classification in Hoornweg and Bhada-Tata [6] as displayed in Supplementary Table S1. Following the method presented in Philippe and Culot [54], the waste was collected twice a week for 21 days, i.e., a total of 6 days.

2.4. Determination of HSW Generation Rate and Composition

For the determination of the per capita HSW generation rate, the total quantity of daily generated HSW and the number of family members were considered according to Equation (2) by [54].
HSW   generation   rate   ( kg   cap 1 day 1 ) = i = 1 i = 6 wi 21   p
where wi = total waste weight obtained from a daily collection; i = total days for waste collection (twice a week for three weeks, i.e., 6 days in total, and 21 days in three weeks); and p = population of the surveyed HHs.
The total amount of HSW generated by all HHs in a city was calculated according to Equation (3).
Total HSW (kg day−1) = Number of population in the city × HSW (kg) cap−1 day−1
The proportion of each waste fraction of HSW was determined using Equation (4) according to Hoornweg and Bhada-Tata [6].
Fraction   from   HSW   ( % ) =   HSW   waste   fraction   FW total   HSW   FW   ×   100 %

2.5. Waste Generation of Commercial Facilities

According to Shashemene municipality office [47], there were 457 commercial facilities in total, which were generating waste that contained significant amounts of organic waste (hotels, restaurants, and juice bars) in Shashemene. Based on the procedure from the WHO [55] for surveying solid waste generation from different producers, like hotels and restaurants, 10–20 samples were recommended. For this study, 20 samples were taken two times and the sampling of waste was carried out in both the dry (October 2018 to May 2019) and the wet season (June to September 2019). The total amount of commercial solid waste (CSW) generated was calculated using Equation (5).
CSW generation rate (kg day−1) = 457 commercial facilities × waste (kg) generated facility-1 day−1
Thereafter, for determining the organic waste fraction of the CSW, Equation (6) was applied:
OCW   ( % ) = Organic   Waste   from   commercial   units CSW × 100 %  
where OCW = organic waste fraction produced by commercial units (hotels, restaurants, and juice bars).

2.6. Obtained Human Excreta after Conversion of Unimproved into Ecological Sanitation

According to Shashemene’s municipality office [47], only 50% of all HHs in the city had access to improved sanitation facilities, i.e., toilets with a septic tank or pit latrines with a platform, in the form of private toilets. The rest of the HHs (50%) used unimproved latrines without a platform. It was assumed that mainly HHs using unimproved sanitation facilities would benefit from the introduction of ecological sanitation toilets that allow the collection of the waste for further recycling. An ecological sanitation model that uses dry toilets, which collect urine, feces, and toilet paper together, using sawdust as an adsorbent material for avoiding smell, was considered. In these dry toilets, all materials are collected together in 20 L buckets, which have a lid and can be stored for several months without odor until they are used for thermophilic composting [56,57,58].
We therefore considered only 50% of Shashemene’s population for the further calculation of the amount of human excreta, as they are the population group benefiting from the introduction of ecological sanitation facilities:
HE (kg DW day−1) = N × 98 g cap−1 day−1
where:
  • HE = daily production of human excreta from unimproved sanitation facilities, which can be converted into ecological sanitation facilities, in Shashemene;
  • DW = dry weight;
  • N = number of people using unimproved sanitation facilities.
The DW of human excreta was assumed as 39 g feces cap−1 day−1 (for low-income countries) and 59 g urine cap−1 day−1, which is 98 g per cap-1 day-1 in total, according to Rose et al. [59].

2.7. Estimation of Compost Produced from Organic Waste and Human Excreta

For the production of hygienic, safe compost from ecological sanitation via thermophilic composting, human excreta has to be mixed with other organic waste in a way that the compost piles show (i) an optimal carbon to nitrogen ratio (C/N 20–40), (ii) content of easily degradable material, (iii) an oxygen concentration of 15–20% by choosing appropriate bulking materials or ventilation systems, (iv) a moisture content of 40–65%, and (v) a pH value of 5.5–9 and a volume of the compost pile ≥ 1 m3. When doing so, the mixed and piled organic waste will heat up by the evolving microbial activity within a few hours to temperatures above 45 °C (thermophilic phase) and even to temperatures up to 80 °C, thereby ensuring hygienization. After peaking, the temperatures will slowly decrease again, reaching an ambient temperature again some weeks to months later. When the compost pile is turned, however, the temperature will shortly increase again to then slowly drop again [36,37,58].
This study and the composting study by Castro Herrera et al. [58] were both conducted as part of the ClimEtSan project, and both used organic waste from Shashemene. Castro Herrera et al. [58] additionally used human excreta from ecological sanitation. The study from Castro Herrera et al. [58] was conducted during the same period as the present study. Following the successful thermophilic composting method of Castro Herrera et al. [58], we used the following ratio of organic waste, bulking material (i.e., straw) and human excreta (on a DW basis) for our calculations:
Composting substrate mixture: 53% humanure (i.e., 18.5% human excreta and 34.5% sawdust plus toilet paper) + 30% vegetable and fruit scraps + 17% straw.
From this mixture of human excreta, sawdust, vegetable and fruit waste, and straw, about 50% of the dry matter will be lost in the course of composting due to microbial degradation and transformation processes [36].
Thus, the yearly compost production potential from organic waste and human excreta in Shashemene can be calculated considering the following assumptions in accordance with [58]:
C (kg DW year−1) = (OW + HE + Ad + BM) × 0.5
  • C = produced DW of mature compost;
  • DW = dry weight;
  • OW (kg DW year−1) = 1.6 × HE (kg DW of organic waste from HSW and CSW);
  • HE (kg DW year−1) = yearly amount of human excreta = daily kg DW of HE × 365 days;
  • Ad (kg DW year−1) = adsorbent (e.g., sawdust) = 1.9 × HE (kg DW year-1);
  • BM = bulking material (straw) = 92% × HE (kg DW year-1).

2.8. Potential of Compost from MSW and Human Excreta to Be Used as Fertilizer in Agriculture

In order to assess the fertilization potential of the compost produced from human excreta and the organic fraction of MSW, we again used the data provided by Castro Herrera et al. [58]. For compost produced from organic waste, straw, sawdust, and human excreta, they reported a total nitrogen (TN) content of 0.15 g kg−1. For the field application of this compost, it was assumed that under the tropical conditions prevalent in Shashemene, 20% of the TN of the compost would be available in the first year after application [60].

2.9. Statistical Analysis

Correlation analysis was used to measure the relationship between waste generation rate, waste composition, and socioeconomic characteristics such as HH income, HH size, and income classes. The statistically significant differences in waste composition and generation rate depending on income class, family size, and educational level were analyzed using one-way analysis of variance (ANOVA) and variation among the seasons using the Student’s t-test. All statistical analyses were performed using Stata version 14 (Stata Corp., College Station, TX, USA, 2015) and SPSS Statistics for Windows, version 25.0 (IBM Corp., New York, NY, USA, released 2017). For the comparison of the mean and statistical differences, we used the Tukey test. All analyses reported in this study are at p < 0.05.

3. Results

3.1. Socioeconomic Survey on Household Solid Waste

3.1.1. Socioeconomic Characteristics of Sample Households

In the HH survey, the majority of the respondents (74%) were male and between 30 and 45 years old (57.8%). Most of them had received formal education or even a college or university degree (72%). However, this was not equally reflected in their income, as 36% of the respondents considered themselves poor (Supplementary Table S2). Most respondents were either involved in business activities (47.8%), or belonged to the group of daily wage workers (35.6%), but only a few of them were involved in farming (3.3%; Supplementary Table S2).

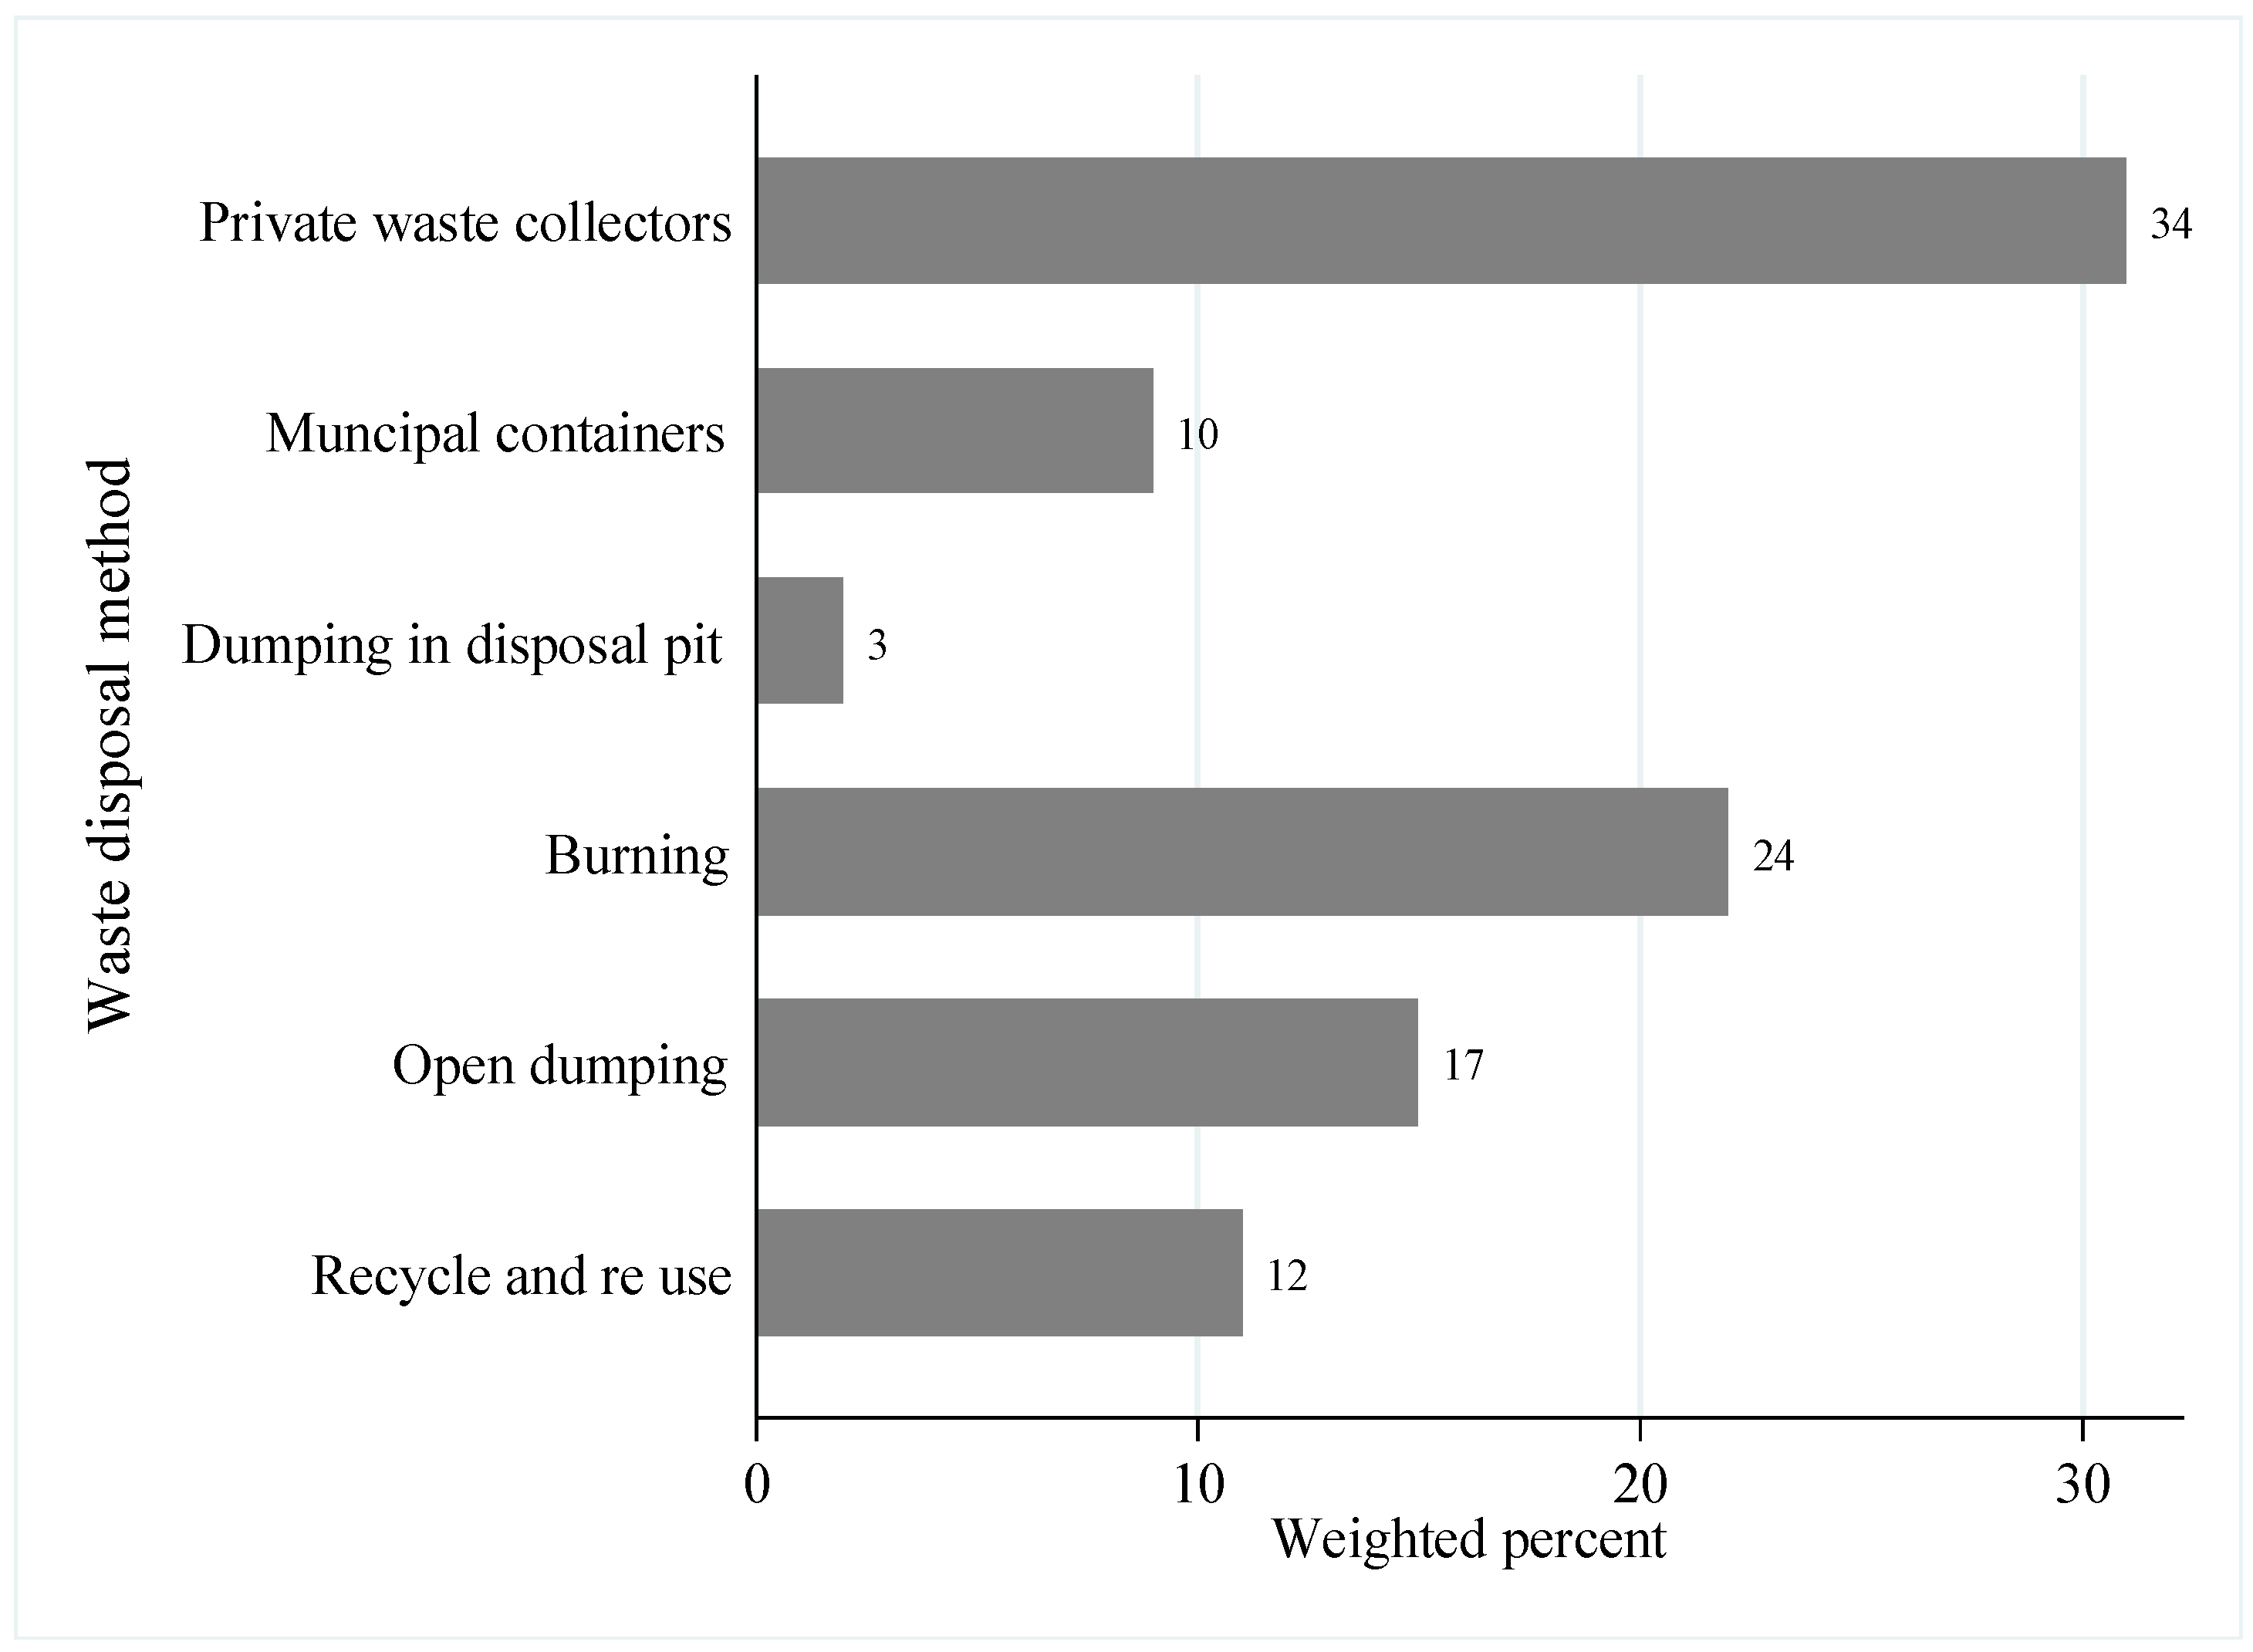
3.1.2. Household Solid Waste Disposal Practices

The socioeconomic survey revealed that giving HSW to private waste collectors and burning the waste are the dominant HSW disposal practices in Shashemene (Figure 2), while the latter is usually used by those residents who do not have access to services like private collectors and municipal containers. This is also the reason why open dumping in the yard and along streets or roads is still a common means of waste disposal. In contrast, only a small proportion of the waste is recycled (Figure 2).

3.1.3. Household Solid Waste Generation Rate and Composition by Seasons

Organic waste was the major component (80.5%) of HSW and accounted for 85% (8.21 kg day−1 HH−1) and 76% (6.21 kg day−1 HH−1) of HSW in the dry and wet season, respectively (Table 2).

3.1.4. Household Solid Waste Generation by Income, Education Level, and Family Size

Daily HSW generation rate per person on a FW basis in the wet season (0.77 ± 0.07 kg FW cap−1 day−1) was 32% higher than in the dry season (0.54 ± 0.04 kg cap−1 day−1; Supplementary Table S3), displaying a significant difference (p < 0.05) between the two seasons for all wealth groups. Even though the amount of HSW was increasing with increasing wealth, we only found a significant difference between high-income and the other two income groups for the wet season (Supplementary Tables S3 and S4).
Overall family size showed a negative correlation with per capita HSW generation both in the dry (R= −0.64, p < 0.001) and wet season (R= −0.57, p < 0.001). Still, the daily HSW generation rate per capita was only for families with > 9 family members, significantly lower than that of all other families with < 9 family members (p < 0.001; Supplementary Tables S4 and S5). With regard to the season, small- and medium-sized families (1–9 family members) showed a significantly higher HSW generation rate in the wet compared to the dry season, whereas the difference for big families with > 9 persons was also visible, but not significant.
We did not observe a significant difference between education level and the HSW generation rate in either season (Supplementary Tables S4 and S6).

3.2. Waste Generation of Commercial Facilities in Shashemene

Commercial facilities, like hotels, restaurants, and juice bars, produced about twice as much and therefore significantly more organic waste in the wet compared to the dry season (Table 3). Annually, on average, about 75% of all commercial waste consisted of organic materials.

3.3. Waste Generation from Unimproved Sanitation in Shashemene

In 2019, about 50% of all HHs in Shashemene did not have access to improved sanitation, according to Shashemene’s municipality office [49]. Considering a total population of 264,780 [47], we assumed that 172,107 people in Shashemene were using unimproved sanitation. These sanitation facilities could easily be converted to ecological sanitation. Considering a daily amount of 98 g dry weight (DW) of feces and urine, those ecological sanitation facilities would produce 16.87 Mg of human excreta per day [60]. Annually, this would result in 6156 Mg DW of human excreta, which could be recycled via thermophilic composting.

3.4. Production Potential of Compost in Shashemene

Assuming an average moisture content of 86.5% for fruit, vegetable, and other food waste (range of 62–93%, [58,61,62,63]), an annual amount of 6824 Mg (DW basis) of organic waste from all HHs, 212 Mg (DW basis) of organic waste from 457 commercial units, as well as 4301 Mg of human excreta waste from dry toilets could be utilized for the production of compost in Shashemene. With regard to the requirements for establishing an odorless ecological sanitation system and a well-running thermophilic composting process, i.e., the use of adsorbent materials for the dry toilets (straw or coffee husk) and bulking materials for composting, about 11,732 Mg of mature compost (DW), i.e., 19,553 Mg of mature compost (FW, assuming a moisture content of 40%) could be produced per year in Shashemene (Table 4).

3.5. Fertilization Potential of Produced Compost

Castro Herrera et al. [58] used waste resources from Wondo Genet and Shashemene and reported that the compost produced from organic waste, human excreta, sawdust, and straw contained significant amounts of macronutrients, namely 1.5% of TN, 6.33 g kg−1 total phosphorus (TP), 30.03 g kg−1 total potassium (TK), 21.4 g kg−1 total calcium (TCa), 3.3 g kg−1 total magnesium (TMg), 0.93 g kg−1 available phosphorus (Pav), and 3.86 g kg−1 available potassium (Kav), and a range of micronutrients, namely, 95 mg kg−1 zinc (Zn), 13 mg kg copper (Cu), 5 mg kg−1 iron (Fe), 236 mg kg−1 manganese (Mn), 18 mg kg−1 boron (B), 3 mg kg−1 molybdenum (Mo).
Taking the TN content into account and assuming an N release of 20% in the first year [60], an amount of 11,732 Mg DW compost would release 70.39 Mg of available N in the first year after field application. Considering an N demand of 75 kg available N ha−1 for maize [64], the produced compost could completely replace mineral N fertilizer on 939 ha of agricultural land (i.e., about 25 Mg compost DW ha−1). As most smallholder farms are not bigger than 0.5 ha, this means that at least 1878 smallholder farmers could completely replace mineral N fertilizer with compost.
In addition to the amount of 75 kg available N, an amount of 25 Mg compost would contain 23.5 kg of Pav (158 kg TP), 96.5 kg Kav (750 kg TK), 535 kg TCa, and 82.5 kg TMg, thereby also meeting the demand of the most commonly grown crops in the Shashemene area for these macronutrients (Table 5), considering a crop rotation and plant availability of total nutrient contents to plants in the midterm.

4. Discussion

4.1. Household Solid Waste Generation and Composition in Shashemene

Household (family) size, wealth status, and sampling season were the most important factors determining the HSW generation rate in Shashemene (Table 2, Supplementary Tables S4 and S5). In our study, the HSW generation rate in the wet season was 32% higher than in the dry season (Table 2). Similarly, Getahun et al. [13] reported food waste generation in the wet season to be 40% higher than in the dry season in Jimma city, Ethiopia, which they attributed to a higher production and consumption of vegetables and fruits during this season. The same is true for Shashemene, where significantly more food waste was produced in the wet compared to the dry season (Table 2), and we thus confirm the conclusion of Getahun et al. [13]. The increased consumption of fruits and vegetables in the wet compared to the dry season can be explained by their higher availability during this time [76,77,78].
The average HSW generation rate in Shashemene (0.65 ± 0.48 kg cap−1 day−1) was higher than most of the HSW generation rates reported for other Ethiopian cities, with rates ranging from 0.22 to 0.56 kg cap−1 day−1 (Table 1). However, most of the cited studies did not take seasonal variability into account, therefore probably underestimating the amount of waste when solely taking samples in the dry season. The studies of Getahun et al. [13] and Fetene et al. [14] from Jimma, who took seasonal variability into account, reported HSW generation rates at 0.55–0.56 kg cap−1 day−1, which were close to our findings. Considering an estimated 5% annual increase in HSW, as suggested in some studies [79,80], and using the HSW generation rates reported by Fetene et al. [14], we obtained a mean HSW generation rate of 0.65 kg cap−1 day−1 for Jimma after four years (i.e., in 2020/2021), which is the same rate we found for Shashemene in 2020–2021.
According to Kaza et al. [3], the average waste generation rate for sub-Saharan Africa was 0.46 kg cap−1 day−1 in 2016, and was projected to reach 0.50 kg cap−1 day−1 by 2030 and 0.63 kg cap−1 day−1 by 2050. However, the authors stress that, even though data availability has been increasing significantly, the statistics on waste generation, collection, treatment, and disposal in sub-Saharan Africa are currently relatively limited. Globally, a yearly per capita waste generation rate of 0.65 kg is among the lowest in the world [3].
In our study, the per capita HSW generation rate showed a negative correlation with HH size (Supplementary Tables S4 and S5), which is in line with findings from Getahun et al. [13]. This observation can most likely be explained by more efficient use of food and food leftovers for bigger HHs [81]. This is especially true when these HHs belong to the low-income class, which, in this study, showed smaller per capita HSW generation rates compared to HHs that were in a better financial position (Supplementary Table S3).
Getahun et al. [13] and Noufal et al. [81] found that the educational status of HHs was negatively associated with per capita HSW generation, which they explained with the awareness of the HHs in reducing the amount of waste in accordance to their education level. Following this line of argumentation, HHs in Shashemene seemed to have a similar awareness with regard to their education level. In general, a lack of awareness of waste reduction by source reduction and waste separation is one of the challenges in waste management in Ethiopia [80].
We found that organic waste accounted for 85% and 76% of Shashemene’s HSW in the dry and wet season, respectively (Table 2). On a yearly average, 80% of Shashemene’s HSW consists of organic materials that could be recycled and converted into compost (Table 2). Kaza et al. [3] report that in low- and middle-income countries, waste consists of more than 50% organic waste (especially food and green waste). For low-income countries, this proportion reached an average of 64% (and 67.4% for Ethiopia), which is significantly higher than the global average of 46% [6,80]. The proportion of organic waste from our study is thus consistent with these reports and, furthermore, are in line with similar findings from Ethiopian cities and other cities from low- and middle-income countries. Here, researchers found that organic waste accounted for 60% of the waste in Jimma, Ethiopia [13], 74% in Addis Ababa, Ethiopia [19], 88.5% and 94.8% in Kampala, Uganda, for the wet and dry season, respectively [82], 73–83% for different urban centers in Uganda [83,84], 65% for Moshi, Tanzania, 75% for Dar es Salaam, Tanzania, 68% for Kigali, Rwanda, and 65% for Nairobi, Kenya [84]. In the cities of SSA, the large proportion of organic waste can be attributed to the daily practiced preparation of fresh food on the one hand, on the other hand it points to the limited financial resources for the consumption of other goods [3,6,84].

4.2. Organic Waste Generation by Hotels, Restaurants, and Juice Bars

Similar to the HH sector, waste from the commercial sector, i.e., from hotels, restaurants, and juice bars, showed twice the amount of organic waste in the wet compared to the dry season—a significant difference between the two seasons (Table 3). This finding is in contrast to Getahun et al. [13], who did not find any significant difference in the organic waste production of the commercial sector between the different seasons. We therefore assume that for Shashemene, the higher amount of organic waste in the wet compared to the dry season can be explained by the higher availability and lower price of vegetables and fruits, leading to increased consumption in hotels, restaurants, and juice bars [76,77]. However, organic waste from hotels, restaurants, and juice bars accounted for only 3%, while the HH sector accounted for 97% of the total organic waste produced in Shashemene (excluding waste from sanitation; Table 4). This proportion is lower than the proportion of solid waste from the commercial sector in Jimma city, where Getahun et al. [13] found that waste from all commercial facilities accounted for 13% of the total solid waste. However, as only hotels, restaurants, and juice bars were included in this survey, and no other commercial facilities, it is assumed that the presented results are valid.

4.3. Sanitation and Human Excreta

When considering the whole population of Shashemene (264,780 people), the amount of human excreta (8602 Mg DW year−1) created would exceed the total amount of all other organic waste (7036 Mg DW year−1) by 1.2 times. However, in this study, we only considered the amount of human excreta from unimproved sanitation, used by about 50% of the population of Shashemene (Table 4), likely due to the higher demand for improved sanitation, such as dry toilet-based ecological sanitation or container-based sanitation (CBS) [85]. For CBS systems, instead of water, dry cover materials (sawdust, charcoal powder, or unused by-products of agricultural production) are used to avoid smells and for adsorbing moisture from urine and feces. It is, thus, a waterless sanitation approach that saves considerable amounts of water compared to flush toilets [86]. Considering the amount of cover material required, about 1.9 times the amount of excreta DW has to be taken into account [58] for providing a sanitation environment free of smell.

4.4. Potentials and Challenges for Producing Compost out of Organic Wastes

The predominant amount of waste in Ethiopia is dumped on open dumping sites [8], thereby causing environmental pollution and releasing greenhouse gases (GHG) like methane (CH4) [45,80]. This is of particular importance, as MSW has been considered the third-largest source of anthropogenic CH4 gas in the environment, accounting for 3–4% of global anthropogenic GHG emissions. When only considering CH4, total waste sectors are responsible for approximately 18% of global CH4 emissions [4]. The average amount of CH4 released from dumping sites in low-income countries in general and in Ethiopia in particular can be considered larger than the world average CH4 release from open dumping sites, due to their large proportion of organic waste [45,87,88]. Consequently, a modeling study by Couth et al. [89] found that 8.1% of all GHG emissions from Africa originated from landfills, which was considerably more than the global average of 3%. The pressing issues of the climate crisis and environmental pollution in Ethiopia thus emphasize the need for a recycling of waste in general and more particularly of its organic fraction [90,91]. In our study, the expert assessment and key informant interviews revealed that major reasons for the low performance of MSW management were (i) insufficient waste disposal sites, (ii) a lack of properly designed collection systems, (iii) the open burning of garbage, (iv) the poor condition of the final dumpsite, and (v) poor institutional arrangements for waste disposal services. About 34% of all HHs relied on private waste collectors and only 10% of the community used municipal containers.
With regard to the case of Shashemene, putting an ecological sanitation system into practice that uses CBS and thermophilic composting, as, for example, described by Castro Herrera et al. [58] or Preneta et al. [92], about half of the population of Shashemene could be provided with dry toilets, all organic waste from HHs and commercial units could be recycled, and about 11,732 Mg of mature compost could be produced per year, thereby providing full fertilization for 940 smallholder farmers (or 470 ha of farmland; Table 4 and Table 5).
Introducing a waste management system that produces compost from human excreta, manure from urban livestock, and other organic wastes could therefore not only reduce the costs for MSW management, but also decrease environmental pollution and mitigate climate change [30,93]. Furthermore, the resulting higher availability of humus- and nutrient-rich compost could be a chance for smallholder farmers to access organic fertilizer and a soil fertility, restoring soil amendment [94]. Applying compost in agriculture could thus close urban–rural nutrient cycles and reduce the dependency on mineral fertilizer, while simultaneously improving soil structure and fertility, crop yields, and food security [29]. The IPCC [95] underlined the fact that the application of compost from municipal organic wastes can reduce about 20% of the currently applied amount of synthetic fertilizer. This is of particular importance for SSA, because here, prices for inorganic fertilizers are among the highest in the world [96]. Despite all of these advantages, only 4% of MSW in Africa is recycled due to institutional and economic challenges, as MSW recycling in general and organic waste recycling in particular requires appropriate institutions, awareness-raising, incentives, and careful monitoring and control [8,39,40].

5. Conclusions

In Shashemene, Ethiopia, about 80% of all household solid waste, and 75% of all waste from hotels, restaurants, and juice bars, was organic. Annually, this waste amounted to 7000 Mg organic matter on a dry-weight basis. Substantially more waste was generated in the wet season, when more fruits and vegetables were available. About 50% of the population of Shashemene used unimproved sanitation, which could be converted to container-based ecological sanitation. Recycling human excreta from ecological sanitation and other organic waste via thermophilic composting could produce a sufficient amount of compost to fully fertilize an estimated 470 ha of agricultural land, thereby replacing mineral fertilizer and enhancing soil fertility and food security, while simultaneously mitigating climate change. These findings suggest that introducing ecological sanitation and combining it with organic waste management through thermophilic composting can be an option to combat soil degradation, food insecurity, and climate change. Therefore, Ethiopian cities (as well as other cities around the world with similar levels of organic waste and unimproved sanitation) are recommended to consider ecological sanitation and thermophilic composting as a waste management strategy. This would not only significantly reduce the amount of waste being dumped, but also provide fertilizer for smallholder farmers, thus reducing the dependence on mineral fertilizer imports.

Supplementary Materials

The following supporting information can be downloaded at: https://www.mdpi.com/article/10.3390/su14063660/s1, Table S1: Household solid waste fractions and composition; Table S2: Socioeconomic characteristics of sample HHs; Table S3: HSW generation rate in dry and wet season depending on the socioeconomic class of the respondent; Table S4: Results from the one-way analysis of variance (ANOVA) for testing the waste generation rates depending on socioeconomic class, family size, and educational level in the two different seasons for statistical differences; Table S5: HSW generation rate in dry and wet season depending of the family size of the HH; Table S6: HSW generation rate in dry and wet season depending on the education level of the HH head.

Author Contributions

Conceptualization, O.O., M.T., D.-G.K., N.B., F.Y., M.G. and K.P.; investigation and formal analysis, O.O. and Z.A; funding acquisition, N.B. and K.P.; methodology, O.O. and M.T.; project administration, N.B. and K.P.; resources, M.T., K.P., F.Y. and D.-G.K.; supervision, M.T., D.-G.K., F.Y., M.G., N.B. and K.P.; validation, O.O. and M.T.; visualization, O.O. and M.G.; writing—original draft, O.O.; writing—review and editing, O.O., M.T., D.-G.K., Z.A., F.Y., M.G., N.B. and K.P. All authors have read and agreed to the published version of the manuscript.

Funding

This research was conducted in the frame of the ClimEtSan project and funded by the Federal Ministry of Education and Research (BMBF, FKZ 01DG17010) and the German Academic Exchange Service (DAAD, project ID 57354010).

Institutional Review Board Statement

Ethical review and consent were waived for this study, due to the fact that it was a socioeconomic study, it was observational, and the study design did not include medical or ethical issues.

Informed Consent Statement

Informed consent was obtained from all subjects involved in this study.

Data Availability Statement

The data presented in this study are available on request from the corresponding author (O.O.).

Acknowledgments

Special thanks go to Doctor Elias for his technical support during the data collection, and to the municipality of Shashemene for providing a sorting area and technicians for collecting and sorting the samples.

Conflicts of Interest

The authors declare no conflict of interest.

Abbreviations

Ad, adsorbent; B, boron; BM, bulking material; C, compost; CBS, container-based sanitation; DW, dry weight; EcoSan, ecological sanitation; Fe, iron; FW, fresh weight; HE, human excreta; HH, household; HSW, household solid waste; Kav, available potassium; Mo, molybdenum; Mn, manganese; MSW, municipal solid waste; OW, organic waste; SNNPR, Southern Nations, Nationalities and Peoples’ Region; SSA, sub-Saharan Africa; TCa, total calcium; TMg, total magnesium; TN, total nitrogen; TP, total phosphorus; Zn, zinc.

References

  1. Vergara, S.E.; Tchobanoglous, G. Municipal Solid Waste and the Environment: A Global Perspective. Annu. Rev. Environ. Resour. 2012, 37, 277–309. [Google Scholar] [CrossRef]
  2. Mavropoulus, A. Waste Atlas 2014 Report—The World’s 50 Biggest Dumpsites. 2014. Available online: http://www.d-waste.com/Atlasreport2014/Waste-Atlas-report-2014-webEdition.pdf (accessed on 25 May 2021).
  3. Kaza, S.; Lisa, Y.; Perinaz, B.T.; Frank, V.W. What a Waste 2.0: A Global Snapshot of Solid Waste Management to 2050; World Bank Publications: Washington, DC, USA, 2018; pp. 148–162. Available online: https://openknowledge.worldbank.org/handle/10986/30317 (accessed on 9 July 2021).
  4. Kumar, A.; Samadder, S.R. A Review on Technological Options of Waste to Energy for Effective Management of Municipal Solid Waste. Waste Manag. 2017, 69, 407–422. [Google Scholar] [CrossRef] [PubMed]
  5. Tchobanoglous, G.; Kreith, F. Handbook of Solid Waste Management, 2nd ed.; McGraw Hill Handbooks: New York, NY, USA, 2002. [Google Scholar]
  6. Hoornweg, D.; Bhada-Tata, P.A. What a Waste: A Global Review of Solid Waste Management. 2012. Available online: https://openknowledge.worldbank.org/handle/10986/17388 (accessed on 25 May 2021).
  7. Hoornweg, D.; Freire, M. Building Sustainability in an Urbanizing World; World Bank: Washington, DC, USA, 2013; pp. 148–162. [Google Scholar]
  8. UNEP. Africa Waste Management Outlook; United Nations Environment Programme: Nairobi, Kenya, 2018; Available online: https://wedocs.unep.org/handle/20.500.11822/25514 (accessed on 28 June 2021).
  9. Hayal, D.; Hailu, W.; Aramde, F. Assessment of the Contemporary Municipal Solid Waste Management in Urban Environment: The Case of Addis Ababa, Ethiopia. J. Environ. Sci. Technol. 2014, 7, 107–122. [Google Scholar]
  10. Tassie, W.K. Households Solid Waste Generation and Management Behavior in Case of Bahir Dar City, Amhara National Regional State, Ethiopia. Cogent Environ. Sci. 2018, 4, 1471025. [Google Scholar] [CrossRef]
  11. Abera, K.A. Household Solid Waste Generation Rate and Onsite Handling Practices in Debre Berhan Town, Ethiopia. Sci. J. Public Health 2017, 5, 31. [Google Scholar] [CrossRef] [Green Version]
  12. Cheru, S. Assessment of Municipal Solid Waste Management Service in Dessie Town. Master’s Thesis, Addis Ababa University, Addis Ababa, Ethiopia, June 2011. [Google Scholar]
  13. Getahun, T.; Mengistie, E.; Haddis, A.; Wasie, F.; Alemayehu, E.; Dadi, D.; Van Gerven, T.; Van Der Bruggen, B. Municipal Solid Waste Generation in Growing Urban Areas in Africa: Current Practices and Relation to Socioeconomic Factors in Jimma, Ethiopia. Environ. Monit. Assess. 2012, 184, 6337–6345. [Google Scholar] [CrossRef]
  14. Fetene, Y.; Addis, T.; Beyene, A.; Kloos, H. Valorisation of Solid Waste as Key Opportunity for Green City Development in the Growing Urban Areas of the Developing World. J. Environ. Chem. Eng. 2018, 6, 7144–7151. [Google Scholar] [CrossRef]
  15. Assefa, M. Solid Waste Generation Rate and Characterization Study for Laga Tafo Laga Dadi Town, Oromia, Ethiopia. Int. J. Environ. Prot. Policy 2017, 5, 84. [Google Scholar] [CrossRef] [Green Version]
  16. Fereja, W.M.; Chemeda, D.D. Status, Characterization, and Quantification of Municipal Solid Waste as a Measure towards Effective Solid Waste Management: The Case of Dilla Town, Southern Ethiopia. J. Air Waste Manag. Assoc. 2021. [Google Scholar] [CrossRef]
  17. Abiot, A.; Akhila, S.; Nair, Z.M. Household Solid Waste Generation Rate and Physical Composition Analysis: Case of Hosa’ina City, SNNPR, Ethiopia. J. Recent Trends Biosci. 2012, 2, 22–28. [Google Scholar]
  18. Goa, E.; Sota, S.S. Generation Rate and Physical Composition of Solid Waste in Wolaita Sodo Town, Southern Ethiopia. Ethiop. J. Environ. Stud. Manag. 2017, 10, 415. [Google Scholar] [CrossRef] [Green Version]
  19. Gelan, E. Municipal Solid Waste Management Practices for Achieving Green Architecture Concepts in Addis Ababa, Ethiopia. Technologies 2021, 9, 48. [Google Scholar] [CrossRef]
  20. Scheinberg, A.; Wilson, D.; Rodic-Wiersma, L. Solid Waste Management in the World’s Cities: Water and Sanitation in the World’s Cities 2010. Available online: https://unhabitat.org/solid-waste-management-in-the-worlds-cities-water-and-sanitation-in-the-worlds-cities-2010-2 (accessed on 17 November 2021).
  21. Coffey, M.; Coad, A. Collection of Municipal Solid Waste in Developing Countries, 2nd ed.; UN-Habitat: Nairobi, Kenya, 2010; Available online: https://unhabitat.org/sites/default/files/2021/02/2010_collection-msw-developing-countries_un-habitat.pdf (accessed on 17 December 2020).
  22. UN Habitat; WHO. Progress on Wastewater Treatment—Global Status and Acceleration Needs for SDG Indicator 6.3.1; World Health Organization (WHO); United Nations Human Settlements Programme (UN-Habitat): Geneva, Switzerland, 2021; pp. 544–565. Available online: https://unhabitat.org/sites/default/files/2021/08/sdg6_indicator_report_631_progress_on_wastewater_treatment_2021_english_pages.pdf (accessed on 13 September 2021).
  23. Esrey, S.A.; Andersson, I.; Hillers, A.; Sawyer, R. Closing the Loop—Ecological Sanitation for Food Security; Publications on Water Resources No. 18; Swedish International Development Cooperation Agency (SIDA): Morelos, Mexico, 2001; pp. 15–41.
  24. Freeman, M.C.; Ogden, S.; Jacobson, J.; Abbott, D.; Addiss, D.G.; Amnie, A.G.; Beckwith, C.; Cairncross, S.; Callejas, R.; Colford, J.M. Integration of Water, Sanitation, and Hygiene for the Prevention and Control of Neglected Tropical Diseases: A Rationale for Inter-Sectoral Collaboration. PLoS Negl. Trop. Dis. 2013, 7, e2439. [Google Scholar] [CrossRef] [PubMed] [Green Version]
  25. WHO. Preventing Diarrhoea through Better Water, Sanitation and Hygiene: Exposures and Impacts in Low- and Middle-Income Countries; World Health Organization: Geneva, Switzerland, 2014; Available online: https://apps.who.int/iris/handle/10665/150112 (accessed on 21 March 2021).
  26. WHO. Children: Reducing Mortality Fact Sheet. 2020. Available online: http://www.who.int/mediacentre/factsheets/fs178/en/ (accessed on 16 June 2021).
  27. Sagar, L.; Maitra, S.; Hossain, A.; Yadav, A.N.; Singh, S.; Kumar, D.; Praharaj, S.; Shankar, T.; Pramanick, B. Emerging Nutrient Recovery Technologies in Sewage Sludge Management. In Sustainable Management and Utilization of Sewage Sludge; Rajput, V.D., Yadav, A.N., Jatav, H.S., Singh, S.K., Minkina, T., Eds.; Springer International Publishing: Cham, Switzerland, 2022; pp. 125–145. ISBN 978-3-030-85226-9. [Google Scholar]
  28. Meinzinger, F.; Oldenburg, M.; Otterpohl, R. No Waste, but a Resource: Alternative Approaches to Urban Sanitation in Ethiopia. Desalination 2009, 248, 322–329. [Google Scholar] [CrossRef]
  29. Werner, C.; Panesar, A.; Rüd, S.B.; Olt, C.U. Ecological Sanitation: Principles, Technologies and Project Examples for Sustainable Wastewater and Excreta Management. Desalination 2009, 248, 392–401. [Google Scholar] [CrossRef]
  30. Reid, M. Sanitation and Climate. Nat. Clim. Chang. 2020, 10, 496–497. [Google Scholar] [CrossRef]
  31. Dalzell, H.W.; Riddlestone, A.J.; Gray, K.R.; Thurairajan, K. Soil Management: Compost Production and Use in Tropical and Subtropical Environments: FAO Soils 644 Bulletin No. 56. 1987. Available online: http://www.fao.org/3/s8930e/s8930e.pdf (accessed on 13 September 2021).
  32. Rynk, R. On-Farm Composting Handbook. Monogr. Soc. Res. Child Dev. 1992, 77, 132. [Google Scholar]
  33. Brändli, R.C.; Bucheli, T.D.; Kupper, T.; Furrer, R.; Stadelmann, F.X.; Tarradellas, J. Persistent Organic Pollutants in Source-Separated Compost and Its Feedstock Materials-A Review of Field Studies. J. Environ. Qual. 2005, 34, 735–760. [Google Scholar] [CrossRef]
  34. Dolliver, H.; Gupta, S.; Noll, S. Antibiotic Degradation during Manure Composting. J. Environ. Qual. 2008, 37, 1245–1253. [Google Scholar] [CrossRef]
  35. Lü, H.; Chen, X.H.; Mo, C.H.; Huang, Y.H.; He, M.Y.; Li, Y.W.; Feng, N.X.; Katsoyiannis, A.; Cai, Q.Y. Occurrence and Dissipation Mechanism of Organic Pollutants during the Composting of Sewage Sludge: A Critical Review. Bioresour. Technol. 2021, 328. [Google Scholar] [CrossRef]
  36. Tiquia, S.M.; Richard, T.L.; Honeyman, M.S. Carbon, Nutrient, and Mass Loss during Composting. Nutr. Cycl. Agroecosyst. 2002, 62, 15–24. [Google Scholar] [CrossRef]
  37. Peigné, J.; Girardin, P. Environmental Impacts of Farm-Scale Composting Practices. Water. Air. Soil Pollut. 2004, 153, 45–68. [Google Scholar] [CrossRef]
  38. Drechsel, P.; Gyiele, L.; Kunze, D.; Cofie, O. Population Density, Soil Nutrient Depletion, and Economic Growth in Sub-Saharan Africa. Ecol. Econ. 2001, 38, 251–258. [Google Scholar] [CrossRef]
  39. Refsgaard, K.; Jenssen, P.D.; Magid, J. Possibilities for Closing the Urban-Rural Nutrient Cycles. Glob. Dev. Org. Agric. Chall. Prospect. 2006, 181–213. [Google Scholar] [CrossRef]
  40. Tadesse, S.T.; Oenema, O.; van Beek, C.; Ocho, F.L. Manure Recycling from Urban Livestock Farms for Closing the Urban–Rural Nutrient Loops. Nutr. Cycl. Agroecosyst. 2021, 119, 51–67. [Google Scholar] [CrossRef]
  41. Nigussie, A.; Kuyper, T.W.; Neergaard, A. Agricultural Waste Utilisation Strategies and Demand for Urban Waste Compost: Evidence from Smallholder Farmers in Ethiopia. Waste Manag. 2015, 44, 82–93. [Google Scholar] [CrossRef] [PubMed]
  42. Schwarzer, S. Putting Carbon Back Where It Belongs—The Potential of Carbon Sequestration in the Soil. UN Environment Programe. Foresight Br./Sci. Div. UN Environ. Programme 2019, 12, 1–12. [Google Scholar]
  43. Zerssa, G.W.; Kim, D.G.; Koal, P.; Eichler-Löbermann, B. Combination of Compost and Mineral Fertilizers as an Option for Enhancing Maize (Zea Mays L.) Yields and Mitigating Greenhouse Gas Emissions from a Nitisol in Ethiopia. Agronomy 2021, 11, 2097. [Google Scholar] [CrossRef]
  44. Muheirwe, F.; Kombe, W.; Kihila, J.M. The paradox of solid waste management: A regulatory discourse from Sub-Saharan Africa. Habitat Int. 2022, 119, 102491. [Google Scholar] [CrossRef]
  45. Hirpe, L.; Yeom, C. Municipal Solid Waste Management Policies, Practices, and Challenges in Ethiopia: A Systematic Review. Sustainability 2021, 13, 1241. [Google Scholar] [CrossRef]
  46. Christensen, T.H.; Damgaard, A.; Levis, J.; Zhao, Y.; Björklund, A.; Arena, U.; Barlaz, M.A.; Starostina, V.; Boldrin, A.; Astrup, T.F.; et al. Application of LCA Modelling in Integrated Waste Management. Waste Manag. 2020, 118, 313–322. [Google Scholar] [CrossRef] [PubMed]
  47. Municipality of Shashemene. Shashemene City Administration’s Physical and Socio-Economic Profile. (2016–2019) Ethiopia Calendar. Personal communication, 2019. [Google Scholar]
  48. Fanta, T.G.; Megento, T.L. Urban Renewal and Growth Opportunity Barriers of Microenterprises: Between Working Space Scarceness and Incongruity in Shashemene City, Ethiopia. J. Reg. City Plan. 2018, 29, 250–280. [Google Scholar] [CrossRef]
  49. Bevan, P.; Pankhurst, A.; Tadele, F.; Tesfu, M.; Musie, R.; Ethiopian Urban Studies. The Ethiopia Wellbeing in Developing Countries Research Programme, based at the University of Bath, UK. 2006. Available online: http://www.bath.ac.uk/soc-pol/welldev/research/methods-toobox/cp-countries/ethiopia/Shashemene%20community%20profile.pdf (accessed on 10 March 2019).
  50. Nordtest. Municipal Solid Waste: Sampling and Characterization (No. NT ENVIR 001); Nordtest Method: Espoo, Finland, 1995; Available online: http://www.nordtest.info/wp/1995/05/14/solid-waste-municipal-sampling-and-characterisation-nt-envir-001/ (accessed on 9 July 2019).
  51. Bernard, H.R. Research Methods in Anthropology: Qualitative and Quantitative Approaches, 5th ed.; AltaMira Press: New York, NY, USA, 2011; pp. 148–162. [Google Scholar]
  52. Bartlett, J.E.; Kotrlik, J.W.; Higgins, C.C. Determining Appropriate Sample Size in Survey Research. Inf. Technol. Learn. Perform. J. 2001, 19, 43–50. [Google Scholar]
  53. Hanc, A.; Novak, P.; Dvorak, M.; Habart, J.; Svehla, P. Composition and Parameters of Household Bio-Waste in Four Seasons. Waste Manag. 2011, 31, 1450–1460. [Google Scholar] [CrossRef] [PubMed]
  54. Philippe, F.; Culot, M. Resources, Conservation and Recycling Household Solid Waste Generation and Characteristics in Cape Haitian City, Republic of Haiti. Resour. Conserv. Recycl. 2009, 54, 73–78. [Google Scholar] [CrossRef]
  55. WHO. Guides for Municipal Solid Waste Management in Pacific Island Countries. 1996. Available online: https://iris.wpro.who.int/handle/10665.1/1405 (accessed on 5 December 2021).
  56. Jenkins, J.C. The Humanure Handbook: A Guide to Composting Human Manure; Joseph Jenkins Incorporated: Grove City, PA, USA, 2005; ISBN 0964425831. [Google Scholar]
  57. Tilmans, S.; Russel, K.; Sklar, R.; Page, L.N.; Kramer, S.; Davis, J. Container-Based Sanitation: Assessing Costs and Effectiveness of Excreta Management in Cap Haitien, Haiti. Environ. Urban. 2015, 27, 89–104. [Google Scholar] [CrossRef] [Green Version]
  58. Castro-Herrera, D.; Prost, K.; Schäfer, Y.; Kim, D.G.; Yimer, F.; Tadesse, M.; Gebrehiwot, M.; Brüggemann, N. Nutrient Dynamics during Composting of Human Excreta, Cattle Manure, and Organic Waste Affected by Biochar. J. Environ. Qual. 2021, 51, 19–32. [Google Scholar] [CrossRef]
  59. Rose, C.; Parker, A.; Jefferson, B.; Cartmell, E. The Characterization of Feces and Urine: A Review of the Literature to Inform Advanced Treatment Technology. Crit. Rev. Environ. Sci. Technol. 2015, 45, 1827–1879. [Google Scholar] [CrossRef] [Green Version]
  60. Amlinger, F.; Götz, B.; Dreher, P.; Geszti, J.; Weissteiner, C. Nitrogen in Biowaste and Yard Waste Compost: Dynamics of Mobilisation and Availability—A Review. Eur. J. Soil Biol. 2003, 39, 107–116. [Google Scholar] [CrossRef]
  61. Canet, W. Determination of the Moisture Content of Some Fruits and Vegetables by Microwave Heating. J. Microw. Power Electromagn. Energy 1988, 23, 231–235. [Google Scholar] [CrossRef]
  62. Rizk, M.C.; Bergamasco, R.; Tavares, C.R.G. Anaerobic Co-Digestion of Fruit and Vegetable Waste and Sewage Sludge. Int. J. Chem. React. Eng. 2007, 5. [Google Scholar] [CrossRef]
  63. Cerda, A.; Artola, A.; Font, X.; Barrena, R.; Gea, T.; Sánchez, A. Composting of Food Wastes: Status and Challenges. Bioresour. Technol. 2018, 248, 57–67. [Google Scholar] [CrossRef] [PubMed] [Green Version]
  64. Tadesse, A.; Kim, H.K.; Debela, A. Calibration of nitrogen fertilizer for quality protein maize (Zea mays L.) based on in-season estimated yield using a handheld NDVI sensor in the central rift valley of Ethiopia. Asia Pac. J. Energy Environ. 2015, 2, 25–32. [Google Scholar] [CrossRef]
  65. Amanullah; Iqbal, A.; Irfanullah; Hidayat, Z. Potassium Management for Improving Growth and Grain Yield of Maize (Zea mays L.) under Moisture Stress Condition. Sci. Rep. 2016, 6, 1–12. [Google Scholar] [CrossRef]
  66. AGRA. Assessment of Fertilizer Distribution Systems and Opportunities for Developing Fertilizer Blends. US Aid 2018, 3, 34–45. [Google Scholar]
  67. Zemichael, B.; Dechassa, N.; Abay, F. Yield and Nutrient Use Efficiency of Bread Wheat (Triticum Aestivum L.) as Influenced by Time and Rate of Nitrogen Application in Enderta, Tigray, Northern Ethiopia. Open Agric. 2017, 2, 611–624. [Google Scholar] [CrossRef] [Green Version]
  68. Brhane, H.; Mamo, T.; Teka, K. Optimum Potassium Fertilization Level for Growth, Yield and Nutrient Uptake of Wheat (Triticum Aestivum) in Vertisols of Northern Ethiopia. Cogent Food Agric. 2017, 3, 1347022. [Google Scholar] [CrossRef]
  69. Misskire, Y.; Mamo, T.; Taddesse, A.M.; Yermiyahu, U. The Effect of Potassium on Yield, Nutrient Uptake and Efficiency of Teff (Eragrostis tef Zucc. Trotter) on Vertisols of North Western Ethiopian Highlands. J. Plant Nutr. 2019, 42, 307–322. [Google Scholar] [CrossRef]
  70. Tesfahunegn, G.B. Nutrient Response Functions of Tef Crop in Different Agro Ecological Zones of Ethiopia. Geoderma Reg. 2019, 16, 00208. [Google Scholar] [CrossRef]
  71. Mesfin, S.; Haile, M.; Gebresamuel, G.; Zenebe, A.; Gebre, A. Establishment and Validation of Site Specific Fertilizer Recommendation for Increased Barley (Hordeum spp.) Yield, Northern Ethiopia. Heliyon 2021, 7, e07758. [Google Scholar] [CrossRef]
  72. Shunka, E.; Chindi, A.; Wgiorgis, G.; Seid, E.; Tessema, L. Response of Potato (Solanum Tuberosum L.) Varieties to Nitrogen and Potassium Fertilizer Rates in Central Highlands of Ethiopia. Adv. Crop Sci. Technol. 2016, 4, 1–6. [Google Scholar] [CrossRef]
  73. Zewide, I.; Mohammed, A.; Tulu, S. Effect of Different Rates of Nitrogen and Phosphorus on Yield and Yield Components of Potato (Solanum tuberosum L.) at Masha District, Southwestern Ethiopia. Int. J. Soil Sci. 2012, 7, 146–156. [Google Scholar] [CrossRef]
  74. Hordofa, S.M.; Kebede, K.; Mekuria, R.; Lulie, B.; Nigussei, A. Phosphorus Fertilizer Effects on Haricot Bean (Phaseolus vulgaris L.) Varieties on Andisols of Sidama, Ethiopia. Am. J. Plant Biol. 2020, 5, 82. [Google Scholar] [CrossRef]
  75. Amanuel, A.; Amisalu, N.; Merkeb, G. Growth and Yield of Common Bean (Phaseolus Vulgaris L.) Cultivars as Influenced by Rates of Phosphorus at Jimma, Southwest Ethiopia. J. Agric. Biotechnol. Sustain. Dev. 2018, 10, 104–115. [Google Scholar] [CrossRef]
  76. Gebre Mariam, S. Status of Commercial Fruit Production in Ethiopia; Ethiopian Agricultural Research Organization: Addis Ababa, Ethiopia, 2003; Available online: https://agris.fao.org/agris-search/search.do?recordID=ET2006000119 (accessed on 9 July 2021).
  77. Emana, B.; Afari-Sefa, V.; Dinssa, F.F.; Ayana, A.; Balemi, T.; Temesgen, M. Characterization and Assessment of Vegetable Production and Marketing Systems in the Humid Tropics of Ethiopia. Q. J. Int. Agric. 2015, 54, 163–187. [Google Scholar] [CrossRef]
  78. Zerfu, T.A.; Umeta, M.; Baye, K. Dietary Habits, Food Taboos, and Perceptions towards Weight Gain during Pregnancy in Arsi, Rural Central Ethiopia: A Qualitative Cross-Sectional Study. J. Health Popul. Nutr. 2016, 35, 22. [Google Scholar] [CrossRef] [Green Version]
  79. Mohammed, A.; Elias, E. Domestic Solid Waste Management Environmental Impacts in Addis Ababa City. J. Environ. Waste Manag. 2017, 4, 194–203. [Google Scholar]
  80. Teshome, F.B. Municipal Solid Waste Management in Ethiopia; the Gaps and Ways for Improvement. J. Mater. Cycles Waste Manag. 2020, 23, 18–31. [Google Scholar] [CrossRef]
  81. Noufal, M.; Yuanyuan, L.; Maalla, Z.; Adipah, S. Determinants of Household Solid Waste Generation and Composition in Homs City, Syria. J. Environ. Public Health 2020, 1–15. [Google Scholar] [CrossRef]
  82. Komakech, A.J.; Banadda, N.E.; Kinobe, J.R.; Kasisira, L.; Sundberg, C.; Gebresenbet, G.; Vinnerås, B. Characterization of municipal waste in Kampala, Uganda. J. Air Waste Manag. Assoc. 2014, 64, 340–348. [Google Scholar] [CrossRef] [Green Version]
  83. Okot-Okumu, J. Solid Waste Management in Uganda: Challenges and Options. Future Directions of Municipal Solid Waste Management in Africa; Romeela, M., Thokozani, S., Eds.; Africa Institute of South Africa: Pretoria, South Africa, 2015; pp. 107–135. [Google Scholar]
  84. Ntagisanimana, G.; Yu, Z.; Ma, H. Current Situation of Solid Waste Management in East African Countries and the Proposal for Sustainable Management. Afr. J. Environ. Sci. Technol. 2021, 15, 1–15. [Google Scholar] [CrossRef]
  85. Russel, K.C.; Hughes, K.; Roach, M.; Auerbach, D.; Foote, A.; Kramer, S.; Briceño, R. Taking Container-Based Sanitation to Scale: Opportunities and Challenges. Front. Environ. Sci. 2019, 7, 1–7. [Google Scholar] [CrossRef]
  86. Andersson, K.; Dickin, S.; Rosemarin, A. Towards “Sustainable” Sanitation: Challenges and Opportunities in Urban Areas. Sustainability 2016, 8, 1289. [Google Scholar] [CrossRef] [Green Version]
  87. UN-HABITAT. Global Atlas of Excreta, Wastewater Sludge, and Biosolids Management: Moving forward the Sustainable and Welcome Uses of a Global Resource; LeBlanc, R.J., Matthews, P., Richard, R.P., Eds.; UN-HABITAT: Nairobi, Kenya, 2008. [Google Scholar]
  88. Mohareb, E.A.; MacLean, H.L.; Kennedy, C.A. Greenhouse Gas Emissions from Waste Management—Assessment of Quantification Methods. J. Air Waste Manag. Assoc. 2011, 61, 480–493. [Google Scholar] [CrossRef] [PubMed]
  89. Couth, R.; Trois, C.; Vaughan-Jones, S. Modelling of Greenhouse Gas Emissions from Municipal Solid Waste Disposal in Africa. Int. J. Greenh. Gas Control 2011, 5, 1443–1453. [Google Scholar] [CrossRef]
  90. Daley, B. Environmental Issues in Ethiopia and Links to the Ethiopian Economy. 2015. Available online: https://assets.publishing.service.gov.uk/media/57dc1353e5274a34fb00004d/EoD_HDYr3_52_Sept_2015_Environment_Economy_Ethiopia__2_.pdf (accessed on 15 February 2022).
  91. Shiferaw, H. Waste Disposal Systems of Addis Ababa City, the African Capital, Ethiopia. 2021, pp. 1–16. Available online: https://www.researchgate.net/publication/352614286_Waste_disposal_systems_of_Addis_Ababa_City_the_African_Capital_Ethiopia/link/60d1ff9892851c34e07c7e5c/download (accessed on 15 February 2022).
  92. Preneta, N.; Kramer, S.; Magloire, B.; Noel, J.M. Thermophilic Co-Composting of Human Wastes in Haiti. J. Water Sanit. Hyg. Dev. 2013, 3, 649–654. [Google Scholar] [CrossRef]
  93. McNicol, G.; Jeliazovski, J.; François, J.J.; Kramer, S.; Ryals, R. Climate Change Mitigation Potential in Sanitation via Off-Site Composting of Human Waste. Nat. Clim. Chang. 2020, 10, 545–549. [Google Scholar] [CrossRef]
  94. Ryals, R.; Bischak, E.; Porterfield, K.K.; Heisey, S.; Jeliazovski, J.; Kramer, S.; Pierre, S. Toward Zero Hunger Through Coupled Ecological Sanitation-Agriculture Systems. Front. Sustain. Food Syst. 2021, 5, 1–18. [Google Scholar] [CrossRef]
  95. IPCC. Impacts, Adaptation, and Vulnerability. Part A: Global and Sectoral Aspects. Contribution of Working Group II to the Fifth Assessment Report of the Intergovernmental Panel on Climate Change; Cambridge University Press: Cambridge, UK; New York, NY, USA, 2014; p. 1132. Available online: https://www.ipcc.ch/report/ar5/wg2/ (accessed on 8 August 2021).
  96. Mukai, S.; Oyanagi, W. Evaluation on Maturity and Stability of Organic Fertilisers in Semi Arid Ethiopian Rift Valley. Sci. Rep. 2021, 11, 1–12. [Google Scholar] [CrossRef]
Figure 1. Location map of the study area, Shashemene city.
Sustainability 14 03660 g001
Figure 2. Weighted percentage (%) of household solid waste disposal methods practiced by households in Shashemene.
Sustainability 14 03660 g002
Table 1. Waste generation rates of Ethiopian cities and the proportion of HSW of total MSW (studies published between 2012 and 2021).
Region and CityAverage HSW Generation RateHSW Generation Rate by Wealth Status/Family SizeMean Family SizeSeasonal Variability *Refs.
kg FW cap−1 day−1
Addis Ababa0.5 x[9] **
Amhara
Bahir Dar0.22 x[10]
Debre Birhan0.25 x[11]
Dessie0.23 x[12]
Oromia
Jimma0.55Family size 1–3: 0.58
Family size 4–6: 0.56
Family size 7–9: 0.55
Family size > 9: 0.52
[13]
Jimma0.56 [14]
Laga Tafo Laga Dadi0.41–0.46 x[15]
SNNPR
Dilla0.48 4.77x[16]
Hosa’ina0.17Low income: 0.14
Middle income: 0.31
High income: 0.49
Low income: 5.99
Middle income: 4.44
High income: 4.14
x[17]
Sodo0.47Low income: 0.28
Middle income: 0.38
High income: 0.76
x[18]
Addis Ababa, Amhara, Oromia and SNNPR = Ethiopian regions (printed in bold). * Seasonal variability taken into account; ✓ = taken into account, x = not taken into account. ** there are currently no reliable studies about Addis Ababa’s solid waste generation rate available [19]; 0.5 kg cap−1 day−1 is therefore an estimated value from the reference cited. FW = fresh weight; HH = household; HSW = household solid waste; MSW = municipal solid waste; Ref. = reference; SNNPR = Southern Nations, Nationalities and Peoples’ Region.
Table 2. Daily and yearly HSW generation rate in dry and wet season and percentage of each fraction on total HSW in Shashemene, Ethiopia. Values are means ± standard error.
HSW FractionWet SeasonDry SeasonAverage Yearly HSW GenerationAverage Proportionp Value
kg FW Day−1 HH −1Mg FW Year−1 HH −1%
Organic8.12 ± 0.31 a6.21 ± 0.32 b2.59 ± 0.3180.0<0.0001
Plastic1.11 ± 0.07 a0.37 ± 0.03 b0.27 ± 0.057.7<0.0001
Glass0.13 ± 0.02 a0.06 ± 0.01 b0.03 ± 0.011.00.001
Metals0.11 ± 0.02 a0.04 ± 0.01 a0.03 ± 0.010.80.0048
Paper0.17 ± 0.02 a0.14 ± 0.02 a0.05 ± 0.021.70.31
Others *0.99 ± 0.07 a0.56 ± 0.05 b0.28 ± 0.078.50.0005
Total waste10.69 ± 0.37 a7.39 ± 0.35 b3.28 ± 0.36 <0.0001
FW = fresh weight; HH = household; HSW = household solid waste; Mg = 1000 kg. * Others: HH hazardous waste, batteries, ashes, human hygiene waste, other combustible waste, textile, leather, synthetic fibers. Mean values in the same row with different superscript letters are significantly different (α < 0.05).
Table 3. Waste generation rate in dry and wet season from hotels, restaurants, and juice bars (20 different commercial units in Shashemene). Values are means ± std. error.
Waste FractionDaily Waste GenerationAnnual Waste Generation *
Wet SeasonDry SeasonMeanp Value
kg FW Commercial Unit−1 Day−1Mg FW Year−1
Organic12.6 ± 1.7 a6.2 ± 1.19 b9.43 ± 1.43<0.0011573 ± 1.43
Plastic1.4 ± 0.31.21 ± 0.181.3 ± 0.22NS217 ± 0.22
Glass0.64 ± 0.021.07 ± 0.280.85 ± 0.22NS142 ± 0.22
Metals0.05 ± 0.050.15 ± 0.090.1 ± 0.6NS17 ± 0.6
Paper1.08 ± 0.270.47 ± 0.130.78 ± 0.18NS130 ± 0.18
Others0.99 ± 0.071.0 ± 0.270.1 ± 0.26NS17 ± 0.26
Total16.6 ± 1.64 a10.2 ± 1.17 b13.58 ± 1.38<0.0012096 ± 1.38
FW = fresh weight; Mg = 1000 kg. Values in the same row with different small superscript letters are significantly different (α < 0.05). NS: indicates no significant difference between treatments (p < 0.05). * Considering all 457 hotels, restaurants, and juice bars in Shashemene.
Table 4. Organic waste resources for thermophilic composting in Shashemene, Ethiopia, and their potential use for thermophilic composting for production of a complete organic fertilizer; values are means from wet and dry seasons.
NoOrganic Waste fromABCD
HSW (FW)Organic Waste (FW)Organic Waste (DW)Total Organic Waste (DW)
kg FW Cap−1 Daykg DW Cap−1 Day−1Mg DW Year−1
IHHs0.650.5230.07066824
IICommercial units 9.43 1.273212
IIIEcoSan (HE) 0.089 §4301
IVEcoSan adsorber material 8171
VBulking material 3956
Sum of all resources 23,464
Compost (Mg DW year−1)
VICompost produced 11,732
Fertilized fields (ha year−1)
VIICompost field application 470
DW = dry weight; EcoSan = ecological sanitation; FW = fresh weight; HE = human excreta; HHs = households, HSW = household solid waste, OW = organic waste, Mg = 1000 kg. Unit: kg FW commercial unit−1 day−1. Human excreta obtained when converting unimproved sanitation into EcoSan in Shashemene (applied to 50% of the total population as users [47]). § DW according to [59] for developing countries. Materials used as adsorbent for dry toilets (e.g., sawdust and/or coffee husk). Calculations: BI = AI × 80.5% (on average HSW contained 80.5% organic waste in Shashemene). CI = BI × 100–86.5% (the same applies analogously to CII; assuming an average moisture content of 86.5% for fruit, vegetable, and other food waste). DI = CI × 365 days × 264,780 people (the total population of Shashemene was 246,780 people in 2016). DII = CII × 365 days × 457 commercial units (in 2019 there were 457 hotels, restaurants, and juice bars in total in Shashemene). DIII = CIII × 365 days × 132.390 people (converting unimproved sanitation to EcoSan for 50% of Shashemene’s population). DIV = 1.9 × DIII (according to [58], 1.9 times more adsorber material compared to human excreta should be used for the EcoSan dry toilets used in their study). DV = 92% × DIII (for thermophilic composting of human excreta together with other organic waste, 17% easily degradable bulking material, like straw, should be used to ensure aeration, i.e., 92% the amount of HE [58]). DVI = (DI + DII + DIII + DIV + DV) × 50% (sum of DW of the component ingredients—50% of compost mass is lost in the course of composting due to degradation and transformation processes). DVII = (DVI × 1.5% N × 20% N availability)/75 N ha−1 (assuming a full replacement of mineral N fertilizer; considering 1.5% total N content of the compost [58] and 20% release of plant available N in the 1st year [60]; N demand of 75 kg N ha−1 for maize [64]).
Table 5. Crops commonly grown in the Shashemene area and their nutrient requirements.
CropScientific NameNPKCaMgReferences
kg ha−1
MaizeZea mays L.7546901321[64,65,66]
WheatTriticum Aestivum L.695360823[66,67,68]
TeffEragrostis tef302053 [69,70]
BarelyHordeum spp.542050 [71]
PotatoSolanum tuberosum1656069 [72,73]
Haricot beanPhaseolus vulgaris023–69 [74,75]
100 kg KCl ha−1 = 53 kg K ha−1. Depending on cultivar.
Publisher’s Note: MDPI stays neutral with regard to jurisdictional claims in published maps and institutional affiliations.

