
Spatial and Temporal Changes in Wetland in Dongting Lake Basin of China under Long Time Series from 1990 to 2020


Abstract
:1. Introduction
2. Methods and Data
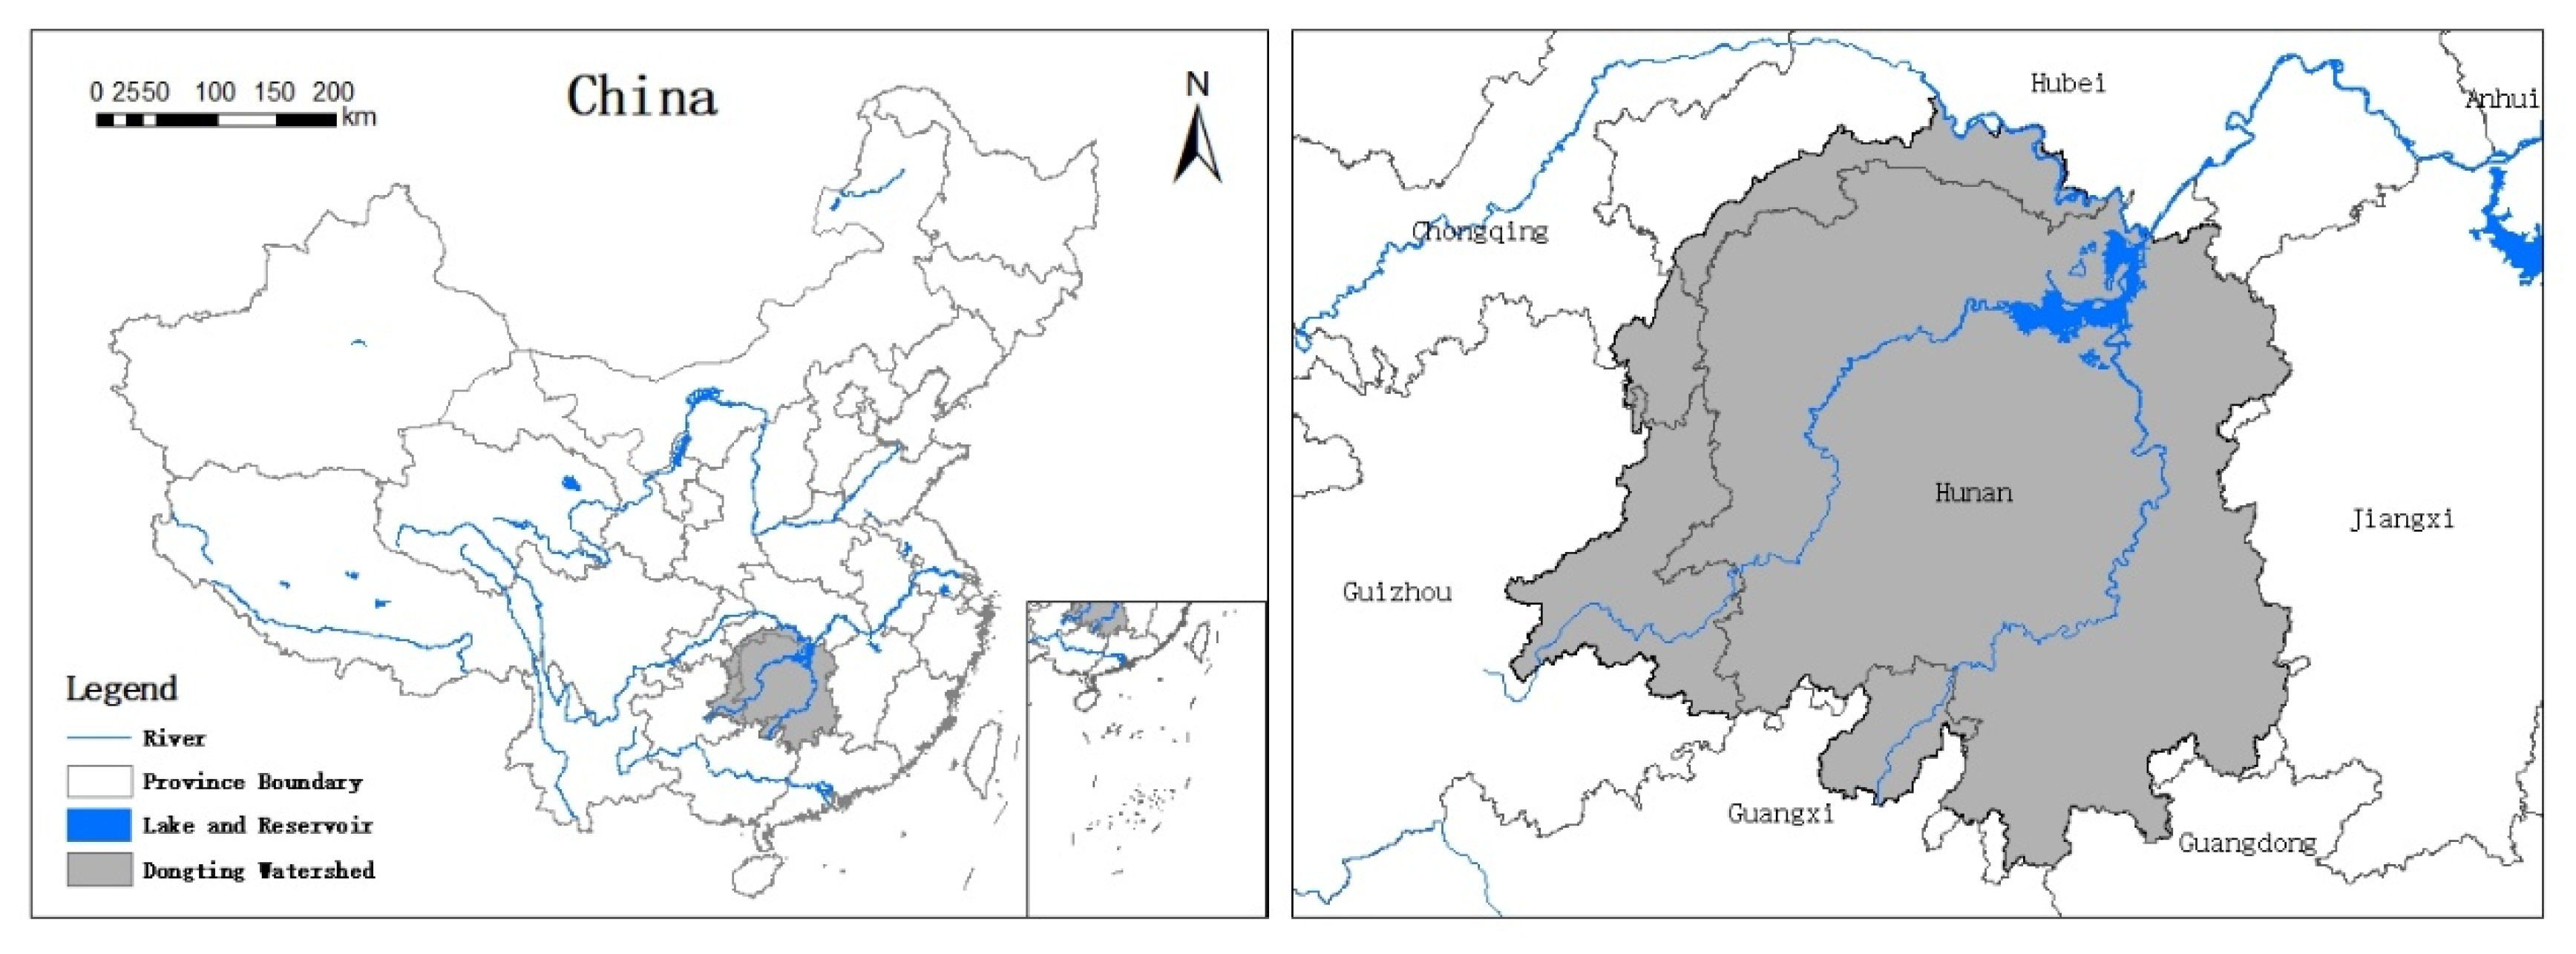
2.1. Study Area
2.2. Land-Cover Data
2.3. Methods
3. Result
3.1. Temporal Change in Wetland in the DLB from 1990 to 2020
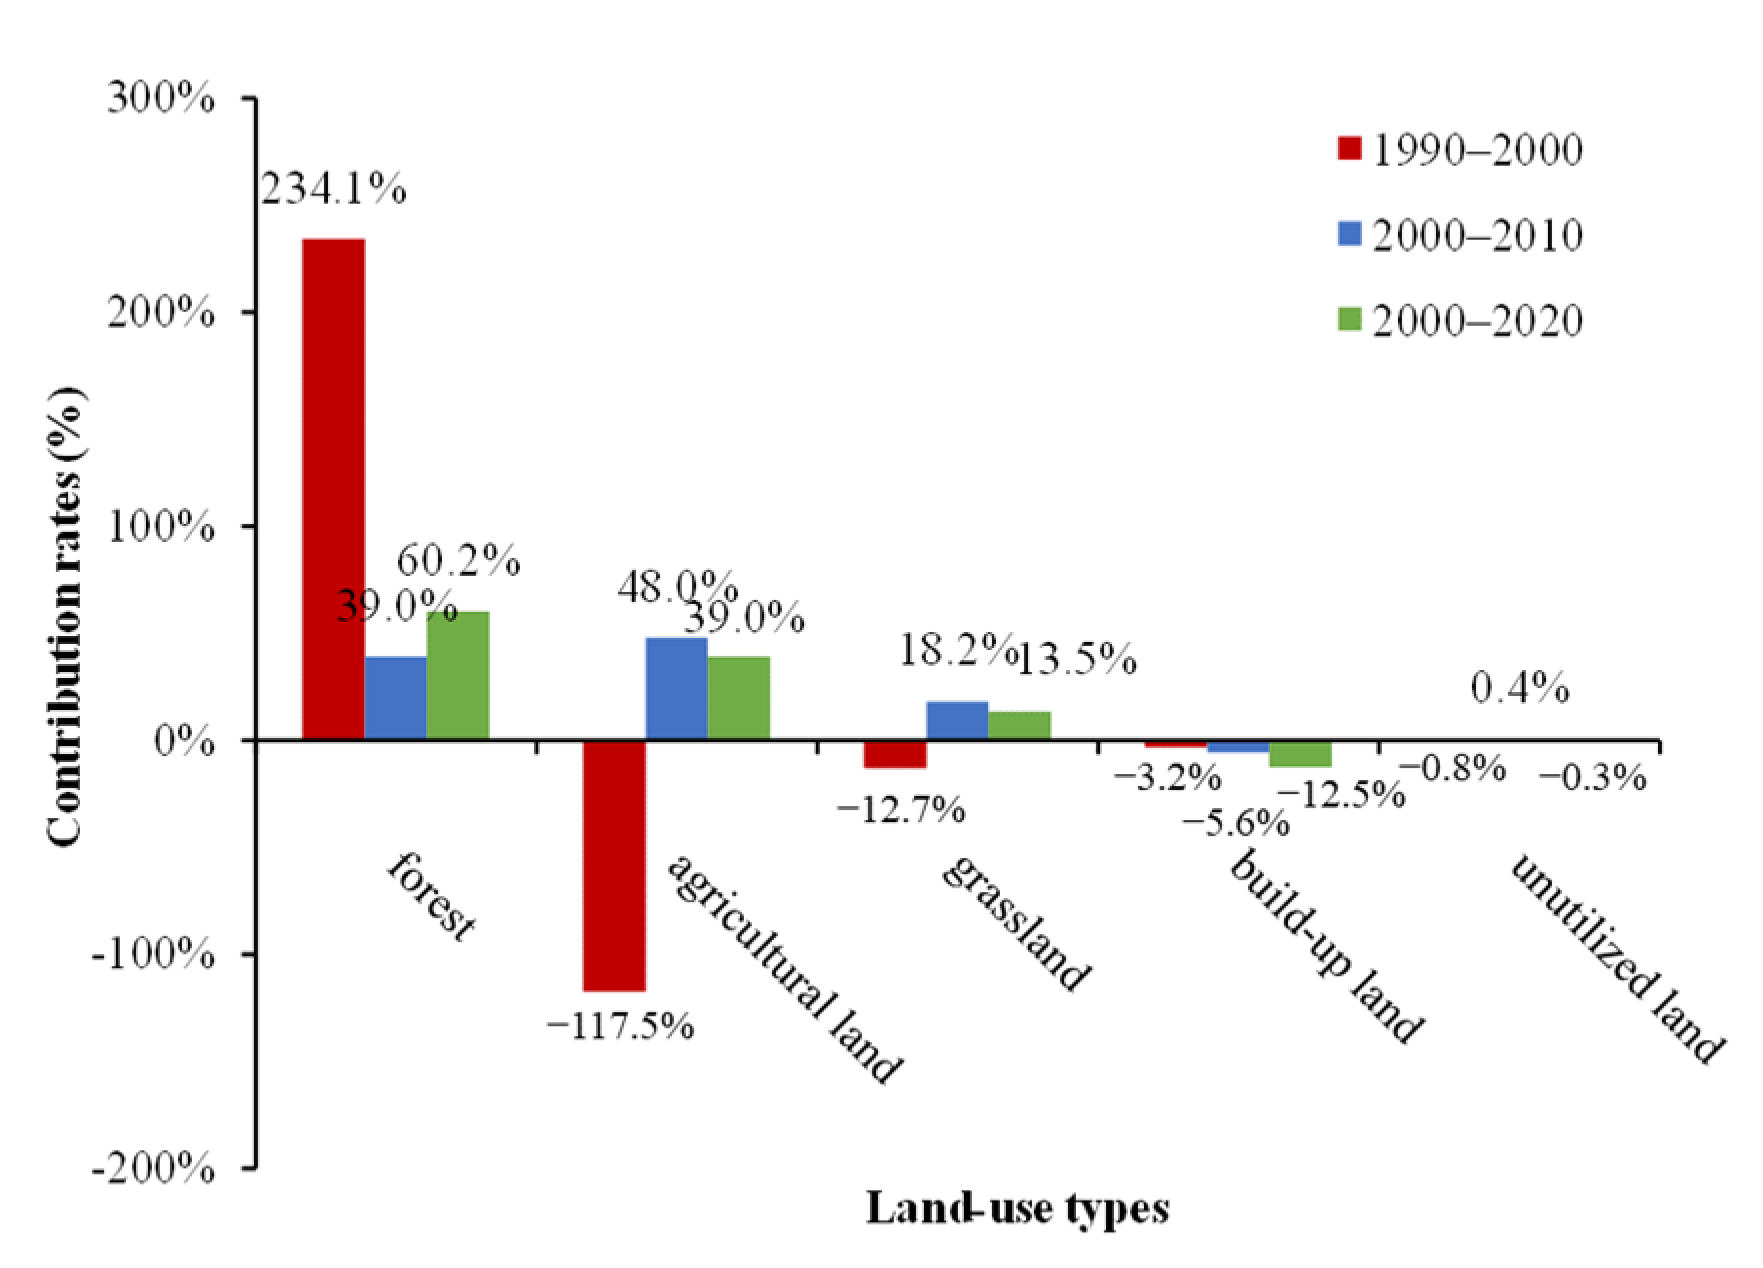
3.2. Spatial Change in Wetland Change in DLB
4. Discussion
4.1. Wetland Increase Due to Forest Loss
4.2. Wetland Change Due to Agricultural Land
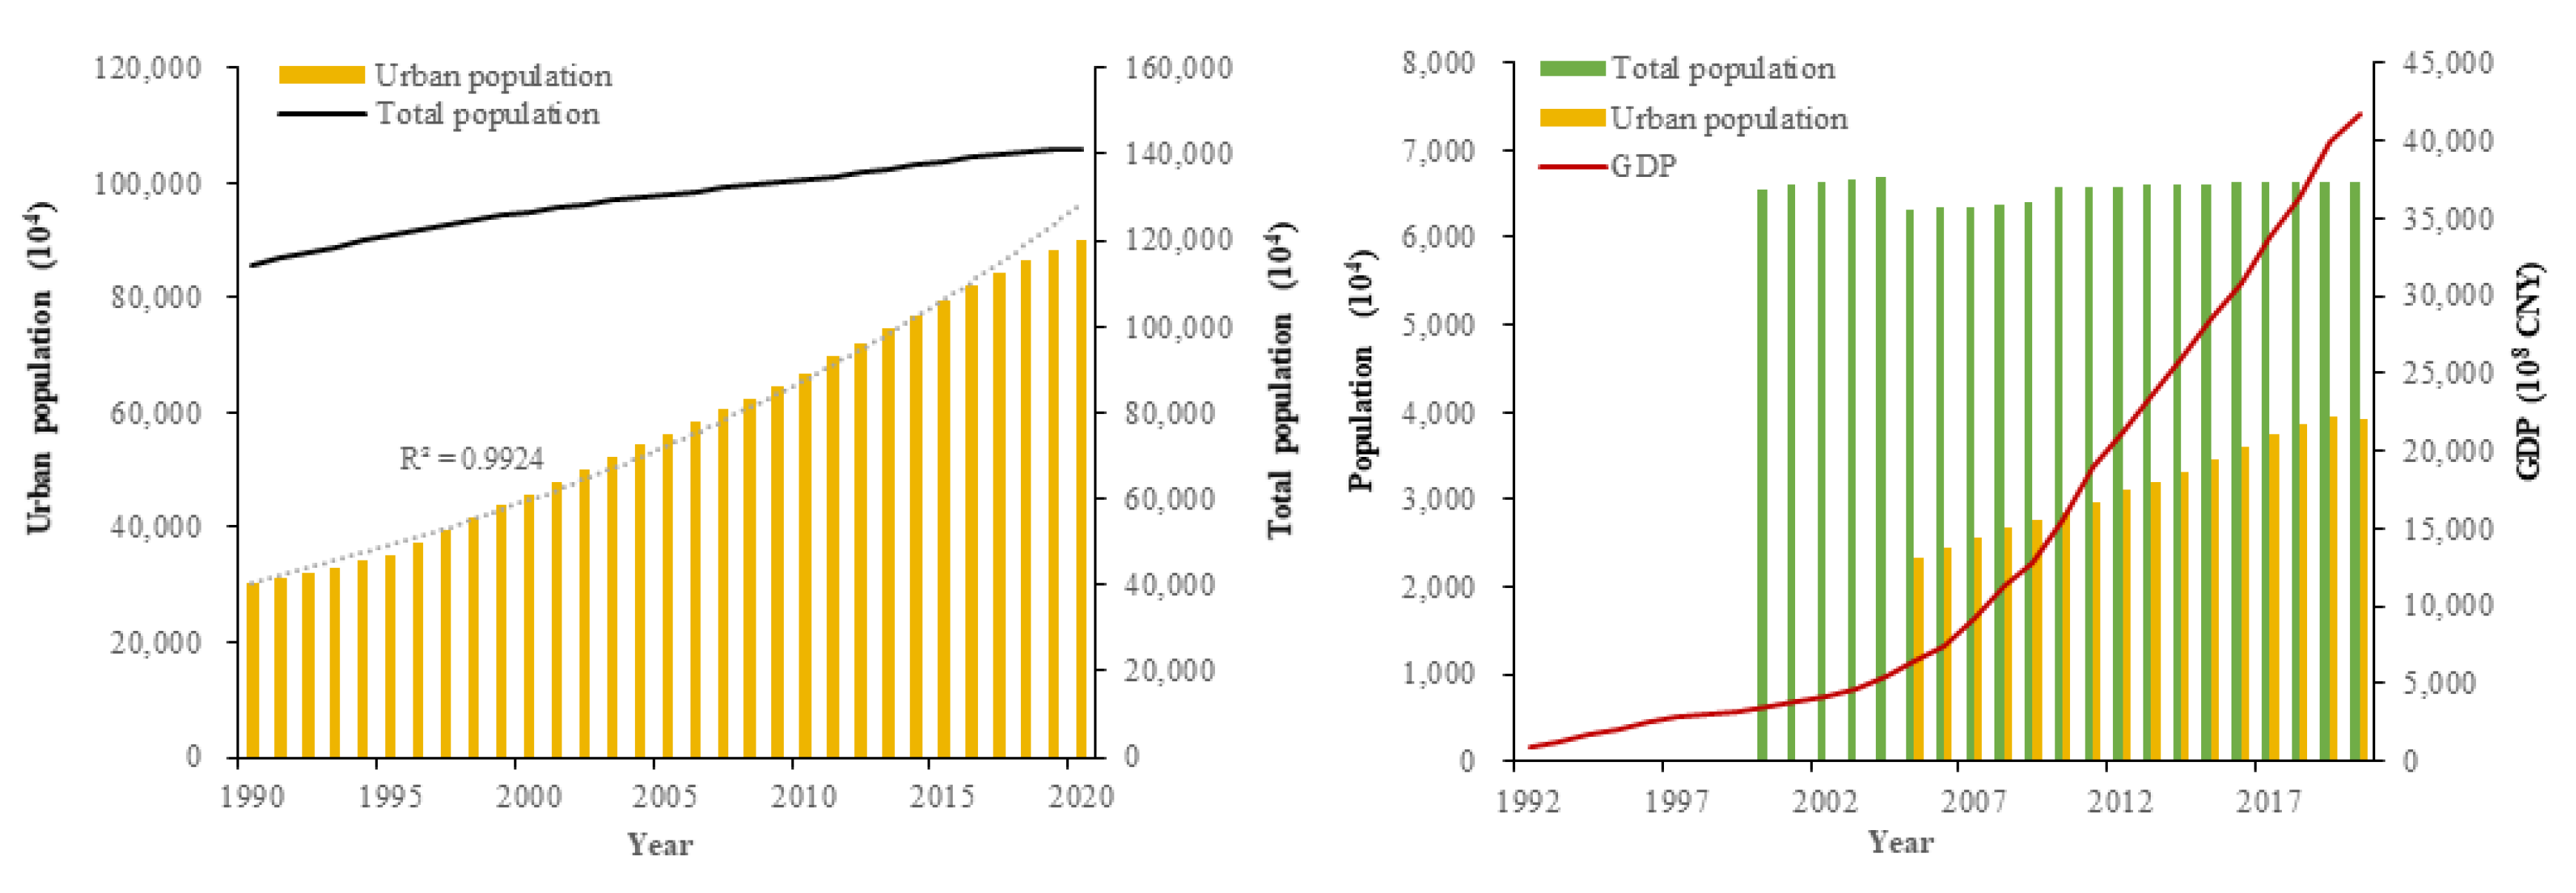
4.3. Wetland Loss Due to Urbanization
4.4. Wetland Change Due to Other Factors
5. Conclusions
Author Contributions
Funding
Institutional Review Board Statement
Informed Consent Statement
Data Availability Statement
Acknowledgments
Conflicts of Interest
References
- Hu, S.J.; Niu, Z.G.; Chen, Y.F.; Li, L.F.; Zhang, H.Y. Global wetlands: Potential distribution, wetland loss, and status. Sci. Total Environ. 2017, 586, 319–327. [Google Scholar] [CrossRef] [PubMed]
- Jin, H.; Huang, C.; Lang, M.W.; Yeo, I.Y.; Stehman, S.V. Monitoring of wetland inundation dynamics in the Delmarva Peninsula using Landsat time-series imagery from 1985 to 2011. Remote Sens. Environ. 2017, 190, 626–641. [Google Scholar] [CrossRef] [Green Version]
- D’Odorico, P.; Davis, K.F.; Rosa, L.; Carr, J.A.; Chiarelli, D.; Dell’Angelo, J.; Gephart, J.; MacDonald, G.K.; Seekell, D.A.; Suweis, S.; et al. The global food-energy-water nexus. Rev. Geophys. 2018, 56, 456–531. [Google Scholar] [CrossRef]
- Yang, Q.; Liu, G.; Casazza, M.; Hao, Y.; Giannetti, B.F. Emergy-based accounting method for aquatic ecosystem services valuation: A case of China. J. Clean. Prod. 2019, 230, 55–68. [Google Scholar] [CrossRef]
- Costanza, R.; D’Arge, R.; Groot, R.D.; Farber, S.; Grasso, M.; Hannon, B.; Limburg, K.; Naeem, S.; O’Neill, R.V.; Paruelo, J.; et al. The value of the world’ ‘s ecosystem services and natural capital. World Environ. 1997, 25, 3–15. [Google Scholar]
- Sinclair, M.; Ghermandi, A.; Moses, S.A.; Joseph, S. Recreation and environmental quality of tropical wetlands: A social media based spatial analysis. Tour. Manag. 2019, 71, 179–186. [Google Scholar] [CrossRef]
- Amler, E.; Schmidt, M.; Menz, G. Definitions and mapping of east African wetlands: A review. Remote Sens. 2015, 7, 5256–5282. [Google Scholar] [CrossRef] [Green Version]
- Sica, Y.V.; Quintana, R.D.; Radeloff, V.C.; Gavier-Pizarro, G.I. Wetland loss due to land use change in the Lower Paraná River Delta, Argentina. Sci. Total Environ. 2016, 568, 967–978. [Google Scholar] [CrossRef] [PubMed]
- Serran, J.N.; Creed, I.F.; Ameli, A.A.; Aldred, D.A. Estimating rates of wetland loss using power-law functions. Wetlands 2018, 38, 109–120. [Google Scholar] [CrossRef]
- Bian, H.; Li, W.; Li, Y.; Ren, B.; Niu, Y.; Zeng, Z. Driving forces of changes in China’ ‘s wetland area from the first (1999–2001) to second (2009–2011) National Inventory of Wetland Resources. Glob. Ecol. Conserv. 2020, 21, e00867. [Google Scholar] [CrossRef]
- Cardner, R.C.; Barchiesi, S.; Beltrame, C.; Finlayson, C.; Galewski, T.; Harrison, I.; Paganini, M.; Perennou, C.; Pritchard, D.; Rosenqvist, A.; et al. State of the World’s Wetlands and Their Services to People: A Compilation of Recent Analyses; Ramsar Briefing Note No. 7; Ramsar Convention Secretariat: Gland, Switzerland, 2015. [Google Scholar]
- Davidson, N.C. How much wetland has the world lost? Long-term and recent trends in global wetland area. Mar. Freshw. Res. 2014, 65, 936–941. [Google Scholar] [CrossRef]
- Gong, P.; Niu, Z.; Cheng, X.; Zhao, K.; Zhou, D.; Guo, J.; Liang, L.; Wang, X.; Li, D.; Huang, H.; et al. China’ ‘s wetland change (1990–2000) determined by remote sensing. Sci. China Earth Sci. 2010, 53, 1036–1042. [Google Scholar] [CrossRef]
- Chen, Y.M.; Liu, T.Q.; Huang, Y.; Yang, J.; Li, X.L.; Xiao, Z.H. Remote sensing research of wetland current status and change in the Yangze River Basin. Resour. Environ. Yangtze Basin 2014, 23, 801–808. (In Chinese) [Google Scholar]
- Cyranoski, D. Putting China’s wetlands on the map. Nature 2009, 458, 134. [Google Scholar] [CrossRef] [PubMed]
- Tong, L.; Xu, X.; Fu, Y.; Li, S. Wetland changes and their responses to climate change in the “three-river headwaters” region of China since the 1990s. Energies 2014, 7, 2515–2534. [Google Scholar] [CrossRef] [Green Version]
- Xu, W.H.; Fan, X.Y.; Ma, J.G.; Stuart, L.P.; Kong, L.Q.; Zeng, Y.; Li, X.S.; Xiao, Y.; Zheng, H.; Liu, J.G.; et al. Hidden Loss of Wetlands in China; Elsevier Ltd.: Amsterdam, The Netherlands, 2019; Volume 29, pp. 3065–3071. [Google Scholar]
- Gemechu, G.F.; Rui, X.; Lu, H. Wetland Change Mapping Using Machine Learning Algorithms, and Their Link with Climate Variation and Economic Growth: A Case Study of Guangling County, China. Sustainability 2021, 14, 439. [Google Scholar] [CrossRef]
- Gong, N.; Niu, Z.G.; Qi, W.; Zhang, H.Y. Driving forces of wetland change in China. J. Remote Sens. 2016, 20, 172–183. (In Chinese) [Google Scholar]
- Lu, C.; Ren, C.; Wang, Z.; Zhang, B.; Man, W.; Yu, H.; Gao, Y.; Liu, M. Monitoring and assessment of wetland loss and fragmentation in the Cross-boundary Protected Area: A case study of Wusuli River Basin. Remote Sens. 2019, 11, 2581. [Google Scholar] [CrossRef] [Green Version]
- Zhao, S.; Fang, J.; Miao, S.; Gu, B.; Tao, S.; Peng, C.; Tang, Z. The 7-decade degradation of a large freshwater lake in Central Yangtze River, China. Environ. Sci. Technol. 2005, 39, 431–436. [Google Scholar] [CrossRef]
- Mao, D.H.; Wang, Z.M.; Du, B.J.; Li, L.; Tian, Y.L.; Jia, M.M.; Zeng, Y.; Song, K.S.; Jiang, M.; Wang, Y.Q. National wetland mapping in China: A new product resulting from object-based and hierarchical classification of Landsat 8 OLI images. ISPRS J. Photogramm. Remote Sens. 2020, 164, 11–25. [Google Scholar] [CrossRef]
- Wu, Y.F.; Zhang, G.X.; Rousseau, A.N. Quantitative assessment on watershed-scale hydrological services of wetlands. Sci. China Earth Sci. 2020, 50, 281–294. (In Chinese) [Google Scholar]
- Liu, J.Y.; Kuang, W.H.; Zhang, Z.X.; Xu, X.L.; Qin, Y.W.; Ning, J.; Zhou, W.C.; Zhang, S.W.; Li, R.D.; Yan, C.Z.; et al. Spatiotemporal characteristics, patterns, and causes of land-use changes in China since the late 1980s. J. Geogr. Sci. 2014, 69, 3–14. (In Chinese) [Google Scholar] [CrossRef]
- Liu, M.L.; Tang, X.M.; Liu, J.Y.; Zhuang, D.F. Research on scaling effect based on 1 km grid cell date. J. Remote Sens. 2001, 3, 183–190. (In Chinese) [Google Scholar]
- Yimam, A.Y.; Assefa, T.T.; Sishu, F.K.; Tilahun, S.A.; Reyes, M.R.; Prasad, P.V. Estimating Surface and Groundwater Irrigation Potential under Different Conservation Agricultural Practices and Irrigation Systems in the Ethiopian Highlands. Water 2021, 13, 1645. [Google Scholar] [CrossRef]
- López-Senespleda, E.; Calama, R.; Ruiz-Peinado, R. Estimating forest floor carbon stocks in woodland formations in Spain. Sci. Total Environ. 2021, 788, 147734. [Google Scholar] [CrossRef]
- Grumbine, R.E. Assessing environmental security in China. Front. Ecol. Environ. 2014, 12, 403–411. [Google Scholar] [CrossRef]
- Mao, D.H.; Luo, L.; Wang, Z.M.; Wilson, M.C.; Zeng, Y.; Wu, B.F.; Wu, J.G. Conversions between natural wetlands and farmland in China: A multiscale geospatial analysis. Sci. Total Environ. 2018, 634, 550–560. [Google Scholar] [CrossRef] [PubMed]
- Lu, C.Y.; Wang, Z.M.; Li, L.; Wu, P.Z.; Mao, D.H.; Jia, M.M.; Dong, Z.Y. Assessing the conservation effectiveness of wetland protected areas in Northeast China. Wetl. Ecol. Manag. 2016, 24, 381–398. [Google Scholar] [CrossRef]
- Wang, Z.; Wu, J.; Madden, M.; Mao, D. China’s wetlands: Conservation plans and policy impacts. Ambio 2012, 41, 782–786. [Google Scholar] [CrossRef] [Green Version]
- Wong, C.P.; Jiang, B.; Bohn, T.J.; Lee, K.N.; Lettenmaier, D.P.; Ma, D.; Ouyang, Z. Lake and wetland ecosystem services measuring water storage and local climate regulation. Water Res. 2017, 53, 3197–3223. [Google Scholar] [CrossRef] [Green Version]
- Liu, D.; Wang, J.; Li, C.H.; Cai, Y.P.; Liu, Q. Research Progress on the impact of hydrological connectivity on lake ecological environment. Resour. Environ. Yangtze Basin 2019, 28, 1702–1715. (In Chinese) [Google Scholar]
- Xu, T.; Weng, B.; Yan, D.; Wang, K.; Li, X.; Bi, W.; Li, M.; Cheng, X.; Liu, Y. Wetlands of international importance: Status, threats, and future protection. Int. J. Environ. 2019, 16, 1818. [Google Scholar] [CrossRef] [PubMed] [Green Version]
- Yoshimura, C.; Omura, T.; Furumai, H.; Tockner, K. Present state of rivers and streams in Japan. River Res. Appl. 2005, 21, 93–112. [Google Scholar] [CrossRef]
- Alexander, P.; Rounsevell, M.D.A.; Dislich, C.; Dodson, J.R.; Engström, K.; Moran, D. Drivers for global agricultural land use change: The nexus of diet, population, yield and bioenergy. Glob. Environ. Chang. 2015, 35, 138–147. [Google Scholar] [CrossRef] [Green Version]
- Han, L.; Xu, Y.; Lei, C.; Yang, L.; Deng, X.; Hu, C.; Xu, G. Degrading river network due to urbanization in Yangtze River Delta. J. Geogr. Sci. 2016, 26, 694–706. [Google Scholar] [CrossRef] [Green Version]
- Yu, W.; Zang, S.; Wu, C.; Liu, W.; Na, X. Analyzing and modeling land use land cover change (LUCC) in the Daqing City, China. Appl. Geogr. 2011, 31, 600–608. [Google Scholar] [CrossRef]
- Lu, M.Z.; Zou, Y.C.; Xun, Q.L.; Yu, Z.C.; Jiang, M.; Sheng, L.X.; Lu, X.G.; Wang, D.L. Anthropogenic disturbances caused declines in the wetland area and carbon pool in China during the last four decades. Glob. Chang. Biol. 2021, 27, 3837–3845. [Google Scholar] [CrossRef] [PubMed]
- Wang, G.J.; Jiang, T.; Wang, Y.J.; Yu, Z.Y. Characteristics of climate change in Dongting Lake Basin (1961–2003). J. Lake Sci. 2006, 5, 470–475. (In Chinese) [Google Scholar]
- Ahmad, Q.U.A.; Biemans, H.; Moors, E.; Shaheen, N.; Masih, I. The Impacts of Climate Variability on Crop Yields and Irrigation Water Demand in South Asia. Water 2021, 13, 50. [Google Scholar] [CrossRef]
- Yang, M.; Mao, D.H.; Liu, P.L.; Liu, W. Quantitative assessment on influence of runoff and sediment evolution of Dongting Lake and human activities to the runoff in the period of 1951–2015. Sci. Soil Water Conserv. 2019, 1, 38–43+69. (In Chinese) [Google Scholar]
- Xie, Y.H.; Tang, Y.; Chen, X.S.; Li, F.; Deng, Z. The impact of Three Gorges Dam on the downstream eco-hydrological environment and vegetation distribution of East Dongting Lake. Ecohydrology 2015, 8, 738–746. [Google Scholar] [CrossRef]
- Zhou, H.; Mao, D.H.; Liu, P.L. The investigation on water lever of east Dongting Lake affected by Three-Gorge reservoir. Trans. Oceanol. Limnol. 2014, 4, 180–186. (In Chinese) [Google Scholar]


| Research Distribution | Covered Cities |
|---|---|
| Northern Hunan | Yiyang city, Changde city, Yueyang city |
| Western Hunan | Zhangjiajie city, Xiangxi autonomous prefecture, Huaihua city |
| Southern Hunan | Hengyang city, Chenzhou city, Yongzhou city |
| Central Hunan | Loudi city, Shaoyang city |
| Eastern Hunan | Zhuzhou city, Xiangtan city, Changsha city |
Publisher’s Note: MDPI stays neutral with regard to jurisdictional claims in published maps and institutional affiliations. |
© 2022 by the authors. Licensee MDPI, Basel, Switzerland. This article is an open access article distributed under the terms and conditions of the Creative Commons Attribution (CC BY) license (https://creativecommons.org/licenses/by/4.0/).
Share and Cite
Yang, Z.-M.; Han, L.-F.; Liu, Q.-P.; Li, C.-H.; Pan, Z.-Y.; Xu, K. Spatial and Temporal Changes in Wetland in Dongting Lake Basin of China under Long Time Series from 1990 to 2020. Sustainability 2022, 14, 3620. https://doi.org/10.3390/su14063620
Yang Z-M, Han L-F, Liu Q-P, Li C-H, Pan Z-Y, Xu K. Spatial and Temporal Changes in Wetland in Dongting Lake Basin of China under Long Time Series from 1990 to 2020. Sustainability. 2022; 14(6):3620. https://doi.org/10.3390/su14063620
Chicago/Turabian StyleYang, Zhi-Min, Long-Fei Han, Qing-Ping Liu, Chun-Hui Li, Zhao-Yi Pan, and Ke Xu. 2022. "Spatial and Temporal Changes in Wetland in Dongting Lake Basin of China under Long Time Series from 1990 to 2020" Sustainability 14, no. 6: 3620. https://doi.org/10.3390/su14063620
APA StyleYang, Z.-M., Han, L.-F., Liu, Q.-P., Li, C.-H., Pan, Z.-Y., & Xu, K. (2022). Spatial and Temporal Changes in Wetland in Dongting Lake Basin of China under Long Time Series from 1990 to 2020. Sustainability, 14(6), 3620. https://doi.org/10.3390/su14063620