
The Effectiveness of Centralized Payment Network Advertisements on Digital Branding during the COVID-19 Crisis

 ,
,  , ,
, ,  , ,
, ,
Abstract
1. Introduction
Digital Marketing of Centralized Payment Systems and FinTech
2. Literature Review
2.1. Passive Crowdsourcing Participatory Culture and Mind Sharing
2.2. Crisis and Risk Management
2.3. Innovative Crisis Effects Analysis
2.4. Big Data, and Web Analytics of Passive Crowdsourcing and FinTech
3. Materials and Methods
3.1. Problem Formulation and Research Hypotheses
- Is online advertisement a good option during a crisis, or will the traffic attracted by brand name not justify the investment?
- Is search engine optimization of the network’s website an effective way to use resources during a crisis, or will customers increase their focus on offline consumption choices?
- Should an organization allocate resources in brand empowerment through digital marketing, or the is significance of the brand’s name dwindling during a pandemic crisis?
3.2. Sample Selection and Collection
4. Model Formulation
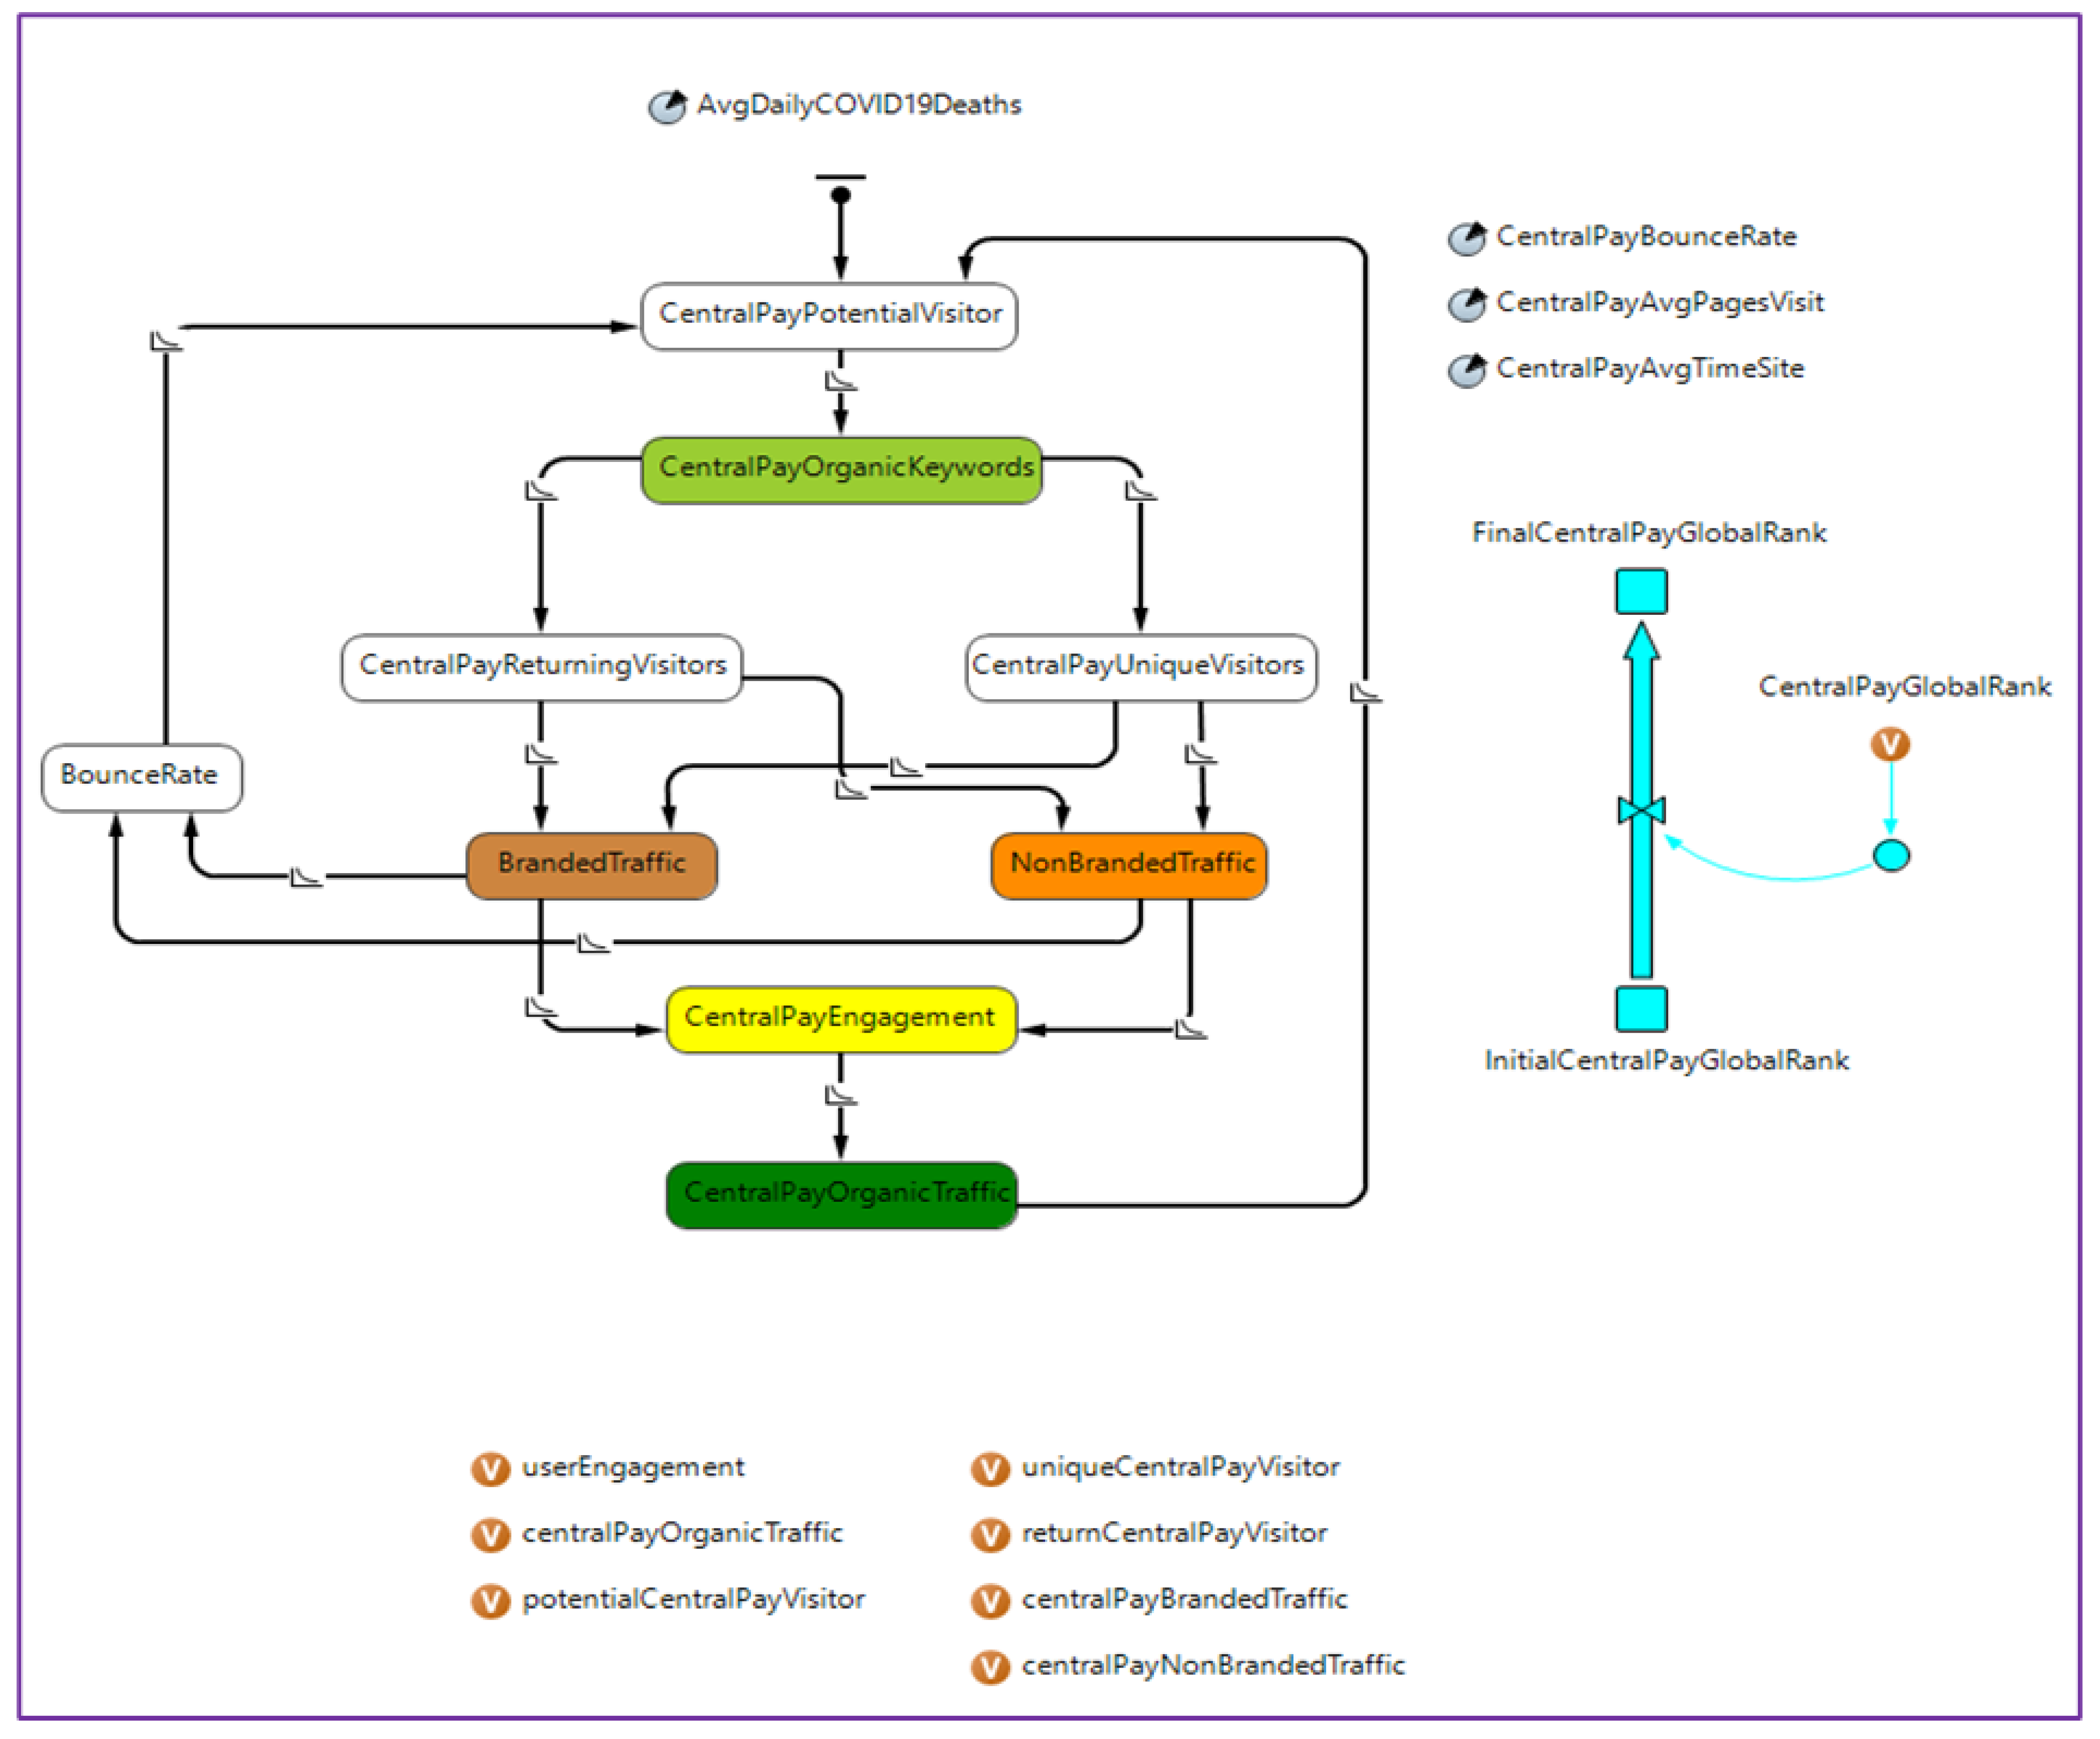
4.1. Diagnostic Model Deployment
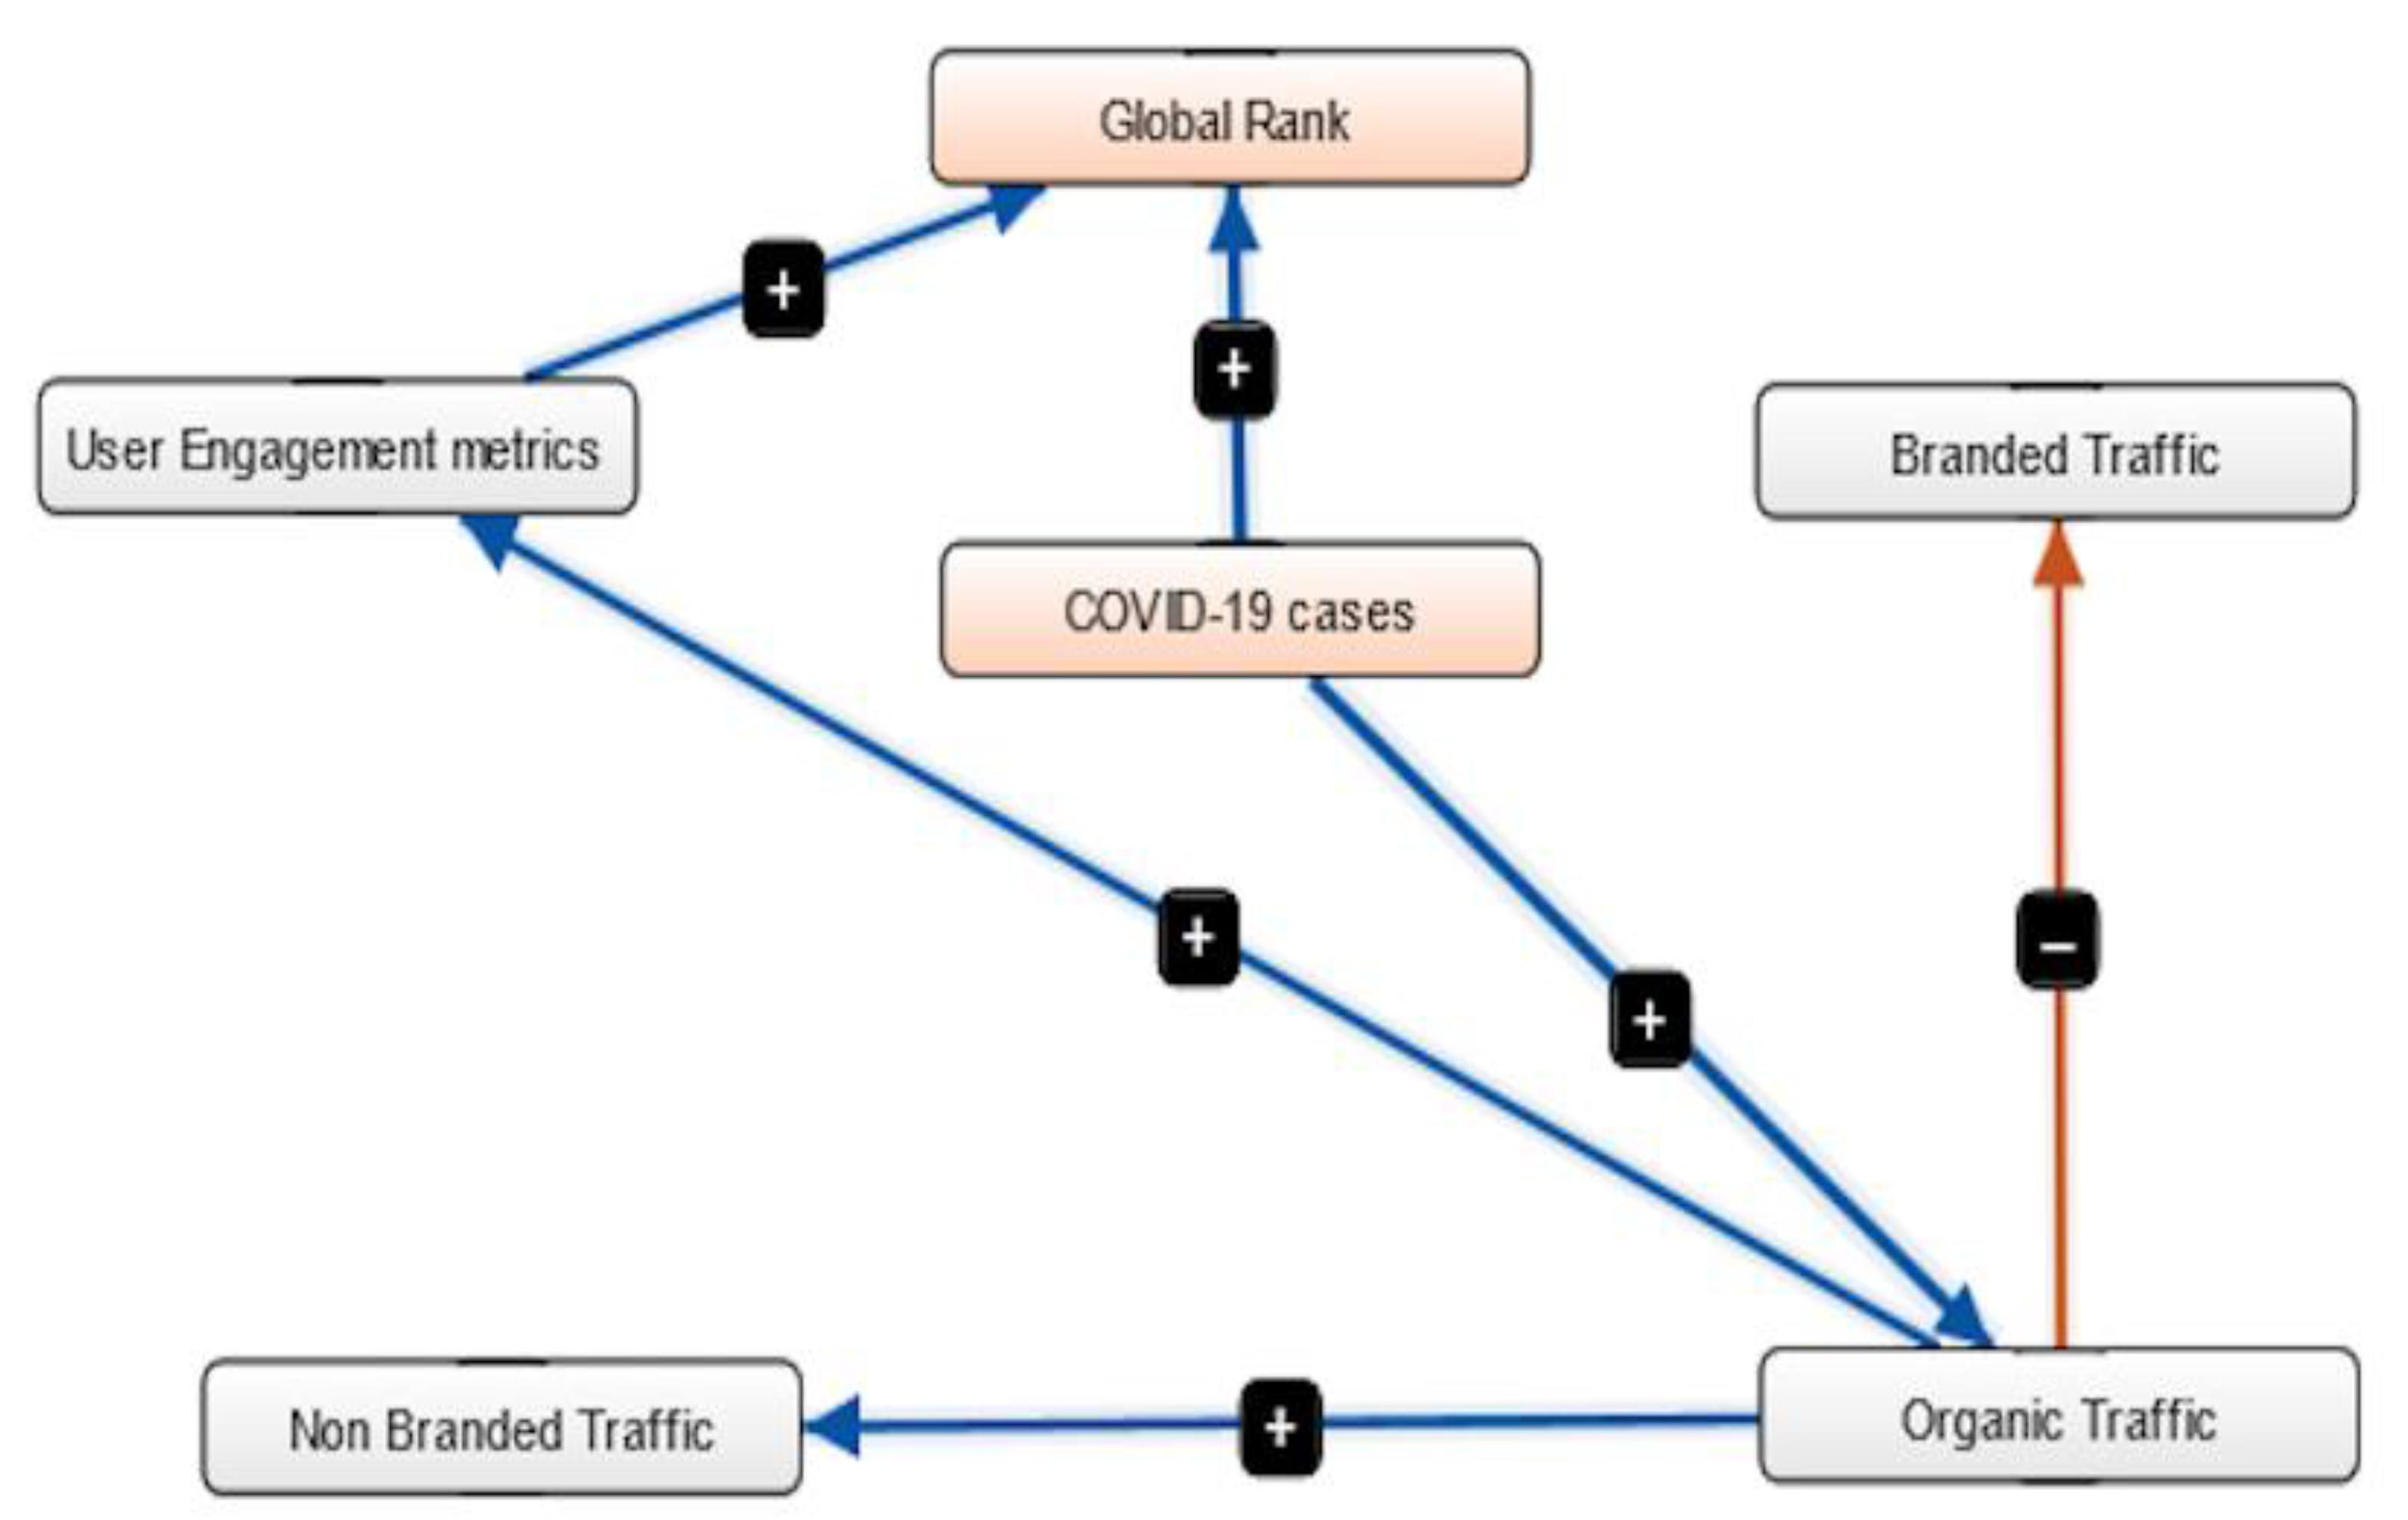
4.2. FCM Analysis with Factors from the Model
5. Results
5.1. Statistical Analysis
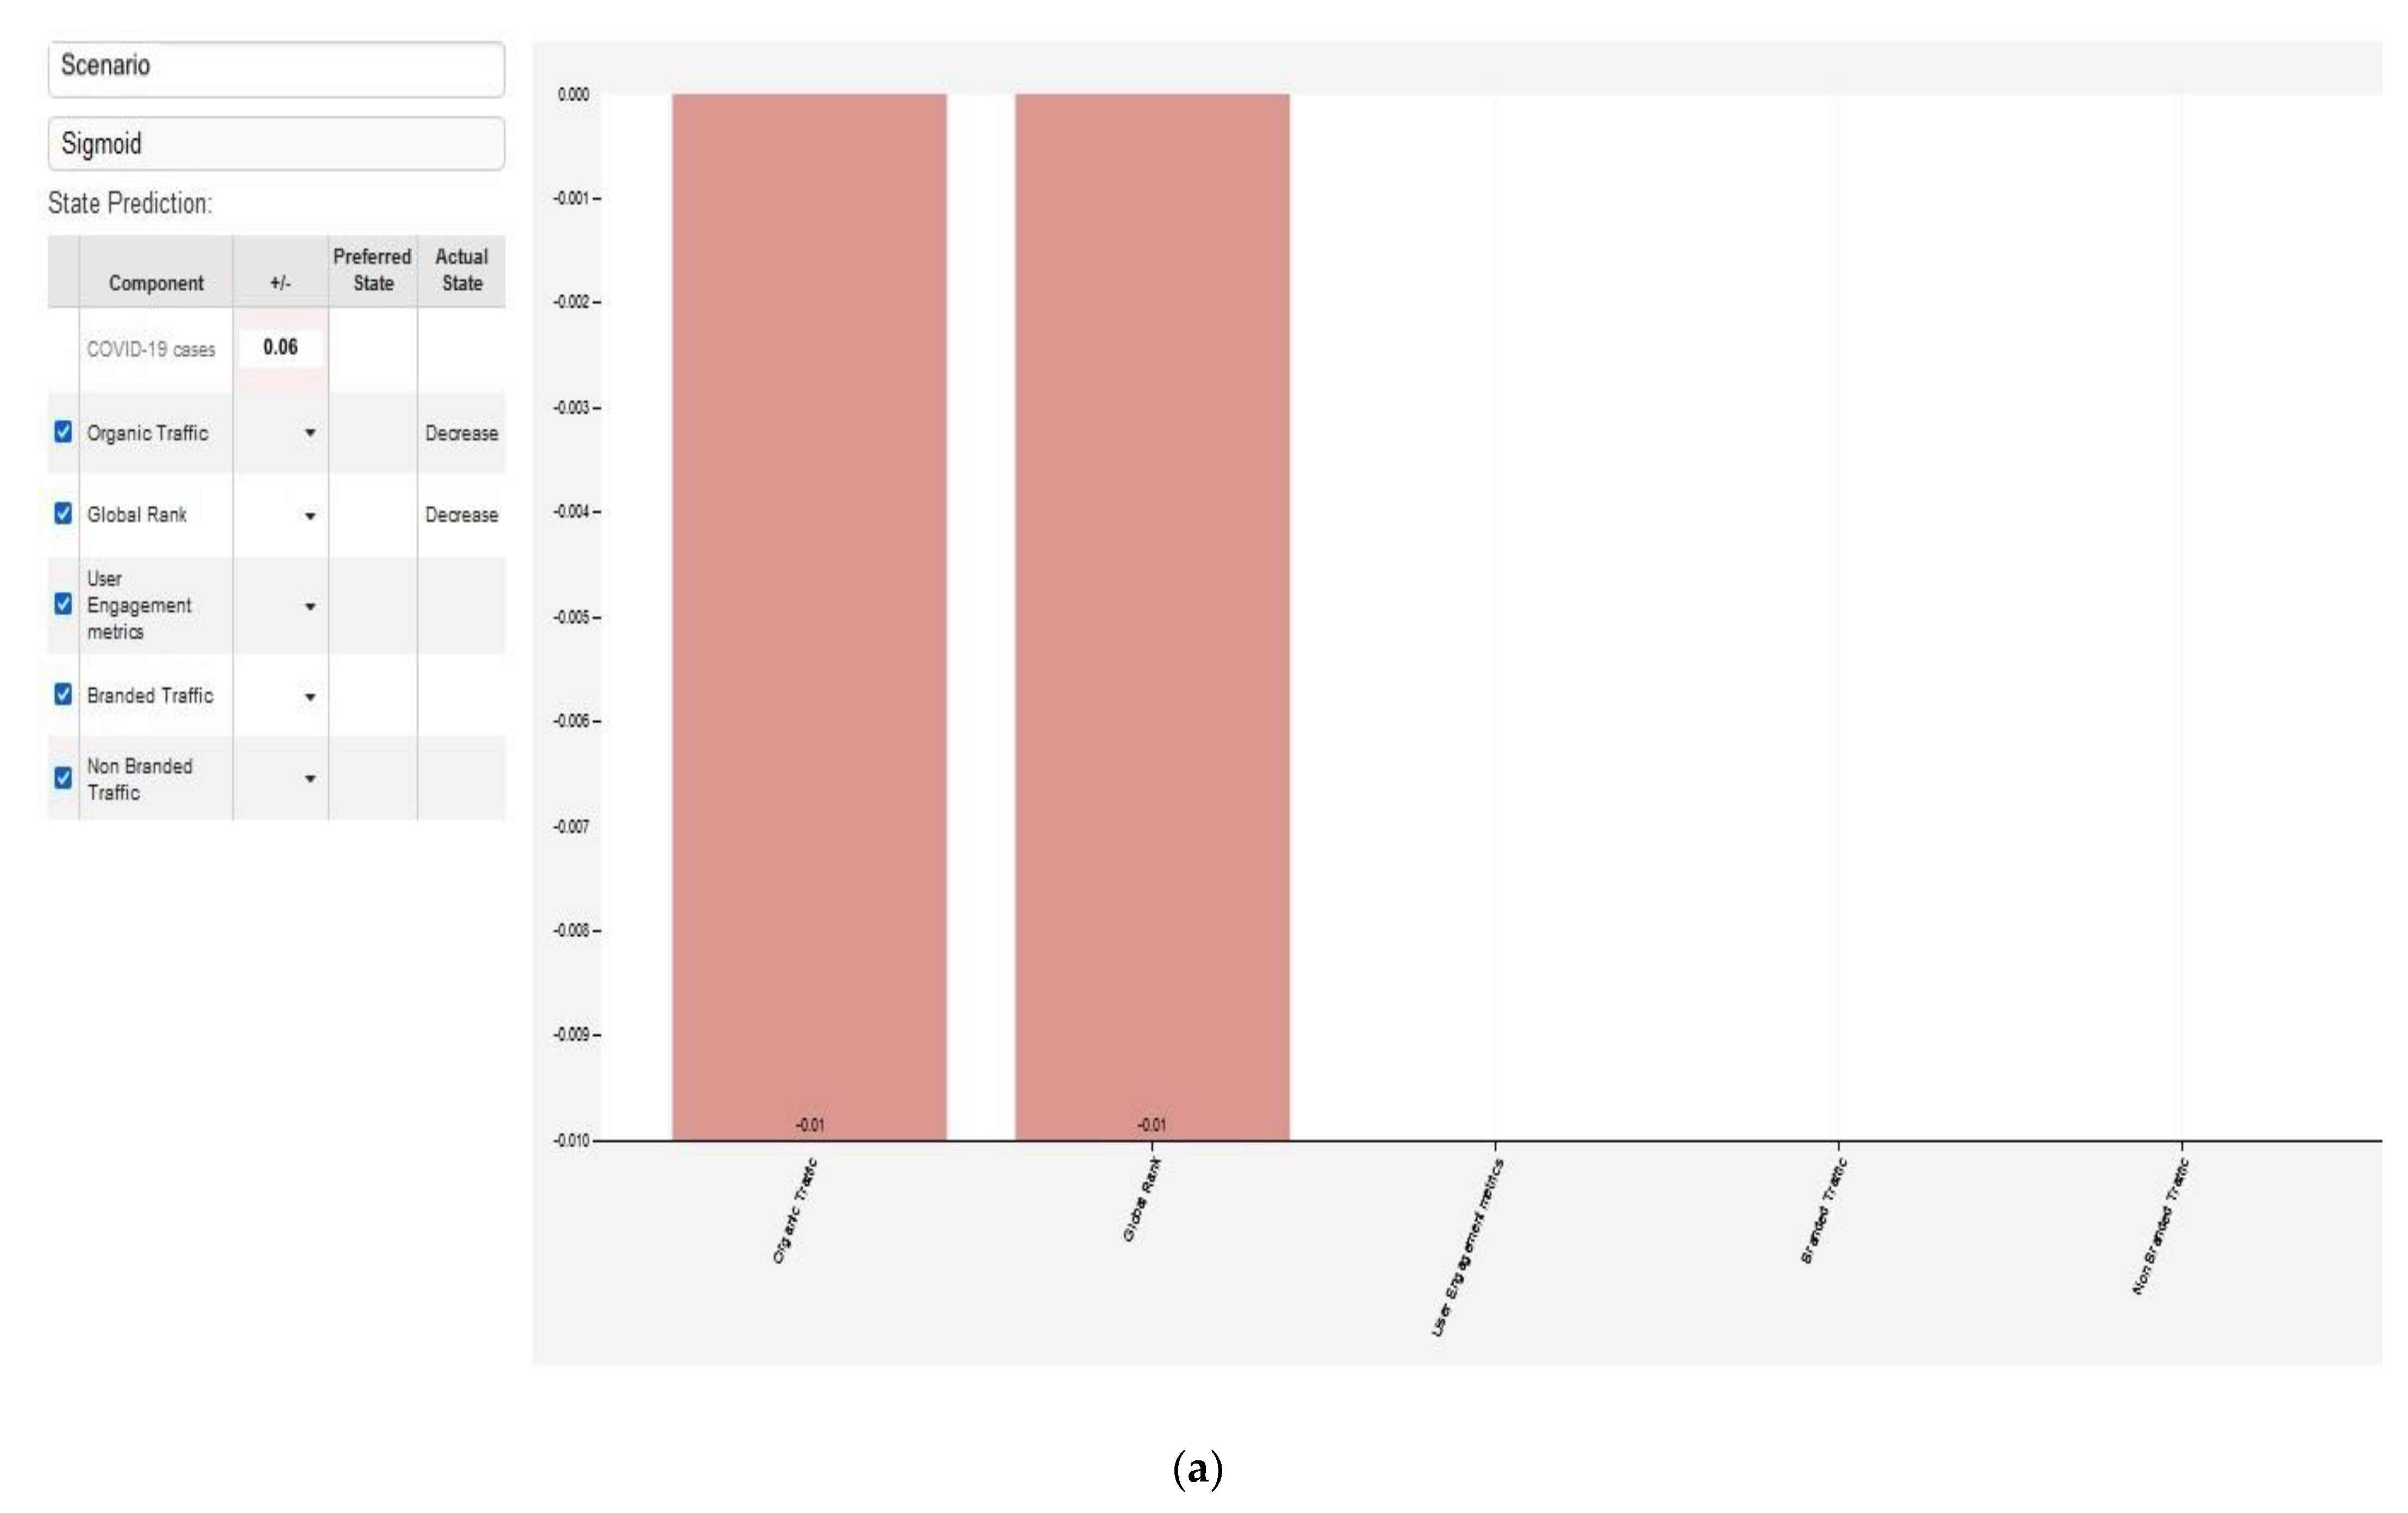
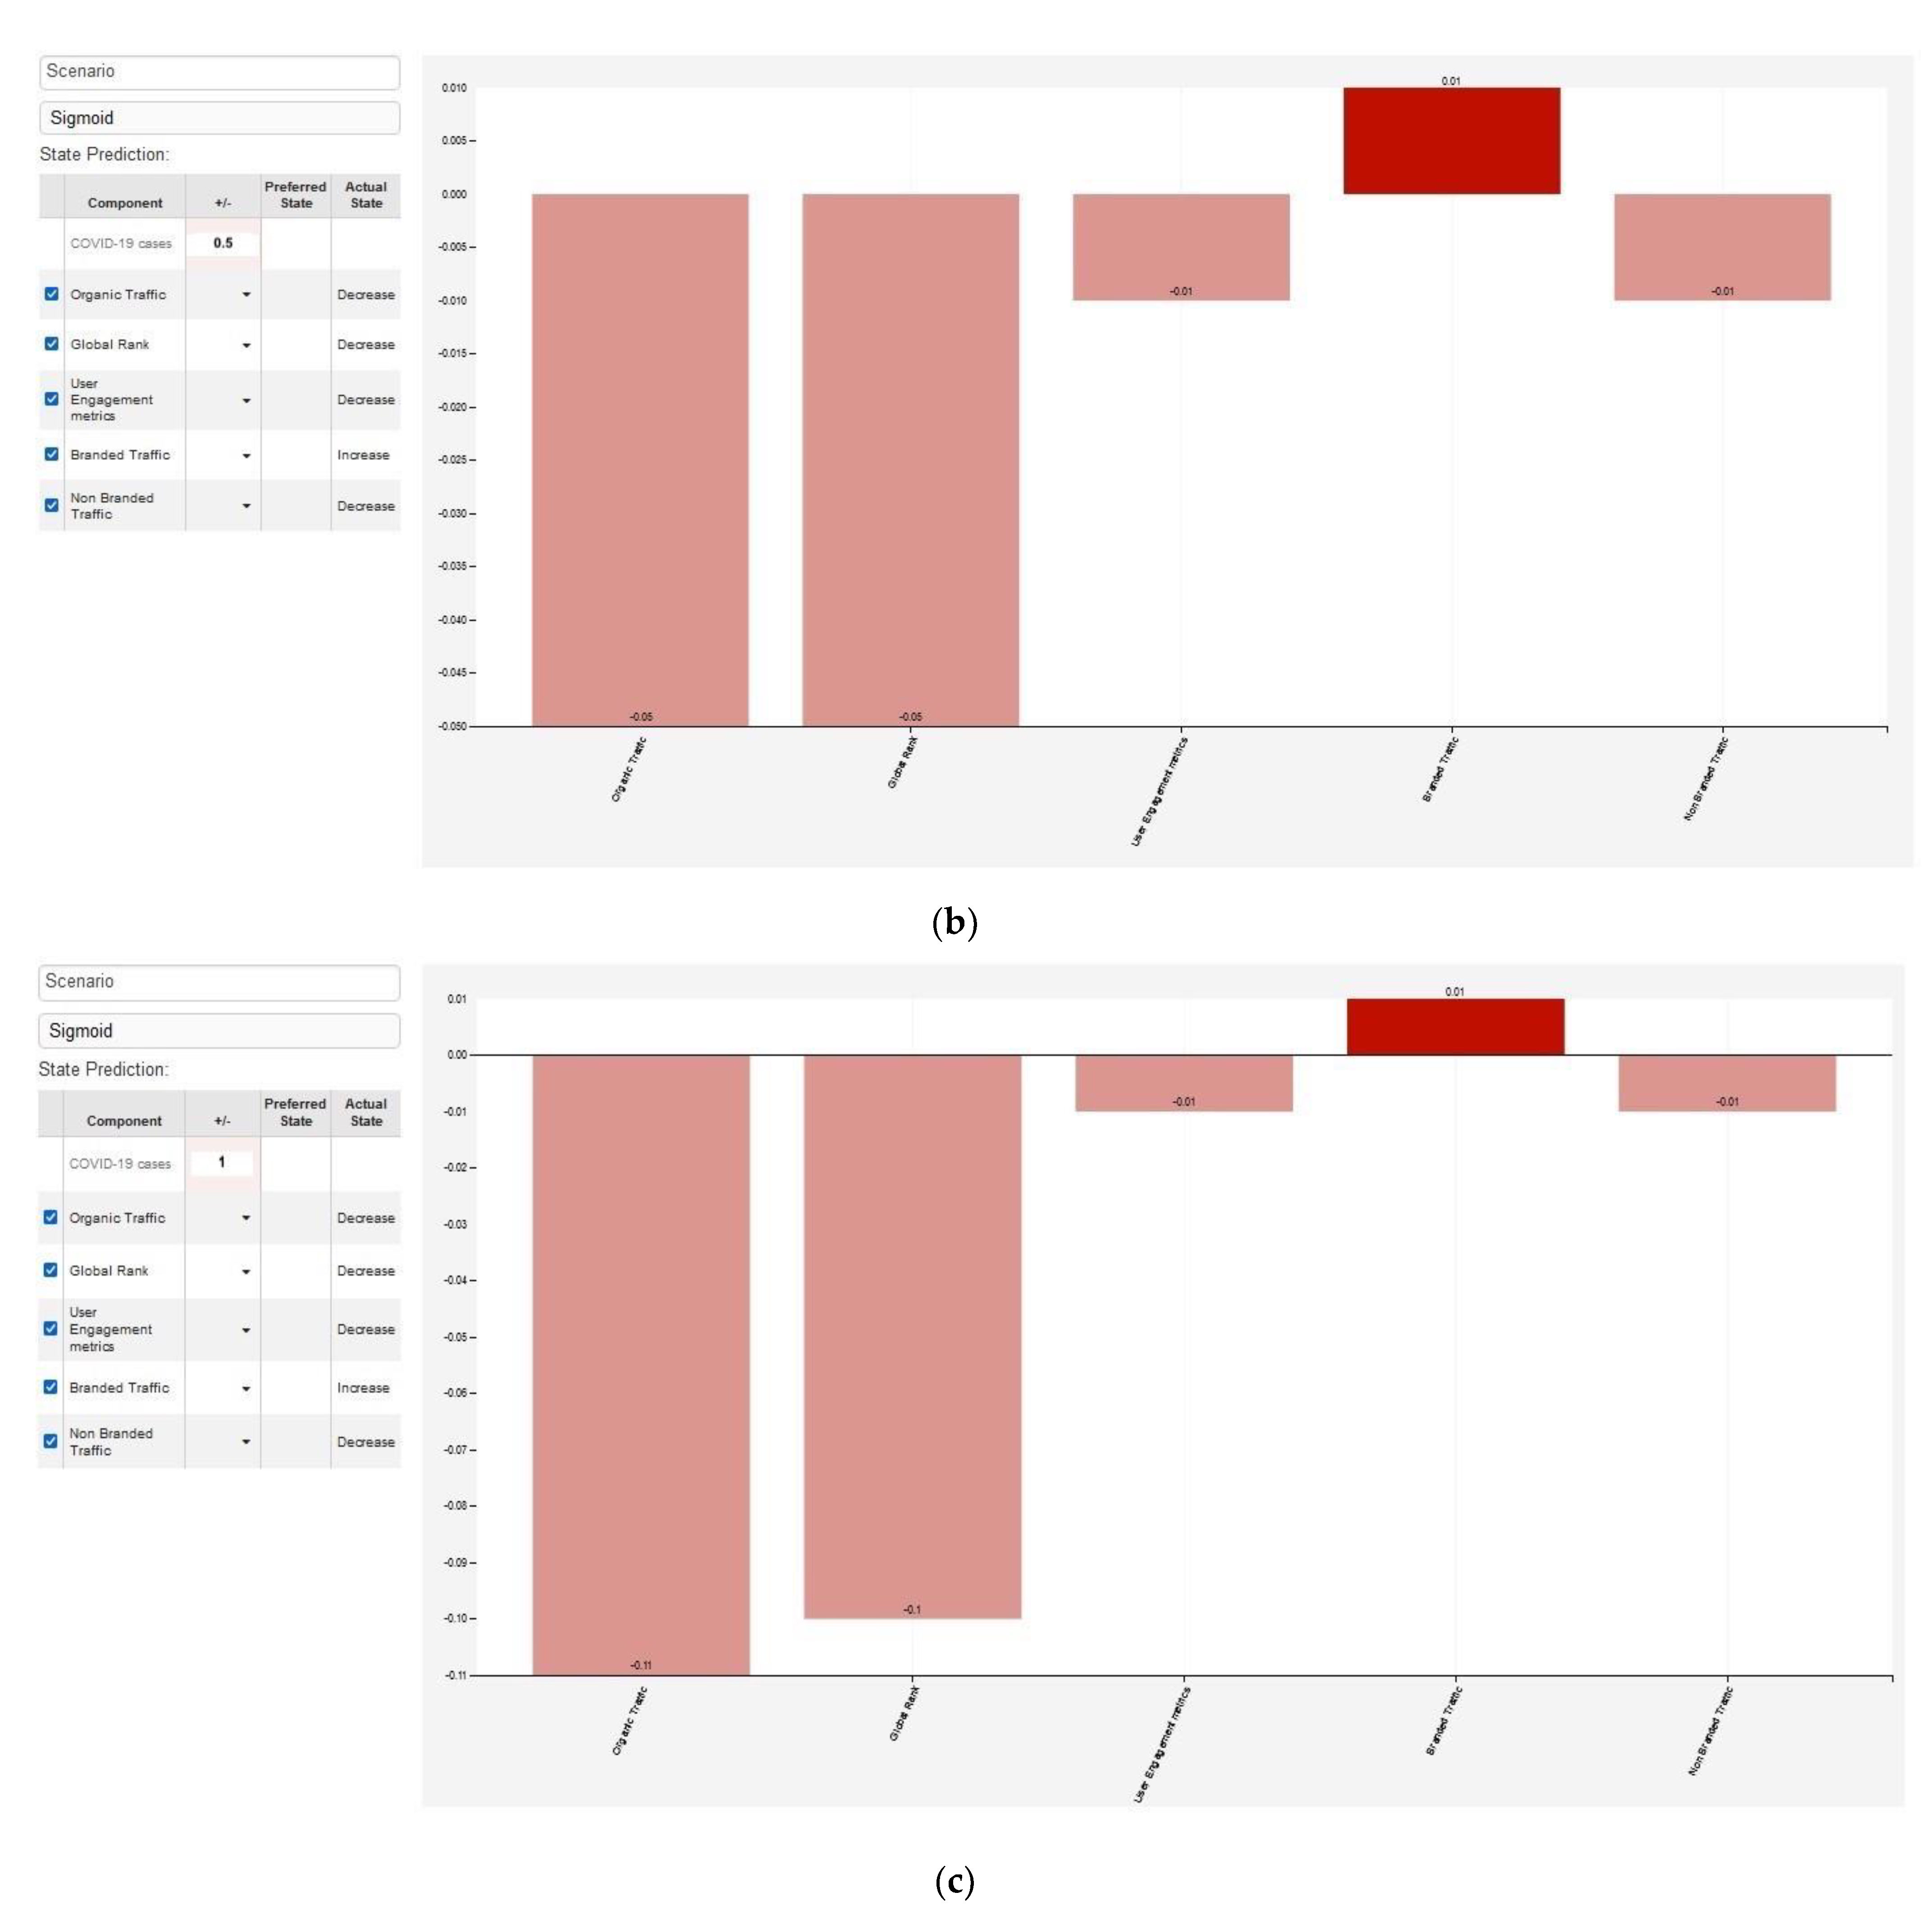
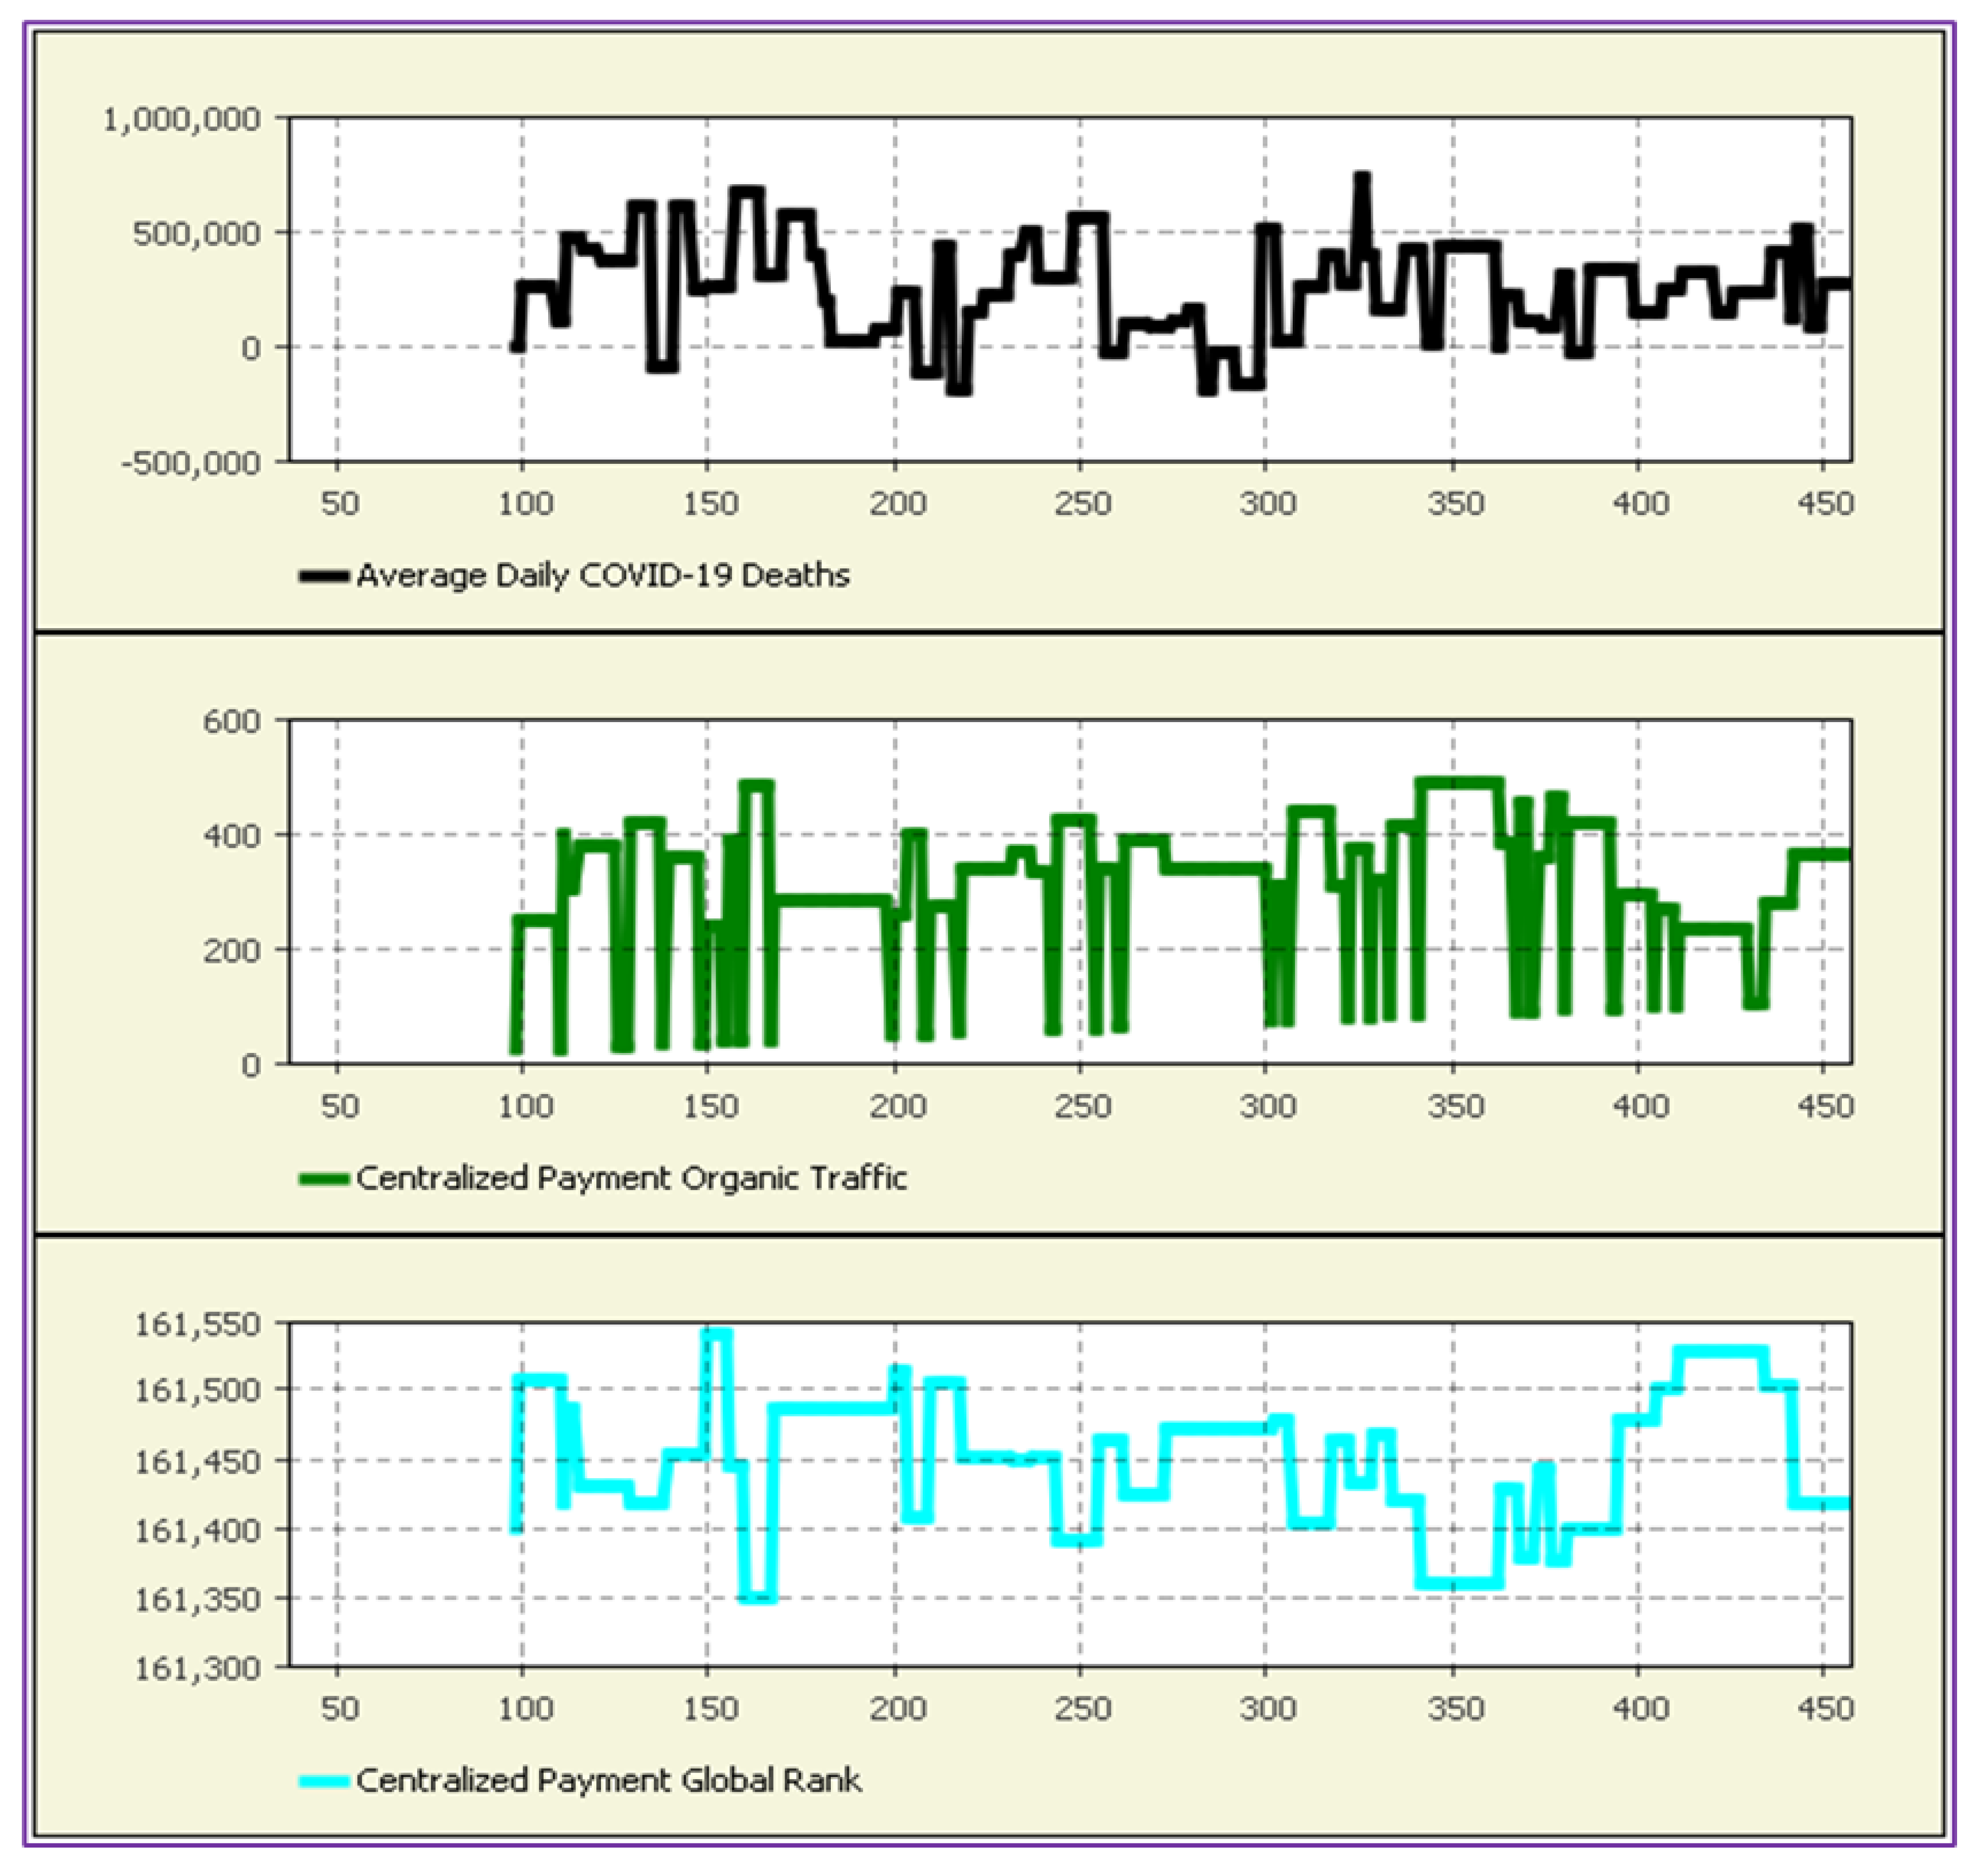
5.2. Development of Predictive and Simulation Model
6. Discussion
7. Conclusions
8. Research Limitations and Future Research
Author Contributions
Funding
Institutional Review Board Statement
Informed Consent Statement
Data Availability Statement
Conflicts of Interest
References
- Chaffey, D.; Ellis-Chadwick, F. Digital Marketing, 7th ed.; Pearson: Harlow, England; New York, NY, USA, 2019; ISBN 978-1-292-24157-9. Available online: https://books.google.co.jp/books?hl=zh-CN&lr=&id=-1yGDwAAQBAJ&oi=fnd&pg=PT17&dq=Ellis-Chadwick,+F.+Digital+Marketing&ots=XiTr8VjI16&sig=TXNJgN78UgoO0dYk9_NcfWW7fT4#v=onepage&q=Ellis-Chadwick%2C%20F.%20Digital%20Marketing&f=false (accessed on 12 July 2021).
- Bhargava, M. Up keeping with the new era of the digital world: Digital marketing & prospects. Indian Streams Res. J. 2015, 4, 7. [Google Scholar]
- Sakas, D.; Giannakopoulos, N. Harvesting Crowdsourcing Platforms’ Traffic in Favour of Air Forwarders’ Brand Name and Sustainability. Sustainability 2021, 13, 8222. [Google Scholar] [CrossRef]
- Sakas, D.; Reklitis, D. The impact of organic traffic of crowdsourcing platforms on airlines & rsquo; website traffic and user engagement. Sustainability 2021, 13, 8850. [Google Scholar] [CrossRef]
- Phippen, A.D.; Sheppard, L.; Furnell, S. A practical evaluation of Web analytics. Internet Res. 2004, 14, 284–293. [Google Scholar] [CrossRef]
- Sakas, D.P.; Giannakopoulos, N.T.; Reklitis, D.P.; Dasaklis, T.K. The effects of cryptocurrency trading websites on airlines & rsquo; advertisement campaigns. J. Theor. Appl. Electron. Commer. Res. 2021, 16, 3099–3119. [Google Scholar] [CrossRef]
- Key, T.M. Domains of digital marketing channels in the sharing economy. J. Mark. Channels 2017, 24, 27–38. [Google Scholar] [CrossRef]
- Court, D.; Elzinga, D.; Mulder, S.; Jørgen Vetvik, O. The Consumer Decision Journey. 2016. Available online: https://www.mckinsey.com/business-functions/marketing-and-sales/our-insights/the-consumer-decision-journey (accessed on 12 July 2021).
- Buckley, R.P.; Webster, S. FinTech in Developing Countries: Charting New Customer Journeys. J. Financ. Transform. 2016, 44, 151–159. [Google Scholar]
- Nasiopoulos, D.Κ.; Sakas, D.P.; Trivellas, P. The Role of Digital Marketing in the Development of a Distribution and Logistics Network of Information Technology Companies. In Business Intelligence and Modelling; Springer: Berlin/Heidelberg, Germany, 2021; pp. 267–276. [Google Scholar]
- Drivas, I.C.; Sakas, D.P.; Giannakopoulos, G.A.; Kyriaki-Manessi, D. Optimization of Paid Search Traffic Effectiveness and Users’ Engagement Within Websites. In International Conference on Business Intelligence & Modelling; Springer: Berlin/Heidelberg, Germany, 2021; pp. 17–30. [Google Scholar]
- Drivas, I.C.; Sakas, D.P.; Giannakopoulos, G.A.; Kyriaki-Manessi, D. Big data analytics for search engine optimization. Big Data Cogn. Comput. 2020, 4, 5. [Google Scholar] [CrossRef]
- Statista Research Department Fintech Financial Technology Sector Revenue Worldwide in 2017 and 2018, with a Forecast until 2024. Available online: https://www.statista.com/statistics/1214244/global-fintech-revenue/ (accessed on 12 July 2021).
- PayPal Inc. Online Payments. 2022. Available online: www.paypal.com (accessed on 7 January 2022).
- Skrill Limited. Electronic Wallet. 2022. Available online: www.skrill.com (accessed on 7 January 2022).
- Stripe Inc. Online Payment Processing for Internet Businesses. 2022. Available online: www.stripe.com (accessed on 7 January 2022).
- Authorize.Net. Payment Processing: Accept Payments Anywhere. 2022. Available online: www.authorize.net (accessed on 7 January 2022).
- BlueSnap Inc. All in One Payment Platform to Increase Sales and Reduce Costs. 2022. Available online: www.home.bluesnap.com (accessed on 7 January 2022).
- Ma, Y.; Liu, D. Introduction to the special issue on Crowdfunding and FinTech. Financial Innov. 2017, 3, 8. [Google Scholar] [CrossRef]
- Chen, L.; Huang, Z.; Liu, D. Pure and hybrid crowds in crowdfunding markets. Financial Innov. 2016, 2, 253. [Google Scholar] [CrossRef]
- Howe, J. The rise of crowdsourcing. Wired Mag. 2006, 14, 1–4. [Google Scholar]
- Estellés-Arolas, E.; González-Ladrón-De-Guevara, F. Towards an integrated crowdsourcing definition. J. Inf. Sci. 2012, 38, 189–200. [Google Scholar] [CrossRef]
- Mourelatos, E.; Frarakis, N.; Tzagarakis, M. A study on the evolution of crowdsourcing websites. Eur. J. Soc. Sci. Educ. Res. 2017, 11, 29–40. [Google Scholar] [CrossRef][Green Version]
- Bigham, J.P.; Bernstein, M.S.; Adar, E. Human-Computer Interaction and Collective Intelligence; Carnegie Mellon University: Pittsburgh, PA, USA, 2014. [Google Scholar] [CrossRef]
- Zoref, L. Mindsharing: The Art of Crowdsourcing Everything; Penguin: London, UK, 2015; ISBN 9781101633649. [Google Scholar]
- Surowiecki, J. The Wisdom of Crowds; Anchor: London, UK, 2005. [Google Scholar]
- Wagner, C.; Vinaimont, T. Evaluating the wisdom of crowds. Proc. Issues Inf. Syst. 2010, 11, 724–732. [Google Scholar]
- Babich, V.; Marinesi, S. Does crowdfunding benefit entrepreneurs and venture capital investors? Manuf. Serv. 2021, 23, 508–524. [Google Scholar]
- Jenkins, H.; Ito, M.; Boyd, D. Participatory Culture in a Networked Era: A Conversation on Youth, Learning, Commerce, and Politics; John Wiley & Sons: Hoboken, NJ, USA, 2015; ISBN 9780745689432. [Google Scholar]
- Lenart-Gansiniec, R. Crowdfunding in Public Sector: A Systematic Literature Review. In Crowdfunding in the Public Sector; Lenart-Gansiniec, R., Chen, J., Eds.; Contributions to Finance and Accounting; Springer International Publishing: Cham, Denmark, 2021; pp. 21–42. ISBN 978-3-030-77840-8. [Google Scholar]
- Allon, G.; Babich, V. Crowdsourcing and crowdfunding in the manufacturing and services sectors. Manuf. Serv. Oper. Manag. 2020, 22, 102–112. [Google Scholar] [CrossRef]
- Kuusela, H. Literature and participatory culture online: Literary crowdsourcing and its discontents. Crit. Arts 2018, 32, 1–17. [Google Scholar] [CrossRef]
- Villi, M.; Matikainen, J. Participation in social media: Studying explicit and implicit forms of participation in communicative social networks. Media Commun. 2016, 4, 109–117. [Google Scholar] [CrossRef][Green Version]
- van Dijck, J. Users like you? Theorizing agency in user-generated content. Media, Cult. Soc. 2009, 31, 41–58. [Google Scholar] [CrossRef]
- Schäfer, M. How User Participation Transforms Cultural Production; Amsterdam University Press: Amsterdam, The Netherlands, 2011; ISBN 9789089642561. [Google Scholar]
- Liu, H.K. Crowdsourcing: Citizens as coproducers of public services. Policy Internet 2021, 13, 315–331. [Google Scholar] [CrossRef]
- Borgo, R.; Micallef, L.; Bach, B.; McGee, F.; Lee, B. Information visualization evaluation using crowdsourcing. Comput. Graph. Forum 2018, 37, 573–595. [Google Scholar] [CrossRef]
- Ghermandi, A.; Sinclair, M. Passive crowdsourcing of social media in environmental research: A systematic map. Glob. Environ. Chang. 2019, 55, 36–47. [Google Scholar] [CrossRef]
- Charalabidis, Y.; Loukis, E.N.; Androutsopoulou, A.; Karkaletsis, V.; Triantafillou, A. Passive crowdsourcing in government using social media. Transform. Gov. People 2014, 8, 283–308. [Google Scholar] [CrossRef]
- Connors, J.P.; Lei, S.; Kelly, M. Citizen science in the age of neogeography: Utilizing volunteered geographic information for environmental monitoring. Ann. Assoc. Am. Geogr. 2012, 102, 1267–1289. [Google Scholar] [CrossRef]
- Gaonkar, R.S.; Viswanadham, N. Analytical framework for the management of risk in supply chains. IEEE Trans. Autom. Sci. Eng. 2007, 4, 265–273. [Google Scholar] [CrossRef]
- Giudici, P. Fintech risk management: A research challenge for artificial intelligence in finance. Front. Artif. Intell. 2018, 1, 1. [Google Scholar] [CrossRef] [PubMed]
- British Standards Institution Risk Management-Guidelines (BS ISO 31000:2018 2018). Available online: https://www.bsigroup.com/en-GB/iso-31000-risk-management/ (accessed on 16 December 2021).
- Polinkevych, O.; Khovrak, I.; Trynchuk, V.; Klapkiv, Y.; Volynets, I. Business risk management in times of crises and pandemics. Montenegrin J. Econ. 2021, 17, 99–109. [Google Scholar] [CrossRef]
- Hopkin, P. Fundamentals of Risk Management: Understanding, Evaluating and Implementing Effective Risk Management; Kogan Page Publishers: London, UK, 2018; ISBN 9780749483081. [Google Scholar]
- Ullah, F.; Qayyum, S.; Thaheem, M.J.; Al-Turjman, F.; Sepasgozar, S.M. Risk management in sustainable smart cities governance: A TOE framework. Technol. Forecast. Soc. Chang. 2021, 167, 120743. [Google Scholar] [CrossRef]
- Hong, J.; Guo, P.; Deng, H.; Quan, Y. The adoption of supply chain service platforms for organizational performance: Evidences from Chinese catering organizations. Int. J. Prod. Econ. 2021, 237, 108147. [Google Scholar] [CrossRef]
- Sakas, D.P.; Kamperos, I.D.G.; Reklitis, P. Estimating Risk Perception Effects on Courier Companies & rsquo; Online Customer Behavior during a Crisis, Using Crowdsourced Data. Sustainability 2021, 13, 12725. [Google Scholar] [CrossRef]
- Bussmann, N.; Giudici, P.; Marinelli, D.; Papenbrock, J. Explainable AI in fintech risk management. Front. Artif. Intell. 2020, 3, 26. [Google Scholar] [CrossRef] [PubMed]
- Babina, T.; Bernstein, A.; Mezzanotti, F. Crisis Innovation. NBER Work. Papers N.27851 2020. Available online: https://doi.org/10.3386/w27851 (accessed on 7 January 2022).
- Manso, G.; Balsmeier, B.; Fleming, L. Heterogeneous Innovation and the Antifragile Economy. 2019. Available online: https://wwws.law.northwestern.edu/research-faculty/clbe/events/innovation/documents/balsemeier_manso_fleming_2019.pdf (accessed on 27 December 2021).
- Babina, T.; Fedyk, A.; He, A.X.; Hodson, J. Artificial Intelligence, Firm Growth, and Industry Concentration. SSRN Journal 2020. Available online: https://papers.ssrn.com/sol3/papers.cfm?abstract_id=3651052 (accessed on 7 January 2022).
- Kubina, M.; Varmus, M.; Kubinova, I. Use of big data for competitive advantage of company. Procedia Econ. Finance 2015, 26, 561–565. [Google Scholar] [CrossRef]
- Xu, Z.; Liu, Y.; Yen, N.Y.; Mei, L.; Luo, X.; Wei, X.; Hu, C. Crowdsourcing based description of urban emergency events using social media big data. IEEE Trans. Cloud Comput. 2020, 8, 387–397. [Google Scholar] [CrossRef]
- Wang, Y.; Xiuping, S.; Zhang, Q. Can fintech improve the efficiency of commercial banks? —An analysis based on big data. Res. Int. Bus. Finance 2021, 55, 101338. [Google Scholar] [CrossRef]
- Weischedel, B.; Matear, S.; Deans, K.R. The use of emetrics in strategic marketing decisions: A preliminary investigation. Int. J. Internet Mark. Advert. 2005, 2, 109. [Google Scholar] [CrossRef]
- Gour, A.; Aggarwal, S.; Erdem, M. Reading between the lines: Analyzing online reviews by using a multi-method Web-analytics approach. Int. J. Contemp. Hosp. Manag. 2021, 33, 490–512. [Google Scholar] [CrossRef]
- Wang, Y.; Deng, Q.; Rod, M.; Ji, S. A thematic exploration of social media analytics in marketing research and an agenda for future inquiry. J. Strat. Mark. 2021, 29, 1–21. [Google Scholar] [CrossRef]
- Meng, S.; He, X.; Tian, X. Research on Fintech development issues based on embedded cloud computing and big data analysis. Microprocess. Microsyst. 2021, 83, 103977. [Google Scholar] [CrossRef]
- Lee, I.; Shin, Y.J. Fintech: Ecosystem, business models, investment decisions, and challenges. Bus. Horiz. 2018, 61, 35–46. [Google Scholar] [CrossRef]
- Saura, J.R.; Palos-Sánchez, P.; Cerdá Suárez, L.M. Understanding the digital marketing environment with KPIs and web analytics. Future Internet 2017, 9, 76. [Google Scholar] [CrossRef]
- Chaffey, D.; Patron, M. From web analytics to digital marketing optimization: Increasing the commercial value of digital analytics. J. Direct Data Digit. Mark. Pr. 2012, 14, 30–45. [Google Scholar] [CrossRef]
- Kirsh, I.; Joy, M. Splitting the web analytics atom: From page metrics and kpis to sub-page metrics and KPIs. In Proceedings of the 10th International Conference on Web Intelligence, Mining and Semantics; Association for Computing Machinery: New York, NY, USA, 2020; pp. 33–43. [Google Scholar]
- Loftus, W. Demonstrating success: Web analytics and continuous improvement. J. Web Libr. 2012, 6, 45–55. [Google Scholar] [CrossRef]
- Slivka, M. What Is Alexa Rank and Its Value? Available online: https://attentioninsight.com/what-is-alexa-rank-and-its-value/ (accessed on 16 December 2021).
- What Is Organic Traffic? Definition—Omniconvert. Available online: https://www.omniconvert.com/what-is/organic-traffic/ (accessed on 9 April 2021).
- Bagdasarova, I. What Is Branded Traffic and How to Increase It. Available online: https://www.promodo.com/blog/branded-traffic-why-its-crucial-for-ecommerce-and-how-to-increase-it (accessed on 16 December 2021).
- SEO Glossary|Semrush. Available online: https://www.semrush.com/kb/925-glossary (accessed on 16 December 2021).
- Clifton, B. Advanced Web Metrics with Google Analytics; John Wiley & Sons: Indianapolis, IN, USA, 2012; ISBN 9781118168448. [Google Scholar]
- Hotjar. What Is Average Session Duration in Google Analytics? 2021. Available online: https://www.hotjar.com/google-analytics/glossary/session-duration/#body-top (accessed on 21 August 2021).
- Devathon. Top 10 Payment Gateways Around The World. 2021. Available online: https://devathon.com/top-10-payment-gateways/ (accessed on 16 August 2021).
- Khoumbati, K.; Themistocleous, M. Application of fuzzy simulation for the evaluation of enterprise application integration in healthcare organisations. Transform. Gov. People Process Policy 2007, 1, 230–241. [Google Scholar] [CrossRef]
- Bao, Z.; Shang, B. Self-efficacy and continuance intention of Web 2.0 platforms: A meta-analysis. Data Technol. Appl. 2021, 55, 511–526. [Google Scholar] [CrossRef]
- Şeker, A. The effects of COVID-19 pandemic on international trade and production in the age of industry 4.0: New evidence from european countries. In Industry 4.0 and Global Businesses; Enis, Y., Ed.; Emerald Publishing Limited: Bingley, UK, 2022; pp. 125–136. ISBN 9781801173261. [Google Scholar]
- Mokline, B.; Anis, B.A.M. Organizational resilience as response to a crisis: Case of COVID-19 crisis. Cont. Resil. Rev. 2021, 3, 232–247. [Google Scholar] [CrossRef]
- Florido-Benítez, L. International mobile marketing: A satisfactory concept for companies and users in times of pandemic. Benchmarking Int. J. 2021. [Google Scholar] [CrossRef]
- Soroor, J.; Tarokh, M.J. Innovative SCM: A wireless solution to smartly coordinate the supply processes via a web-based, real-time system. VINE 2006, 36, 304–340. [Google Scholar] [CrossRef]
- Sharif, A.M.; Irani, Z. Applying a fuzzy-morphological approach to complexity within management decision making. Manag. Decis. 2006, 44, 930–961. [Google Scholar] [CrossRef]
- Derrick, B.; Ruck, A.; Toher, D.; White, P. Tests for equality of variances between two samples which contain both paired observations and independent observations. J. Appl. Quant. Methods 2018, 13, 36–47. [Google Scholar]
- An, L. Modeling human decisions in coupled human and natural systems: Review of agent-based models. Ecol. Model. 2012, 229, 25–36. [Google Scholar] [CrossRef]
- Giabbanelli, P.J.; Gray, S.A.; Aminpour, P. Combining fuzzy cognitive maps with agent-based modeling: Frameworks and pitfalls of a powerful hybrid modeling approach to understand human-environment interactions. Environ. Model. Softw. 2017, 95, 320–325. [Google Scholar] [CrossRef]
- Nobanee, H.; Dilshad, M.N.; Al Dhanhani, M.; Al Neyadi, M.; Al Qubaisi, S.; Al Shamsi, S. Big Data Applications the Banking Sector: A Bibliometric Analysis Approach. SAGE Open 2021, 11. [Google Scholar] [CrossRef]
- Chauhan, S.; Akhtar, A.; Gupta, A. Customer experience in digital banking: A review and future research directions. Int. J. Qual. Serv. Sci. 2022. [Google Scholar] [CrossRef]
- Fedushko, S.; Ustyianovych, T.; Syerov, Y.; Peracek, T. User-engagement score and SLIs/SLOs/SLAs measurements correlation of e-business projects through big data analysis. Appl. Sci. 2020, 10, 9112. [Google Scholar] [CrossRef]
- Järvinen, J.M.; Karjaluoto, H. The use of Web analytics for digital marketing performance measurement. Ind. Mark. Manag. 2015, 50, 117–127. [Google Scholar] [CrossRef]
- Richter, I.; Avillanosa, A.; Cheung, V.; Goh, H.C.; Johari, S.; Kay, S.; Maharja, C.; Nguyễn, T.H.; Pahl, S.; Sugardjito, J.; et al. Looking through the COVID-19 window of opportunity: Future scenarios arising from the COVID-19 pandemic across five case study sites. Front. Psychol. 2021, 12, 635686. [Google Scholar] [CrossRef] [PubMed]
- Schmidt, K.; Sieverding, T.; Wallis, H.; Matthies, E. COVID-19—A window of opportunity for the transition toward sustainable mobility? Transp. Res. Interdiscip. Perspect. 2021, 10, 100374. [Google Scholar] [CrossRef]
- Wang, Y.; Kung, L.; Byrd, T.A. Big data analytics: Understanding its capabilities and potential benefits for healthcare organizations. Technol. Forecast. Soc. Chang. 2018, 126, 3–13. [Google Scholar] [CrossRef]
- Palacios-Marqués, D.; Gallego-Nicholls, J.F.; Guijarro-García, M. A recipe for success: Crowdsourcing, online social networks, and their impact on organizational performance. Technol. Forecast. Soc. Chang. 2021, 165, 120566. [Google Scholar] [CrossRef]
- Brabham, D.C. Crowdsourcing as a model for problem solving: An introduction and cases. Converg. Int. J. Res. New Media Technol. 2008, 14, 75–90. [Google Scholar] [CrossRef]
- Kowalska, M. Crowdsourcing As a Process of Creative Solutions Search. 2016. Available online: https://www.researchgate.net/publication/316068424_Crowdsourcing_jako_proces_poszukiwania_kreatywnych_rozwiazan_Crowdsourcing_as_a_process_of_creative_solutions_search (accessed on 20 August 2021).
- Sakas, D.P.; Giannakopoulos, N.T. Big data contribution in desktop and mobile devices comparison, regarding airlines’ digital brand name effect. Big Data Cogn. Comput. 2021, 5, 48. [Google Scholar] [CrossRef]
- Lenart-Gansiniec, R. Virtual knowledge sharing in crowdsourcing: Measurement dilemmas. J. Entrep. Manag. Innov. 2017, 13, 95–123. [Google Scholar] [CrossRef]
- Reklitis, P.; Trivellas, P.; Mantzaris, I.; Mantzari, E.; Reklitis, D. Employee Perceptions of Corporate Social Responsibility Activities and Work-Related Attitudes: The Case of a Greek Management Services Organization. In Sustainability and Social Responsibility: Regulation and Reporting; Gal, G., Akisik, O., Wooldridge, W., Eds.; Springer: Berlin/Heidelberg, Germany, 2018; pp. 225–240. ISBN 9789811045028. [Google Scholar] [CrossRef]
- Indriasari, E.; Gaol, F.L.; Matsuo, T. Digital Banking Transformation: Application of Artificial Intelligence and Big Data Analytics for Leveraging Customer Experience in the Indonesia Banking Sector. In Proceedings of the 2019 8th International Congress on Advanced Applied Informatics (IIAI-AAI), Toyama, Japan, 7–11 July 2019; pp. 863–868. [Google Scholar] [CrossRef]


| Web Analytics | Description of the Web Analytics |
|---|---|
| Global Rank | This figure is derived from the visibility of the website and the overall traffic. The lower the figure of global rank means higher in popularity [11,65]. |
| Organic Traffic | Organic traffic refers to visitors who arrive on a webpage as from unpaid search such as google search [4,66]. |
| Branded Traffic | The traffic generated from users who have typed the company’s brand name in their web searches is referred to as branded traffic [67]. |
| Non-Branded Traffic | The traffic that generated from users who have not typed the corporate brand name in their searches [67]. |
| Bounce Rate | Bounce rate is generated when a user visits a webpage and then leaves immediately without viewing any other webpage on the website. With lower bounce rates meaning that the website is more efficient [68,69]. |
| Average Time on Site | This web analytic measures the average estimated time in seconds a user stays on a website [68]. |
| Average Pages per Site | When a user enters a website, they access a lot of web pages, the metric Average Pages per Site counts how many web pages have been viewed per visitor [70]. |
| Mean | Min | Max | Std. Deviation | |
|---|---|---|---|---|
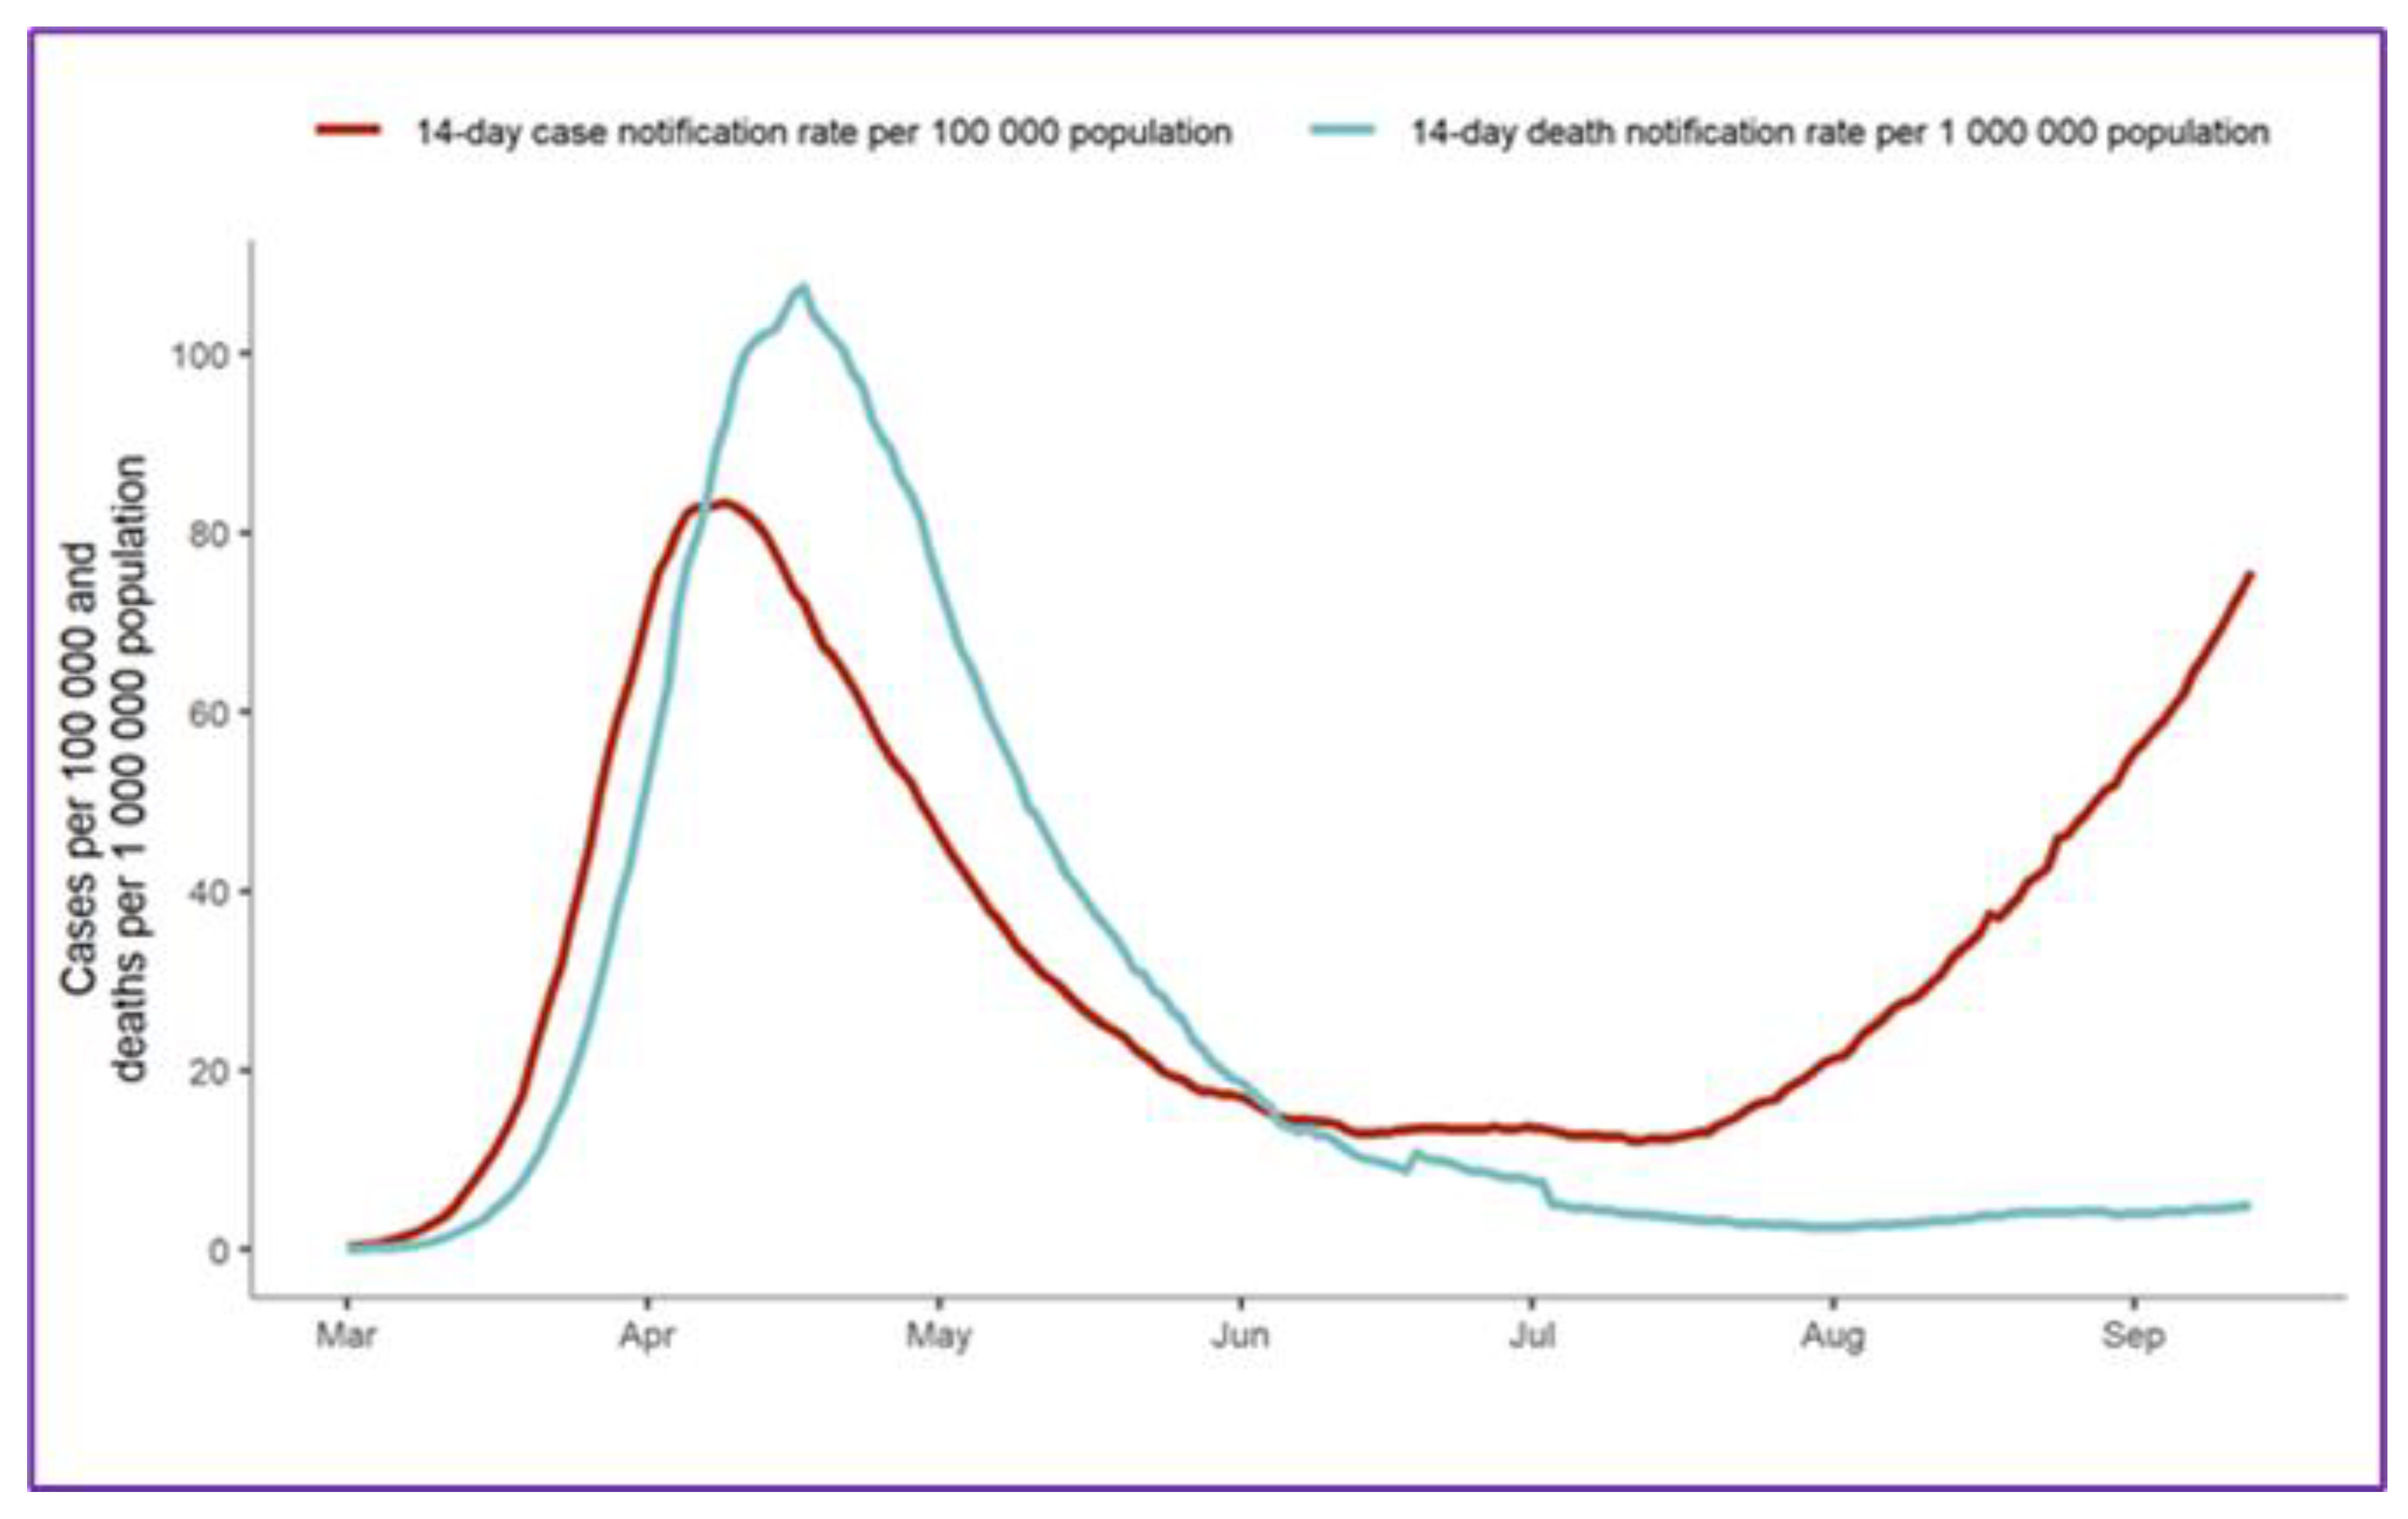
| Average Daily COVID-19 Cases | 249,368.25 | 0 | 630,774 | 230,319.450 |
| Global Rank | 161,912.93 | 133,568 | 190,861 | 20,999.987 |
| Organic Traffic | 53,517,713.60 | 48,526,821 | 62,016,293 | 4,785,161.121 |
| Bounce Rate | 0.44 | 0.35 | 1.18 | 0.2044 |
| Averages Pages/Visit | 822.79 | 724 | 887 | 45.835 |
| Average Time on Site | 52,463.53 | 45,167 | 58,196 | 3521.240 |
| Branded Traffic | 15,999,920.00 | 13,624,700 | 17,720,600 | 1,143,240.497 |
| Non-Branded Traffic | 811,486.67 | 591,400 | 1,926,500 | 376,880.225 |
| Variables | Average Daily COVID-19 Cases | Organic Traffic | Global Rank | Average Pages/Visit | Bounce Rate | Average Time on Site | Branded Traffic | Non-Branded Traffic |
|---|---|---|---|---|---|---|---|---|
| Average Daily COVID-19 Cases | 1 | 0.933 ** | −0.848 ** | 0.724 ** | −0.309 | 0.494 | 0.792 ** | −0.489 |
| Organic Traffic | 0.933 ** | 1 | −0.873 ** | 0.578 * | −0.339 | 0.339 | 0.841 ** | −0.454 |
| Global Rank | −0.848 ** | −0.873 ** | 1 | −0.643 ** | 0.427 | −0.492 | −0.783 ** | 0.540 * |
| Average Pages/Visit | 0.724 ** | 0.578 * | −0.643 ** | 1 | −0.010 | 0.892 ** | 0.648 ** | −0.646 ** |
| Bounce Rate | −0.309 | −0.339 | 0.427 | −0.010 | 1 | −0.047 | −0.222 | −0.009 |
| Average Time on Site | 0.494 | 0.339 | −0.492 | 0.892 ** | −0.047 | 1 | 0.498 | −0.579 * |
| Branded Traffic | 0.792 ** | 0.841 ** | −0.783 ** | 0.648 ** | −0.222 | 0.498 | 1 | −0.817 ** |
| Non-Branded Traffic | −0.489 | −0.454 | 0.540 * | −0.646 ** | −0.009 | −0.579 * | −0.817 ** | 1 |
| F | t-Test | p-Value | Hypotheses | p-Values | |
|---|---|---|---|---|---|
| Organic Traffic | 9.459 | −2.076 | 0.009 ** | Equal variances assumed | 0.058 |
| −4.226 | Equal variances not assumed | 0.001 ** |
| F | t-Test | p-Value | Hypotheses | p-Values | |
|---|---|---|---|---|---|
| Global Rank | 4.348 | 2.665 | 0.057 | Equal variances assumed | 0.019 * |
| 5.479 | Equal variances not assumed | 0.000 ** |
| Variables | Standardized Coefficient | t-Test | R2 | F | p-Value |
|---|---|---|---|---|---|
| Constant | - | 5.648 | 0.637 | 6.422 | 0.009 ** |
| Average Pages/Visit | −1.066 | −2.641 | 0.023 * | ||
| Bounce Rate | 0.439 | 2.405 | 0.035 * | ||
| Average Time on Site | 0.480 | 1.187 | 0.260 |
| Variables | Standardized Coefficient | t-Test | R2 | F | p-Value |
|---|---|---|---|---|---|
| Constant | - | 0.182 | 0.622 | 6.029 | 0.011 * |
| Average Pages/Visit | 1.409 | 3.421 | 0.006 ** | ||
| Bounce Rate | −0.368 | −1.977 | 0.074 | ||
| Average Time on Site | −0.936 | −2.269 | 0.044 * |
| Variables | Standardized Coefficient | t-Test | R2 | F | p-Value |
|---|---|---|---|---|---|
| Constant | - | −3.571 | 0.872 | 40.750 | 0.000 ** |
| Branded Traffic | 1.415 | 7.888 | 0.000 ** | ||
| Non-Branded Traffic | 0.702 | 3.913 | 0.002 ** |
Publisher’s Note: MDPI stays neutral with regard to jurisdictional claims in published maps and institutional affiliations. |
© 2022 by the authors. Licensee MDPI, Basel, Switzerland. This article is an open access article distributed under the terms and conditions of the Creative Commons Attribution (CC BY) license (https://creativecommons.org/licenses/by/4.0/).
Share and Cite
Sakas, D.P.; Kamperos, I.D.G.; Reklitis, D.P.; Giannakopoulos, N.T.; Nasiopoulos, D.K.; Terzi, M.C.; Kanellos, N. The Effectiveness of Centralized Payment Network Advertisements on Digital Branding during the COVID-19 Crisis. Sustainability 2022, 14, 3616. https://doi.org/10.3390/su14063616
Sakas DP, Kamperos IDG, Reklitis DP, Giannakopoulos NT, Nasiopoulos DK, Terzi MC, Kanellos N. The Effectiveness of Centralized Payment Network Advertisements on Digital Branding during the COVID-19 Crisis. Sustainability. 2022; 14(6):3616. https://doi.org/10.3390/su14063616
Chicago/Turabian StyleSakas, Damianos P., Ioannis Dimitrios G. Kamperos, Dimitrios P. Reklitis, Nikolaos T. Giannakopoulos, Dimitrios K. Nasiopoulos, Marina C. Terzi, and Nikos Kanellos. 2022. "The Effectiveness of Centralized Payment Network Advertisements on Digital Branding during the COVID-19 Crisis" Sustainability 14, no. 6: 3616. https://doi.org/10.3390/su14063616
APA StyleSakas, D. P., Kamperos, I. D. G., Reklitis, D. P., Giannakopoulos, N. T., Nasiopoulos, D. K., Terzi, M. C., & Kanellos, N. (2022). The Effectiveness of Centralized Payment Network Advertisements on Digital Branding during the COVID-19 Crisis. Sustainability, 14(6), 3616. https://doi.org/10.3390/su14063616