Article

Effects of Water-Retaining Agent Dosages on Slope-Protection Plants and Soil Nutrients on Rocky Slopes

1
College of Life Sciences, Sichuan University, Chengdu 610065, China
2
State Key Laboratory of Hydraulics and Mountain River Engineering, Sichuan University, Chengdu 610065, China
3
China Railway Chengdu Planning and Design Institute Co., Ltd., Chengdu 610065, China
4
Sichuan Provincial Highway Planning and Survey Design Institute Co., Ltd., Chengdu 610041, China
*
Author to whom correspondence should be addressed.
Sustainability 2022, 14(6), 3615; https://doi.org/10.3390/su14063615
Submission received: 7 February 2022 / Revised: 16 March 2022 / Accepted: 17 March 2022 / Published: 19 March 2022
(This article belongs to the Section Environmental Sustainability and Applications)

Abstract

:
Rocky slopes lack the necessary conditions for plant growth, i.e., soil and water, making vegetation recovery difficult and necessitating artificial soil conditions for vegetation establishment. Water-retaining agents are essential functional substances for constructing artificial soil on rocky slopes. In this study, the effect of water-retaining agents on the growth of artificial vegetation and soil nutrient loss was investigated by setting different application rates of water-retaining agents (10 g/m2, 20 g/m2, 30 g/m2, 40 g/m2, and 50 g/m2). Artificially simulated rocky slope conditions were achieved using the guest soil spraying technology after hanging the net, which provided support for the application of the water-retaining agent. Results showed that the contents of extractable nitrogen (EN), extractable phosphorus (EP), and extractable potassium (EK) in the soil, the number of plant individuals per unit area, plant height, and ground diameter of the water-retaining agent treatment were significantly higher than those of the control group (set up with no water retention as the control group, hereafter “CK”). By contrast, the nutrient content in the runoff fluid was significantly lower than that of CK. The application of the water-retaining agent significantly enhanced the soil’s ability to retain water and fertilizer, thus improving the growing environment and plant growth. Under the conditions of this experiment, the application rate of a 40 g/m2 water-retaining agent is reasonable from the perspectives of economic cost, soil nutrients, and plant growth.

1. Introduction

A water-retaining agent is a highly absorbent resin that has a solid ability to repeatedly absorb and release water [1,2]. They have been widely used in agriculture, forestry, soil and water conservation, and ecological restoration [3,4]. As China’s infrastructure construction advances, the construction of railways and roads in most areas will result in many exposed rocky slopes. These activities not only destroy vegetation and soil but also tend to cause soil erosion, leading to disasters such as slope failures and debris flows [5,6]. Therefore, revegetation of rocky slopes is essential. The main difficulties in the ecological restoration of rocky slopes include the hardness of the rock surface, their poor water-holding properties, and the lack of soil and water for plant growth [7]. Most rocky slopes are steep, and rainfall erosion can lead to strong runoff and high runoff rates, with the consequent removal of nutrients from the soil occurring [8]. Therefore, the critical point in achieving the ecological restoration of rocky slopes is to improve soil water and nutrient conditions [9]. The application of water retention agents in artificial vegetation restoration on rocky slopes can significantly increase the water content of the soil and reduce soil water loss and the loss of soil nutrients with runoff, thus achieving water and fertility retention [10,11,12]. At present, research on the application of water retention agents mainly focuses on crop yield, soil physical and chemical properties, and soil moisture content in arid and semi-arid areas [13,14,15]. Some scholars believe that the appropriate application of water retention agents can significantly increase soil water-holding capacity and improve soil structure and soil nutrient content, thereby increasing potato yields [16]. A study found that soil with water retention agents significantly improved water uptake and utilization by plants, with a more than a 2-fold increase in the germination rate for graminaceous plants and about a 3.5-fold increase in the germination rate for woody plants recorded, but no significant difference was observed in extending plant longevity [17]. Some researchers have proposed that water retention agents promote ryegrass survival and growth under drought conditions by directly or indirectly maintaining ryegrass survival, biomass, relative water content, leaf chlorophyll content, and cell membrane integrity [18]. Although the addition of water retention agents helps to improve the water retention of mulched soil, the amount should be carefully controlled, as excessive amounts can cause the soil to harden and be detrimental to plant growth [19].
At present, there are few studies on the effect of water-retaining agent application on plant growth during rocky slope revegetation and on soil nutrient content in the later stage of rocky slope revegetation. The objective of the work of this experiment was to carry out quantitative research on the use of water retention agents under slope conditions in order to explore the effect of different application rates on artificial vegetation and nutrient loss on rock slopes and to obtain the optimal application rate of water retention agents, providing scientific guidelines for the ecological restoration of rock slopes.

2. Materials and Methods
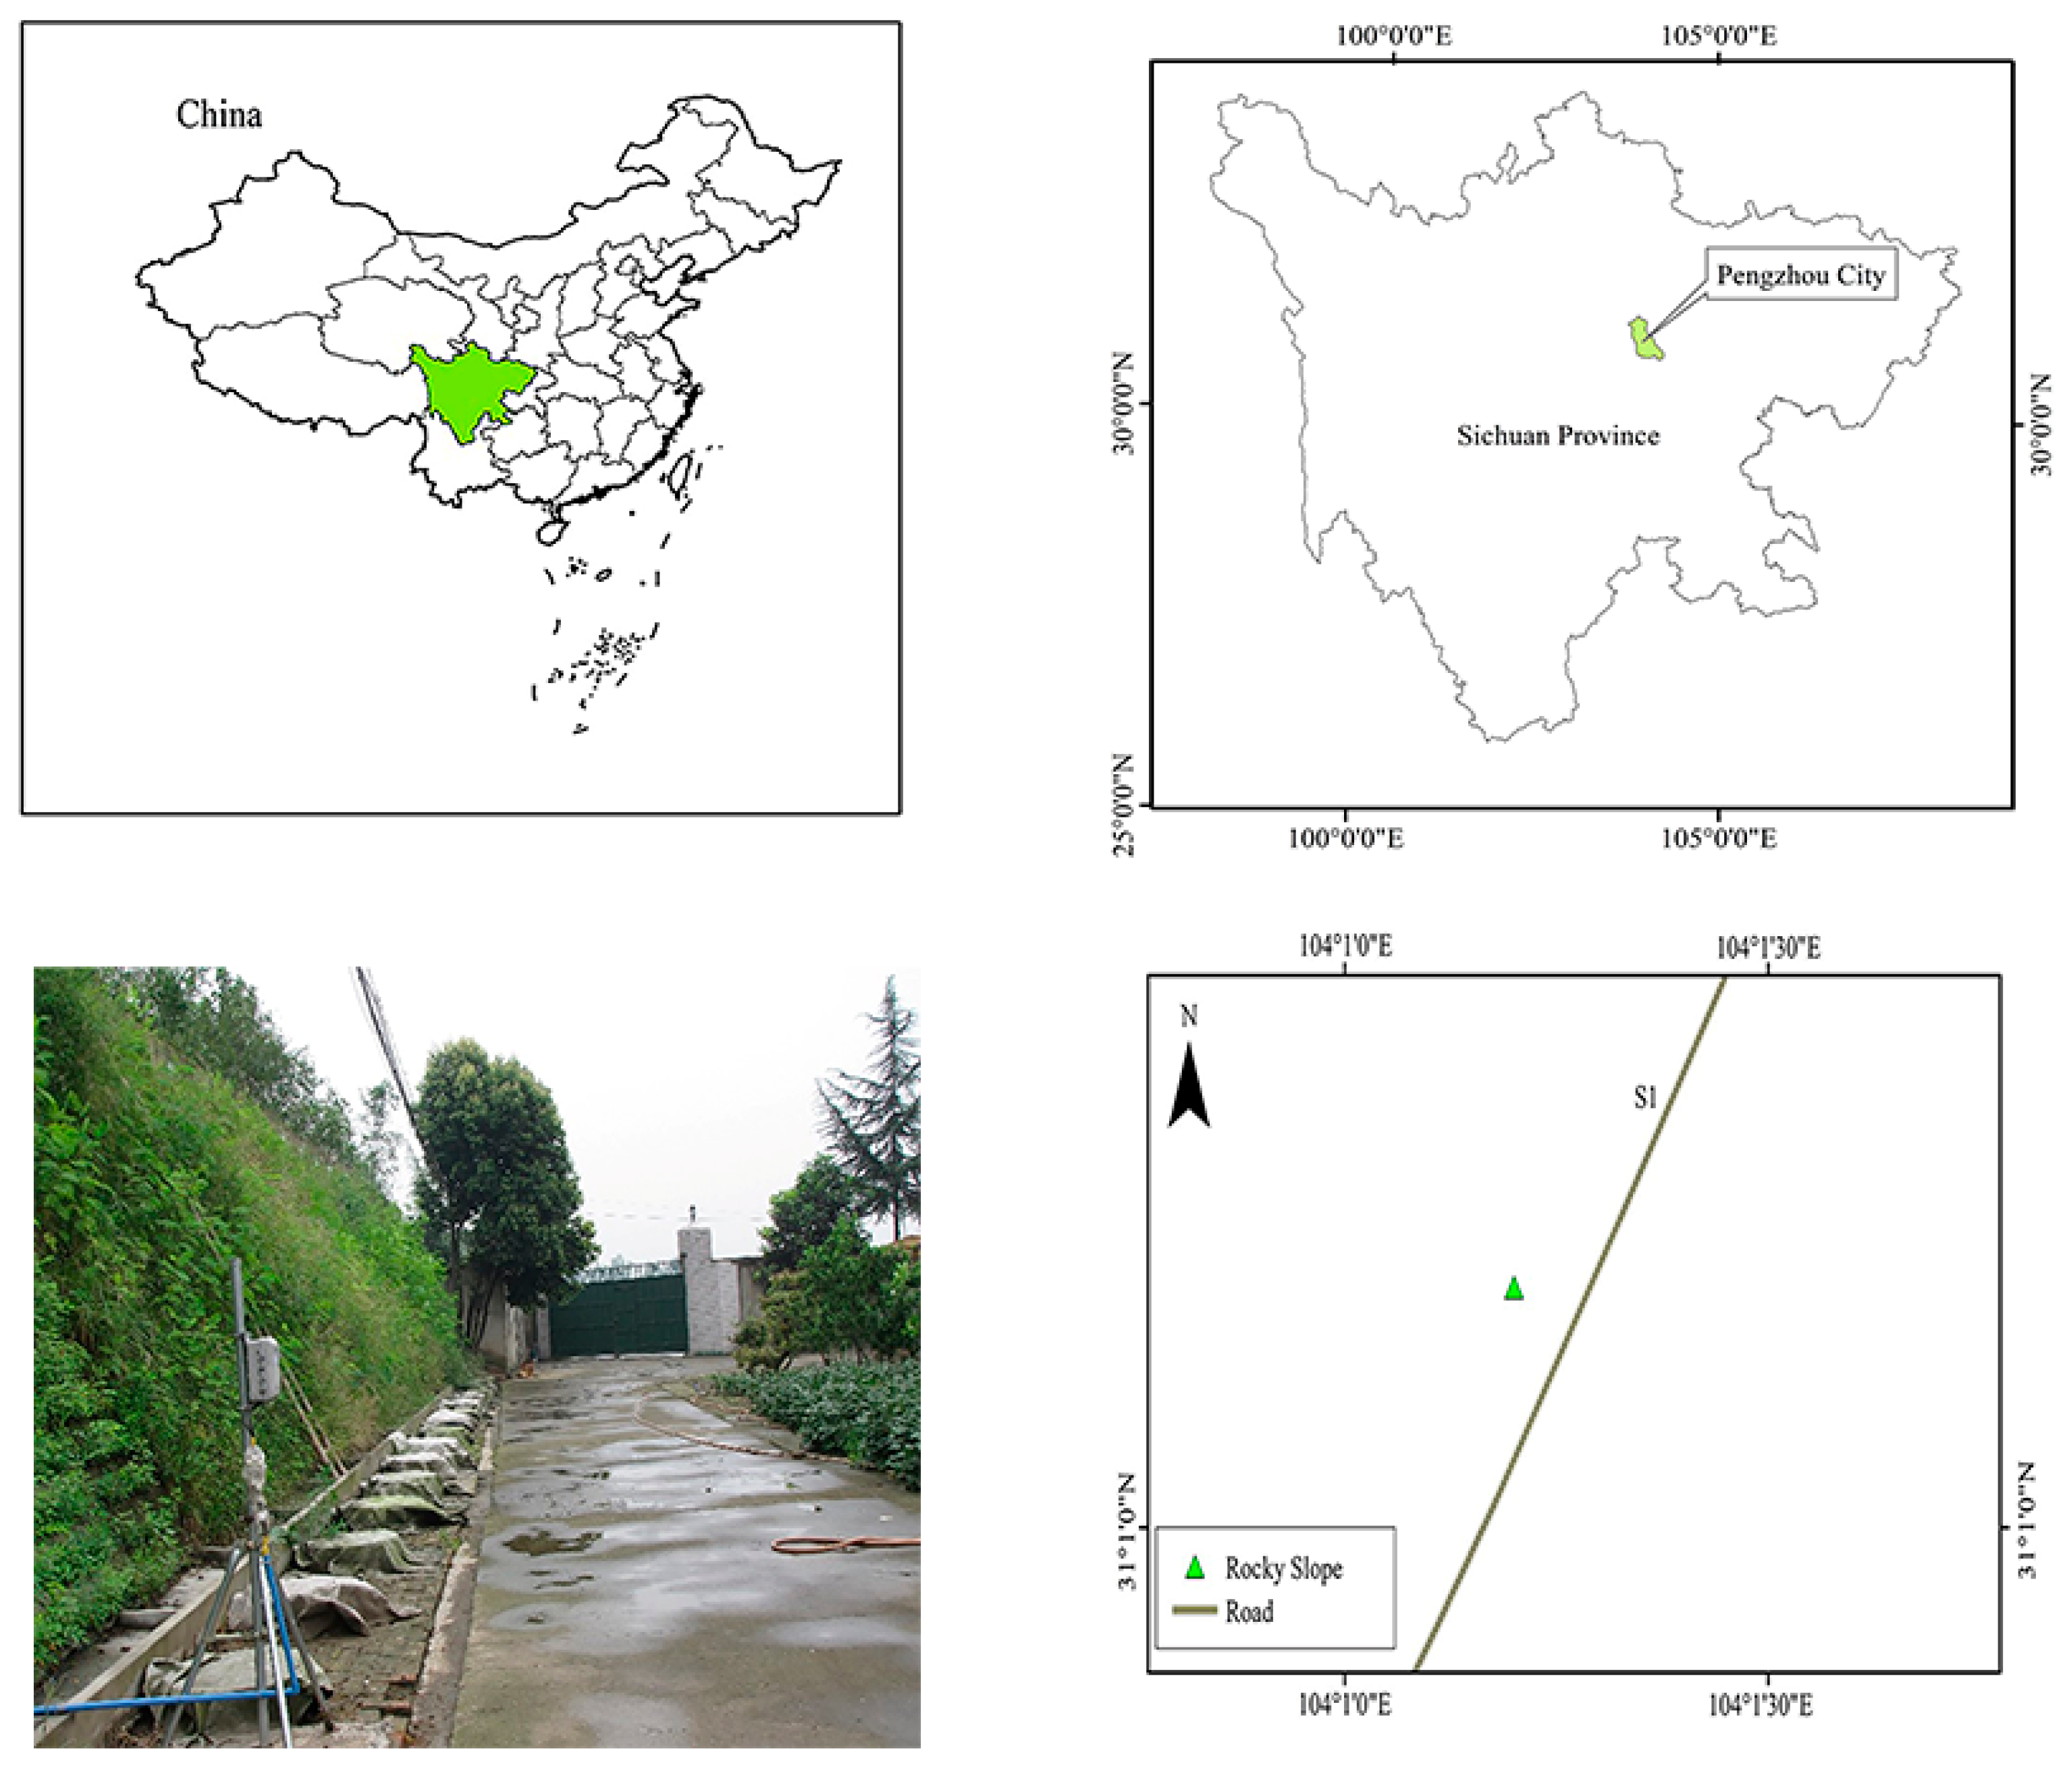
2.1. Study Sites

The experimental site was located in Shengping Town (31°02′ N, 104°02′ E, 568 m above sea level) in Pengzhou City, Sichuan Province, China. The town’s climate type belongs to the humid subtropical monsoon climate, with an annual average temperature of 16.3 °C, annual average rainfall of 1146.5 mm, average annual hours of sunshine of 1131 h, and annual average relative humidity of 79% recorded. The experimental slope had a southward direction, with a gradient of 53° and a slope height of 4 m recorded. The rocky surface was made of 100 cm × 50 cm × 10 cm slabs, and runoff collection devices were installed at the corners of the slope (Figure 1). Each plot was 1.5 m wide, with 18 sloping test plots employed. The plots were separated by 35 cm high PVC panels. Soil mixed with a water retention agent, grass seed, and a fertilizer compound were sprayed onto the artificial rocky slopes using a guest soil spraying technique.

2.2. Experimental Design

2.2.1. Soil Information

Rocky slopes are unsuitable for plant growth, and it is necessary to ensure that rocky slope revegetation is successful. Guest soil spraying technology, a widely applicable and efficient vegetation building technique, is widely used in China in the road and railway greening industries and in the biological protection of river banks. Artificial soil used in guest soil spraying can improve the soil conditions and nutrients on rocky slopes and enable rapid greening in harsh scenarios such as rocky slopes. Therefore, guest soil spraying, with a 15 cm soil mixture thickness, was used in this study for revegetation. Specifically, in May 2019, the seeds (15 g/m2) were mixed with peat (5 kg/m2), compound fertilizer (nitrogen, phosphorus and potassium content 15:15:15, 20 g/m2), and the water-retaining agent. The physicochemical properties of artificial soil used for covering the rocky slope are given in Table 1. Observations and measurements of various traits were carried out in May 2020 (1 year after sowing) and May 2021 (2 years after sowing). Other plants were removed weekly to allow for accurate observations of the growth of the model species, i.e., Amorpha fruticose (A. fruticosa).

2.2.2. Experimental Shrub Species

This study used A. fruticosa, a typical slope protection plant species widely used in southwest China, as the model species. A. fruticosa has high drought, moisture, and salinity tolerance. It has a substantial slope-fixing capacity, as it grows fast with a relatively well-developed root system after seedling emergence [20].

2.2.3. Water Retention Agent Treatment

The water-retaining agent used in this experiment was starch-grafted potassium acrylate, which is entirely degradable in soil. It is a super absorbent polymer with a particle diameter of 50 mesh and a water absorption multiplier (0.9% brine) of 50 times. In order to explore the effects of water-retaining agents on soil nutrients and plant growth, five water retention treatments (10 g/m2, 20 g/m2, 30 g/m2, 40 g/m2, and 50 g/m2) were set up, with no water retention used as the control group (hereafter “CK”). Each water retention treatment had three replicates, adding up to 18 slope plots.

2.3. Measurements and Methods

2.3.1. Plant Growth Parameters

In early May of 2020 and 2021, the number of plants was counted in each trial plot to calculate the number per unit area. The number of A. fruticose plants was counted by the direct counting method. Preservation rate of the number of plants per unit area was calculated using the following equation:
Number   of   plants   per   unit   area   in   Year   1 number   of   plants   per   unit   area   in   Year   2 Number   of   plants   per   unit   area   in   Year   1
At the same time, ten individual A. fruticose plants were randomly selected from each replicated plot, and their plant heights were measured with a steel tape measure (accuracy 0.1 cm). The ground diameter was measured with an electronic vernier caliper (accuracy 0.01 mm).

2.3.2. Nutrient Content in the Soil

Nutrient content in the soil was measured in early May of 2020 and 2021. The alkaline solution diffusion method determined soil extractable nitrogen (EN) [21]. The extractable phosphorus (EP) [22] was measured using the NaHCO3 leaching with molybdenum-antimony anticolorimetric method. The extractable potassium (EK) was extracted with acetic acid and measured by flame photometry [23].

2.3.3. Nutrient Content in Runoff Fluid

After measuring the volume of runoff liquid in the collection cylinders, the liquid in the collection cylinders was stirred well, and three leachate samples were collected from each collection cylinder. One liter of each sample was used for the determination of nitrogen, phosphorus and potassium contents. Specifically, samples were placed in polyethylene bottles and marked and stored in a refrigerator at 0 °C, and the analysis of total nitrogen, total phosphorus, and total potassium nutrients was conducted within one week. The total nitrogen of the water sample was determined by UV spectrophotometry using alkaline potassium persulfate nitrate, the total phosphorus by molybdenum antimony anti-colorimetric method using potassium persulfate, and the total potassium by direct filtration-flame photometer method.

2.4. Statistical Analysis

All data were processed and plotted using Microsoft Excel 2019; all variables were described using means and standard deviations. One-way analysis of variance (ANOVA) was performed on the data using SPSS 22.0 software. Comparisons among treatments were based on Duncan’s multiple range test at the 0.05 probability level.

3. Results

3.1. Effects of Water Retention Agent on Nutrients in the Soil

The nutrient content in the soil was significantly affected by the water-retaining agent treatment (Table 2). Compared with CK, the contents of EN, EP, and EK were increased significantly after the use of the water-retaining agent (Table 2), indicating that the water-retaining agent significantly maintained soil EN contents. Soil EP and EK contents between the water retention dosages of 30 g/m2, 40 g/m2, and 50 g/m2 were not significantly different (p > 0.05), but were significantly higher than those of other treatments and CK (p < 0.05). Similarly, soil EN contents between the water retention dosages of 40 g/m2 and 50 g/m2 did not differ significantly (p > 0.05), but were significantly higher than those of other treatments and CK (p < 0.05).
The loss of soil nutrients in each group in the first year (i.e., the original value of soil nutrients minus one year after sowing) and in the second year (i.e., one year after sowing minus two years after sowing) are shown in Figure 2, Figure 3 and Figure 4. The loss of soil EN in Year 1 was 10.54, 6.30, 4.83, 3.54, 3.30, and 3.33 times higher than the loss in Year 2 for each group, and the difference between the water-retaining agent dosages of 40 g/m2 and 50 g/m2 was not significant (p > 0.05) (Figure 2).
The loss of EP in Year 1 was 3.95, 2.68, 1.79, 1.34, 1.30, and 1.27 times greater than the loss in Year 2 for each treatment group, respectively, and the differences between the water-retaining agent dosages of 30 g/m2, 40 g/m2 and 50 g/m2 were not significant (p > 0.05) (Figure 3).
The loss of EK in Year 1 was 2.58, 1.83, 1.44, 1.13, 1.16, and 1.16 times higher than the loss in Year 2 for each treatment group, respectively, while the differences between water retention dosages of 30 g/m2, 40 g/m2 and 50 g/m2 were not significant (p > 0.05) (Figure 4).

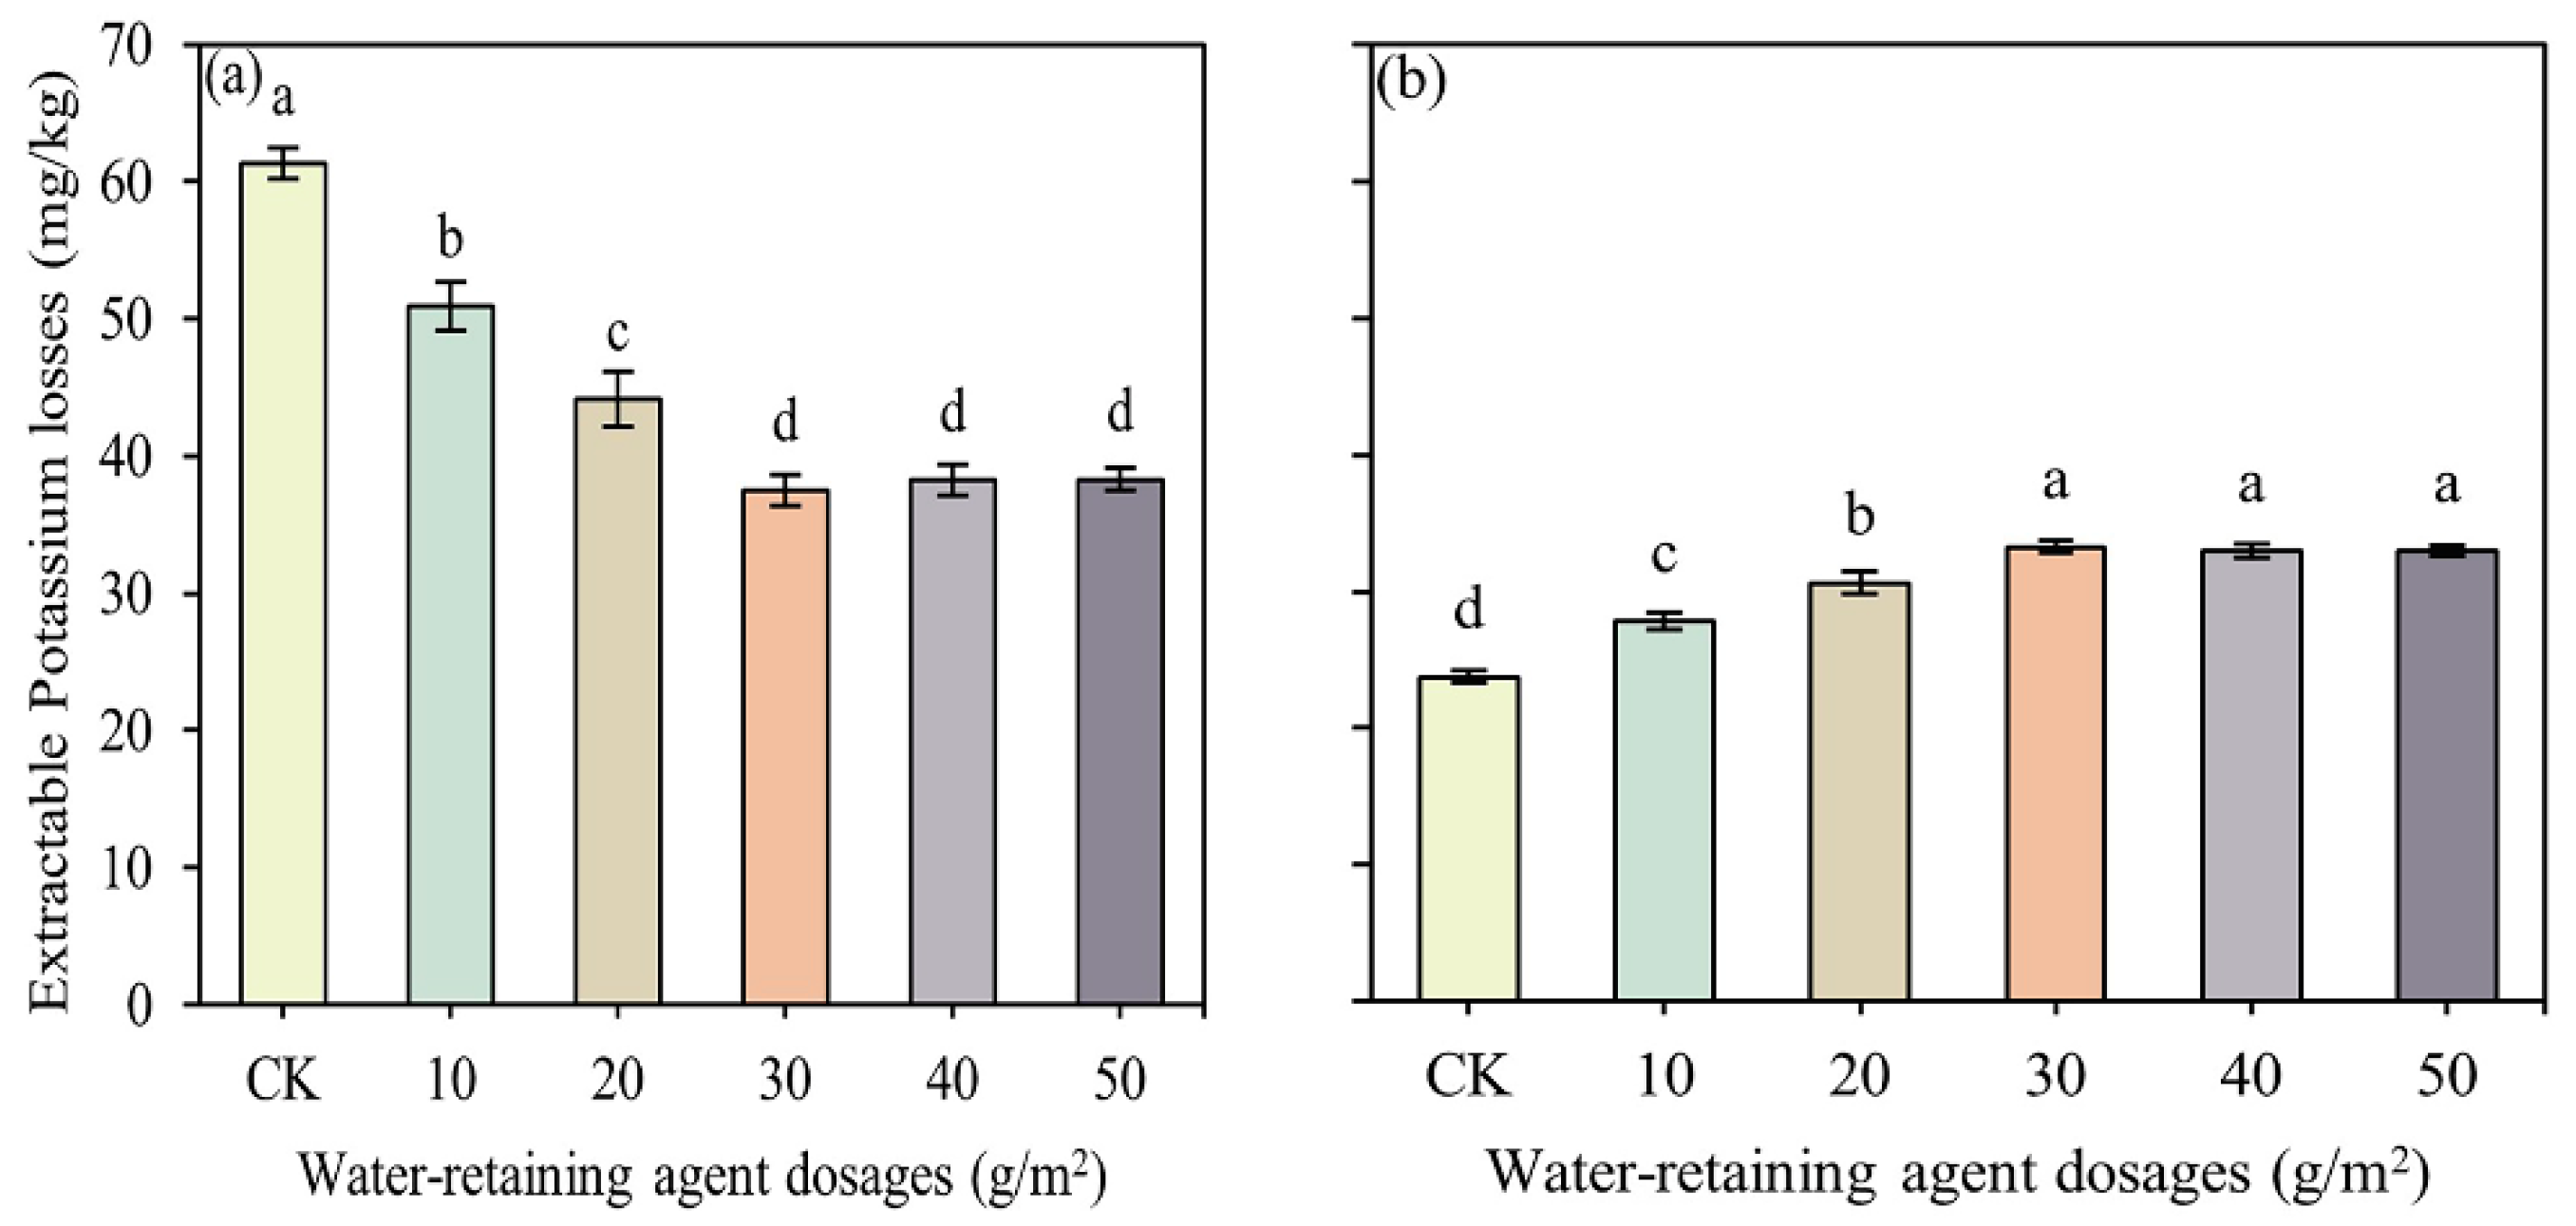
3.2. Effects of Water Retention Agent on Nutrients in the Runoff Fluid

In two separate measurements conducted in 2020 and 2021, compared with CK, total nitrogen, potassium, and phosphorus in the runoff solution were significantly lower after the use of the water-retaining agent (Table 3), indicating that the water-retaining agent significantly reduced the nutrient content of the runoff solution. Total potassium and total phosphorus in the runoff solution between the water-retaining agent dosages of 40 g/m2 and 50 g/m2 were not significant (p > 0.05), but were significantly higher than those of other treatments and CK. Total nitrogen in the runoff solution was significantly higher than that of other treatments and CK at 50 g/m2 of the water-retaining agent in the first year after sowing. Total nitrogen values in the runoff solution were not significantly different (p > 0.05) between 40 g/m2 and 50 g/m2 of the water-retaining agent in the second year after sowing, and these were significantly higher than the total nitrogen values of other treatments and CK.
Figure 5, Figure 6 and Figure 7 show the nutrient loss from Year 1 to Year 2 due to runoff for each group, i.e., the value in Year 1 minus the value in Year 2. As shown in Figure 5, the total nitrogen loss from Year 1 to Year 2 between differing dosages was significantly different, with CK having the highest loss of total nitrogen (p < 0.05).
As shown in Figure 6, the amount of total potassium loss from Year 1 to Year 2 due to runoff in CK was also the highest at the water retention agent dosage of 50 g/m2. The difference between the water-retaining agent dosages of 40 g/m2 and 50 g/m2 was not significant (p > 0.05).
Figure 7 shows the amount of total phosphorus loss from Year 1 to Year 2 due to runoff. Again, CK had higher total phosphorus loss than any other dosage treatments. The difference between the water retaining agent dosages of 30 g/m2 and 40 g/m2 was not significant (p > 0.05).

3.3. Water Retention Agent on Plant Growth

Table 4 shows that in May 2020 and May 2021, compared with CK, the number of plants per unit area, plant height, and ground diameter increased significantly after the water-retaining agent was used, indicating that the water-retaining agent significantly promoted the growth of A. fruticosa. In May 2020, the number of plants per unit area and the plant height were not significantly different between 30 g/m2, 40 g/m2, and 50 g/m2 (p > 0.05), but were significantly higher than those of other treatments and CK. The same pattern was also found for the ground diameter of plants grown on slop plots with 40 g/m2 and 50 g/m2 of the water-retaining agent (p > 0.05). In May 2021, the number of plants per unit area, and the plant height and ground diameter of A. fruticosa reached the maximum in the treatment of 50 g/m2 super absorbent polymer, which was significantly higher than those recorded for the other treatments and CK.
Figure 8 shows the difference between Year 1 and Year 2 in terms of the number of plants per unit area for each group. The number of plants per unit area in Year 2 was reduced by 37.50%, 32.43%, 28.57%, 25.53%, 15.22%, and 8.89%, respectively, compared to Year 1. The difference between CK and the water retention agent dosages of 10 g/m2, 20 g/m2, and 30 g/m2 was the largest difference between the four groups, although this was not significant (p > 0.05), and the difference for the water retention agent dosage of 50 g/m2 was the smallest. This suggests that the preservation rate of A. fruticosa was significantly higher at 50 g/m2 of water retention than for other treatments and CK.
Figure 9 shows the difference in plant height between Year 1 and Year 2 for each group. Specifically, no significant differences between CK and the water retention dosages of 10 g/m2, 20 g/m2, and 30 g/m2 were observed; however, plants in the above four treatments were significantly shorter than those treated with the water retention dosages of 40 g/m2 and 50 g/m2. The largest plant height was observed for the water retention dosage of 50 g/m2, followed by the water retention dosage of 40 g/m2. This indicates that the mean plant height growth rate was significantly higher at 50 g/m2 and 40 g/m2 than in other treatments and CK.
Figure 10 shows the difference between Year 1 and Year 2 in terms of the ground diameter. The plant diameter of the 50 g/m2 group was the largest, while no significant difference was found between the other treatment groups (i.e., CK and 10 g/m2, 20 g/m2, 30 g/m2, and 40 g/m2), indicating that the plants grew faster in the 50 g/m2 of water-retaining agent treatment than in other treatments and CK.

4. Discussion

Previous studies have shown that water retention agents can fix and slowly release soil nutrient ions already dissolved in water in different ways, such as wrapping and complexing [24]. The structural properties of the molecules of the water retention agent themselves can also adsorb nutrients [25]. The results of this study showed that compared to CK (no water retention agent application), soil hydrolytic nitrogen, effective phosphorus, and fast-acting potassium contents increased significantly with increases in water retention agent dosage, indicating that the application of water retention agents can significantly enhance soil nutrient content under slope conditions. Some studies have shown that for different crops, the optimal application amounts of water retention agents are also different [26]. The application amounts of water retention agents do not simply follow the “the more, the better” pattern; after a certain amount, their effects have been found to increase to a limited extent. The results of this experiment showed that increases in the EP and EK contents of the slope soil after the application of the water retention agent dosage of 30 g/m2 were no longer obvious, while the threshold was 40 g/m2 for EN content. Research has demonstrated that the application of water retention agents significantly improves soil ability and water conservation in two main ways. Firstly, water-retaining agents, when applied to the soil, can absorb water and gradually swell to form a protective film of soil, thus reducing the splash of rainwater on the soil surface and protecting the surface soil [27,28]. Secondly, the moderate application of water retention agents has a binding effect on the soil, which is manifested by the adsorption of micro-agglomerates around the water retention agent, thus forming large agglomerates. This can achieve the purpose of reducing soil loss with runoff and therefore significantly reduce soil nutrient loss due to soil erosion [29]. Some studies have shown that water retention agents improved soil fertility in mining areas, significantly increasing effective nitrogen, effective phosphorus, effective potassium, and soil organic matter [30]. Our experimental study showed that the total amount of nitrogen, phosphorus, and potassium in the runoff solution decreased significantly compared to CK with increases in the water retention agent dosage, both in Year 1 and Year 2.
Some scholars have shown that when a water retention agent is applied to the soil around a plant’s roots, the water retention agent will rapidly absorb water from the soil, thus reducing deep infiltration losses. Then, the water is gradually released to the plants. This process improves the efficiency of soil water use and thus ensures the development of the above-ground part of the plants and their root systems [31,32,33]. The results of this experiment suggested that the number of plants per unit area, and the plant height and ground diameter of A. fruticosa showed an increasing trend with increases in water retention agent dosage, both in Year 1 and Year 2. This is because the application of water retention agents can reduce the soil bulk density and increase soil permeability [34], thus improving the growth environment of plant roots while extending the duration of fertilizer supply more so than with CK. As a result, the leaching and loss of soil nutrients were significantly reduced, providing sufficient nutrient resources for plant growth in rocky slope habitats [35,36]. Moreover, the application of water retention agents can enhance the water holding capacity of the soil, and better moisture conditions also make the plant survival rate higher and more robust [37]. During the experiment, we also analyzed the soil water content. Compared with the control group (CK), the average monthly soil water content increased by 21.98%, 41.21%, 59.34%, 78.57%, and 91.21%, respectively. The difference between the groups was significant (p < 0.05) and showed an increasing trend with the increases in water retention agent dosage, which can be explained from the perspective of water condition maintenance. The increasing amount of water retained by the water retention agents with each group was significant (p < 0 05), which could have enhanced plant growth. Some scholars have shown that the primary forms of vegetation cover that prevent soil erosion and nutrient loss are the crown interception of rainfall [38], root systems that improve soil erosion resistance, and plant roots that improve soil rainwater infiltration. The higher the vegetation cover, the more the runoff is impeded. Therefore, the slope runoff rate tends to slow down as the vegetation increases. The results of this experiment showed that in the first year of water retention application, soil nutrient loss in all groups was higher than that in the second year. The reason for this was that in the first year, A. fruticosa did not fully develop, and the vegetation cover was not high in the pre-growth period, resulting in faster soil nutrient loss from the rocky slopes. In the second year, A. fruticosa reached its full growth, so the soil nutrient loss in this year was lower than that in the first year. The results of this study also showed that the difference in soil nutrient content and the gradient of total nutrient difference in the runoff solution were different between Year 1 and Year 2, which may have been due to decreases in the performance of the water retention agent over time. Previous studies have shown that with increases in the number of water absorption and release cycles, the water retention agent water absorption capacity shows a decreasing trend [39,40,41]. In this study, such a trend resulted in a decrease in the ability of the water retention agent to adsorb nutrient molecules or ions from soil nutrients, thus leading to the significant difference in various indicators between Year 1 and Year 2, e.g., the decreases in the number of plants per unit area, plant height growth rate and ground diameter growth rate compared to Year 1. The soil nutrient content affected the recovery of vegetation [42]. In line with the results of previous studies, CK had the lowest vegetation cover and the worst recovery of vegetation.
Ecological restoration projects on rocky slopes should also focus on the effect of vegetation restoration; they also need to pay attention to the economic costs [43]. The price of the water-retaining agent used in this experiment was 0.03 CNY/g. In other words, the cost of the water-retaining agent dosage of 40 g/m2 was 0.3 CNY more per square than that of the 30 g/m2 dosage. However, the final results of this experiment show that the water-retaining agent dosage of 40 g/m2 performed significantly better than the 30 g/m2 dosage in terms of EN content, plant number per unit area, plant height, and ground diameter. The total nitrogen, potassium, and phosphorus contents in the runoff solution for the dosage of 40 g/m2 were significantly lower than those for the water-retaining agent at 30 g/m2. The overall comparison showed that the water-retaining agent at 40 g/m2 was more effective than that at 30 g/m2. Compared with the water-retaining agent dosage of 50 g/m2, the water retention agent dosage of 40 g/m2 was 0.3 CNY cheaper per square, and the economic cost of the 50 g/m2 dosage was higher than that of the 40 g/m2 dosage. Although there were differences in the number of plants per unit area, plant height, and ground diameter, there were no significant differences between the soil EN, EP, and EP contents and the total nitrogen, potassium and phosphorus contents in the runoff solution. Due to the combination of economic costs and combined effects, a water-retaining agent dosage of 40 g/m2 may be more suitable for practical applications.

5. Conclusions

(1)
The use of a water-retaining agent can enhance the EN, EP, and EK contents of rocky slope soils to various degrees, and reduce the EN, EK, and EP contents in runoff fluids, thus achieving the purpose of reducing soil loss from rocky slopes and contributing to the function of soil nutrients under rocky slope conditions. However, its function did not increase indefinitely with increases in the water-retaining agent dosage.
(2)
The water-retaining agent at 40 g/m2 and 50 g/m2 increased the number of plants that survived in Year 2, increased the plant height and ground diameter, and improved the survival rate and growth of artificial vegetation on rocky slopes. These dosages also improved the coverage of artificial vegetation and the growth of the individual plants under rocky slope conditions. However, their functions did not increase indefinitely with increases in the water-retaining agent dosage.
(3)
Considering the economic and cost factors, together with performance factors (i.e., soil nutrient and runoff losses, plant preservation rate, and growth conditions), the water-retaining agent dosage of 40 g/m2 is reasonable under the present test conditions, since it performed relatively well in our study under rocky slope conditions.

Author Contributions

Conceptualization, H.S.; methodology, H.S., D.X., S.L., H.Z., and K.X.; software, D.X.; formal analysis, H.Z., K.X., D.S., C.L.; writing—original draft preparation, D.X.; writing—review and editing, H.S. All authors have read and agreed to the published version of the manuscript.

Funding

This research was funded by Sichuan Youth Science and Technology Innovation Research Team Project (2019JDTD0007).

Institutional Review Board Statement

Not applicable.

Informed Consent Statement

Not applicable.

Data Availability Statement

All data for the case studies is with the authors.

Acknowledgments

The authors would like to thank the editor and the reviewers for their useful feedback that improved this paper. This work is supported by the Sichuan Youth Science and Technology Innovation Research Team Project (2019JDTD0007).

Conflicts of Interest

The authors declare no conflict of interest.

References

  1. Zheng, T.; Liang, Y.; Ye, S.; He, Z. Superabsorbent hydrogels as carriers for the controlled-release of urea: Experiments and a mathematical model describing the release rate. Biosyst. Eng. 2009, 102, 44–50. [Google Scholar] [CrossRef]
  2. Huettermann, A.; Orikiriza, L.J.B.; Agaba, H. Application of Superabsorbent Polymers for Improving the Ecological Chemistry of Degraded or Polluted Lands. Clean-Soil Air Water 2009, 37, 517–526. [Google Scholar] [CrossRef]
  3. Thombare, N.; Mishra, S.; Siddiqui, M.; Jha, U.; Singh, D.; Mahajan, G.R. Design and development of guar gum based novel, superabsorbent and moisture retaining hydrogels for agricultural applications. Carbohydr. Polym. 2018, 185, 169–178. [Google Scholar] [CrossRef] [PubMed]
  4. Sojka, R.; Entry, J.A.; Fuhrmann, J.J. The influence of high application rates of polyacrylamide on microbial metabolic potential in an agricultural soil. Appl. Soil Ecol. 2006, 32, 243–252. [Google Scholar] [CrossRef]
  5. Chen, Z.; Yang, L.; Jiang, Z.; Li, C.; Hu, X.; Pang, L.; Li, S.; Sun, H. Runoff-driven nitrogen and phosphorus dynamics of substrate material for rocky slope eco-engineering. Ecol. Eng. 2013, 51, 123–132. [Google Scholar] [CrossRef]
  6. Yang, Y.; Yang, J.; Zhao, T.; Huang, X.; Zhao, P. Ecological restoration of highway slope by covering with straw-mat and seeding with grass-legume mixture. Ecol. Eng. 2016, 90, 68–76. [Google Scholar] [CrossRef]
  7. Cai, X.Y.; Xu, W.N.; Xia, Z.Y.; Zhou, Z.J. The Sensitivity Analysis of Stability Factors of Rocky Slope with Ecological Restoration. Adv. Mater. Res. 2012, 361–363, 2003–2007. [Google Scholar] [CrossRef]
  8. Wang, Z.-Q.; Wu, L.-H.; Liu, T.-T. Revegetation of steep rocky slopes: Planting climbing vegetation species in artificially drilled holes. Ecol. Eng. 2009, 35, 1079–1084. [Google Scholar] [CrossRef]
  9. Gao, G.J.; Yuan, J.G.; Han, R.H.; Xin, G.R.; Yang, Z.Y. Characteristics of the optimum combination of synthetic soils by plant and soil properties used for rock slope restoration. Ecol. Eng. 2007, 30, 303–311. [Google Scholar] [CrossRef]
  10. Fabian, K.; Dimitri, M.; Jackline, K.; Jesse, O.; Teresia, M.; Sarah, O.; Martyn, W.; Colin, P. A low-cost integrated desalination and irrigation technique tested on dual-purpose sorghum in Turkana County, Kenya. J. Dryland Agric. 2021, 7, 96–113. [Google Scholar] [CrossRef]
  11. Sadeghi, S.H.; Hazbavi, Z.; Younesi, H.; Bahramifar, N. Trade-off between runoff and sediments from treated erosion plots and polyacrylamide and acrylamide residues. Catena 2016, 142, 213–220. [Google Scholar] [CrossRef]
  12. Jahan, M.; Nassiri Mahallati, M. Can Superabsorbent Polymers Improve Plants Production in Arid Regions? Adv. Polym. Technol. 2020, 2020, 7124394. [Google Scholar] [CrossRef]
  13. Egrinya Eneji, A.; Islam, R.; An, P.; Amalu, U.C. Nitrate retention and physiological adjustment of maize to soil amendment with superabsorbent polymers. J. Clean. Prod. 2013, 52, 474–480. [Google Scholar] [CrossRef]
  14. Verma, A.K.; Sindhu, S.S.; Singh, A.; Kumar, A.; Singh, A.; Chauhan, V.B.S. Conditioning effects of biodegradable superabsorbent polymer and vermi-products on media properties and growth of gerbera. Ecol. Eng. 2019, 132, 23–30. [Google Scholar] [CrossRef]
  15. Namvar, H.; Asgharzade, A.; Babaeian, M.; Hosseinzade, E. The effects of superabsorbent polymer on yield and yield component of two grape varieties. Int. J. Biosci. 2014, 4, 18–23. [Google Scholar]
  16. Hou, X.; Li, R.; He, W.; Dai, X.; Ma, K.; Liang, Y. Superabsorbent polymers influence soil physical properties and increase potato tuber yield in a dry-farming region. J. Soils Sediments 2017, 18, 816–826. [Google Scholar] [CrossRef]
  17. Yang, L.; Yang, Y.; Chen, Z.; Guo, C.; Li, S. Influence of super absorbent polymer on soil water retention, seed germination and plant survivals for rocky slopes eco-engineering. Ecol. Eng. 2014, 62, 27–32. [Google Scholar] [CrossRef]
  18. Su, A.Y.; Niu, S.Q.; Liu, Y.Z.; He, A.L.; Zhao, Q.; Pare, P.W.; Li, M.F.; Han, Q.Q.; Ali Khan, S.; Zhang, J.L. Synergistic Effects of Bacillus amyloliquefaciens (GB03) and Water Retaining Agent on Drought Tolerance of Perennial Ryegrass. Int. J. Mol. Sci. 2017, 18, 2651. [Google Scholar] [CrossRef] [Green Version]
  19. Pramthawee, P.; Jongpradist, P.; Sukkarak, R. Integration of creep into a modified hardening soil model for time-dependent analysis of a high rockfill dam. Comput. Geotech. 2017, 91, 104–116. [Google Scholar] [CrossRef]
  20. Liu, Q.; Su, L.-j.; Xiao, H.; Xu, W.-n.; Xia, Z.-y. Selection and Configuration of Plants in High-and Steep-Cutting Rock Slope Greening in a Subtropical Region: Case Study of the First-Phase Urban Expressway of Xiazhou Avenue in Yichang. J. Highw. Transp. Res. Dev. 2019, 13, 102–110. [Google Scholar] [CrossRef]
  21. Qi, Y.; Chen, T.; Pu, J.; Yang, F.; Shukla, M.K.; Chang, Q. Response of soil physical, chemical and microbial biomass properties to land use changes in fixed desertified land. Catena 2018, 160, 339–344. [Google Scholar] [CrossRef]
  22. Bray, R.H.; Kurtz, L.T. Determination of Total, Organic, and Available Forms of Phosphorus in Soils. Soil Sci. 1945, 59, 39–45. [Google Scholar] [CrossRef]
  23. Kundu, R.; Mondal, M.; Garai, S.; Poddar, R.; Banerjee, S. Efficacy of herbicides against broad-spectrum weed floras and their effect on non-target soil micro-organisms and productivity in sugarcane (Saccharum sp.). Curr. J. Appl. Sci. Technol. 2020, 39, 23–32. [Google Scholar]
  24. Xi, J.; Zhang, P. Application of Super Absorbent Polymer in the Research of Water-retaining and Slow-release Fertilizer. IOP Conf. Ser. Earth Environ. Sci. 2021, 651, 042066. [Google Scholar] [CrossRef]
  25. Yang, M.; Wu, J.; Graham, G.M.; Lin, J.; Huang, M. Hotspots, Frontiers, and Emerging Trends of Superabsorbent Polymer Research: A Comprehensive Review. Front. Chem. 2021, 9, 688127. [Google Scholar] [CrossRef] [PubMed]
  26. Bakass, M.; Mokhlisse, A.; Lallemant, M. Absorption and desorption of liquid water by a superabsorbent polymer: Effect of polymer in the drying of the soil and the quality of certain plants. J. Appl. Polym. Sci. 2002, 83, 234–243. [Google Scholar] [CrossRef]
  27. Elshafie, H.S.; Camele, I. Applications of Absorbent Polymers for Sustainable Plant Protection and Crop Yield. Sustainability 2021, 13, 3253. [Google Scholar] [CrossRef]
  28. Li, L.; Zhang, H.; Zhou, X.; Chen, M.; Lu, L.; Cheng, X. Effects of super absorbent polymer on scouring resistance and water retention performance of soil for growing plants in ecological concrete. Ecol. Eng. 2019, 138, 237–247. [Google Scholar] [CrossRef]
  29. Zhou, C.; Huang, W.; Qiu, S.; Liu, Z. A quantitative study on the amount of water-retaining agent based on adhesive-modified red bed weathered soil. Bull. Eng. Geol. Environ. 2021, 80, 3139–3150. [Google Scholar] [CrossRef]
  30. Zhang, J.F.; Zhao, T.N.; Sun, B.P.; Song, S.S.; Guo, H.B.; Shen, H.J.; Wu, Y. Effects of biofertilizers and super absorbent polymers on plant growth and soil fertility in the arid mining area of Inner Mongolia, China. J. Mt. Sci. 2018, 15, 1920–1935. [Google Scholar] [CrossRef]
  31. Liao, R.; Ren, S.; Yang, P. Multi-Chemical Regulation Technology Applied to Dryland Maize (Zea mays L.) Production in Northern China. Trans. Asabe 2015, 58, 1535–1546. [Google Scholar]
  32. Rezashateri, M.; Khajeddin, S.J.; Abedi-Koupai, J.; Majidi, M.M.; Matinkhah, S.H. Growth characteristics of Artemisia sieberi influenced by super absorbent polymers in texturally different soils under water stress condition. Arch. Agron. Soil Sci. 2017, 63, 984–997. [Google Scholar] [CrossRef]
  33. Yu, J.; Shi, J.G.; Dang, P.F.; Mamedov, A.I.; Shainberg, I.; Levy, G.J. Soil and Polymer Properties Affecting Water Retention by Superabsorbent Polymers under Drying Conditions. Soil Sci. Soc. Am. J. 2012, 76, 1758–1767. [Google Scholar] [CrossRef]
  34. Saha, A.; Sekharan, S.; Manna, U. Superabsorbent hydrogel (SAH) as a soil amendment for drought management: A review. Soil Tillage Res. 2020, 204, 104736. [Google Scholar] [CrossRef]
  35. Bhardwaj, A.K.; Shainberg, I.; Goldstein, D.; Warrington, D.N.; Levy, G.J. Water Retention and Hydraulic Conductivity of Cross-Linked Polyacrylamides in Sandy Soils. Soil Sci. Soc. Am. J. 2007, 71, 406–412. [Google Scholar] [CrossRef]
  36. Qiao, D.; Liu, H.; Yu, L.; Bao, X.; Simon, G.P.; Petinakis, E.; Chen, L. Preparation and characterization of slow-release fertilizer encapsulated by starch-based superabsorbent polymer. Carbohydr. Polym. 2016, 147, 146–154. [Google Scholar] [CrossRef] [PubMed]
  37. Wei, Y.; Durian, D.J. Effect of hydrogel particle additives on water-accessible pore structure of sandy soils: A custom pressure plate apparatus and capillary bundle model. Phys. Rev. E 2013, 87, 053013. [Google Scholar] [CrossRef] [PubMed] [Green Version]
  38. Zuazo, V.c.H.D.; Pleguezuelo, C.R.o.R. Soil-Erosion and Runoff Prevention by Plant Covers: A Review. Agron. Sustain. Dev. 2008, 28, 65–86. [Google Scholar]
  39. Banedjschafie, S.; Durner, W. Water retention properties of a sandy soil with superabsorbent polymers as affected by aging and water quality. J. Plant Nutr. Soil Sci. 2015, 178, 798–806. [Google Scholar] [CrossRef]
  40. Ai, F.; Yin, X.; Hu, R.; Ma, H.; Liu, W. Research into the super-absorbent polymers on agricultural water. Agric. Water Manag. 2021, 245, 106513. [Google Scholar] [CrossRef]
  41. Igwe, P.U.; Ezeukwu, J.C.; Edoka, N.E.; Ejie, O.C.; Lfi, G.I. A Review of Vegetation Cover as a Natural Factor to Soil Erosion. Int. J. Rural. Dev. Environ. Health Res. 2017, 1, 21–28. [Google Scholar] [CrossRef]
  42. Nunes, A.N.; de Almeida, A.C.; Coelho, C.O.A. Impacts of land use and cover type on runoff and soil erosion in a marginal area of Portugal. Appl. Geogr. 2011, 31, 687–699. [Google Scholar] [CrossRef]
  43. Li, S.-C.; Sun, H.-L.; Yang, Z.-R.; He, L.; Cui, B.-S. Effect of straw fiber, polyacrylamide and super absorbent polymer ecological engineering on rock slope protection. Yanshilixue Yu Gongcheng Xuebao/Chin. J. Rock Mech. Eng. 2006, 25, 257–267. [Google Scholar]
Figure 1. Location information of the study sites.
Sustainability 14 03615 g001
Figure 2. The effect of dynamic changes of soil nutrient loss under different dosages of water-retaining agents. (a) Data for EN (the loss of EN in each group in the first year); (b) data for EN (the loss of EN in each group in the second year). Values with different letters indicate significant differences between treatments at p < 0.05. Vertical bars indicate standard errors of means.
Sustainability 14 03615 g002
Figure 3. The effect of dynamic changes of soil nutrient loss under different dosages of water-retaining agents. (a) Data for EP (the loss of EP in each group in the first year); (b) data for EP (the loss of EP in each group in the second year) Values with different letters indicate significant differences between treatments at p < 0.05. Vertical bars indicate standard errors of means.
Sustainability 14 03615 g003
Figure 4. The effect of dynamic changes of soil nutrient loss under different dosages of water-retaining agents. (a) Data for EK (the loss of EK in each group in the first year); (b) data for EK (the loss of EK in each group in the second year). Values with different letters indicate significant differences between treatments at p < 0.05. Vertical bars indicate standard errors of means.
Sustainability 14 03615 g004
Figure 5. Dynamics of total nutrients in runoff fluid under different dosages of water-retaining agents. Data for the amount of total nitrogen loss (the amount of total nitrogen loss from Year 1 to Year 2 of each group, due to runoff). Values with different letters indicate significant differences between treatments at p < 0.05. Vertical bars indicate standard errors of means.
Sustainability 14 03615 g005
Figure 6. Dynamics of total nutrients in runoff fluid under different dosages of water-retaining agents. Data for the amount of total potassium loss (the amount of total potassium lost from Year 1 to Year 2 of each group due to runoff). Values with different letters indicate significant differences between treatments at p < 0.05. Vertical bars indicate standard errors of means.
Sustainability 14 03615 g006
Figure 7. Dynamics of total nutrients in runoff fluid under different dosages of water-retaining agents. Data for the amount of total phosphorus loss from Year 1 to Year 2 of each group due to runoff). Values with different letters indicate significant differences between treatments at p < 0.05. Vertical bars indicate standard errors of means.
Sustainability 14 03615 g007
Figure 8. Variation in plant growth with different dosages of the water-retaining agent. Data for the number of plant reductions per unit area. Values with different letters indicate significant differences between treatments at p < 0.05. Vertical bars indicate standard errors of means.
Sustainability 14 03615 g008
Figure 9. Variation in plant growth with different dosages of the water-retaining agent. Data for plant height growth. Values with different letters indicate significant differences between treatments at p < 0.05. Vertical bars indicate standard errors of means.
Sustainability 14 03615 g009
Figure 10. Variation in plant growth with different dosages of the water-retaining agent. Data for plant ground diameter growth. Values with different letters indicate significant differences between treatments at p < 0.05. Vertical bars indicate standard errors of means.
Sustainability 14 03615 g010
Table 1. Physicochemical properties of artificial soil used for covering the rocky slope.
Organic Matter
(g/kg)
Extractable P
(mg/kg)
Extractable K
(mg/kg)
Extractable N
(mg/kg)
Bulk Density
(g/cm3)
24.1671.22120.66153.281.33
Table 2. Effect of water-retaining agent dosages on soil nutrient content.
Dosage of Water-Retaining Agent (g/m2)Extractable N
(mg/kg)
Extractable P
(mg/kg)
Extractable K
(mg/kg)
May 2020May 2021May 2020May 2021May 2020May 2021
029.39 ± 1.26 e17.64 ± 0.77 e27.62 ± 1.03 d16.59 ± 0.64 d59.38 ± 1.11 d35.63 ± 0.67 d
1043.53 ± 1.55 d26.12 ± 0.93 d34.39 ± 0.73 c20.63 ± 0.44 c69.72 ± 1.78 c41.88 ± 1.16 c
2052.29 ± 0.85 c31.38 ± 0.51 c41.53 ± 1.12 b24.93 ± 0.68 b76.54 ± 2.03 b45.93 ± 1.21 b
3063.44 ± 1.11 b38.06 ± 0.66 b46.33 ± 0.44 a27.80 ± 0.28 a83.12 ± 1.14 a49.87 ± 0.68 a
4066.07 ± 1.29 a39.64 ± 0.78 a46.87 ± 0.59 a28.13 ± 0.37 a82.44 ± 1.15 a49.47 ± 0.70 a
5065.69 ± 0.99 a39.41 ± 0.59 a47.22 ± 0.95 a28.34 ± 0.56 a82.40 ± 0.83 a49.44 ± 0.50 a
Values with different letters indicate significant differences between treatments at p < 0.05.
Table 3. Effect of water-retaining agent dosage on nutrient content in runoff fluid.
Dosage of Water-Retaining Agent (g/m2)Total N in Runoff Fluid (g)Total K in Runoff Fluid (g)Total P in Runoff Fluid (g)
May 2020May 2021May 2020May 2021May 2020May 2021
047.06 ± 1.30 a18.82 ± 0.52 a32.39 ± 1.58 a12.96 ± 0.63 a18.78 ± 1.00 a7.51 ± 0.40 a
1036.18 ± 2.31 b14.47 ± 0.93 b22.53 ± 0.60 b9.01 ± 0.24 b14.35 ± 0.43 b5.74 ± 0.17 b
2026.70 ± 0.67 c10.68 ± 0.27 c18.69 ± 0.69 c7.48 ± 0.28 c12.42 ± 0.58 c4.97 ± 0.23 c
3020.55 ± 0.67 d8.16 ± 0.18 d16.86 ± 0.58 d6.74 ± 0.23 d10.80 ± 0.72 d4.32 ± 0.29 d
4016.33 ± 0.79 e7.43 ± 0.13 de14.93 ± 0.64 e5.94 ± 0.21 e9.54 ± 0.38 e3.46 ± 0.16 e
5012.79 ± 1.04 f7.29 ± 0.17 e13.90 ± 0.27 e5.76 ± 0.13 e8.45 ± 0.32 e3.38 ± 0.12 e
Values with different letters indicate significant differences between treatments at p < 0.05.
Table 4. The effect of water-retaining agent dosage on plant growth.
Dosage of Water-Retaining Agent (g/m2)Number of Plant Individuals Per Unit AreaPlant Height (cm)Plant Ground Diameter (cm)
May 2020May 2021May 2020May 2021May 2020May 2021
032 ± 1.00 d20 ± 1.00 f96 ± 1.00 d106 ± 1.00 f1.3 ± 0.06 d2.1 ± 0.06 f
1037 ± 1.00 c25 ± 1.00 e104 ± 1.00 c113 ± 2.00 e1.7 ± 0.06 c2.5 ± 0.06 e
2042 ± 1.00 b30 ± 1.00 d113 ± 1.00 b121 ± 0.58 d1.8 ± 0.06 c2.6 ± 0.06 d
3047 ± 0.58 a35 ± 1.00 c118 ± 1.00 a127 ± 0.58 c2.0 ± 0.10 b2.8 ± 0.06 c
4046 ± 1.00 a39 ± 1.00 b118 ± 1.00 a133 ± 1.00 b2.2 ± 0.06 a3.2 ± 0.06 b
5045 ± 1.53 a41 ± 0.58 a119 ± 2.08 a139 ± 2.08 a2.2 ± 0.10 a3.5 ± 0.06 a
Values with different letters indicate significant differences between treatments at p < 0.05.
Publisher’s Note: MDPI stays neutral with regard to jurisdictional claims in published maps and institutional affiliations.

