
Impact of Near-Fault Ground Motions on Longitudinal Seismic Response of CHRF Bridges


Abstract
:1. Introduction
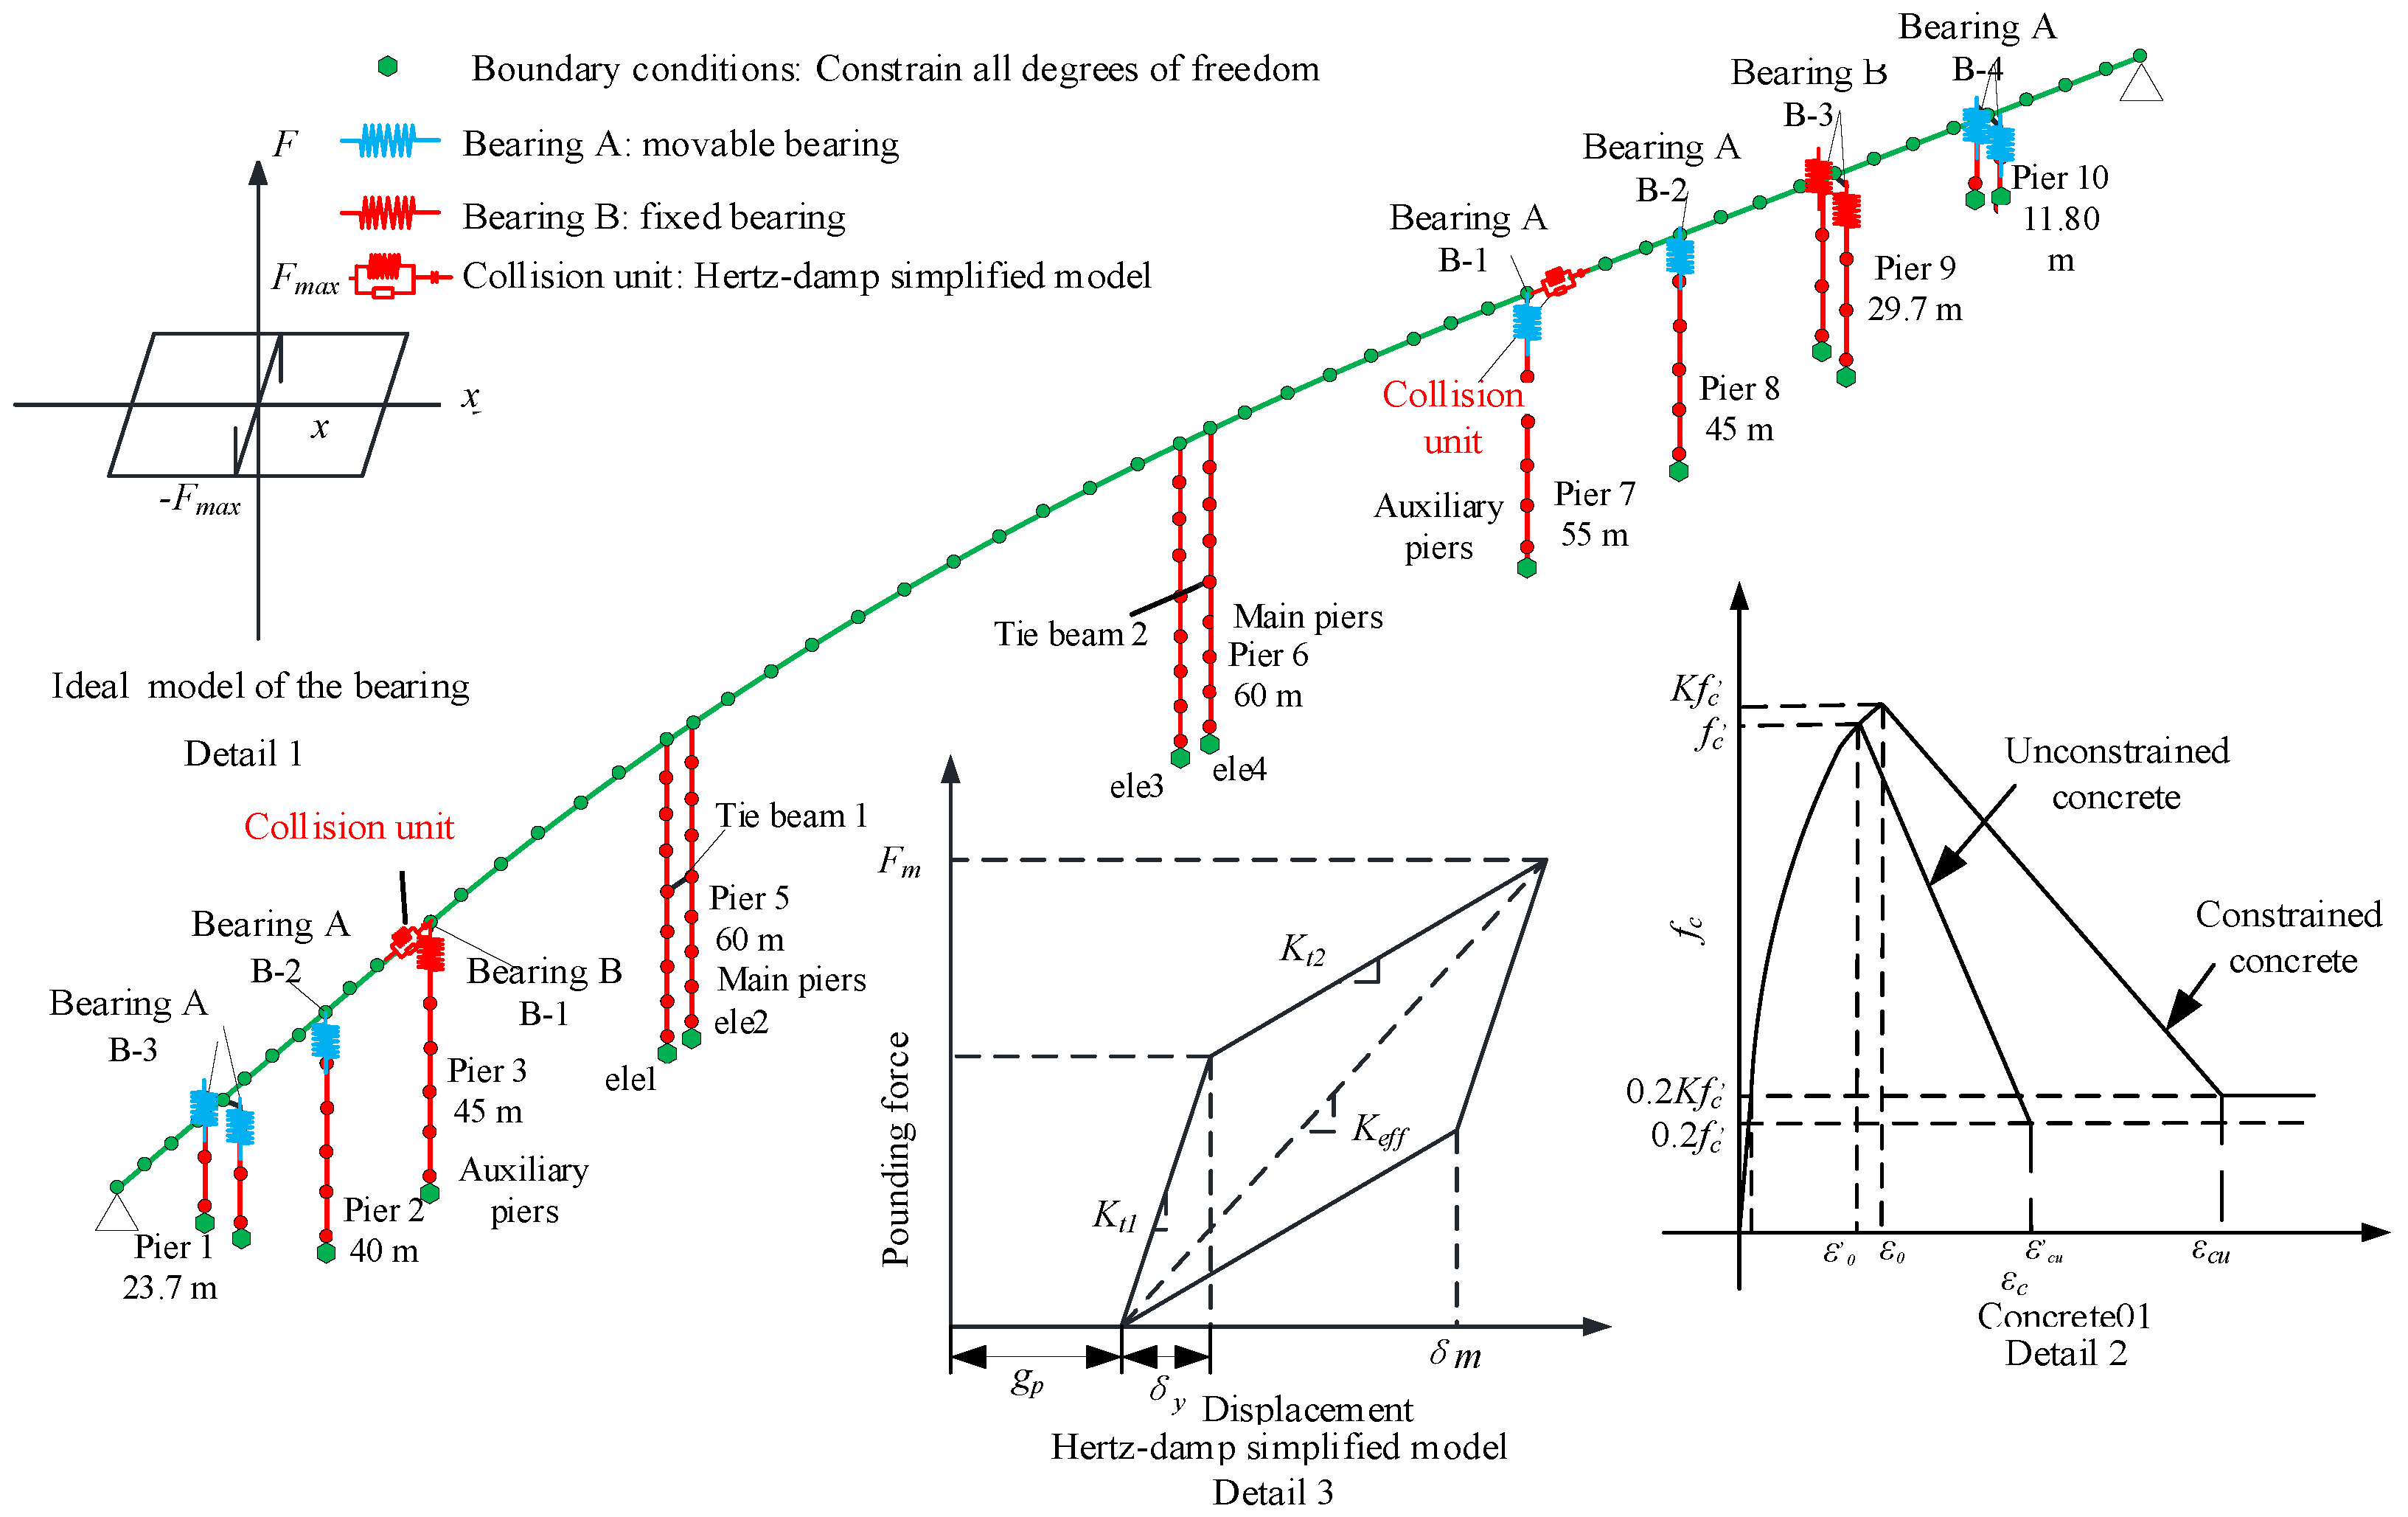
2. Prototype Bridge
3. Numerical Model
3.1. Main Parameters
3.2. Bearing Parameters
3.3. Pounding Parameters
3.4. Basic Dynamic Characteristics of the Numerical Model
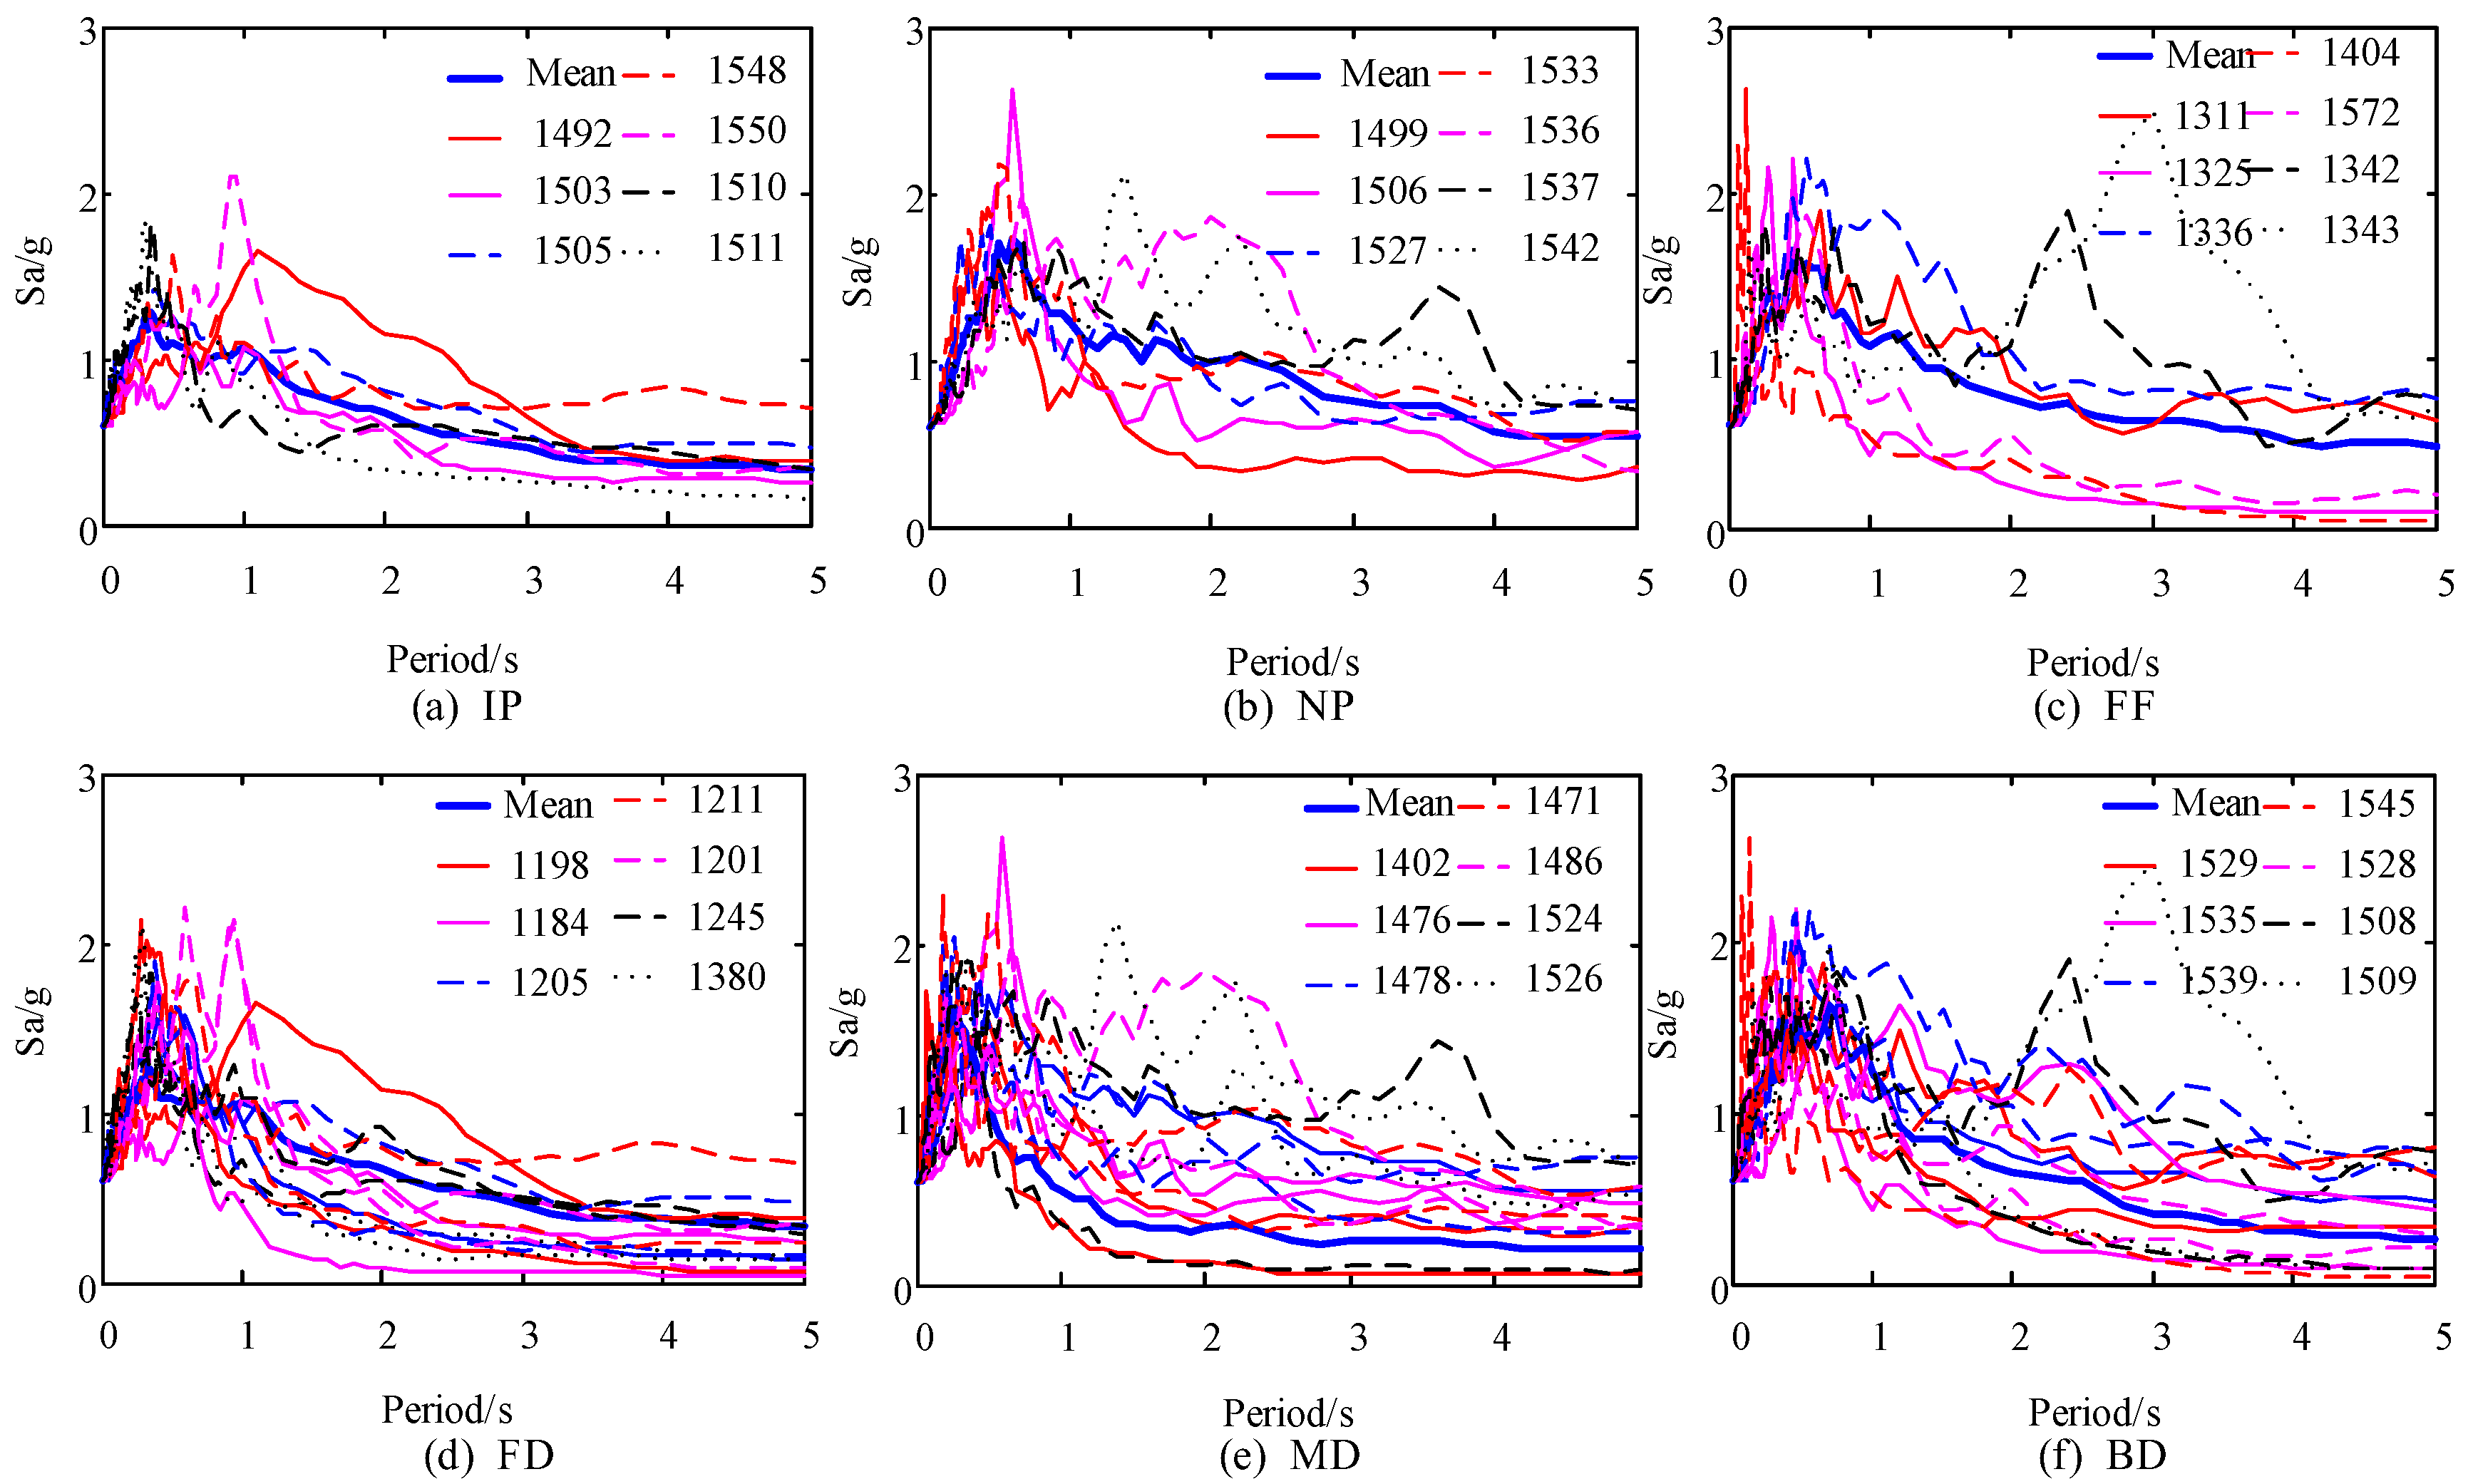
3.5. Analysis Cases
4. Dynamic Response of the Original CHRF Bridge
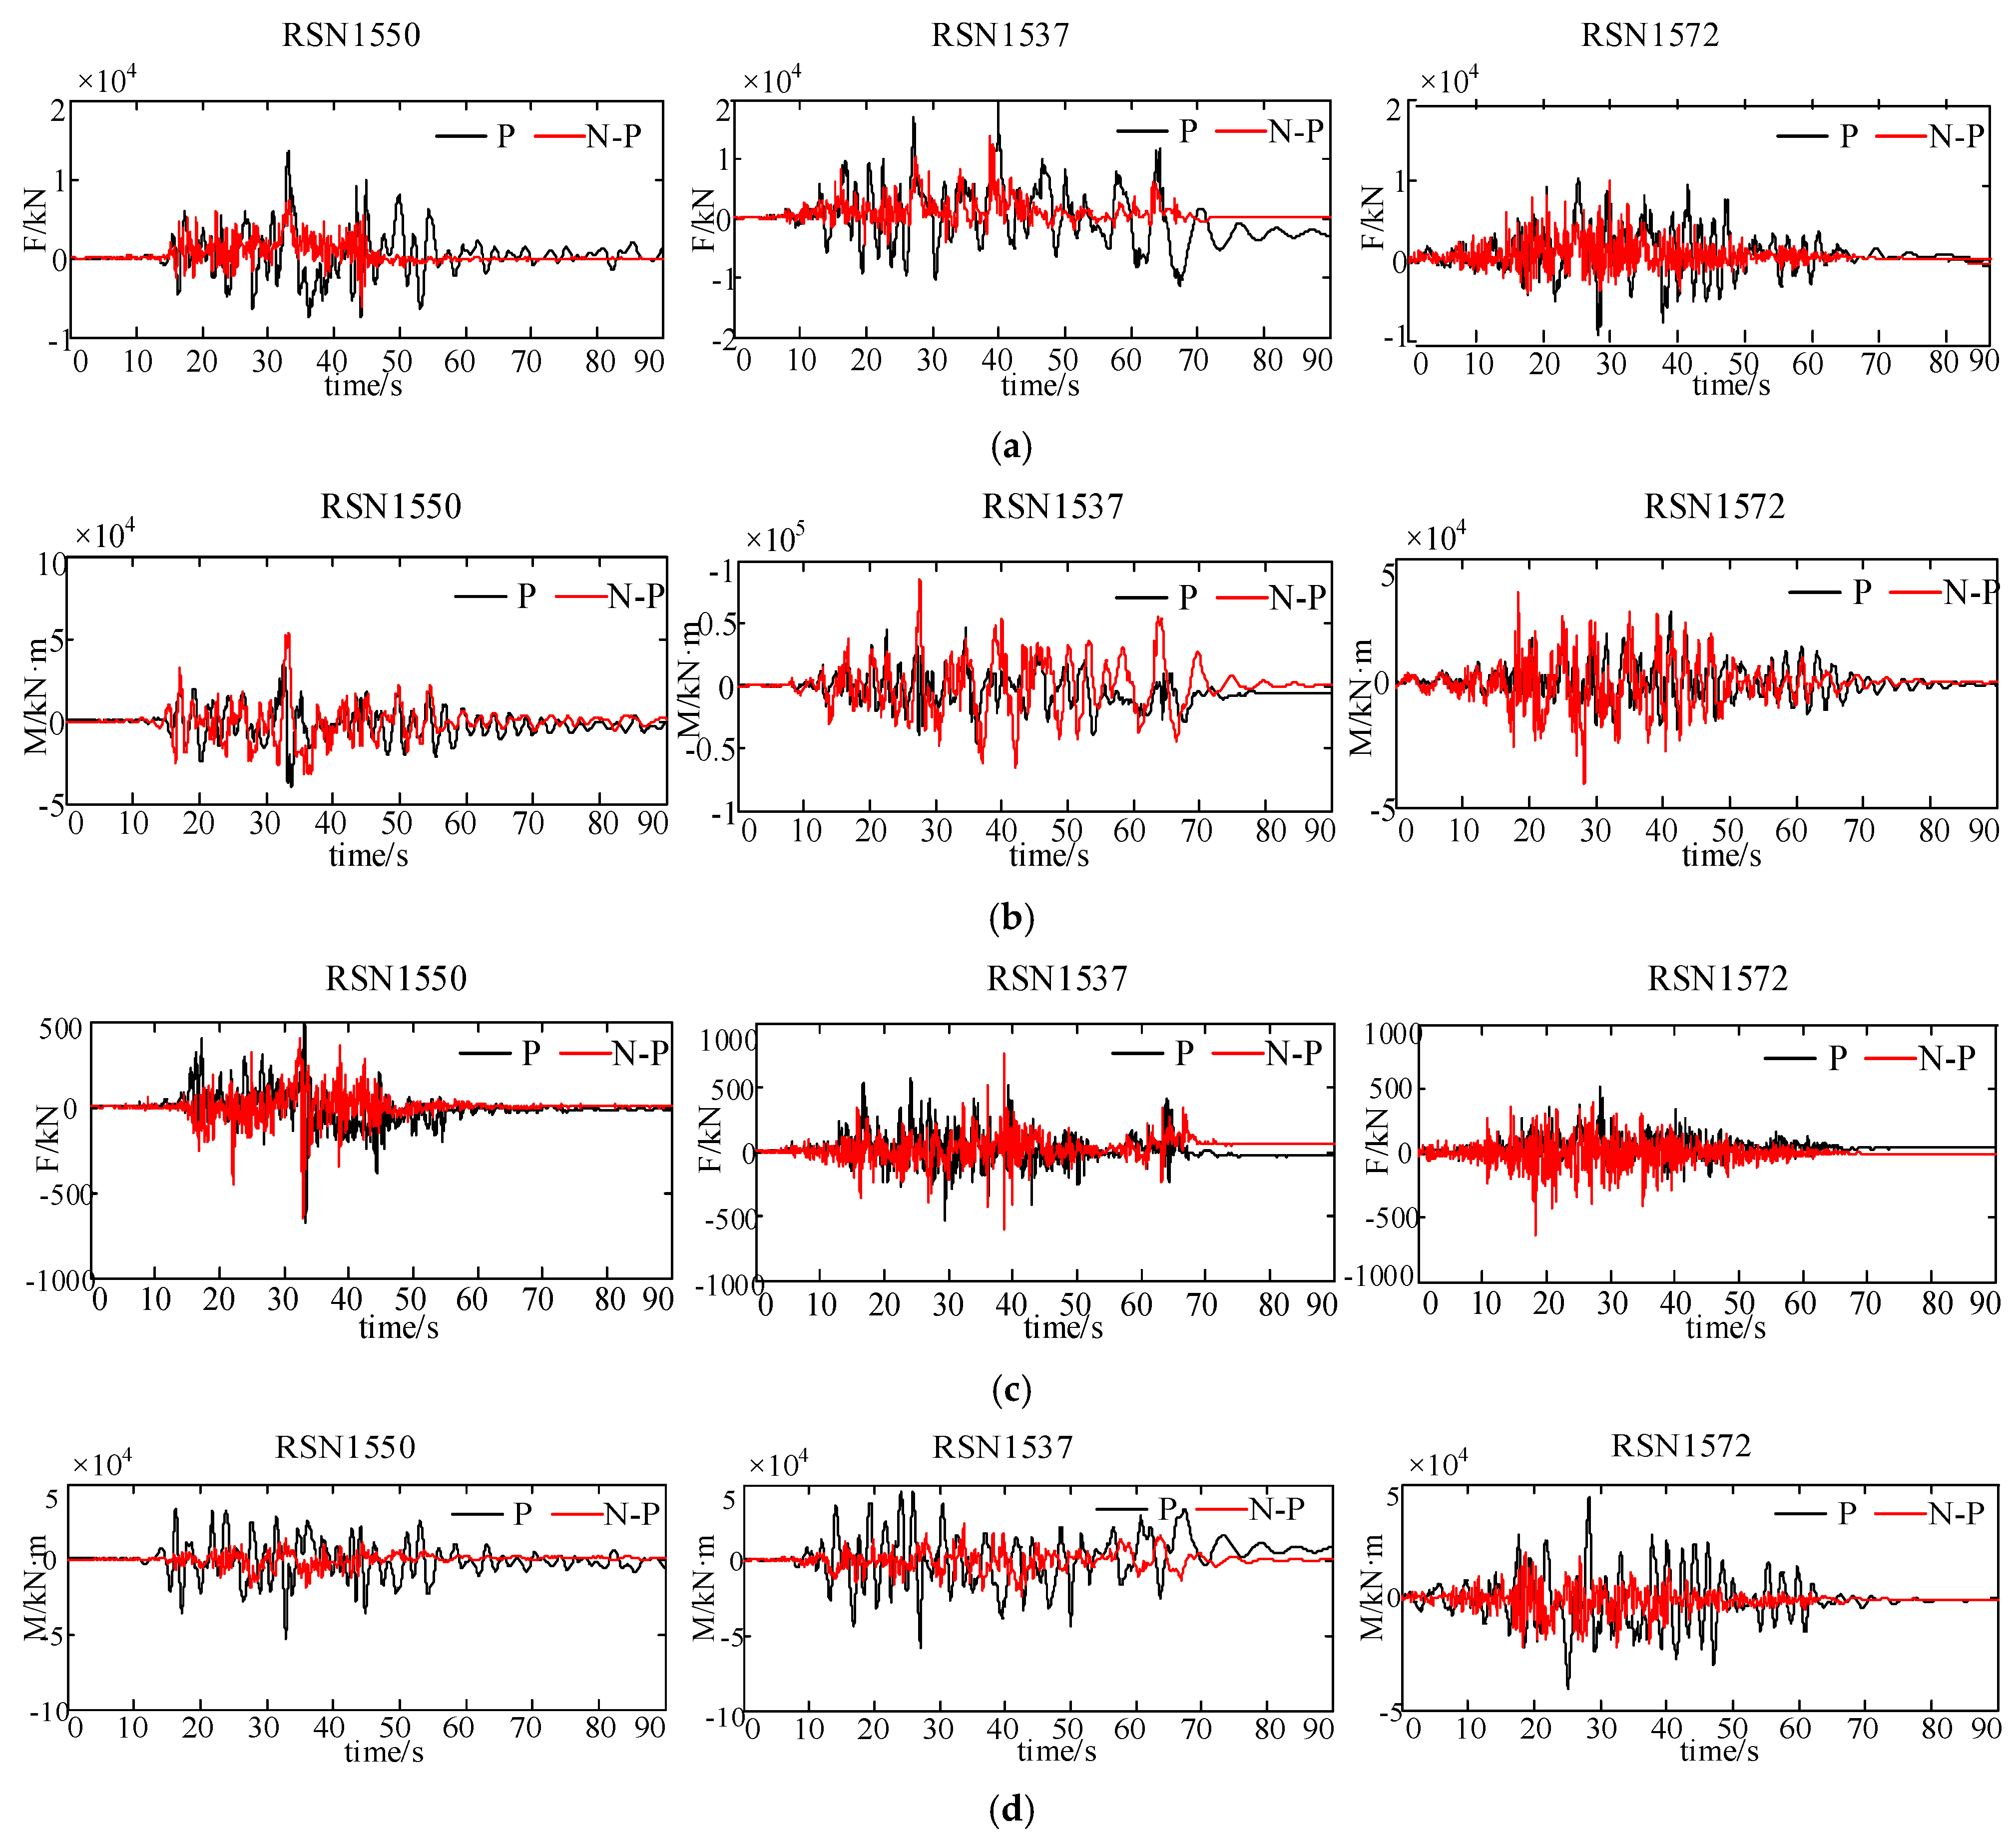
4.1. Pulse Effect
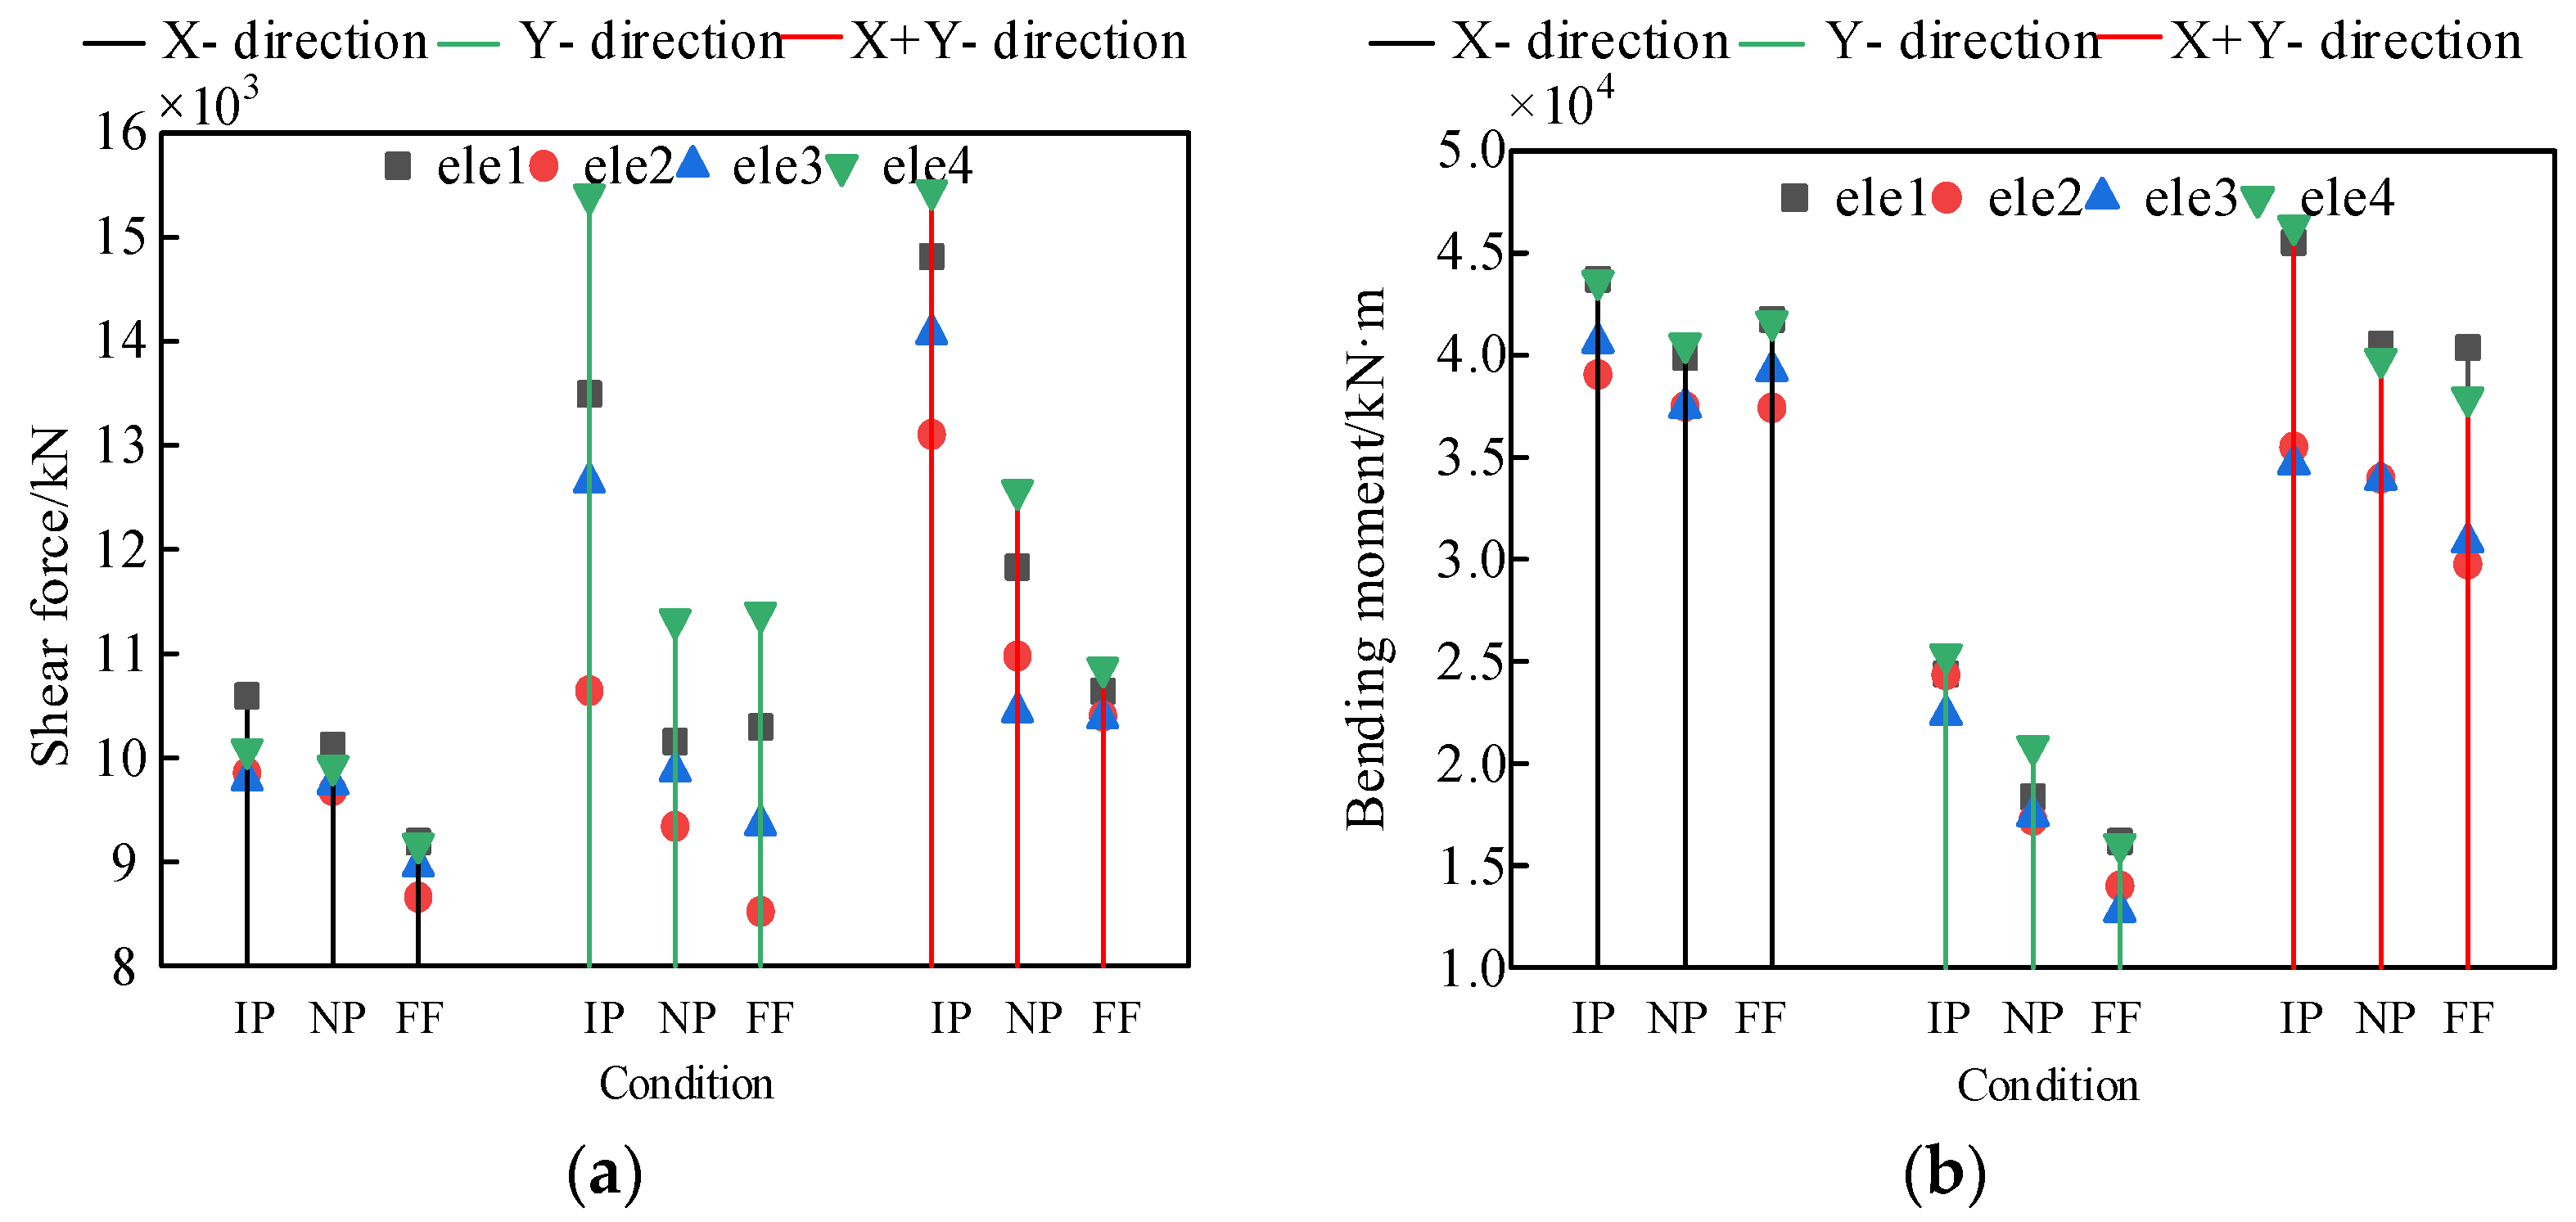
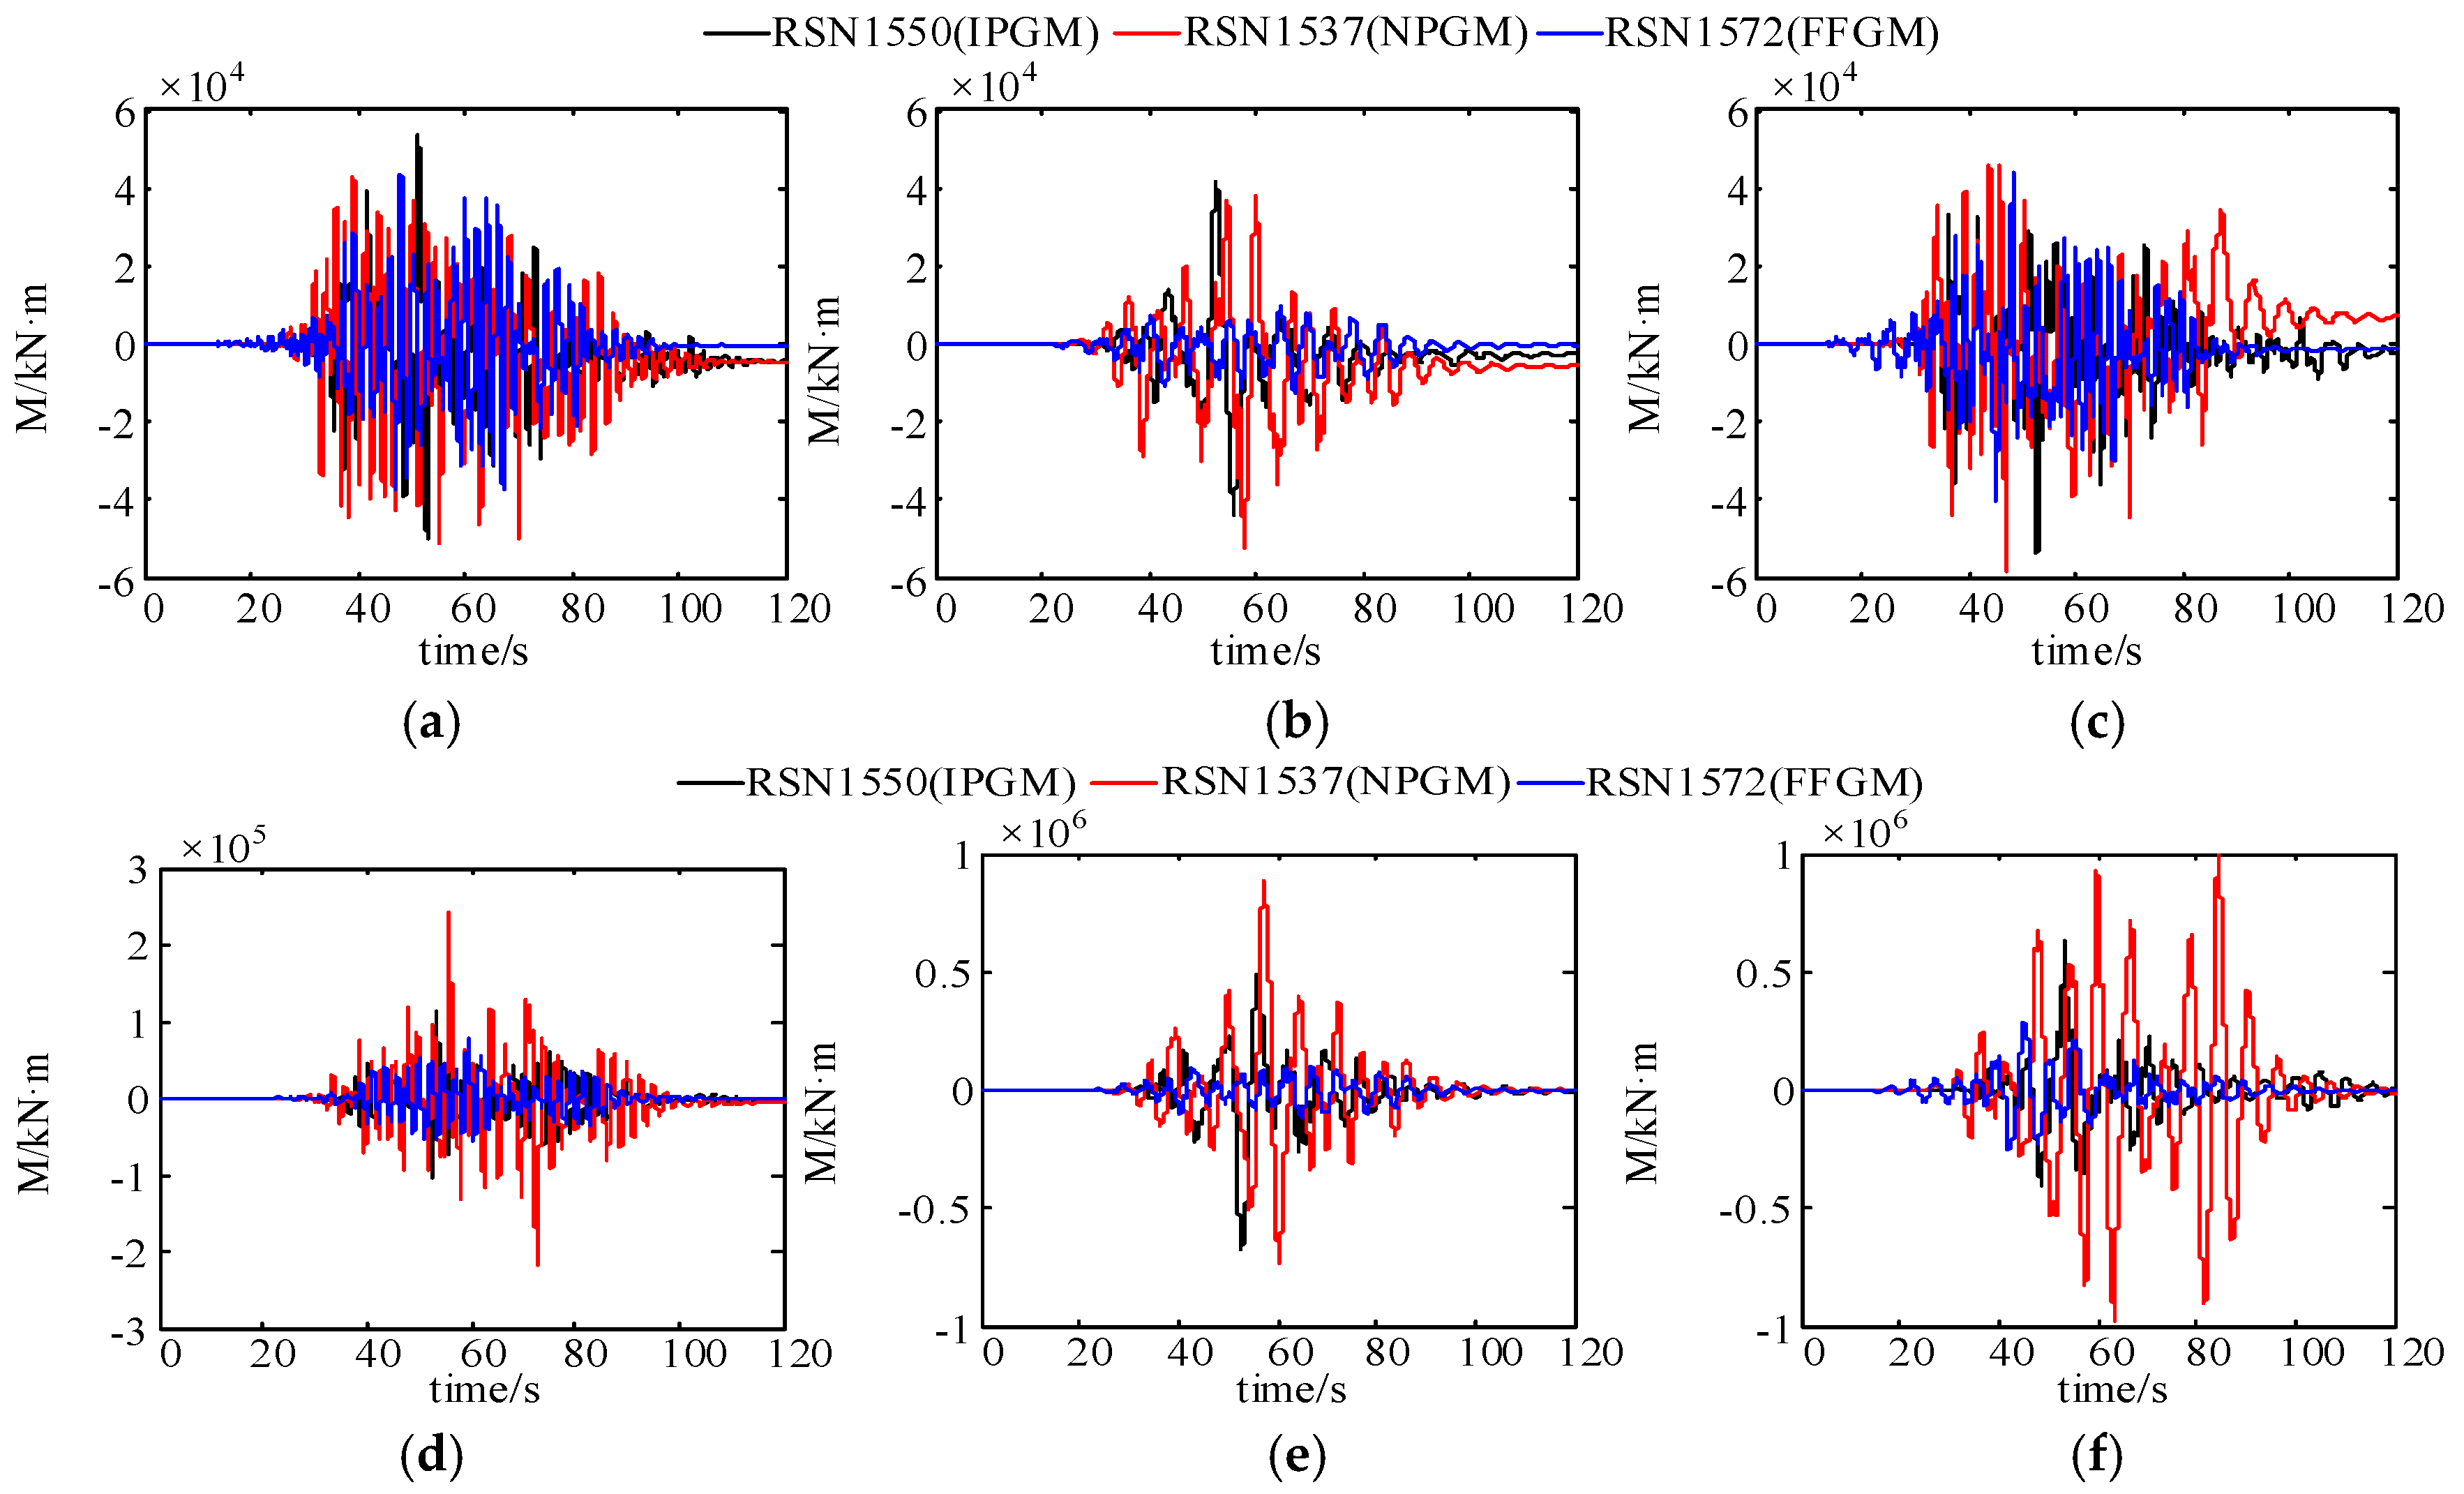
4.1.1. Main Pier (Pier 5 and Pier 6)
4.1.2. Tie Beams and Auxiliary Piers (Pier 3)
4.1.3. Bearing
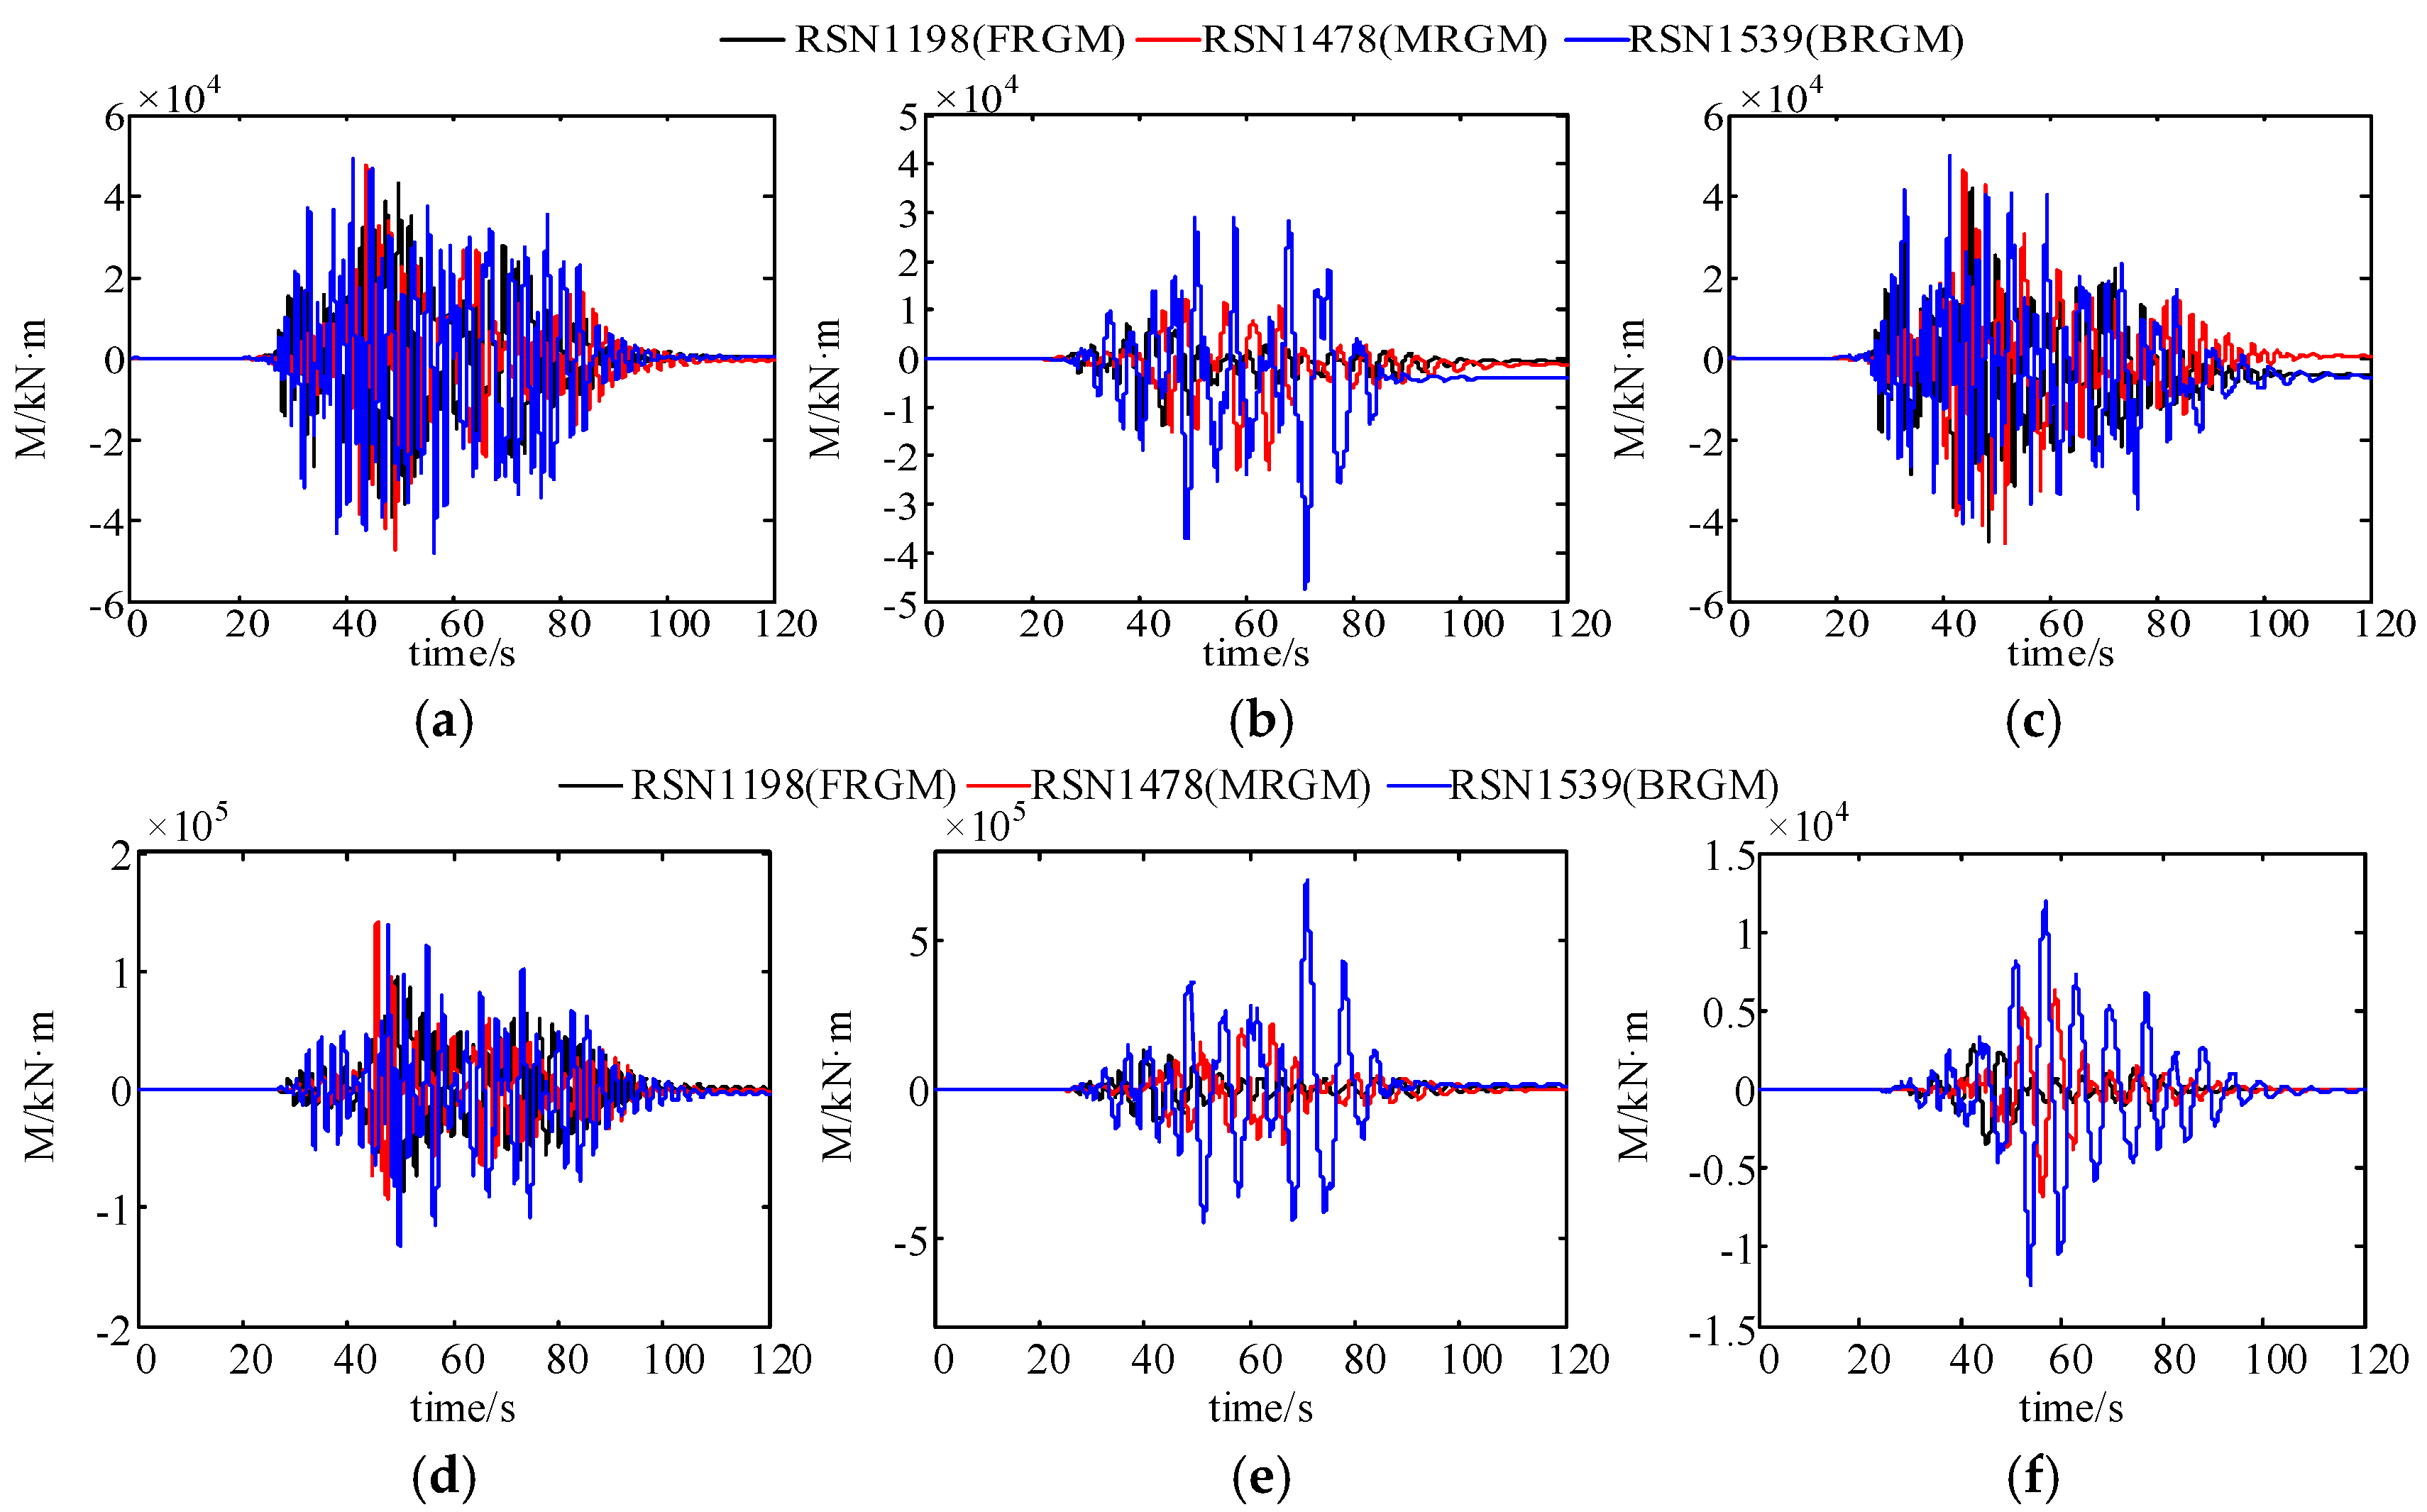
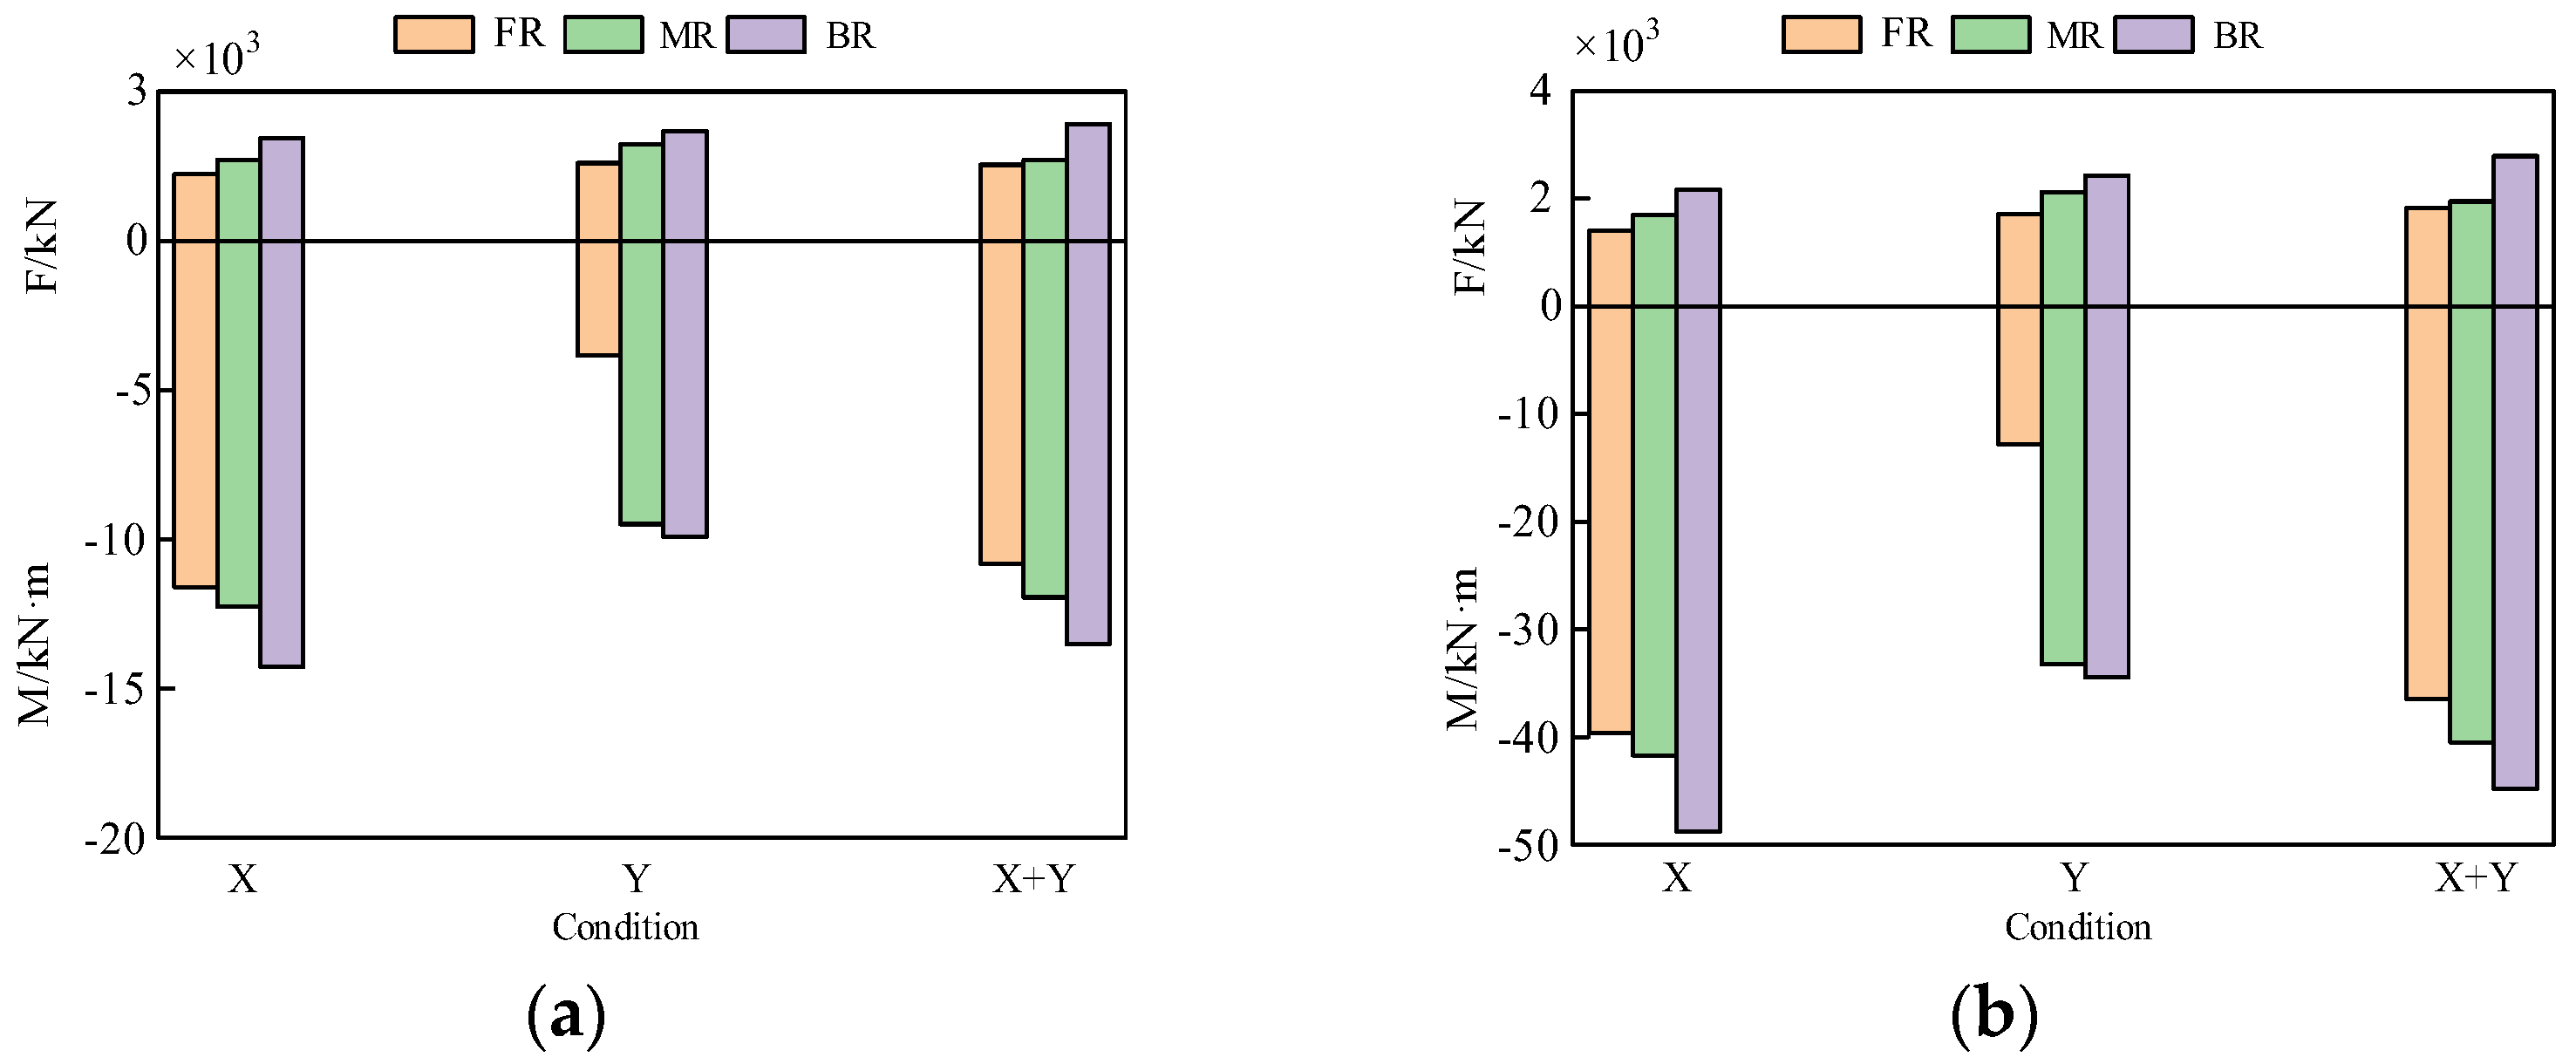
4.2. Directional Effect
4.2.1. Main Pier (Pier 5 and Pier 6)
4.2.2. Tie Beams and Auxiliary Piers (Pier 3)
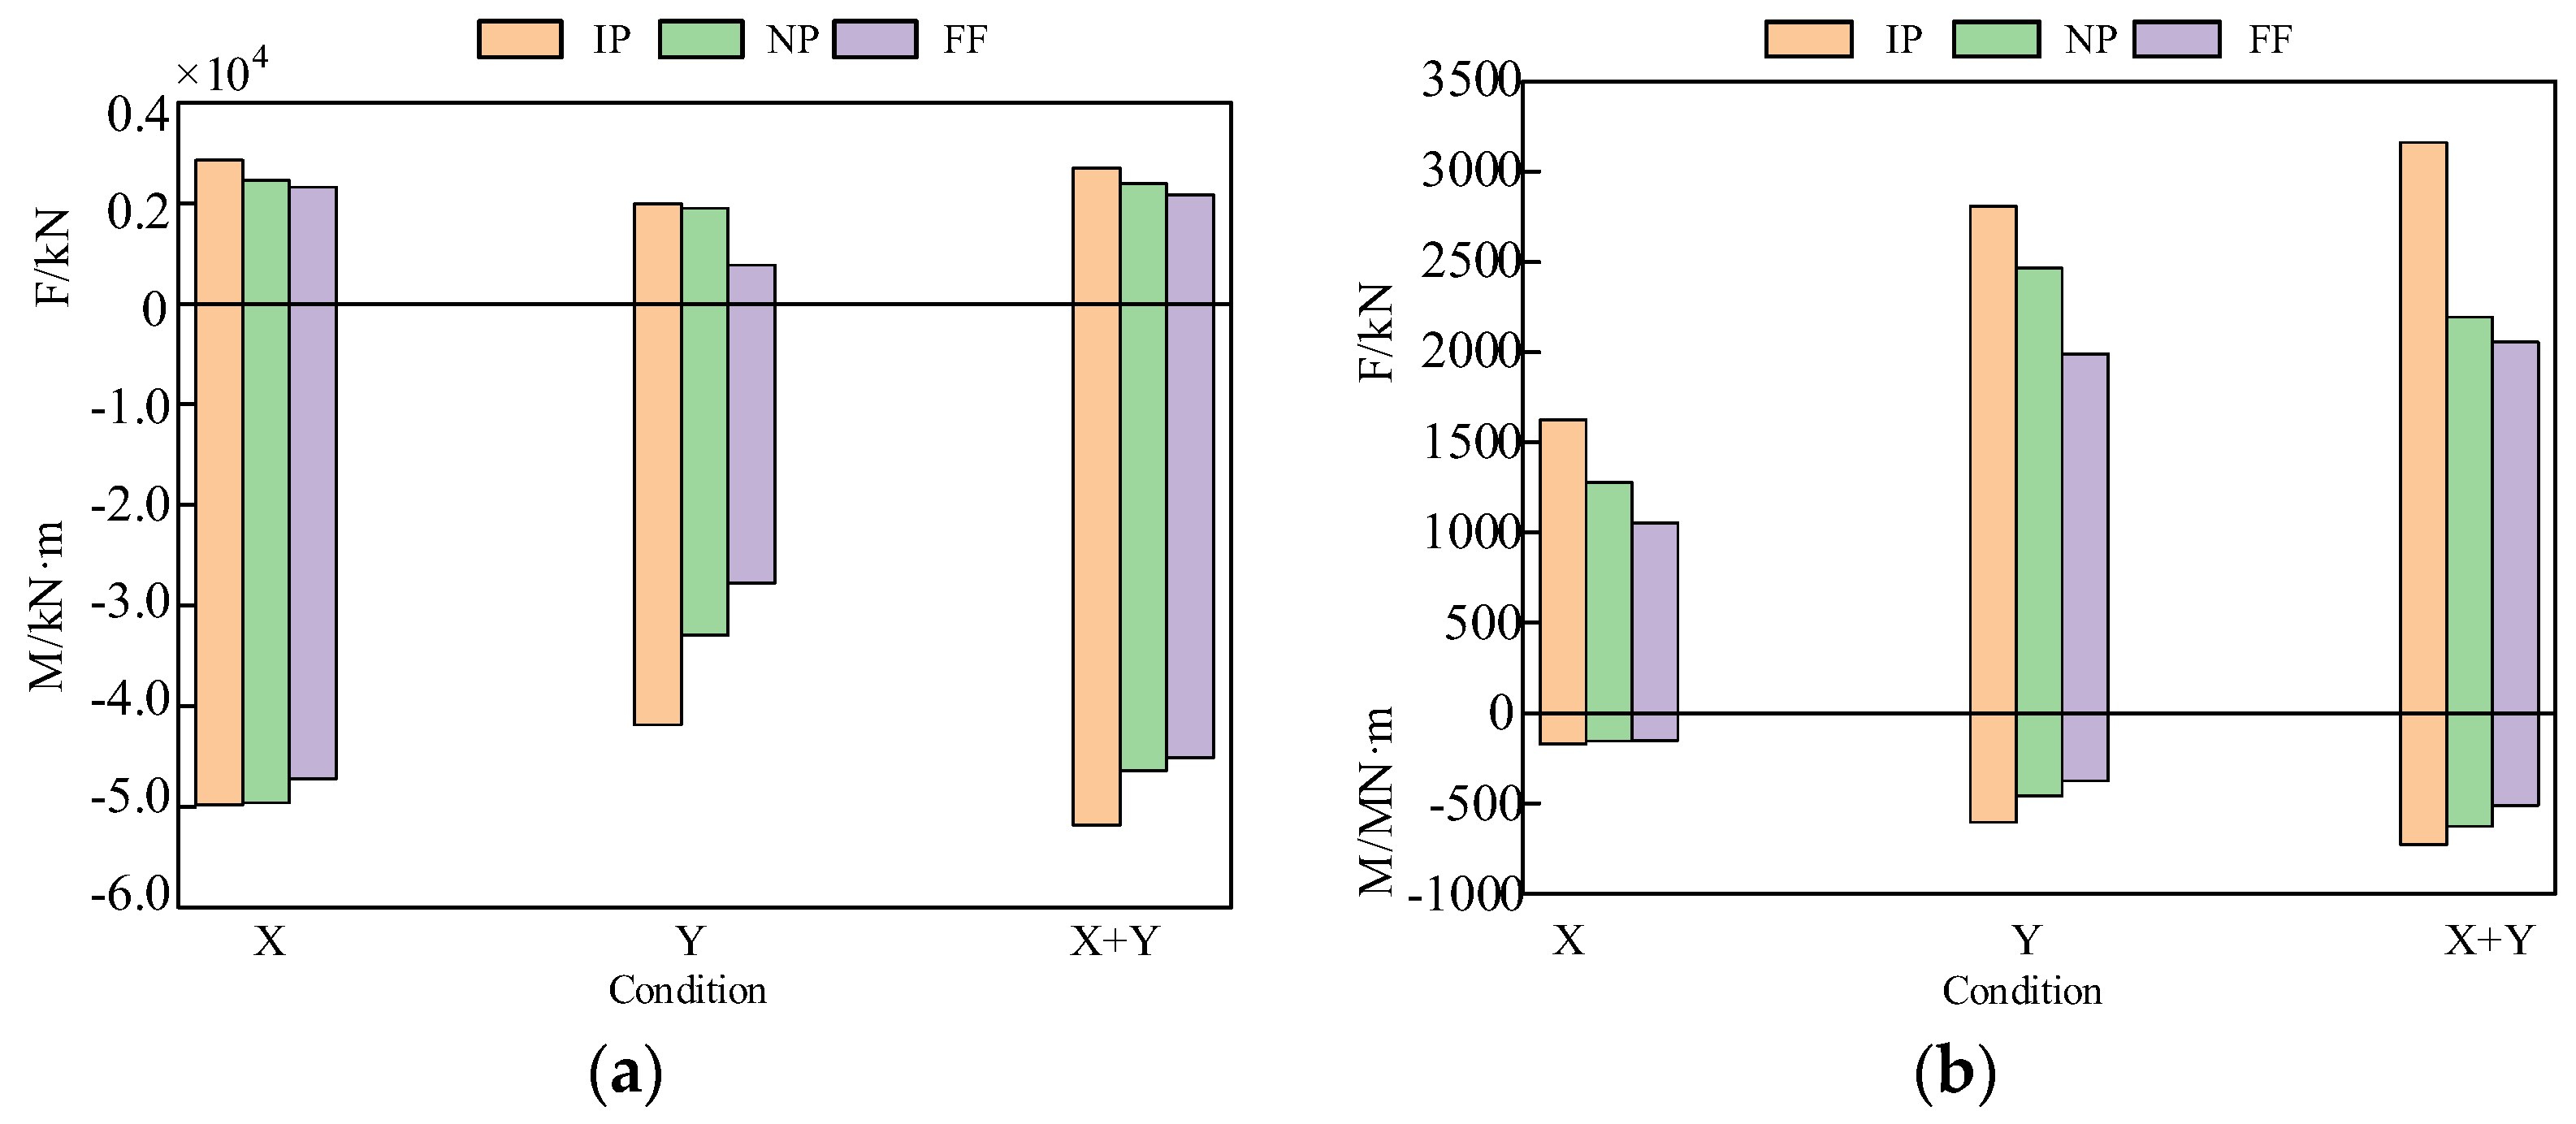
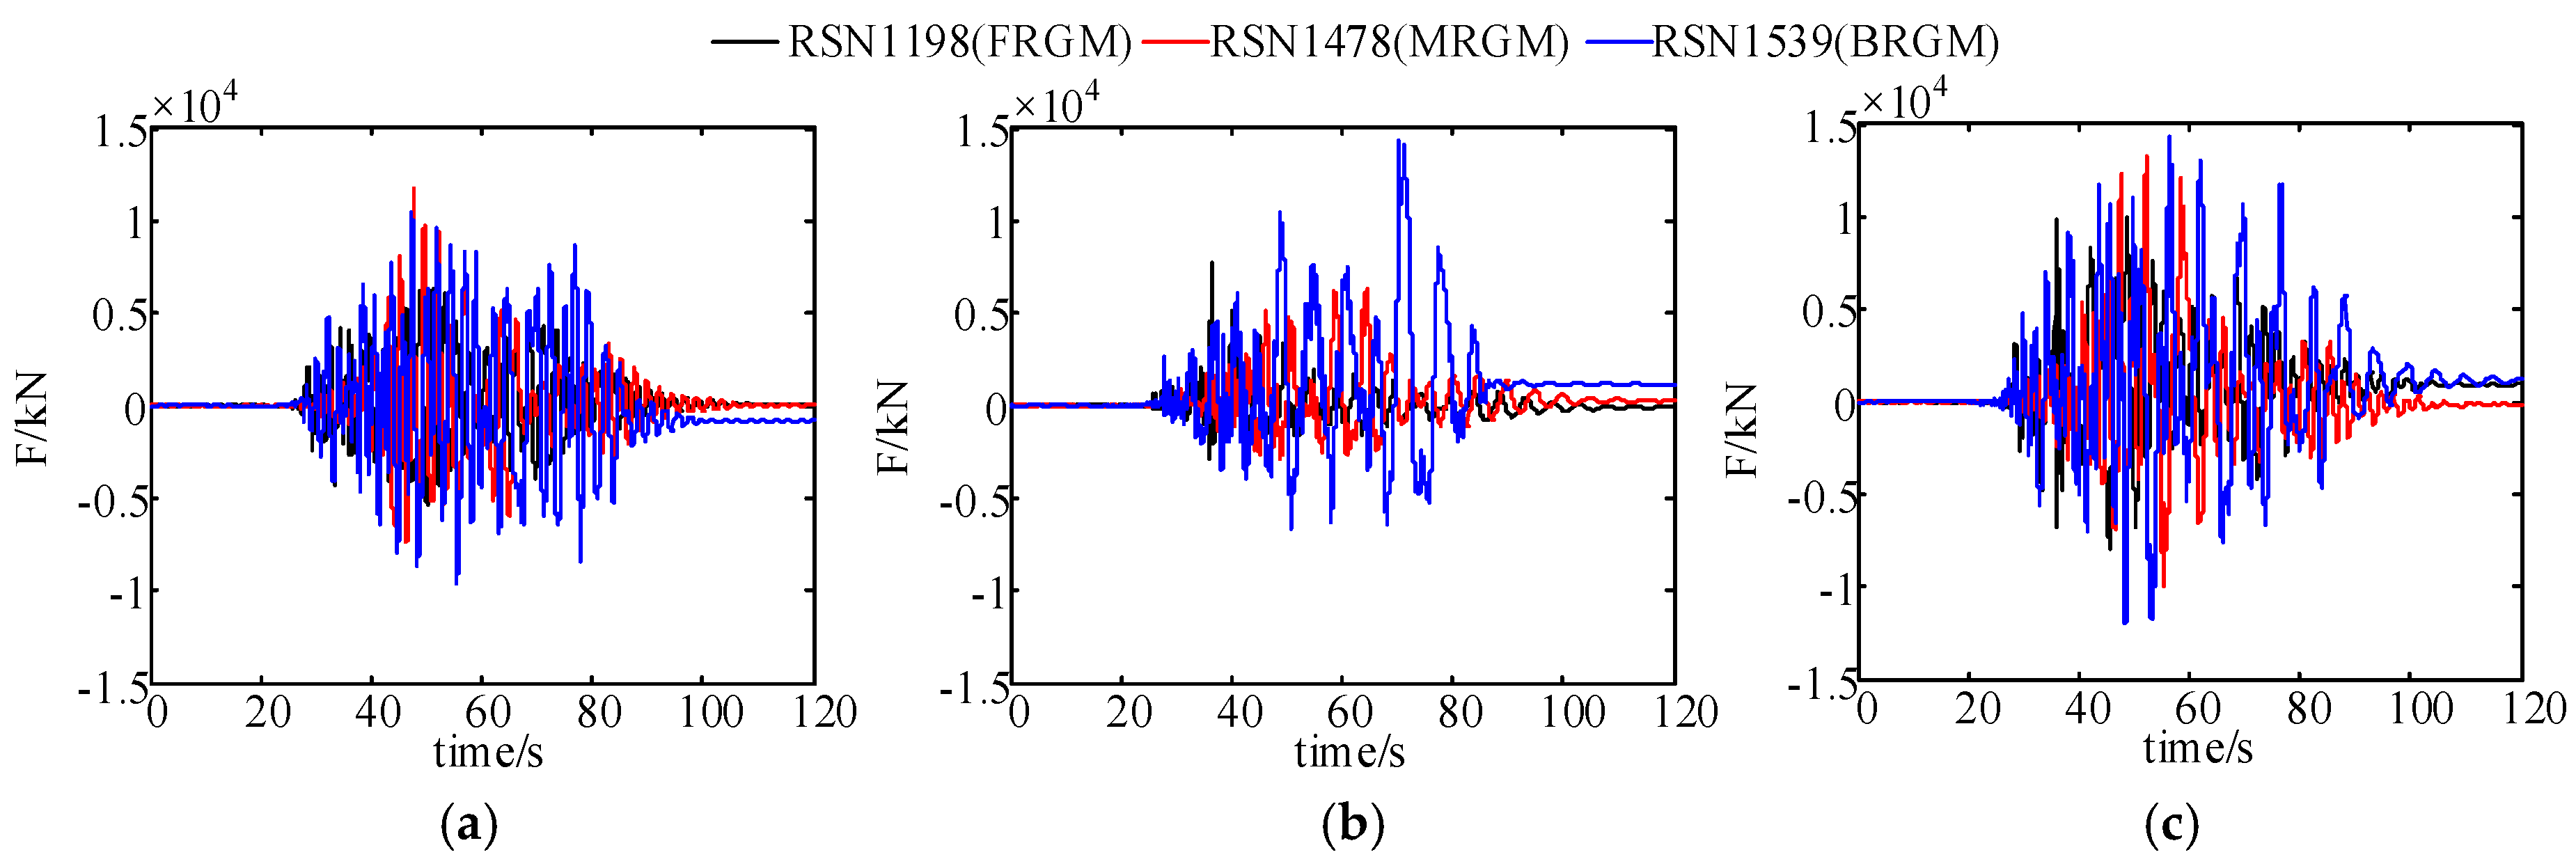
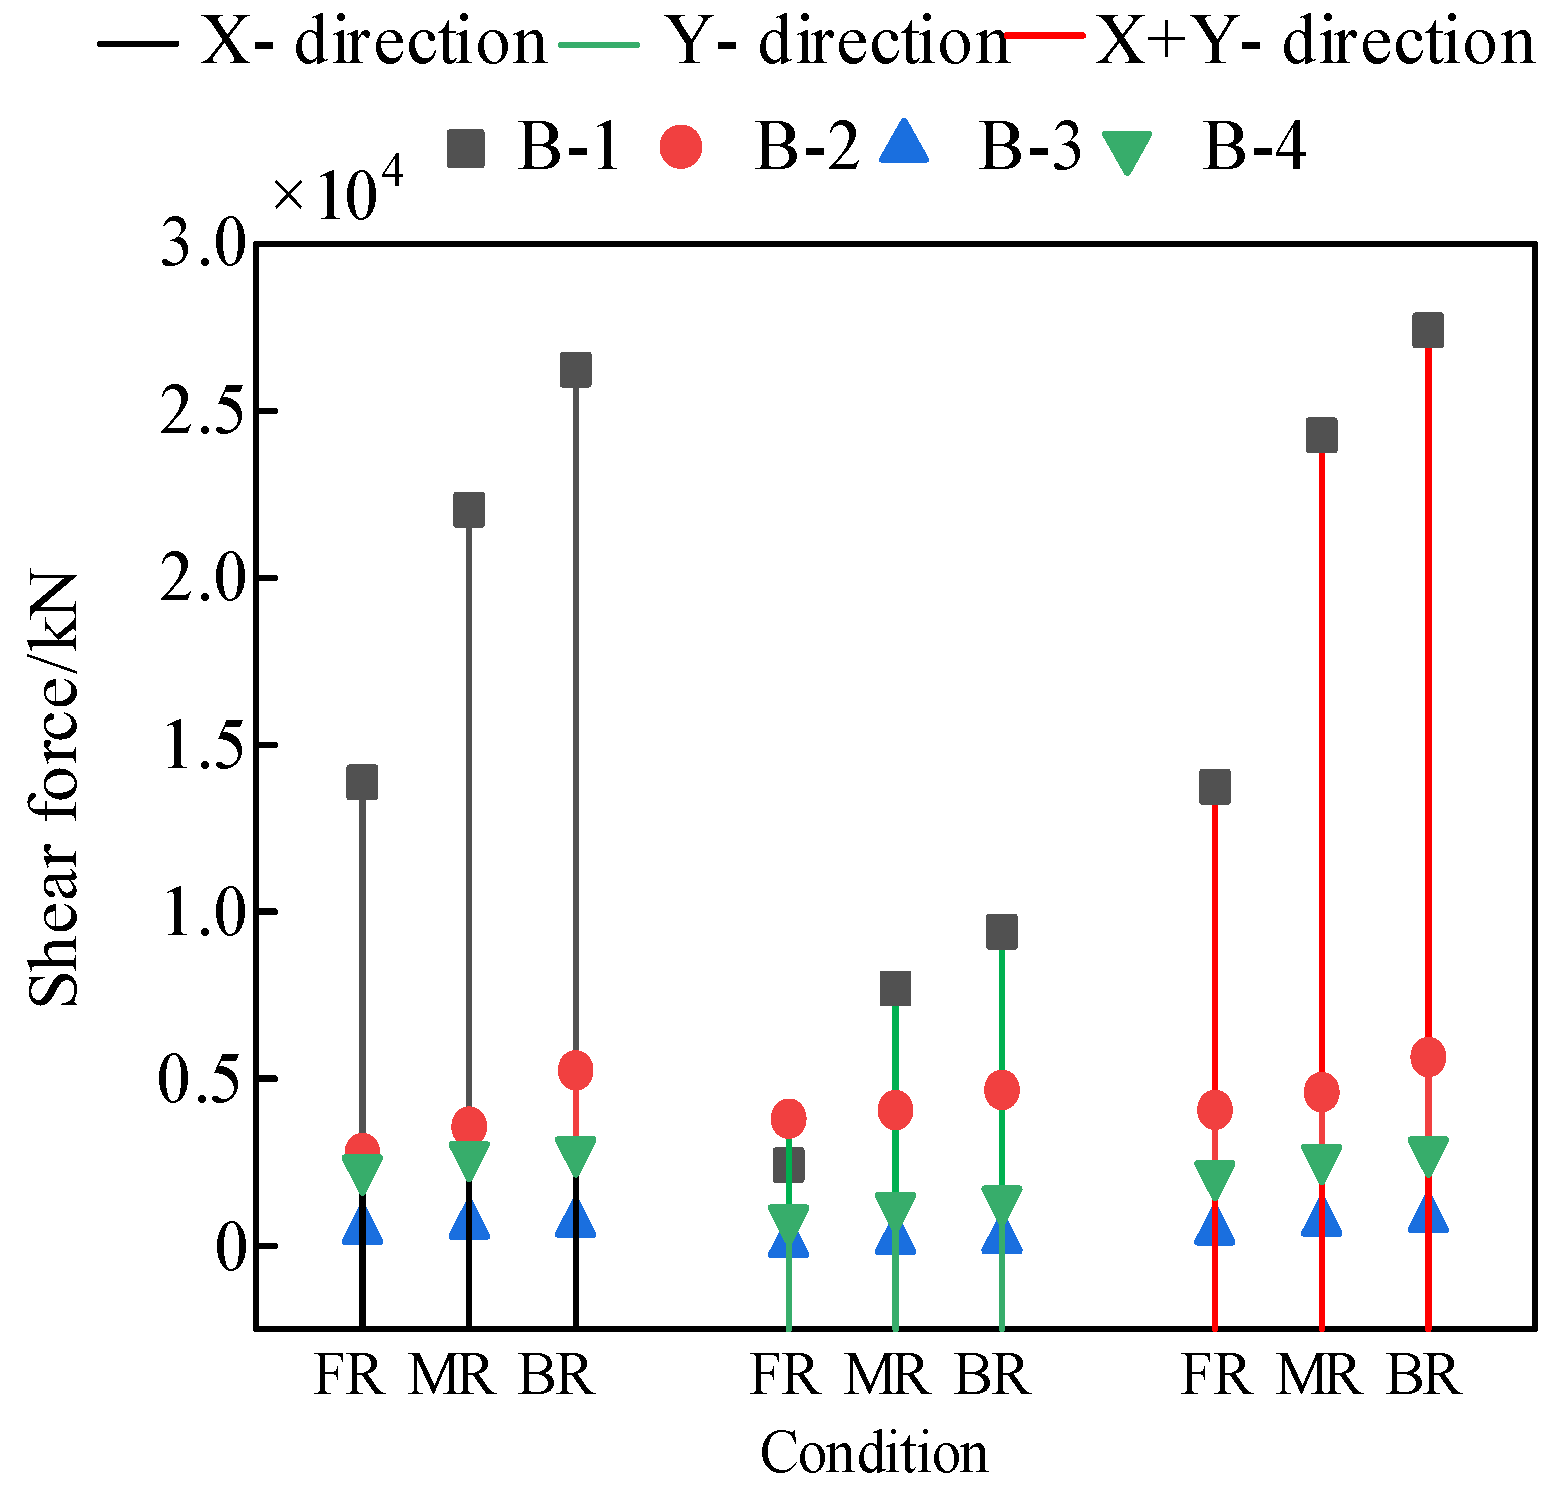
4.2.3. Bearing
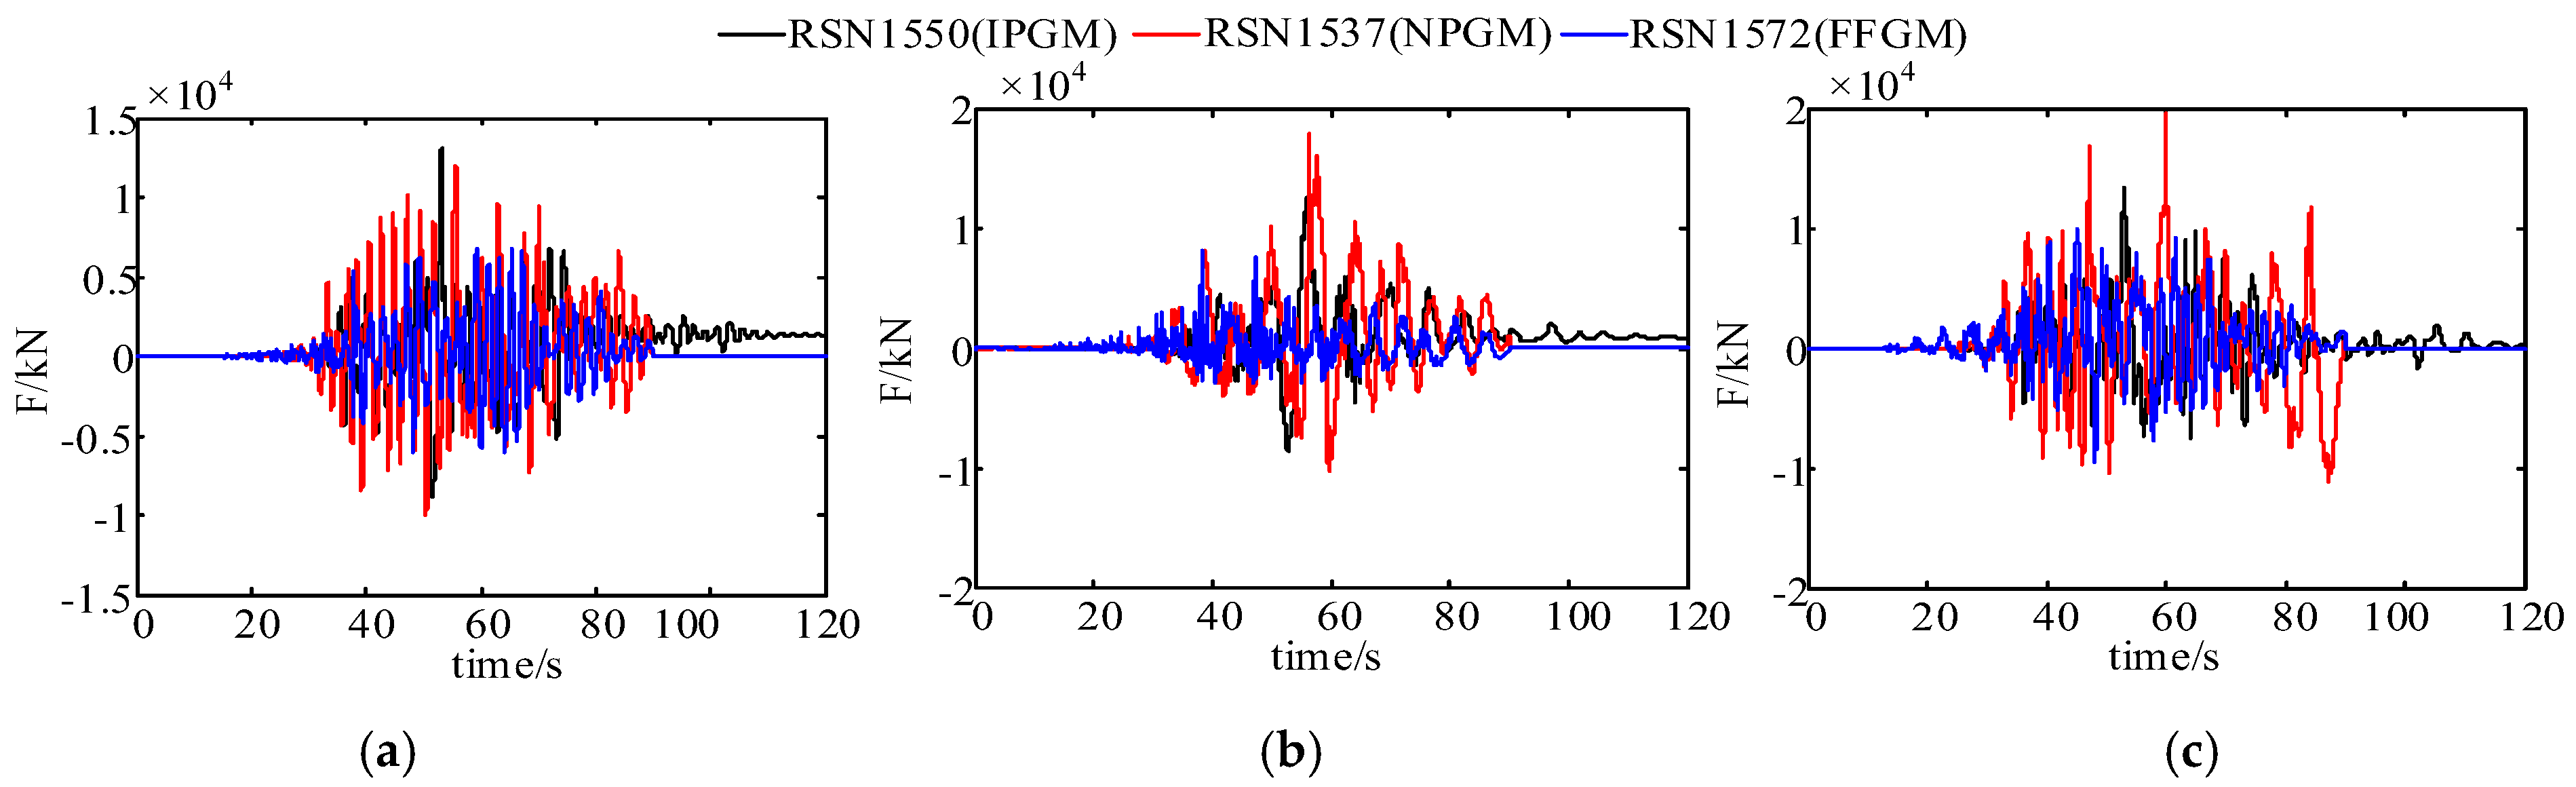
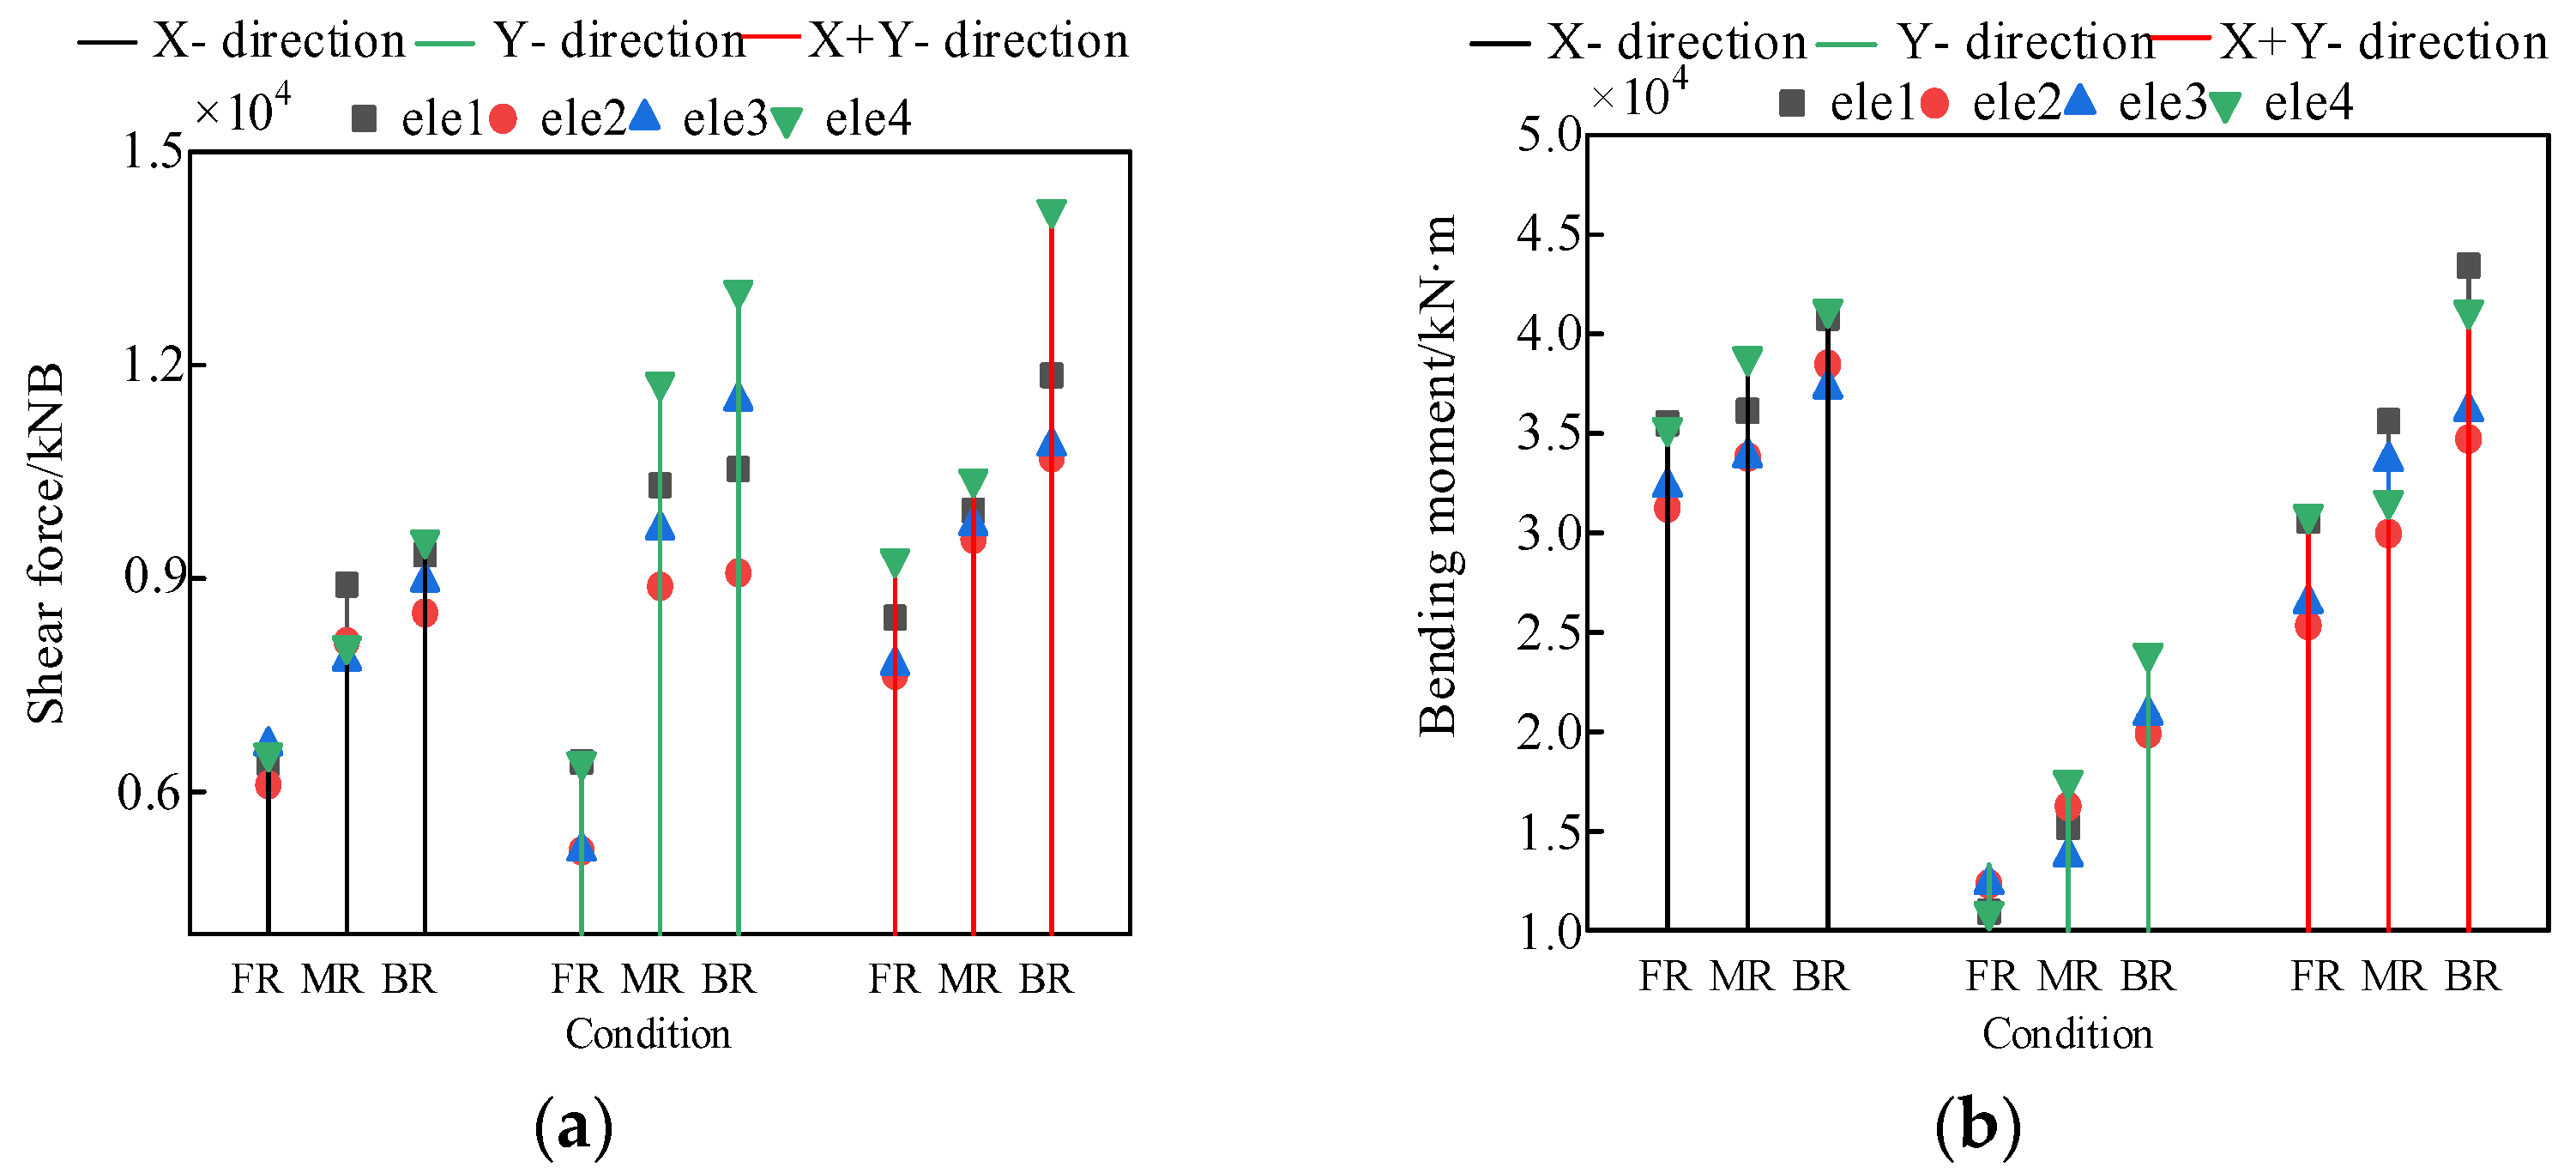
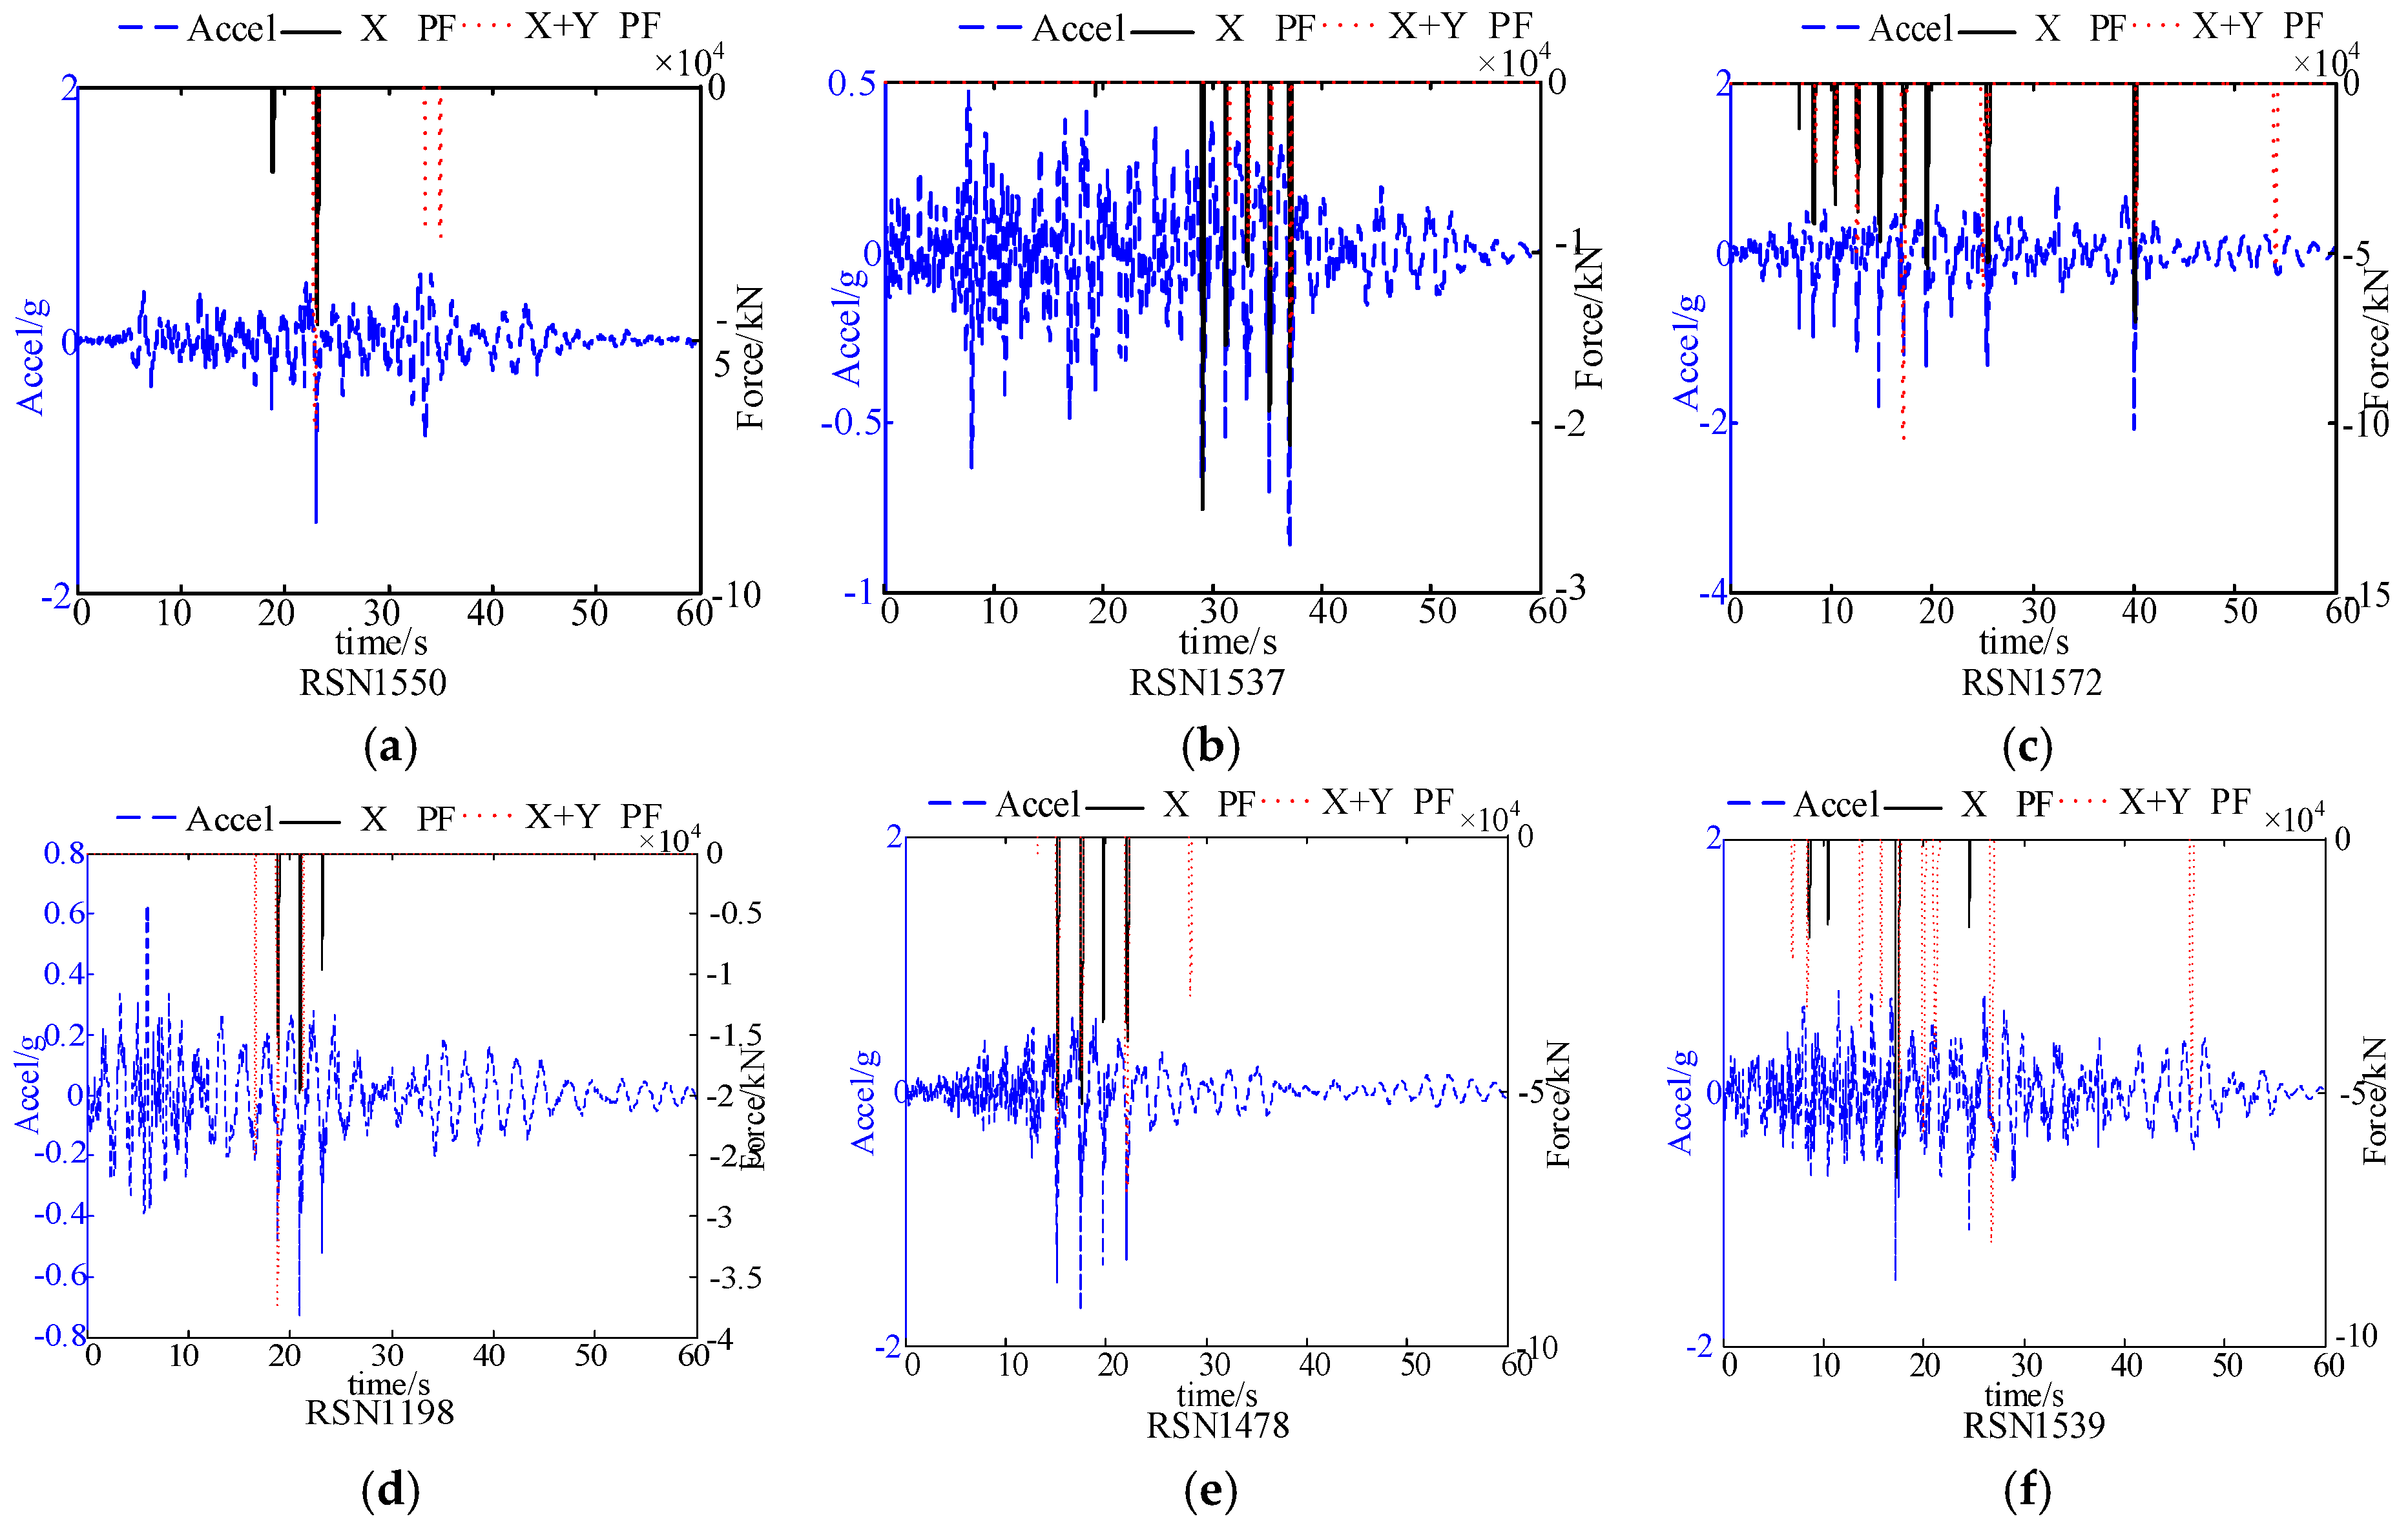
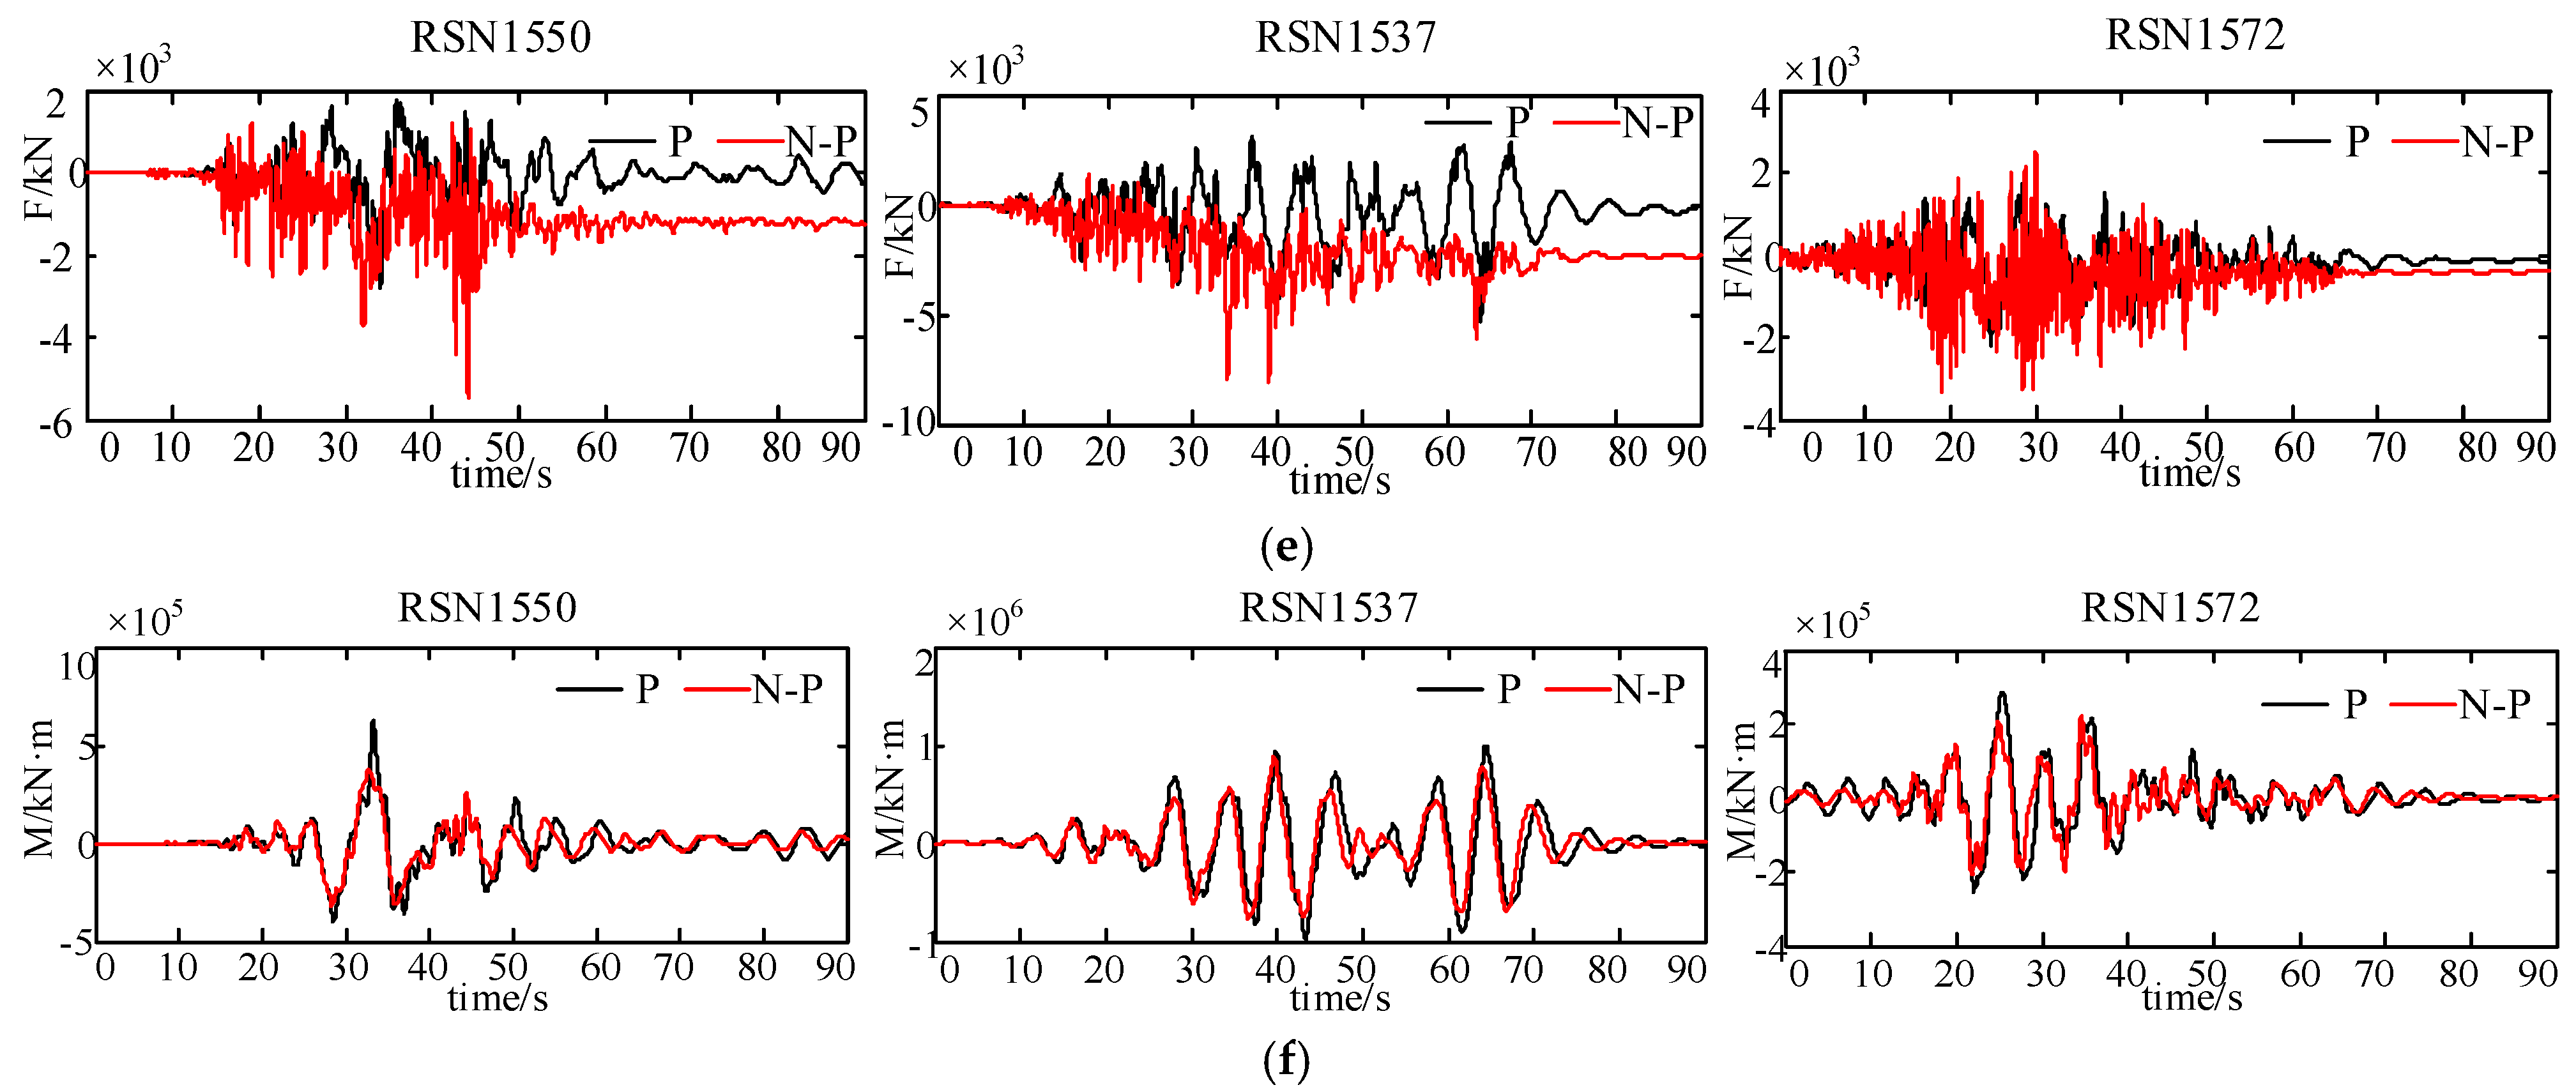
4.3. Pounding Response and Impact
4.3.1. Pounding Response
4.3.2. Pounding Impact
5. Conclusions
- The seismic response of CHRF bridges under IPGMs is significantly larger than that of under NPGMs, while the dynamic response of CHRF bridges under FFGMs is minimum. IPGMs induce a larger pounding force and a smaller number of poundings compared with FFGMs. The energy dissipation design of the tie beam is a significant part of the seismic design of CHRF bridges under the NFGMs.
- The directional effect of NFGMs has a significant impact on the seismic response of CHRF bridges. The internal force of the structure and the shear force of the bearing are the largest under BRGMs, and the seismic response of the structure is the smallest under FRGMs. The directional effect of ground motions results in a trend that the pounding force and the number of poundings increase from the FRGMs to the BRGMs.
- Comparing the cases with pounding with the cases without pounding, under the pulse effect and directional effect of ground motions, the shear force of the main pier increased and the bending moment of the main pier decreased, the bending moment of the tie beam increased, the shear force of the auxiliary pier decreased, and the bending moment of the auxiliary pier increased.
Author Contributions
Funding
Institutional Review Board Statement
Informed Consent Statement
Data Availability Statement
Conflicts of Interest
Nomenclature
| BR | backward region |
| BRGMs | backward region ground motions |
| CHRF bridges | curved high-pier rigid frame bridges |
| FF | far-fault |
| FFGMs | far-fault ground motions |
| FR | forward region |
| FRGMs | forward region ground motions |
| IP | impulse-like |
| IPGMs | impulse-like ground motions |
| NFGMs | near-fault ground motions |
| NP | non-pulse-like |
| NP-BM | bending moments without pounding |
| NPGMs | non-pulse-like ground motions |
| NP-SF | shear force without pounding |
| MR | middle region |
| MRGMs | middle region ground motions |
| P-BM | bending moments with pounding |
| PF | pounding force |
| PN | number of poundings |
| P-SF | shear force with pounding |
References
- Mavroeidis, G.P.; Dong, G.; Papageorgiou, A.S. Near-fault ground motions, and the response of elastic and inelastic single-degree-of-freedom (SDOF) systems. Earthq. Eng. Struct. Dyn. 2004, 33, 1023–1049. [Google Scholar] [CrossRef]
- Baker, J.W. Identification of Near-Fault Velocity Pulses and Prediction of Resulting Response Spectra. In Proceedings of the Geotechnical Earthquake Engineering and Structural Dynamics IV, Sacramento, CA, USA, 18–22 May 2008. [Google Scholar]
- Bray, J.D.; Rodriguez-Marek, A. Characterization of forward-directivity ground motions in the near-fault region. Soil Dyn. Earthq. Eng. 2004, 24, 815–828. [Google Scholar] [CrossRef]
- Chopra, A.K.; Chintanapakdee, C. Comparing response of SDF systems to near-fault and far-fault earthquake motions in the context of spectral regions. Earthq. Eng. Struct. Dyn. 2001, 30, 1769–1789. [Google Scholar] [CrossRef]
- Zhang, S.; Wang, G. Effects of near-fault and far-fault ground motions on nonlinear dynamic response and seismic damage of concrete gravity dams. Soil Dyn. Earthq. Eng. 2013, 53, 217–229. [Google Scholar] [CrossRef]
- Lin, Y.; Bi, K.; Zong, Z.; Hao, H.; Lin, J.; Chen, Y. Seismic Performance of Steel-Concrete Composite Rigid-Frame Bridge: Shake Table Test and Numerical Simulation. J. Bridg. Eng. 2020, 25, 04020032. [Google Scholar] [CrossRef]
- Zong, Z.; Xia, Z.; Liu, H.; Li, Y.; Huang, X. Collapse Failure of Prestressed Concrete Continuous Rigid-Frame Bridge under Strong Earthquake Excitation: Testing and Simulation. J. Bridg. Eng. 2016, 21, 04016047. [Google Scholar] [CrossRef]
- Jia, J.; Du, X.; Han, Q. Research progress on the characteristics of near-fault ground motions and their effects on engineering structures. J. Build. Struct. 2015, 36, 1–12. [Google Scholar]
- Adanur, S.; Altunişik, A.C.; Bayraktar, A.; Akköse, M. Comparison of near-fault and far-fault ground motion effects on geomet-rically nonlinear earthquake behavior of suspension bridges. Nat. Hazards 2012, 64, 593–614. [Google Scholar] [CrossRef]
- Su, P.; Chen, Y.; Yan, W. Experiment of curved girder bridge under earthquake action of near-fault directional effect. J. Harbin Inst. Technol. 2019, 51, 148–155. [Google Scholar]
- Dhankot, M.A.; Soni, D.P. Behaviour of Triple Friction Pendulum isolator under forward directivity and fling step effect. KSCE J. Civ. Eng. 2017, 21, 872–881. [Google Scholar] [CrossRef]
- Xin, L.; Li, X.; Zhang, Z.; Zhao, L. Seismic behavior of long-span concrete-filled steel tubular arch bridge subjected to near-fault fling-step motions. Eng. Struct. 2019, 180, 148–159. [Google Scholar] [CrossRef]
- Li, S.; Wang, J.; Yan, X.; Feng, Y. Influence of spatial distribution characteristics of near-fault ground motions on seismic response of cable-stayed bridges. China Civ. Eng. J. 2016, 49, 94–104. [Google Scholar]
- Li, S.; Zhang, F.; Wang, J.-Q.; Alam, M.S.; Zhang, J. Effects of Near-Fault Motions and Artificial Pulse-Type Ground Motions on Super-Span Cable-Stayed Bridge Systems. J. Bridg. Eng. 2017, 22, 04016128. [Google Scholar] [CrossRef]
- Xu, W.; Luo, Z.; Yan, W.; Chen, Y.; Wang, J. Impact of pulse parameters on the seismic response of long-period bridges. Struct. Infrastruct. Eng. 2020, 16, 1461–1480. [Google Scholar] [CrossRef]
- Daei, A.; Poursha, M.; Zarrin, M. Seismic Performance Evaluation of Code-compliant RC Moment-resisting Frame Buildings Subjected to Near-fault Pulse-like and Non-pulse-like Ground Motions. J. Earthq. Eng. 2021, 2021, 1–28. [Google Scholar] [CrossRef]
- Han, L.; Liu, H.; Zhang, W.; Ding, X.; Chen, Z.; Feng, L.; Wang, Z. Seismic behaviors of utility tunnel-soil system: With and without joint connections. Undergr. Space 2021. [Google Scholar] [CrossRef]
- Song, B.; Galasso, C. Directivity-Induced Pulse-Like Ground Motions and Fracture Risk of Pre-Northridge Welded Column Splices. J. Earthq. Eng. 2020, 2020, 1–19. [Google Scholar] [CrossRef]
- Miari, M.; Choong, K.K.; Jankowski, R. Seismic Pounding Between Bridge Segments: A State-of-the-Art Review. Arch. Comput. Methods Eng. 2021, 28, 495–504. [Google Scholar] [CrossRef]
- Muthukumar, S.; DesRoches, R. A Hertz contact model with non-linear damping for pounding simulation. Earthq. Eng. Struct. Dyn. 2006, 35, 811–828. [Google Scholar] [CrossRef]
- Dimitrakopoulos, E.G.; Makris, N.; Kappos, A. Dimensional analysis of the earthquake-induced pounding between inelastic structures. Bull. Earthq. Eng. 2011, 9, 561–579. [Google Scholar] [CrossRef]
- Chen, J.; Han, Q.; Liang, X.; Du, X. Effect of pounding on nonlinear seismic response of skewed highway bridges. Soil Dyn. Earthq. Eng. 2017, 103, 151–165. [Google Scholar] [CrossRef]
- Kun, C.; Jiang, L.; Chouw, N. Influence of pounding and skew angle on seismic response of bridges. Eng. Struct. 2017, 148, 890–906. [Google Scholar] [CrossRef]
- Kun, C.; Yang, Z.Q.; Chouw, N. Seismic response of skewed bridges including pounding effects. Earthq. Struct. 2018, 14, 467–476. [Google Scholar]
- Li, N.; Xu, W.; Chen, Y.; Yan, W. Experimental study on the impact and impact of curved bridges under near-fault earthquakes. Vib. Shock. 2020, 39, 40–47. [Google Scholar]
- Li, N.; Xu, W.; Chen, Y.; Yan, W. Experimental research on adjacent pounding effect of midspan curved bridge with longitudinal slope. Eng. Struct. 2019, 196, 109320. [Google Scholar] [CrossRef]
- Bi, K.; Hao, H. Numerical simulation of pounding damage to bridge structures under spatially varying ground motions. Eng. Struct. 2012, 46, 62–76. [Google Scholar] [CrossRef]
- Bi, K.; Hao, H.; Chouw, N. 3D FEM Analysis of Pounding Response of Bridge Structures at a Canyon Site to Spatially Varying Ground Motions. Adv. Struct. Eng. 2013, 16, 619–640. [Google Scholar] [CrossRef] [Green Version]
- Jiao, C.; Liu, W.; Gui, X.; Long, P.; Wu, Y. Shaking table test study on the impact response of small radius curved bridges under near-fault earthquakes. Eng. Mech. 2020, 37, 189–201. [Google Scholar]
- Jiao, C.; Liu, W.; Wu, S.; Gui, X.; Huang, J.; Long, P.; Li, W. Shake table experimental study of curved bridges with consideration of girder-to-girder collision. Eng. Struct. 2021, 237, 112216. [Google Scholar] [CrossRef]
- Jiao, C.; Liu, Y.; Wu, S.; Ma, Y.; Huang, J.; Liu, W. Influence of pounding buffer zone for mitigation of seismic response of curved bridges. Structure 2021, 32, 137–148. [Google Scholar] [CrossRef]
- Jiao, C.; Lu, J.; Wang, C.; Long, P.; Sun, Z. Experimental and numerical investigations on the effects of radius of curvature and longitudinal slope on the responses of curved bridges subject to seismic pounding. Meas. Control 2021, 54, 519–537. [Google Scholar] [CrossRef]
- Nielson, B.G. Analytical Fragility Curves for Highway Bridge in Moderate Seismic Zones. Ph.D. Thesis, Georgia Institute of Technology, Atlanta, GA, USA, 2005. [Google Scholar]
- Xie, H.; Zhu, Y.; Zheng, W.; Tang, G.; Xie, Y. Generation method of standard power spectral density for seismic design of nuclear power plant equipment. Nucl. Power Eng. 2021, 42, 6. [Google Scholar]


| Reinforcement | Yield Strength (MPa) | Ultimate Strength (MPa) | Concrete | Axial Compressive Strength (MPa) | Axial Tensile Strength (MPa) |
|---|---|---|---|---|---|
| HRB335 | 335 | 400.98 | C40 | 23.1 | 1.71 |
| HPB300 | 300 | 383.65 | C55 | 25.3 | 1.96 |
| Parameter | B-1 | B-2 | B-3 | B-4 |
|---|---|---|---|---|
| ud | 0.02 | 0.02 | 0.02 | 0.02 |
| R (kN) | 8029.87 | 3610.41 | 7566.94 | 7606.5 |
| xy | 0.003 | 0.003 | 0.003 | 0.003 |
| Fmax | 160.60 | 72.21 | 151.34 | 152.13 |
| k | 53,532.43 | 24,069.42 | 50,446.28 | 50,710 |
| Period (T/s) | T1 | T2 | T3 | T4 | T5 |
|---|---|---|---|---|---|
| OpenSees (T1/s) | 2.408 | 1.801 | 1.539 | 1.487 | 1.287 |
| Midas (T2/s) | 2.283 | 1.707 | 1.388 | 1.355 | 1.176 |
| (T1–T2)/T2 | 5.18% | 5.21% | 9.78% | 8.85% | 8.62% |
| RSN | Tp/s | Rrup/km | PGA/g | RSN | Tp/s | Rrup/km | PGA/g | RSN | Tp/s | Rrup/km | PGA/g |
|---|---|---|---|---|---|---|---|---|---|---|---|
| IPGM | NPGM | FFGM | |||||||||
| 1492 | 11.96 | 0.00 | 0.36 | 1499 | - | 8.51 | 0.20 | 1311 | - | 84.88 | 0.08 |
| 1503 | 5.74 | 0.57 | 0.79 | 1506 | - | 19.00 | 0.25 | 1325 | - | 80.88 | 0.08 |
| 1505 | 12.29 | 0.00 | 0.51 | 1527 | - | 11.37 | 0.11 | 1336 | - | 86.67 | 0.09 |
| 1548 | 9.02 | 13.13 | 0.17 | 1533 | - | 14.97 | 0.16 | 1404 | - | 110.30 | 0.03 |
| 1550 | 8.88 | 8.27 | 0.17 | 1536 | - | 11.58 | 0.19 | 1572 | - | 71.72 | 0.04 |
| 1510 | 5.00 | 0.89 | 0.33 | 1537 | - | 22.12 | 0.13 | 1342 | - | 88.05 | 0.08 |
| 1511 | 4.73 | 2.74 | 0.30 | 1542 | - | 25.42 | 0.12 | 1343 | - | 89.84 | 0.07 |
| FRGM | MRGM | BRGM | |||||||||
| 1198 | - | 10.96 | 0.29 | 1402 | 7.88 | 38.36 | 0.40 | 1529 | - | 1.49 | 0.30 |
| 1184 | - | 19.93 | 0.22 | 1476 | 5.29 | 28.04 | 0.20 | 1535 | - | 13.06 | 0.16 |
| 1205 | - | 19.37 | 0.64 | 1478 | 8.97 | 40.88 | 0.19 | 1539 | - | 31.05 | 0.07 |
| 1211 | - | 38.70 | 0.15 | 1471 | - | 49.81 | 0.13 | 1545 | - | 7.40 | 0.23 |
| 1201 | - | 14.82 | 0.30 | 1486 | 8.04 | 16.74 | 0.14 | 1528 | 10.32 | 2.11 | 0.26 |
| 1245 | - | 37.72 | 0.05 | 1524 | - | 45.18 | 0.70 | 1508 | - | 7.08 | 0.48 |
| 1380 | - | 30.85 | 0.09 | 1526 | - | 47.67 | 0.11 | 1509 | - | 13.46 | 0.60 |
| Different Ground Motions | Types | Pounding Force/MN | Number of Poundings | ||||
|---|---|---|---|---|---|---|---|
| X | Y | X + Y | X | Y | X + Y | ||
| Pulse effect | IP | −54.89 | −17.47 | −68.75 | 3 | 2 | 3 |
| NP | −53.99 | −27.43 | −63.28 | 4 | 6 | 7 | |
| FF | −52.29 | −30.94 | −61.73 | 5 | 11 | 6 | |
| Directional effect | FR | −18.08 | - | −23.74 | 2 | - | 3 |
| MR | −28.40 | −17.50 | −35.30 | 3 | 2 | 3 | |
| BR | −48.99 | −29.77 | −59.95 | 3 | 5 | 4 | |
| Key Sections | F/kN | Pulse Effect | Directional Effect | ||||
|---|---|---|---|---|---|---|---|
| M/kN·m | IPGMs | NPGMs | FFGMs | FRGMs | BRGMs | MRGMs | |
| Main pier | P-SF | 10,590.49 | 10,117.43 | 9191.15 | 6408.41 | 8911.81 | 9336.09 |
| NP-SF | 7309.57 | 8796.20 | 8282.48 | 8194.44 | 7291.88 | 8566.71 | |
| Ratio | 44.89% | 15.02% | 10.97% | −21.80% | 22.22% | 8.98% | |
| P-BM | 39,880.16 | 43,713.81 | 41,745.36 | 35,492.88 | 36,120.56 | 40,817.47 | |
| NP-BM | 47,637.19 | 52,693.09 | 48,254.57 | 32,146.77 | 41,858.16 | 48,255.54 | |
| Ratio | −16.28% | −17.04% | −13.49% | 10.41% | −13.71% | −15.41% | |
| Tie beam | P-SF | 15,069.49 | 15,056.09 | 14,241.88 | 11,597.53 | 12,266.59 | 14,276.41 |
| NP-SF | 5110.90 | 6617.80 | 5676.14 | 6607.25 | 4730.14 | 5784.67 | |
| Ratio | 194.85% | 127.51% | 150.91% | 75.53% | 159.33% | 146.80% | |
| P-BM | 49,622.31 | 47,224.76 | 40,602.63 | 39,667.17 | 41,710.43 | 48,767.46 | |
| NP-BM | 16,989.43 | 34,651.89 | 19,284.19 | 22,532.77 | 15,424.39 | 18,815.00 | |
| Ratio | 192.08% | 36.28% | 110.55% | 76.04% | 170.42% | 159.19% | |
| Auxiliary pier | P-SF | 1846.72 | 1787.68 | 1582.90 | 1053.28 | 1279.40 | 1624.74 |
| NP-SF | 3895.29 | 4497.91 | 4438.73 | 3008.92 | 3221.54 | 3667.43 | |
| Ratio | −52.59% | −60.26% | −64.34% | −64.99% | −60.29% | −55.70% | |
| P-BM | 154,555.07 | 171,933.93 | 150,589.00 | 71,415.64 | 86,874.46 | 155,610.80 | |
| NP-BM | 112,460.89 | 248,338.46 | 129,086.01 | 42,970.71 | 99,640.83 | 112,749.89 | |
| Ratio | 37.43% | −30.77% | 16.66% | 66.20% | −12.81% | 38.01% | |
Publisher’s Note: MDPI stays neutral with regard to jurisdictional claims in published maps and institutional affiliations. |
© 2022 by the authors. Licensee MDPI, Basel, Switzerland. This article is an open access article distributed under the terms and conditions of the Creative Commons Attribution (CC BY) license (https://creativecommons.org/licenses/by/4.0/).
Share and Cite
Zheng, Y.; Wang, J.; Xu, W.; Li, N.; Zhang, W.; Chen, Y. Impact of Near-Fault Ground Motions on Longitudinal Seismic Response of CHRF Bridges. Sustainability 2022, 14, 3591. https://doi.org/10.3390/su14063591
Zheng Y, Wang J, Xu W, Li N, Zhang W, Chen Y. Impact of Near-Fault Ground Motions on Longitudinal Seismic Response of CHRF Bridges. Sustainability. 2022; 14(6):3591. https://doi.org/10.3390/su14063591
Chicago/Turabian StyleZheng, Yongrui, Jin Wang, Weibing Xu, Nana Li, Wenxue Zhang, and Yanjiang Chen. 2022. "Impact of Near-Fault Ground Motions on Longitudinal Seismic Response of CHRF Bridges" Sustainability 14, no. 6: 3591. https://doi.org/10.3390/su14063591
APA StyleZheng, Y., Wang, J., Xu, W., Li, N., Zhang, W., & Chen, Y. (2022). Impact of Near-Fault Ground Motions on Longitudinal Seismic Response of CHRF Bridges. Sustainability, 14(6), 3591. https://doi.org/10.3390/su14063591