Article

Modelling the Relationships among the Key Factors Affecting the Performance of Coal-Fired Thermal Power Plants: Implications for Achieving Clean Energy

by
T. Sivageerthi
1,2,
Bathrinath Sankaranarayanan
1,*,
Syed Mithun Ali
3,* and
Koppiahraj Karuppiah
1
1
Department of Mechanical Engineering, Kalasalingam Academy of Research and Education, Krishnankoil 626126, India
2
TANGEDCO, Tuticorin Thermal Power Station, Harbour Estate, Tuticorin 628004, India
3
Department of Industrial and Production Engineering, Bangladesh University of Engineering and Technology, Dhaka 1000, Bangladesh
*
Authors to whom correspondence should be addressed.
Sustainability 2022, 14(6), 3588; https://doi.org/10.3390/su14063588
Submission received: 26 February 2022 / Revised: 12 March 2022 / Accepted: 14 March 2022 / Published: 18 March 2022
(This article belongs to the Special Issue Sustainable Electric Power Systems: Design, Analysis and Control)

Abstract

:
Most countries depend on coal-fired thermal power plants (CTPPs) to meet energy demands. However, the adverse environmental impacts of CTPPs also remain a major concern. As the energy generations from renewable energy resources are still in the developing stage, reliance on CTPPs is inevitable. Hence, the efficiency of CTPPs has to be improved, while decreasing carbon emissions. This study aims to identify and evaluate the key factors that need to be addressed in improving the performance and minimizing the carbon emission of CTPPs. With the literature review and industrial interaction, twenty-four key factors are identified. Next, an integrated approach of the fuzzy analytic hierarchy process (FAHP) and fuzzy decision-making and trial laboratory (FDEMATEL) is used to evaluate the key factors. FAHP prioritizes the key factors and FDEMATEL reveals the relationship among the key factors. Results indicate air preheater leakage, plugging by ash, high levels of air ingress, air preheater secondary fire, and high levels of corrosion as the top five key factors affecting CTPP performance. Based on the outcome, the study offers some implications that may assist the industrial management in taking timely actions in improving the performance of CTPPs.

1. Introduction

An increase in energy demand is directly proportional to the rise in industrial and developmental activities to improve people’s living conditions [1]. The pace of industrial activities accelerates with the introduction of globalization. Both developing and developed countries are faced with increasing energy demand. Being an active player in globalization, the industrial activities in India reached a great height (and so did the energy demand). As a result, countries started investing more in power plants for energy generation. However, most power plants are operated using non-renewable energy resources, mainly coal. As a result, an acute resource scarcity occurred [2]. Resource scarcity and disadvantages, such as the adverse environmental impact of fossil fuels, has led to the search for renewable energy resources [3]. The role of energy is very crucial in the sustainable development of the country. Hence, to meet the energy demand and lower the environmental burden caused by conventional fossil fuels, the search for renewable resources intensifies. Further, the need to meet the sustainable development goals (SDGs), a set of seventeen goals proposed by the United Nations (UN) covering the overall wellness of humankind, which forced the nations to identify and invest more in renewable energy resources [4].
In response to the request of the UN, research communities and the industrial managements of all countries streamlined their business, with the intent to identify renewable energy resources that meet the energy demand and are harmless to the environment [5]. By changing from non-renewable to renewable energy resources, it is possible to reduce the carbon footprints [6]. Bearing this positive impact in mind, the global nations amplified the search and development of renewable energy resources. As a result, the number of possible sources (e.g., tidal, solar, and wind) of energy generation were identified, and enhancements were carried on in [7]. However, these alternatives came with several shortcomings. For instance, energy generation from solar power plants is non-reliable. The energy generation is based on the quality of sunlight received, which is non-uniform throughout the year and differs from place to place [8]. Likewise, every renewable energy resource alternative has its limitations. However, by varying the above facts, with only environment preservation and sustainable performance in mind, increasing investment is being made on sustainable renewable energy resources [9].
Another energy resource that the research community relied on is nuclear energy. The search for clean energy results in nuclear energy, and it is regarded as the low-carbon energy resource behind hydropower [10]. Besides low-carbon emission, the wastes generated by the nuclear power plant are also low. Moreover, the power generating capacity of the nuclear power plant is also higher than other renewable energy resources [11]. Although the nuclear power plant largely benefits society, it has some serious shortcomings. The radiation from the nuclear power plant poses a health threat to the people, and it depends on the non-renewable material, i.e., uranium. The raw material that nuclear power plants depend on is available only in a limited quantity [12]. Further, the construction and maintenance cost of the nuclear power plant is also high. Hence, reliance on the nuclear power plant is unrealistic.
It must be realized that the complete dependence on renewable energy resources will not meet the ever-raising energy demand. Additionally, it is hard to refute the need for sustainable renewable energy resources [13]. When it is possible to develop a new system for energy generation, the same is applicable for enhancing the existing systems. Most countries, especially developing countries, depend on coal for energy generation [14]. Additionally, among the existing energy generation system, the coal-fired thermal power plants (CTPPs) are widely criticized for their adverse environmental impact, such as fly ash and carbon emissions [15]. The question arises here: why can the performance efficiency of the CTPPS not be improved with technological progress, while reducing carbon emission. It has to be understood that renewable energy resources are still in developing stages, and it takes time to become completely reliable. The same was underscored by Maradin [16], in a study that states that renewable energy resources are not still the predominant energy resources. However, they contribute to energy demand to some extent. It has also been estimated that the global energy consumption from renewable energy resources is above 20% and expected to increase in the future. So, as far as we are concerned, compared to reliance on renewable energy resources, it is now necessary to improve the efficiency of the thermal power plants that are dependent on conventional energy resources.
From the above information, it is clear that the amount of energy generated using renewable energy resources is insufficient in meeting the energy demands. At the same time, it is difficult to rule out the role of renewable energy resources, in terms of SDGs. However, the existing sources of energy generations can be improved by enhancing the performance efficiency and reducing carbon emission. Moreover, developing countries account for a large share of carbon emissions. So, there is a need to minimize the carbon emission from the CTPPs located in developing countries.
Given the importance of enhancing the performance of CTPPs, this study addresses the critical research gaps in the literature. First, it lists key factors known to affect the functioning of CTPPs via literature review and interviews with industrial management. Second, the key factors are prioritized using the fuzzy analytic hierarchy process (FAHP) and relationships are revealed using the fuzzy decision-making trial and evaluation laboratory (FDEMATEL). This study aims to identify and evaluate the key factors that affect the CTPP in India, as India’s energy demand CTPPs meet nearly 60%. Finally, this study would like to answer the following research questions:
  • What are the key factors that need to be addressed in improving the performance of CTPPs?
  • How to prioritize the key factors in improving the CTPPs performance?
  • How to reveal the relationship among the identified key factors in improving the CTPPs performance?
The purpose of this study is to prioritize and picture the relationship among the key factors affecting the performance of CTPPs using the multi-criteria decision-making (MCDM) technique. Here, FAHP and FDEMATEL are used to answer the above research questions. The AHP method, developed by Saaty [17], is used to prioritize the key factors, while DEMATEL, developed by Gabus and Fontela [18], is used to reveal the relationship among the key factors. The prioritization and interrelationship of key factors helps the industrial management in taking proactive and appropriate actions in improving the performance of CTPPs.
The remainder of the paper is pursued in the following manner: Section 2 illustrates the role of CTPPs in meeting the energy demands, as well as the adverse environmental impacts needed for SDGs. The research methodology used in this study is explained in Section 3. The application of the research methodology in evaluating the key factors is given in Section 4. The outcome of the research methodology applied is discussed thoroughly in Section 5. Conclusions and Policy Implications of the study are provided in Section 6.

2. Literature Review

This section provides an overview of the role of the CTPPs and their adverse environmental impact, which necessitated the transition towards SDGs, particularly SDG 7 (affordable and clean energy) and SDG 13 (climate action). Finally, the research gap identified, and the contribution of this study is provided.

2.1. Role of Coal Based Thermal Power in Meeting Energy Demands

Rapid industrialization and developmental activities have enormously increased the energy demand in India and other countries. According to the International Energy Agency (IEA), India is the third-largest energy-consuming county, and its energy demand is expected to increase exponentially in the coming years [19]. In meeting the energy demands, the global nations generate energy from coal, nuclear, diesel, solar, wind, and tidal sources. According to Rawat and Yadav [20], India has 155 CTPPs with a capacity of 157,377.00 MW. India’s current energy demands are met by coal (69%), hydro (14%), natural gas (10%), oil (4%), nuclear (2%), and renewable (1%) resources [21]. Other than India, countries such as China, Bangladesh, and many others are also largely (nearly up to 50%) dependent on CTPPs to meet domestic needs [22]. As a result, the global demand for coal is expected to rise by 2.6% in the coming years [23]. From this information, it is apparent that the role of CTPPs is crucial in meeting the energy demands of the countries. Though the CTPPs play a substantial role in meeting the energy demand, they seriously negatively impact the environment. Carbon and fly ash emission by the CTPPs impacts both the environment and humans [24,25]. So, the CTPPs offer both benefits and hazards. In addition to the industrial and transportation sector, the CTPPs also faced many challenges in mitigating the adverse environmental impact. Realizing the need to curb the CO2 emission and lower the global warming effect, the United Nations (UN) has called all the member nations to take the required actions to lower carbon emissions. Regarding this, the UN proposed a set of seventeen goals, together called the sustainable development goals (SDGs), and appealed to the nations to work in attaining the goals [26]. Similarly, the recently concluded Paris Agreement also insisted that the global nations transform towards sustainable energy, bearing the agenda of lowering carbon emissions and temperature. It is difficult for India and other countries to completely adhere to the Paris Agreement, which insists on a complete transition to sustainable renewable sources for energy, while the demand is huge. However, it is possible to optimize the functioning of CTPPs by lowering carbon and another particulate emission.

2.2. Need of Improving CTPPs and SDGs

As per the Paris Conference (2015), the global nations have agreed to reduce global warming by below 2 °C and, subsequently, to 1.5 °C [27]. To act according to the Paris Agreement, global nations are working tirelessly to find sustainable renewable energy sources. However, it must be realized that it would be difficult to meet the demand [28]. Hence, by improving the functioning of CTPPs or other conventional energy resources, it is possible to reduce carbon emissions and increase output efficiency. According to Malik and Tewari [29], frequent inspection and required maintenance of the condenser, boiler feed pump, and deaerator will enrich the overall performance of the power plants. It was also stated that it is possible to avoid breakdown by doing proper maintenance and reducing carbon emissions. A similar study by Jović et al. [30] emphasizes that, by improving the cooling tower system, the overall energy efficiency of the thermal power plants can be improved by 1.5%. The quality of the coal consumed and equipment used in the energy generation largely determines the output efficiency of thermal power plants [31]. It was highlighted by Li et al. [32] that improving the thermodynamic cycle can enhance the power plant’s efficiency by 50.2%. Advanced ultra-supercritical (USC) technology has been suggested as the best technology to mitigate carbon emission from the CTPPs [33]. Geete [34] recommended the use of smooth inner surfaces to extract the fly ash deposited in the linings. The timely removal of fly ash increases the incoming and outgoing air, thus improving the boiler’s performance. Hence, most of the research on the CTPPs recommends and explores improving the performances. Further, the CTPPs act as the main source of energy generation in many countries, so it is difficult to shut down completely. Only the efficiency of the thermal power plants can be improved while reducing carbon emissions. Further, most of the SDGs are mainly focused on environmental issues. In this regard, improving the CTPPs may help the nations in meeting the number of SDGs. When CTPPs are considered, with improvement, it is possible to meet SDG 7 (affordable and clean energy) and SDG 13 (climate action). By doing so, the energy demand is fulfilled, and the SDGs are also attained.

2.3. Research Gaps and Contributions

To counter the scarcity of non-renewable resources and mitigate the adverse environmental impact, the research communities are focusing on identifying renewable resources for energy generation. Additionally, some research studies claim that it is possible to meet the energy demands with renewable energy resources [35,36]. At the same time, some studies turn down the observations of earlier studies. In line with the arguments, some of the studies explored the possibilities of enhancing the boiler’s performance, while minimizing carbon emissions [33,34]. From the above information, it is clearer that the total reliance on renewable resources will not meet the energy demands. Hence, a mix of renewable and non-renewable resources is suggested. Although some studies focused on improving the boiler’s performance, no studies are dealing with identifying the factors affecting the boiler’s performance. Listing the factors affecting the performance of boilers may act as a guide in improving the boiler’s performance. To fill this existing research gap in the literature, this study identifies the factors affecting the boiler’s performance. The following are the significant contributions of this study:
A list of key factors affecting the performance of the boilers is identified by combining the literature review process and expert interaction.
The key factors are prioritized using the FAHP technique, as the prioritization of factors helps in sequentially addressing the factors.
The relationships between the factors are revealed using FDEMATEL, categorizing factors into cause-and-effect groups.
The next section explains the steps involved in FAHP and FDEMATEL.

3. Methodology and Data

This section explains the steps involved in the integrated MCDM approach, comprising of fuzzy AHP (FAHP) and fuzzy DEMATEL (FDEMATEL).

3.1. Fuzzy Analytic Hierarchy Process (FAHP)

The analytic hierarchy process, developed by Saaty [17], is the most widely used multi-criteria decision-making (MCDM) method. AHP handles both quantitative and qualitative data, which are converted into numbers. In AHP, pairwise comparisons between the criteria/alternatives are made to evaluate and determine the significance of one criterion over the other. Pairwise comparisons are made using an absolute judgment scale that represents the prominence of one criterion over the other. Most of the time, while making pairwise comparisons, the decision-makers face the problem of uncertainty and difficulty in giving precision ratings. To overcome this uncertainty and fuzziness in decision-making, the concept of fuzzy set theory was developed by Zadeh [37]. Generally, in the AHP approach, crisp values (scale) are used to make pairwise comparisons. However, these crisp values fail to provide the option of clearing, making pairwise comparison. To solve the problem related to uncertainty and clearness in expressing the opinion, fuzzy set theory is being incorporated with the decision-making methods. Various studies, such as risk assessment [38], sustainability issues [39], and aircraft selection [40], have been carried out using FAHP. So, in this study, the FAHP method is used. Here, the extent analysis method, developed by Chang [41], is preferred. The extent analysis method is preferred for its robustness and the simplicity of calculations. The triangular fuzzy numbers (TFNs) used in this study are given in Table 1.
The following are the steps involved in FAHP using extent analysis method:
Consider a triangular fuzzy number F ^ = ( l , m , u ) , with the following membership function:
μ f ( X ) = X l m l l X m u X u m m X u 0 O t h e r w i s e
Some of the operational laws of the two triangular numbers F ^ 1 and F ^ 2 are as follows:
F ^ 1 + F ^ 2 = ( l 1 + l 2 , m 1 + m 2 , u 1 + u 2 )
F ^ 1 F ^ 2 = ( l 1 l 2 , m 1 m 2 , u 1 u 2 )
F ^ = 1 u 1 , 1 m 1 , 1 l 1
Step 1: Construct pairwise comparison matrix.
Make pairwise comparison between the criteria under consideration, as shown below:
F ^ = F ^ 11 F ^ 1 n F ^ m 1 F ^ m n
F ^ i j = ( l i j , m i j , u i j )
F ^ j i = F ^ i j 1 = ( u i j 1 , m i j 1 , l i j 1 )
Step 2: Consistency check.
Once the pairwise comparison is made, the consistency has to be checked. For verifying the consistency of the pairwise matrix, the fuzzy numbers are converted into crisp numbers using defuzzification Equation (8).
F 11 = l 11 + m 11 + u 11 3
The result of the defuzzied crisp matrix is:
F = F 11 F 1 n F m 1 F m n
To check the consistency of the pairwise comparison matrix, consistency index (CI), λ max , and W has to be calculated using the following equations.
W = W 1 W 2 W n and   W i = i = 1 n α i j n
W = F W = W 1 W 2 W n
λ max = 1 n W 1 W 1 + W 2 W 2 + + W n W n
C o n s i s t e n c y I n d e x ( C I ) = λ max n n 1
C o n s i s t e n c y R a t i o ( C R ) = C I R I ( R a n d o m I n d e x )
Step 3: Weight calculation.
The weights of the criteria under consideration are calculated using the following equations:
α j = j = 1 n l i j 1 / n
β j = j = 1 n m i j 1 / n
χ j = j = 1 n u i j 1 / n
Fuzzy weights are computed as:
w ^ j = ( α j χ 1 , β j α 1 , χ j β 1 )
Wight vector w is computed as:
W = ( w 1 , w 2 , , w n )

3.2. Fuzzy DEMATEL

The DEMATEL method was introduced by Gabus and Fontela [18] in the Geneva Research Centre. It is the method that focuses on developing and building relationships among the criteria under consideration. In DEMATEL, the criteria after evaluation are categorized under the cause-and-effect group. Hence, it is based on the digraph model. Digraphs are useful in representing the contextual interrelationship among the criteria under consideration. Making a decision under uncertainty has been a problem for the decision-makers. Hence, to overcome the difficulty, the fuzzy set theory is being incorporated with the DEMATEL and used as fuzzy DEMATEL (FDEMATEL). Since uncovering the relationship among the factors is crucial, many of the earlier studies have been carried out using FDEMATEL. In studies such as sustainable supplier selection [43], evaluation of barriers to the blockchain [44], and critical factors to cloud computing [45], FDEMATEL has been used.
The following are the steps involved in FDEMATEL:
Step 1: Establishment of initial direct relationship matrix ( F ^ ) .
Step 2: Construct normalized direct relationship matrix ( S ^ ) using Equations (20) and (21).
K = 1 max 1 i n j = 1 n f i j
S ^ = K ^ × F ^
Step 3: Formation of total-relationship matrix ( M ^ ) using Equation (22).
M ^ = S ^ ( I S ^ )
where I is identity matrix.
Step 4: Sum of rows ( R ) and columns ( C ) .
R = j = 1 n m i j n × 1
C = i = 1 n m i j 1 × n
A digraph representing cause and effect group is drawn using the dataset of ( R + C ) and ( R C ) .
Prioritizing and revealing the relationship among the factors affecting air preheater performance has been of prime importance. Hence, in this study, an integrated approach of FAHP and FDEMATEL is used. The application of the integrated approach is explained briefly in the next section.

4. Application of FAHP-FDEMATEL in Evaluating the Factors Affecting CTPPs

Though, to address the issues concerned with CO2, the transition towards dependence on renewable energy sources is inevitable; the complete transition seems impossible. Various factors act as impendence to the transition towards renewable energy sources, for instance, when solar power is considered; first, it is not possible to receive the optimum level of required energy, and receiving sunlight throughout the year is not possible. Apart from this natural impendence, the high initial setup and maintenance costs, technological void, and feasibility keep the transition towards renewable energy sources an uphill task. In addition to extending support to this fact, a study by Ghimire and Kim [46] in analyzing the barriers to renewable energy development in Nepal, identified problems at the economic and policy levels as the major hindrance in the transition. These barriers are not only limited to developing economics; even in developed economies, such as Australia, the situation remains the same [47]. The deployment of other renewable energy sources, such as wind energy, hydro energy, and tidal energy, are also in the same situation [48]. Additionally, it should be sensed that it is impossible to meet all the needs of renewable energy sources. Hence, a blend of conventional and renewable energy sources should also be used to meet the energy demand and SDGs [49]. The necessity of moving towards renewable energy resources arises only due to a series of concerns regarding conventional energy sources, especially coal-based energy production. The major concern with coal-based energy production is CO2 emission and poor performance efficiency. Many factors affect the performance of the CTPPs, which results in poor performance efficiency and high CO2 emission. Taking this into consideration, this study attempts to identify various factors that reduce the performance efficiency of thermal power plants with increased CO
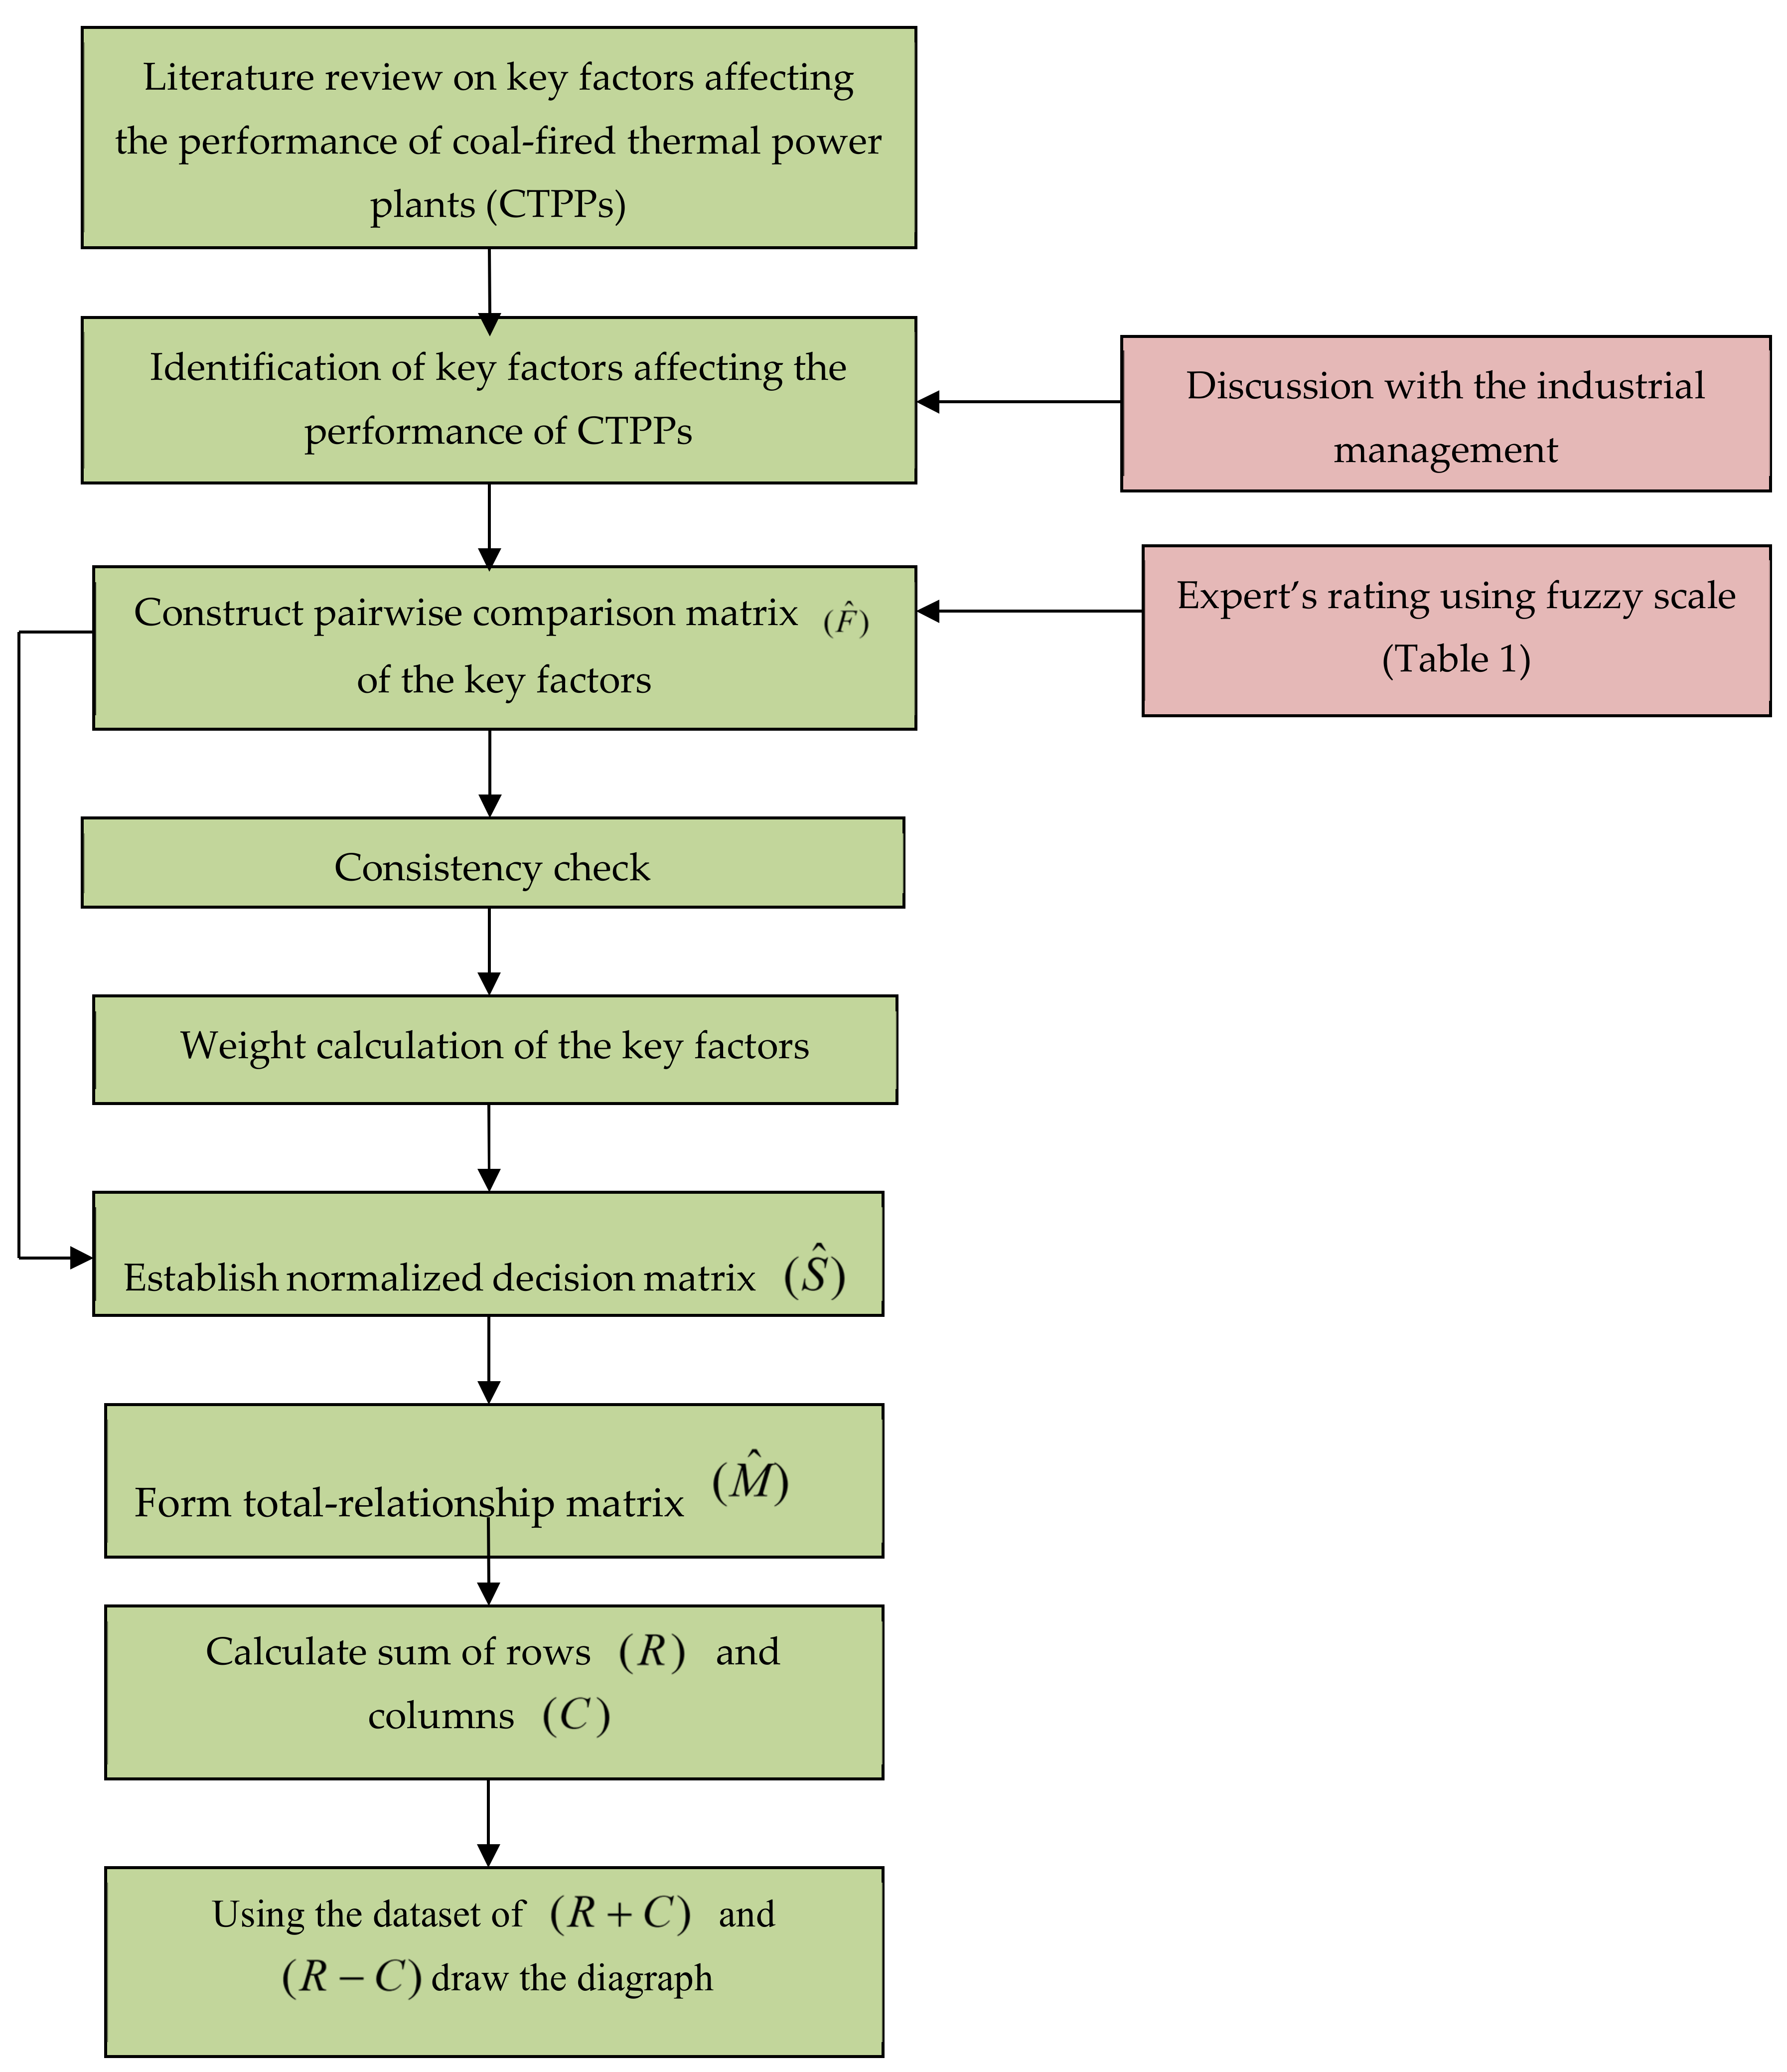
2 emission. Next, an integrated approach of FAHP and FDEMATEL is used to prioritize and uncover the relationship between the factors affecting the thermal power plant’s performance. The application of FAHP and FDEMATEL in evaluating the factors is shown in Figure 1 and explained as follows:
The first phase of the study focuses on identifying and collecting the list of factors affecting the performance of the CTPPs. To identify the factors affecting the performance of the CTPPs, a review of the existing literature was carried out. The literature for review was collected from well-established science databases, such as GoogleScholar, EBSCO, Web of Science, and Scopus. The following keywords, with Boolean operators, were used for collecting the literature: coal-fired thermal power plants AND barriers, challenges AND coal-fired thermal power plants, underperformance AND coal-fired thermal power plants. While literature collection, some inclusion and exclusion criteria were followed. The inclusion criteria include publication in the English language, published in Scopus; indexed journal and core work focuses on problems with the CTPPs. The exclusion criteria include conference proceedings, doctoral thesis, and project work. Through literature review, a total of twenty factors affecting the performance of CTPPs were collected. However, the problem associated with a real-time problem keeps emerging, and it is necessary to listen to the voices of the people who are directly associated with the problems. Hence, interaction with the people working in the CTPPs is made. In this study, the case thermal power plant considered was located in Tuticorin, India. For this study, a visit was made to the thermal power plant for the of two months from July 2021–August 2021. Twenty factors affecting the CTPP’s performance, collected via a literature review, was discussed with them. In addition to the twenty factors, the workers of CTPPs also suggested four factors. Thus, the total number of factors affecting the CTPPs performance that were collected for this study is twenty-four, as shown in Table 2.
Next, after collecting the factors affecting the CTPPs performance, the factors are evaluated, in order to prioritize and reveal their relationship. An expert panel, comprising of seven experts, was formed for evaluating the factors. The size of the panel is acceptable, in comparison with earlier studies. In addition, these seven experts that were approached to evaluate the factors have substantial knowledge and experience on the functioning of the CTPPs. The profile of the experts is given in Table 3.
Fuzzy linguistic scale (Table A1 of Appendix A) along with a questionnaire (Table A2 of Appendix A), consisting of the twenty-four factors, was given to each expert. The experts were asked to make pairwise comparison between the factors using Table 1. The questionnaire was circulated among the experts via email. Frequent reminders were given; upon receiving the experts’ ratings, the average was considered for further evaluation. The average of the pairwise comparison made by the experts is given in Table 4. The ratings provided by the experts are transformed into fuzzy numbers. Then, using Equation (8), the fuzzy numbers are converted into crisp numbers. Next, using Equations (10)–(14), the consistency ratio (CR) is calculated. As the CR value calculated is 0.056, which meets the satisfactory criteria [56], the factors are eligible for further evaluation. Finally, using Equations (15)–(19), the weight of the importance of the factors is calculated. The weights of the factors are given in Table 5.
After calculating the weight of the factors, the relationship among them was calculated using FDEMATEL. The first step in the FDEMATEL is the formation of pairwise comparison matrix. Since a pairwise comparison between the factors is already made in FAHP method, the same pairwise comparison matrix is used in FDEMATEL. Then, using Equations (20) and (21), the normalized decision matrix ( S ^ ) (Table A3 of Appendix B) is formed. The normalized matrix is converted in the crisp matrix using Equation (8). Next, using Equation (22), a total-relation matrix ( M ^ ) (Table A4 of Appendix B) is constructed. Using Equations (23) and (24), the sum of the rows ( R ) and columns ( C ) is calculated. With this, the dataset for ( R + C ) and ( R C ) 
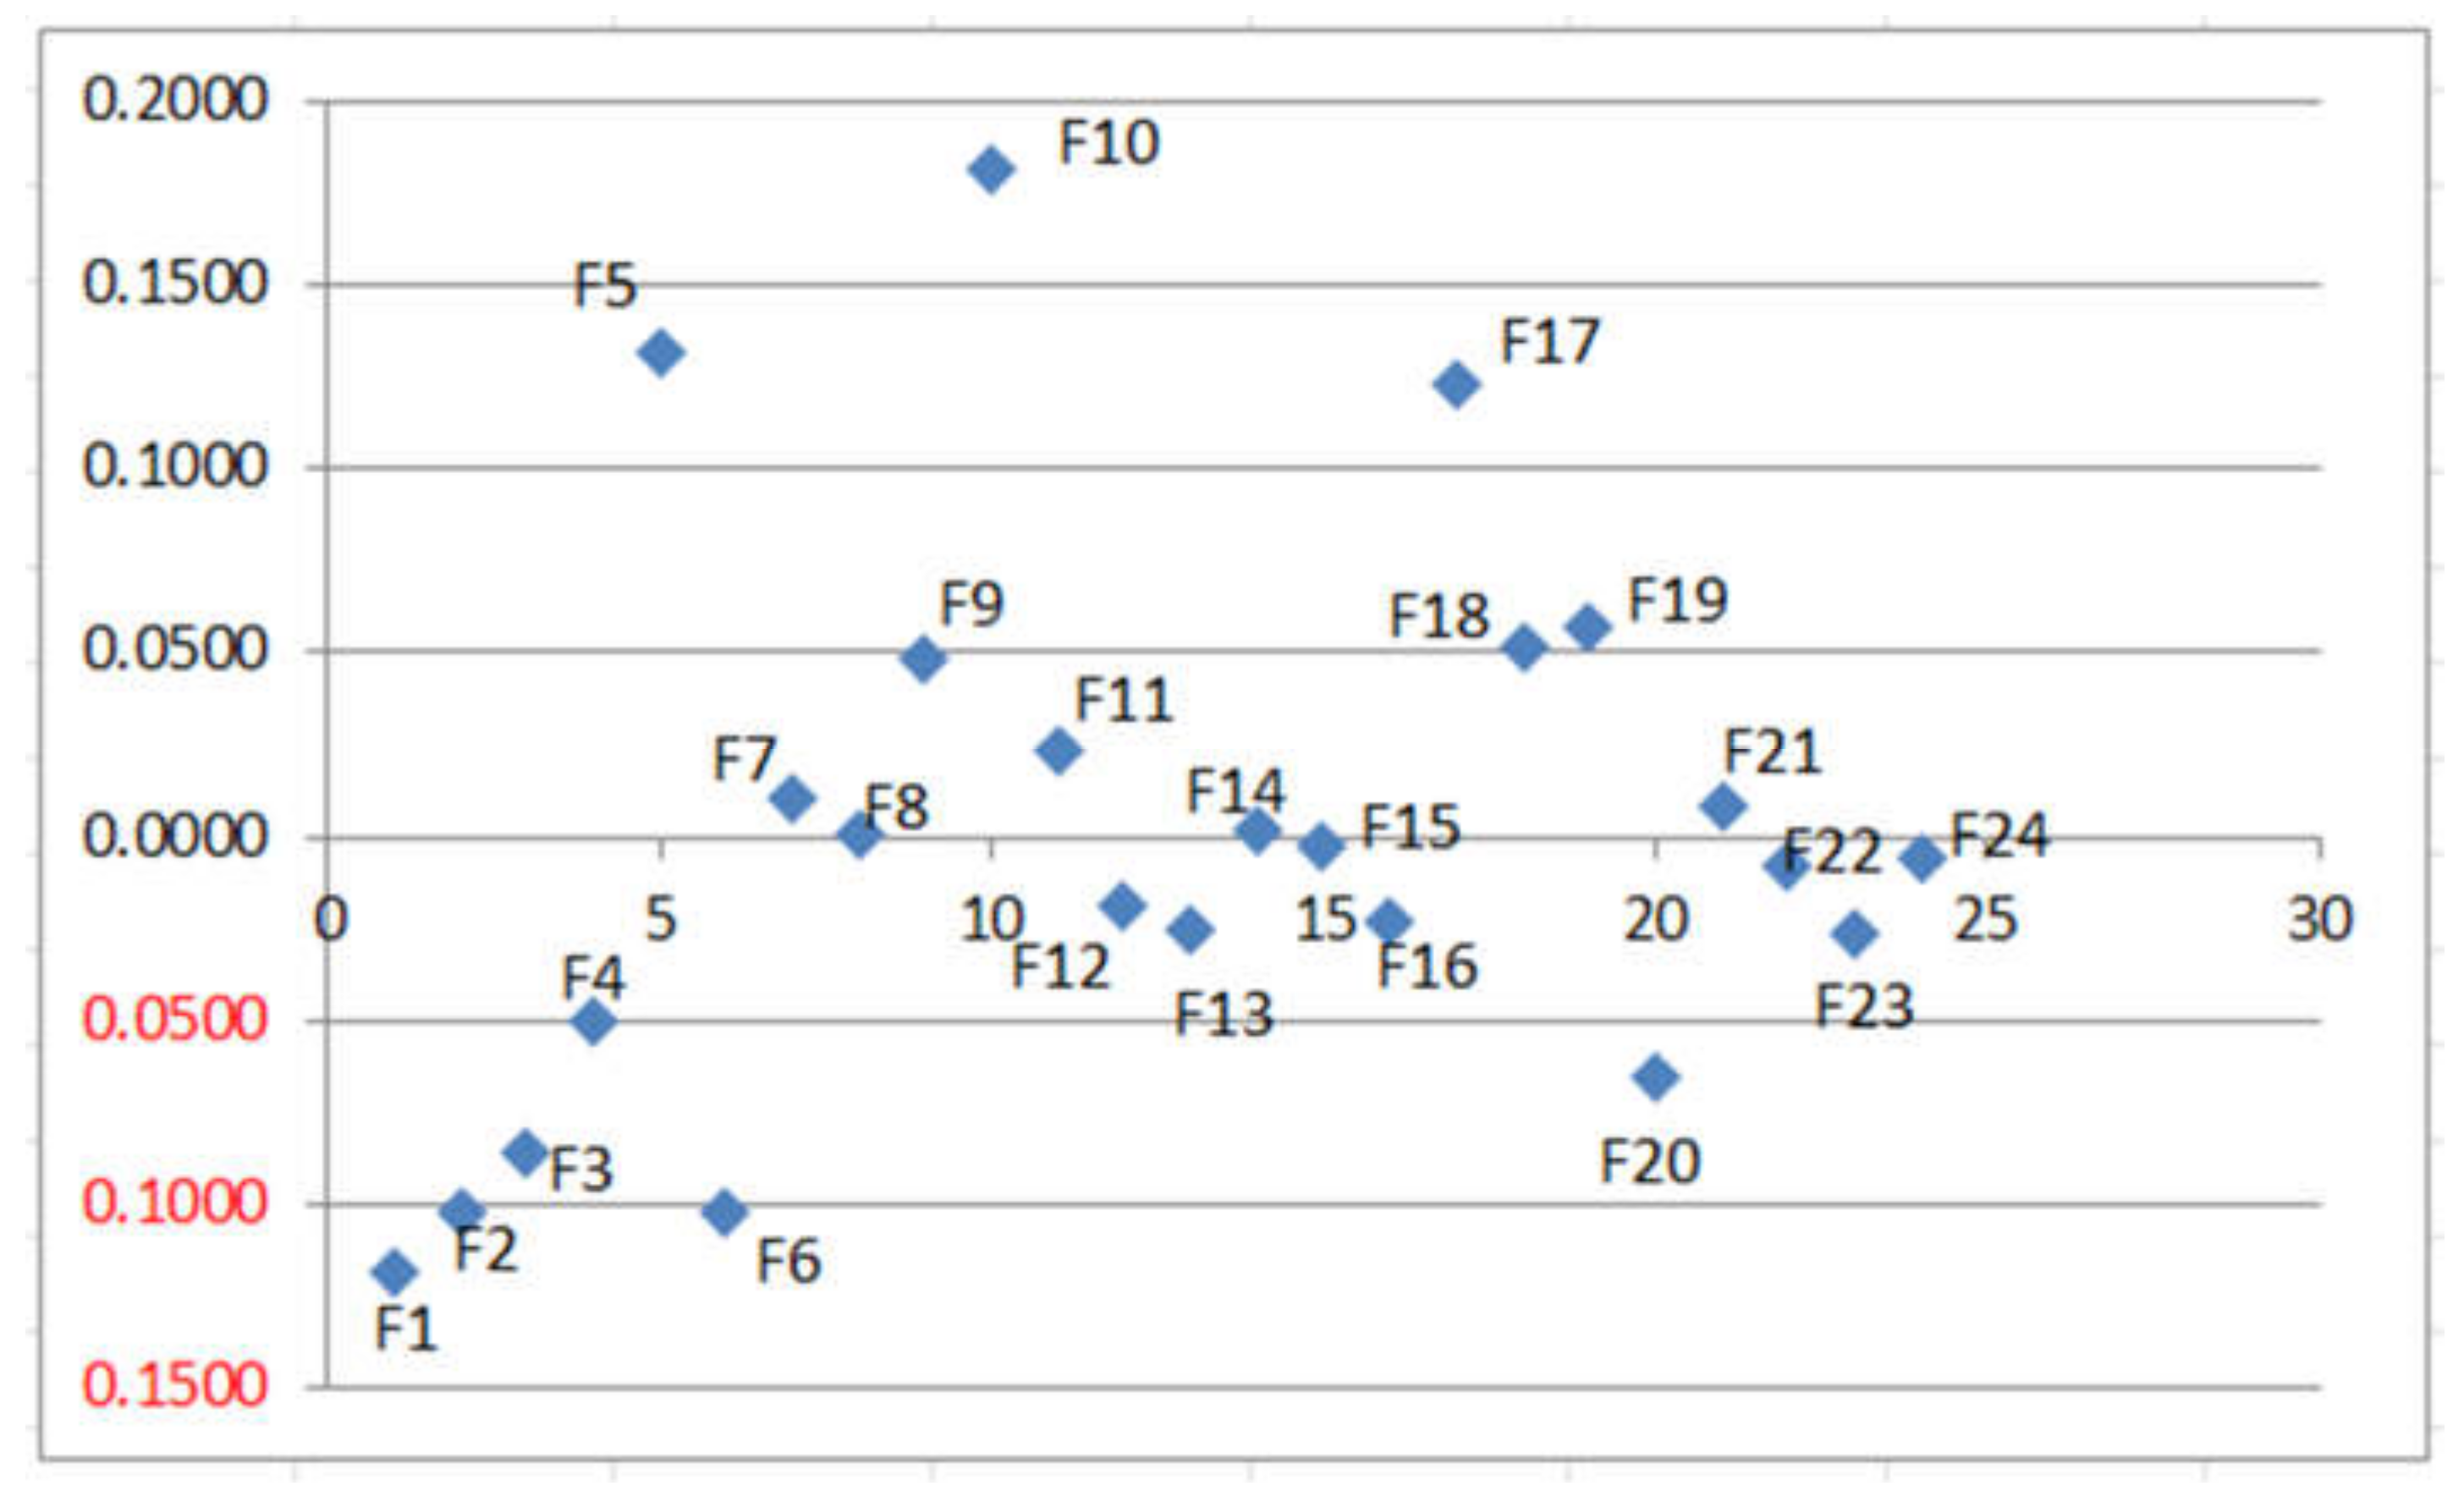
is estimated, and a diagraph is graphed (Figure 2). Based on ( R + C ) and ( R C ) values, the factors are grouped into cause and effect categories, as shown in Table 6.

5. Result and Discussion

In this section, the results obtained using FAHP and FDEMATEL are discussed. In FAHP, the factors are ranked based on the weight of the importance of the factors. In FDEMATEL, the factors are categorized into cause and effect groups, based on the ( R C ) values. According to weight of the importance, the factors are ranked, as shown in Table. Based on the ( R C ) values given in the table, the factors affecting the air preheater performance are categorized under two groups: cause and effect. Here, eleven factors are coming under the cause group, while thirteen factors are coming under the effect group. The factors coming under the cause group deserves more attention, as the influential power ( R ) of these factors is higher than the influenced power ( C ) . When the ( R C ) value is higher, the higher the impact [57]. Since the ( R C ) value of the effect factors is negative, there is a chance of being highly influenced by the cause factors.

5.1. Cause Factors

According to ( R C ) value, the factors under the cause group are ranked as follows: F10 > F5 > F17 > F19 > F18 > F9 > F11 > F7 > F21 > F14 > F8. Among all the cause factors, air preheater leakage (F10) has the highest ( R C ) value, and it denotes its influential power. This factor also secured the top position in the FAHP results. In tri-sector air preheaters, the primary and secondary air path pressure is much higher than the flue gas flow path. Due to the improper seal setting or heavy wear in axial, radial, and circumferential seals, the large quantities of high-pressure air enter the low-pressure flue gas path and dilute the high-temperature flue gas coming from the boiler house [58]. Due to the reduced differential temperature, the heat transfer will be affected and, thus, reduce the air preheater efficiency. In addition to this, due to the leakages, a huge volume of air is added into the flue gas, increasing the normal flue gas flow rate. So, it increases the primary, secondary, and induced draft air fan load, increasing the plant auxiliaries’ consumption. This finding was supported by the study of Chen et al. [55], which indicates that air preheater leakage affects heat transfer efficiency on energy conversion.
The next important factor is high air ingress level (F5) in both the FAHP and FDEMATEL results. An increase in the level of air ingress happens due to heavy erosion of boiler walls and flue gas ducts of the boiler. This ingress air dilutes the flue gas and reduces the flue gas inlet temperature at air preheater inlet. Due to the reduced differential temperature between the hot and cold medium, the rate of heat transfer gets affected and reduces the performance of the air preheater. Akpan and Fuls [51] embarked that the air ingress has close link with the power plants operating efficiency. The third important factor in FAHP and FDEMATEL is plugging by ash (F17). A study by Wang et al. [52] opinioned that plugging by ash largely influences the boiler performance. Now-a-days 100% fly ash collections are carried out, due to stringent environmental laws enforcements. All ash coming out from the boiler is collected through upstream flue gas and passes through the narrow passages of the air preheater to the heating elements. If the flue gas temperature is reduced, high moisture present in ash will be plugged into the narrow passages. It restricts the flue gas and air flow and affects the air preheater performance. If it is not cleared then and there, it permanently pluggs and increases the differential pressure across air preheater, and no heat transfer will take place in that plugged portion.
The high level of ash fouling (F16) is the important cause factor. This finding was supported by the Anitha Kumari and Srinivasan [54] study, which insists that ash fouling is an important challenge to be encountered in enhancing boiler performance. It causes the formation of fine ash layer deposition over the surfaces of heating elements. It purely depends upon the material surface porosities and fineness of ash. Since the ash is a poor thermal conductor, it reduces the heat transfer. Periodical suit blowing will help to remove the fouling. Next, high moisture content in coal (F4) is the important cause factor. It needs more tempering air to control the mill hot air temperature. The air preheater bypasses the air. Due to air bypass, the flue gas outlet temperature of the air preheater will increase. The increased flue gas outlet temperature is the mark of poor heat transfer. A large quantity of heat flow through flue gas is sent to the atmosphere without full use. This leads to a reduction the boiler efficiency. In addition, it increases auxiliary’s consumption, due to the increased volume of flue gas. Soot blowing is highly recommended for ensuring the free flow of mediums, such as air and flue gas, through the air preheater. Need-based soot blowing is better than periodical soot blowing. Poor soot blowing even sometimes leads to tripping of the whole unit.
Other factors, such as profile of heating elements (F11), increase the retention time of flue gas in the heating element, as well as the area of conduct, but the very narrow, complicated profile leads to air preheater chocking. Poor maintenance practice (F9) creates leakages, chocking, and air ingress. The factor air preheater secondary fire (F19) is due to the burning of unburned heavy oil, deposited in air preheater heating elements. It produces a hot zone, uneven expansion of the rotor, and damages the air preheater heating elements. Correct firing viscosity is 15 to 20 cst at the burner tip and correct oil temperature, corresponding to this viscosity, needs to be maintained. High level of corrosion (F18) can be avoided by best operating process. More number of mills in service (F8) increases the mass flow rate of flue gas and develops ash chocking inside the heating elements, as well as more erosion. Increase in tempering air (F14) bypasses the air preheaters in boiler, thus reducing the heat recovery from the flue gases leaving the boiler. This increases the boiler exit gas temperature, which, in turn, increases the dry gas loss in the boiler. APH motor failures for only the rotary type leads to uneven expansion and jamming of the rotor, as well as air preheater firing, which are all very important factors.

5.2. Effect Factors

According to ( R C ) value, the factors coming under effect category are ranked as follows: F15 > F24 > F22 > F12 > F16 > F13 > F23 > F4 > F20 > F3 > F2 > F6 > F1. Air preheater element erosion (F15) is important factor in the effect group. The erosion of the air preheater elements results in a loss of boiler efficiency [50]. The flue gas contains coal ash and abrasive-like sands. This will erode the air preheater heating element basket, rotor structure, and diaphragm plate. Erosion of the heating element basket reduces the heat-storing material volume and heat transfer. Damage to the rotor structure leads to rotor stoppage and unit outage. Erosion of the diaphragm plate seals each sector and avoids inter-sector passing, leading to mixing primary, secondary, and flue gas. It greatly affects the draft system and reduces the ID fan margin; the unit cannot be loaded to full capacity. Next, low feed water temperature at boiler inlet (F24), the second critical effect factor, needs more sensible heat in the boiler, so the flue gas inlet temperature to the air preheater will reduce. Hence, the primary and secondary air temperatures are reduced, thus increasing the coal flow rate. It directly increases the working capital. The causes low feedwater temperature at the boiler inlet may be due to regenerative heaters bypassing.
The third important factor is improper water washing (F22). The purpose of water washing is to clean the air preheater, in order to remove the permanent chocks that are not cleared in online suite blowing. This also cleans the fouling of the ash layer upon the heating element surface, thus improving heat transfer. Whenever the opportunity arises, water washing of air preheater internals will improve the performance. It ensures the original full quantity of heat transfer and improves the boiler efficiency. Heating element materials selection (F12), the fourth important effect factor, plays an important role in air preheater performance and decides the quantity of heat energy stored by its property-specific heat capacity. A study by Hasnain et al. [53] emphasizes that the material selection largely influences boiler efficiency. Mostly carbon steel is used for the hot-end and intermediate heating elements. Corten steel is used for making cold end heating elements. Advances in metrological engineering, with the view of increasing the specific heat capacity of the material, will help us improve the performance further.
Similarly, boiler operation with high overload (F23) increases the mass flow rates and reduces flue gas inlet temperature. PA/SA ratio (F2) is the ratio between the primary air and secondary air. These increased primary and secondary air ratios require lower mill inlet temperature and, thus, more tempering air. Malfunctioning of oil burners (F20) leads to carrying unburnt oil deposits in heating elements and increasing risk for air preheater firing. Pressure drop across air preheater (F13) is the indicator for heating element chocking, and the optimized on line suite blower helps to reduce the pressure across the air preheater. Upstream ash evacuation (F6) is hundred percent ash evacuations through flue gas, leads to more ash flow through the air preheater. It will creates chocking, more chances for heating element corrosion and air ingress in flue gas path.

6. Conclusions and Policy Implications

Obviously, the overdependence on non-renewable resources like coal for energy production has led to resource scarcity and negative environmental impact. Such consequences have necessitated the need to search for renewable resources. However, with the present technological capability and level of energy produced using renewable energy resources, it is difficult to meet the global energy demand. Hence, it is advisable to use the blend of energy obtained from renewable and non-renewable energy resources to meet the energy demand. Regarding this, there is a need to optimize the existing energy generation process that rely on non-renewable energy resources. To meet this need, this study aims to identify and evaluate the factors that affect the performance of CTPPs. Since it is a real-world industrial problem, meeting with experts was also carried out for collecting factors and literature review. Then, an integrated approach of FAHP and FDEMATEL is used to evaluate the factors. Outcomes of FAHP indicate air preheater leakage, high air ingress level, plugging by ash, air preheater secondary fire, and high level of corrosion as the top five critical factors that affect the performance of CTPP. FDEMATEL results categorize eleven factors under the cause category and thirteen factors under the effect category. The following are the important factors coming under the cause category (air preheater leakage, high air ingress level, and plugging by ash) and are of significant importance.
Based on the outcomes, this study offers some managerial implications that could help CTPP management improve performance of thermal power plant. Ash plugging blocks the heating elements and forces the flue gas flow. Hence, water washing the heating elements, during boiler shutdown, when the gas inlet side temperature is around 100 °C, and proper drying of heating elements after water washing has to be done. Additionally, there is a need to ensure complete cleaning of heating elements, whenever water washing is done. Otherwise, the left-out ash would form into hardened cement and become difficult to remove. The small stones present in coal are crushed and travel through the pulverized coal. These high-velocity sand particles act as sandblasting and erode the internal surface of the boiler. These particles hit the heating elements and damage the hot-end heating elements. This erosion can be solved by removing the stones before the crusher house, using trash screen arrangements or manual stone picking. Well-planned scheduled maintenance practices reduce the breakdowns. The different works to be carried out and all necessary spares required for the maintenance work must be kept ready before overhauling. With proper maintenance practice, the quality of work can be ensured. All the works, and their duration, are first listed out and a maintenance schedule has to be prepared and executed as per the plan. Mostly, the maintenance schedule can be prepared based on the recommendations of the maintenance manual. The deviation in this schedule will cause the performance deterioration of equipment and continues deviation, leading to major replacement of the equipment.
This study offers some notable contributions to the literature. First, this study provides more insight, regarding the need for optimizing the existing energy sources. Studies by Bertheau [35] and Swain and Karimu [36] investigated the impact of renewable energy resources in local development and SDGs. Another study by Büyüközkan et al. [59] examined the possibility of selecting the optimal renewable energy model in attaining SDGs. With renewable energy resources, it is possible to lower the adverse environmental impacts caused by conventional energy resources. However, it will not suffice the global energy demand. So, energy production, using conventional energy resources, need to be optimized by minimizing carbon emission. Therefore, only a combination of conventional and renewable energy resources will be beneficial in meeting SDGs and lowering the adverse environmental impact. Second, in this study, a list of factors affecting the performance of CTPPs is provided. This list of factors acts as a guide or database for critical factors that need to be considered in CTPPs. Third, the proposed integrated FAHP and FDEMATEL method help in identifying the most critical factors that need to be addressed sequentially and uncovers the relationship between different factors. By understanding the relationship between the factors and addressing them, it is possible to avert or eliminate other factors. To be precise, when one factor is addressed, it eliminates the emergence of other factors. By providing such crucial information, this study contributes significantly to the literature on challenges in CTPPs. Finally, this study proposes some managerial implications to help CTPPs management enhance performance.
This study has some limitations that may be considered as scope for future works. For example, in this study, only the factors affecting the performance of CTPPs are considered. In future studies, factors affecting the performance of diesel-based thermal power plants could be investigated. Additionally, in this study, only the CTPPs located in India are considered. A similar study in other country contexts may reveal different challenges and results. Additionally, processes like Failure Modes and Effects Analysis (FMEA), system theoretic process analysis (STPA), and Hazard and Operability Analysis (HAZOP) could be integrated with the MCDM methods in future studies regarding this work.

Author Contributions

Conceptualization, T.S. and B.S.; methodology, K.K.; software, S.M.A.; validation, B.S., S.M.A., and K.K.; formal analysis, B.S.; investigation, T.S.; data curation, T.S.; writing—original draft preparation, T.S.; writing—review and editing, B.S. and S.M.A.; visualization, K.K.; supervision, S.M.A.; project administration, B.S. and S.M.A.; funding acquisition, B.S. and S.M.A. All authors have read and agreed to the published version of the manuscript.

Funding

This research received no external funding.

Institutional Review Board Statement

Not applicable.

Informed Consent Statement

Informed consent was obtained from all subjects involved in the study.

Data Availability Statement

Not applicable.

Acknowledgments

We would like to thank the anonymous reviewers for their comments that allowed us to further enhance the outcome of this research.

Conflicts of Interest

The authors declare no conflict of interest.

Appendix A

Greetings,
Carbon emission from the industries has been a major concern. This study seeks to identify and evaluate the key factors affecting the performance of coal-fired thermal power plants which contributes to carbon emission. Regarding this, the ratings for the key factors is required. Here, you are requested to rate the key factors using the fuzzy scale provided.
Table A1. Fuzzy Linguistic Scale.
Linguistic ScaleTriangular Fuzzy Numbers
Just important (JI)(1, 1, 1)
Equally important (EI)(1/2, 1, 3/2)
Weakly important (WI)(1, 3/2, 2)
Strongly important (SI)(3/2, 2, 5/2)
Very strongly important (VSI)(2, 5/2, 3)
Absolutely important (AI)(5/2, 3, 7/2)
Table A2. Pairwise comparison of the key factors.
F1F2F3F4F5F6F7F8F9F10F11F12F13F14F15F16F17F18F19F20F21F22F23F24
F1JI
F2 JI
F3 JI
F4 JI
F5 JI
F6 JI
F7 JI
F8 JI
F9 JI
F10 JI
F11 JI
F12 JI
F13 JI
F14 JI
F15 JI
F16 JI
F17 JI
F18 JI
F19 JI
F20 JI
F21 JI
F22 JI
F23 JI
F24 JI

Appendix B

Table A3. Normalized decision matrix.
F1F2F3F4F5F6F7F8F9F10F11F12F13F14F15F16F17F18F19F20F21F22F23F24
F10.020.020.050.060.030.050.020.020.030.030.020.030.020.030.020.020.050.020.020.020.050.020.020.05
F20.020.020.020.030.020.030.020.030.030.040.020.040.050.050.040.050.020.040.040.030.040.040.020.03
F30.050.020.020.060.020.030.030.030.020.030.050.020.040.030.030.020.050.030.060.030.020.020.060.05
F40.060.030.020.020.070.030.020.030.030.030.020.030.040.070.030.020.030.060.030.030.060.020.030.06
F50.040.050.050.070.020.060.070.040.070.070.040.050.060.060.050.060.050.050.060.050.050.040.060.04
F60.020.030.040.020.030.020.030.040.020.020.030.040.020.030.030.030.030.030.060.050.030.030.030.03
F70.050.050.030.040.020.040.020.020.050.030.060.030.020.050.040.050.030.060.070.030.060.070.070.03
F80.020.050.050.060.070.060.020.020.060.050.050.070.020.020.020.050.020.040.060.050.060.040.020.04
F90.060.070.050.070.020.050.050.050.020.050.050.070.020.030.040.020.050.020.020.020.040.020.070.06
F100.060.070.050.060.070.050.050.060.060.020.050.070.060.070.050.050.070.050.060.060.050.060.070.05
F110.050.020.050.020.020.060.050.060.020.070.020.040.050.060.070.020.030.040.060.050.030.070.050.04
F120.060.020.020.020.050.060.070.020.020.020.050.020.020.070.030.070.070.060.030.030.060.030.020.02
F130.060.030.030.030.050.050.040.040.050.040.030.040.030.020.030.030.030.030.030.050.030.030.050.03
F140.030.030.030.060.050.030.040.050.060.030.060.070.050.020.040.020.070.030.030.030.050.070.020.03
F150.060.060.060.020.030.030.050.050.060.050.030.030.020.020.020.060.030.030.070.030.030.060.030.03
F160.020.020.060.070.030.030.050.040.030.040.040.030.040.070.020.020.050.060.020.030.030.030.060.03
F170.040.060.060.040.050.040.070.060.050.050.060.040.060.050.070.050.020.060.070.040.050.040.060.04
F180.050.070.020.060.040.050.030.060.030.040.050.050.050.030.050.060.030.020.030.040.040.020.060.05
F190.050.070.060.030.070.020.070.030.030.050.040.030.060.060.050.050.030.060.020.050.030.070.020.04
F200.020.020.040.020.070.020.030.030.050.030.060.020.020.030.070.020.070.030.040.020.060.040.060.03
F210.060.020.020.030.030.060.030.040.050.070.060.020.050.050.040.070.040.030.030.050.020.040.020.06
F220.020.060.020.040.070.030.050.050.050.020.020.030.080.020.040.050.040.030.030.060.050.020.050.05
F230.050.020.050.060.020.030.030.040.050.020.020.040.050.050.040.050.020.050.030.060.020.060.020.05
F240.020.050.060.020.030.060.030.050.060.070.030.070.020.020.040.050.040.040.020.060.050.030.030.02
Table A4. Total-relation matrix.
F1F2F3F4F5F6F7F8F9F10F11F12F13F14F15F16F17F18F19F20F21F22F23F24
F10.000.010.040.040.020.040.010.000.020.020.000.020.010.020.010.010.040.000.010.000.040.010.010.04
F20.000.010.000.020.000.010.000.010.020.030.000.030.040.030.030.030.000.030.030.010.020.030.010.02
F30.030.000.000.040.000.010.020.010.000.010.040.000.020.020.010.010.040.010.040.010.000.000.040.04
F40.050.020.000.000.050.010.000.010.010.010.000.010.020.050.010.000.010.050.020.010.040.000.020.05
F50.010.020.030.040.010.040.040.020.050.040.010.030.040.030.030.040.030.020.030.030.020.020.030.01
F60.000.020.030.010.020.010.020.030.010.000.010.030.010.020.020.020.020.010.040.040.010.020.020.02
F70.030.030.010.020.000.020.000.000.030.010.050.010.000.020.020.030.010.040.050.010.040.050.050.01
F80.000.030.030.040.050.040.000.000.040.030.030.050.000.000.000.030.000.020.040.030.040.030.000.02
F90.040.060.030.050.000.030.040.030.000.040.030.050.000.010.020.000.040.010.000.000.020.000.050.04
F100.030.050.020.030.040.020.030.040.030.010.020.040.040.040.030.020.040.020.030.040.020.030.040.02
F110.030.000.030.000.010.040.030.040.000.050.000.020.030.040.050.000.010.020.030.030.010.050.030.02
F120.050.000.000.000.040.040.050.000.000.000.030.000.000.050.010.050.050.040.010.010.040.010.000.00
F130.050.020.010.010.040.030.030.030.030.030.010.030.010.000.010.020.010.010.010.040.010.020.030.01
F140.010.010.010.040.030.010.020.030.040.010.040.050.030.000.020.000.050.010.010.010.030.050.000.01
F150.040.040.040.000.010.010.030.030.040.040.010.010.000.000.000.040.010.010.050.010.010.040.010.01
F160.000.000.050.050.010.010.040.020.010.030.020.010.020.050.000.010.040.040.000.010.010.010.040.01
F170.010.030.040.020.030.010.040.040.020.030.040.020.040.020.040.020.000.040.040.020.030.020.030.02
F180.030.060.000.040.020.030.010.040.010.020.030.030.030.010.040.040.010.000.010.020.020.000.040.03
F190.030.050.040.010.050.000.040.010.010.030.020.010.040.040.030.030.010.040.000.030.000.050.000.02
F200.000.000.020.000.050.000.010.010.030.010.050.000.000.020.050.000.050.010.020.000.050.020.040.01
F210.040.000.010.010.010.040.010.020.030.050.040.000.030.030.020.060.020.010.010.030.000.020.000.04
F220.000.040.000.020.050.010.040.030.020.000.000.010.060.000.020.030.020.010.010.040.030.000.020.03
F230.030.000.030.040.000.010.010.020.030.000.000.020.030.030.030.030.000.030.020.050.000.040.000.03
F240.000.030.050.000.010.040.010.030.040.050.010.050.000.000.020.030.020.020.000.040.030.010.010.00

References

  1. Ulucak, R. A revisit to the relationship between financial development and energy consumption: Is globalization paramount? Energy 2021, 227, 120337. [Google Scholar] [CrossRef]
  2. Zhang, J.; Huang, G.; Liu, L.; Zhai, M.; Xie, Y.; Xin, X.; Meng, H. Economic sensitivity analysis of dual perspectives induced by energy scarcity for energy-dependent region. Sci. Total Environ. 2021, 768, 144876. [Google Scholar] [CrossRef] [PubMed]
  3. Ellabban, O.; Abu-Rub, H.; Blaabjerg, F. Renewable energy resources: Current status, future prospects and their enabling technology. Renew. Sustain. Energy Rev. 2014, 39, 748–764. [Google Scholar] [CrossRef]
  4. Tiba, S.; Belaid, F. Modeling the nexus between sustainable development and renewable energy: The African perspectives. J. Econ. Surv. 2021, 35, 307–329. [Google Scholar] [CrossRef]
  5. Gielen, D.; Boshell, F.; Saygin, D.; Bazilian, M.D.; Wagner, N.; Gorini, R. The role of renewable energy in the global energy transformation. Energy Strateg. Rev. 2019, 24, 38–50. [Google Scholar] [CrossRef]
  6. Hu, H.; Xie, N.; Fang, D.; Zhang, X. The role of renewable energy consumption and commercial services trade in carbon dioxide reduction: Evidence from 25 developing countries. Appl. Energy 2018, 211, 1229–1244. [Google Scholar] [CrossRef]
  7. Østergaard, P.A.; Duic, N.; Noorollahi, Y.; Mikulcic, H.; Kalogirou, S. Sustainable development using renewable energy technology. Renew. Energy 2020, 146, 2430–2437. [Google Scholar] [CrossRef]
  8. Al-Shahri, O.A.; Ismail, F.B.; Hannan, M.A.; Lipu, M.S.H.; Al-Shetwi, A.Q.; Begum, R.A.; Al-Muhsen, N.F.O.; Soujeri, E. Solar photovoltaic energy optimization methods, challenges and issues: A comprehensive review. J. Clean. Prod. 2021, 284, 125465. [Google Scholar] [CrossRef]
  9. Ensign, P.C. Business Models and Sustainable Development Goals. Sustainability 2022, 14, 2558. [Google Scholar] [CrossRef]
  10. Oettingen, M.; Cetnar, J. Numerical modelling of modular high-temperature gas-cooled reactors with thorium fuel. Nukleonika 2021, 66, 133–138. [Google Scholar] [CrossRef]
  11. Oettingen, M. Assessment of the Radiotoxicity of Spent Nuclear Fuel from a Fleet of PWR Reactors. Energies 2021, 14, 3094. [Google Scholar] [CrossRef]
  12. Oettingen, M. Modelling of the reactor cycle cost for thorium-fuelled PWR and environmental aspects of a nuclear fuel cycle. Geol. Geophys. Environ. 2019, 45, 207. [Google Scholar] [CrossRef]
  13. Anser, M.K.; Shabbir, M.S.; Tabash, M.I.; Shah, S.H.A.; Ahmad, M.; Peng, M.Y.-P.; Lopez, L.B. Do renewable energy sources improve clean environmental-economic growth? Empirical investigation from South Asian economies. Energy Explor. Exploit. 2021, 39, 1491–1514. [Google Scholar] [CrossRef]
  14. Gasparotto, J.; Da Boit Martinello, K. Coal as an energy source and its impacts on human health. Energy Geosci. 2021, 2, 113–120. [Google Scholar] [CrossRef]
  15. Rasheed, R.; Javed, H.; Rizwan, A.; Sharif, F.; Yasar, A.; Tabinda, A.B.; Ahmad, S.R.; Wang, Y.; Su, Y. Life cycle assessment of a cleaner supercritical coal-fired power plant. J. Clean. Prod. 2021, 279, 123869. [Google Scholar] [CrossRef]
  16. Maradin, D. Advantages and disadvantages of renewable energy sources utilization. Int. J. Energy Econ. Policy 2021, 11, 176–183. [Google Scholar] [CrossRef]
  17. Saaty, T.L. The Analytic Hierarchy Process. In Agricultural Economics Review; Mcgraw Hill: New York, NY, USA, 1980; p. 70. [Google Scholar]
  18. Gabus, A.; Fontela, E. World Problems, an Invitation to Further Thought Within the Framework of DEMATEL; Battelle Geneva Research Center: Geneva, Switzerland, 1972; pp. 1–8. [Google Scholar]
  19. Qarnain, S.S.; Muthuvel, S.; Sankaranarayanan, B. Analysis of Energy Conservation Factors in Buildings Using Interpretive Structural Modeling Methodology: An Indian Perspective. J. Inst. Eng. Ser. A 2021, 102, 43–61. [Google Scholar] [CrossRef]
  20. Rawat, K.; Yadav, A.K. Characterization of coal and fly ash (generated) at coal based thermal power plant. Mater. Today Proc. 2020, 26, 1406–1411. [Google Scholar] [CrossRef]
  21. Shahbaz, M.; Mallick, H.; Mahalik, M.K.; Sadorsky, P. The role of globalization on the recent evolution of energy demand in India: Implications for sustainable development. Energy Econ. 2016, 55, 52–68. [Google Scholar] [CrossRef] [Green Version]
  22. Gallagher, K.S.; Bhandary, R.; Narassimhan, E.; Nguyen, Q.T. Banking on coal? Drivers of demand for Chinese overseas investments in coal in Bangladesh, India, Indonesia and Vietnam. Energy Res. Soc. Sci. 2021, 71, 101827. [Google Scholar] [CrossRef]
  23. Esquivel-Patiño, G.G.; Nápoles-Rivera, F. Thermal integration of different compression-train configurations for coal-fired power plant with carbon capture. Clean Technol. Environ. Policy 2021, 23, 1641–1654. [Google Scholar] [CrossRef] [PubMed]
  24. Agarwalla, H.; Senapati, R.N.; Das, T.B. Mercury emissions and partitioning from Indian coal-fired power plants. J. Environ. Sci. 2021, 100, 28–33. [Google Scholar] [CrossRef]
  25. Amster, E. Public health impact of coal-fired power plants: A critical systematic review of the epidemiological literature. Int. J. Environ. Health Res. 2021, 31, 558–580. [Google Scholar] [CrossRef] [PubMed]
  26. Karuppiah, K.; Sankaranarayanan, B.; Ali, S.M.; Jabbour, C.J.C.; Bhalaji, R.K.A. Inhibitors to circular economy practices in the leather industry using an integrated approach: Implications for sustainable development goals in emerging economies. Sustain. Prod. Consum. 2021, 27, 1554–1568. [Google Scholar] [CrossRef]
  27. Fragkos, P.; Laura van Soest, H.; Schaeffer, R.; Reedman, L.; Köberle, A.C.; Macaluso, N.; Evangelopoulou, S.; De Vita, A.; Sha, F.; Qimin, C.; et al. Energy system transitions and low-carbon pathways in Australia, Brazil, Canada, China, EU-28, India, Indonesia, Japan, Republic of Korea, Russia and the United States. Energy 2021, 216, 119385. [Google Scholar] [CrossRef]
  28. Elavarasan, R.M. The Motivation for Renewable Energy and its Comparison with Other Energy Sources: A Review. Eur. J. Sustain. Dev. Res. 2019, 3, em0076. [Google Scholar] [CrossRef]
  29. Malik, S.; Tewari, P.C. Performance modeling and maintenance priorities decision for the water flow system of a coal-based thermal power plant. Int. J. Qual. Reliab. Manag. 2018, 35, 996–1010. [Google Scholar] [CrossRef]
  30. Jović, M.; Laković, M.; Banjac, M. Improving the energy efficiency of a 110 MW thermal power plant by low-cost modification of the cooling system. Energy Environ. 2018, 29, 245–259. [Google Scholar] [CrossRef]
  31. Eguchi, S.; Takayabu, H.; Lin, C. Sources of inefficient power generation by coal-fired thermal power plants in China: A metafrontier DEA decomposition approach. Renew. Sustain. Energy Rev. 2021, 138, 110562. [Google Scholar] [CrossRef]
  32. Li, H.; Zhang, Y.; Yang, Y.; Han, W.; Yao, M.; Bai, W.; Zhang, L. Preliminary design assessment of supercritical CO2 cycle for commercial scale coal-fired power plants. Appl. Therm. Eng. 2019, 158, 113785. [Google Scholar] [CrossRef]
  33. Fan, H.; Zhang, Z.; Dong, J.; Xu, W. China’s R&D of advanced ultra-supercritical coal-fired power generation for addressing climate change. Therm. Sci. Eng. Prog. 2018, 5, 364–371. [Google Scholar] [CrossRef]
  34. Geete, A. Application of exergy and entransy concepts to analyses performance of coal fired thermal power plant: A case study. Int. J. Ambient Energy 2021, 42, 1032–1043. [Google Scholar] [CrossRef]
  35. Bertheau, P. Assessing the impact of renewable energy on local development and the Sustainable Development Goals: Insights from a small Philippine island. Technol. Forecast. Soc. Change 2020, 153, 119919. [Google Scholar] [CrossRef]
  36. Swain, R.B.; Karimu, A. Renewable electricity and sustainable development goals in the EU. World Dev. 2020, 125, 104693. [Google Scholar] [CrossRef]
  37. Zadeh, L.A. Information and control. Fuzzy Sets 1965, 8, 338–353. [Google Scholar]
  38. Lyu, H.-M.; Sun, W.-J.; Shen, S.-L.; Zhou, A.-N. Risk Assessment Using a New Consulting Process in Fuzzy AHP. J. Constr. Eng. Manag. 2020, 146, 04019112. [Google Scholar] [CrossRef]
  39. Calabrese, A.; Costa, R.; Levialdi, N.; Menichini, T. Integrating sustainability into strategic decision-making: A fuzzy AHP method for the selection of relevant sustainability issues. Technol. Forecast. Soc. Change 2019, 139, 155–168. [Google Scholar] [CrossRef]
  40. Dožić, S.; Lutovac, T.; Kalić, M. Fuzzy AHP approach to passenger aircraft type selection. J. Air Transp. Manag. 2018, 68, 165–175. [Google Scholar] [CrossRef]
  41. Chang, D.Y. Applications of the extent analysis method on fuzzy AHP. Eur. J. Oper. Res. 1996, 95, 649–655. [Google Scholar] [CrossRef]
  42. Karuppiah, K.; Sankaranarayanan, B.; Ali, S.M. A fuzzy ANP-DEMATEL model on faulty behavior risks: Implications for improving safety at the workplace. Int. J. Occup. Saf. Ergon. 2020, 1–18. [Google Scholar] [CrossRef]
  43. Gören, H.G. A decision framework for sustainable supplier selection and order allocation with lost sales. J. Clean. Prod. 2018, 183, 1156–1169. [Google Scholar] [CrossRef]
  44. Farooque, M.; Jain, V.; Zhang, A.; Li, Z. Fuzzy DEMATEL analysis of barriers to Blockchain-based life cycle assessment in China. Comput. Ind. Eng. 2020, 147, 106684. [Google Scholar] [CrossRef]
  45. Thavi, R.R.; Narwane, V.S.; Jhaveri, R.H.; Raut, R.D. To determine the critical factors for the adoption of cloud computing in the educational sector in developing countries—A fuzzy DEMATEL approach. Kybernetes 2021. [Google Scholar] [CrossRef]
  46. Ghimire, L.P.; Kim, Y. An analysis on barriers to renewable energy development in the context of Nepal using AHP. Renew. Energy 2018, 129, 446–456. [Google Scholar] [CrossRef]
  47. Dhirasasna, N.; Becken, S.; Sahin, O. A systems approach to examining the drivers and barriers of renewable energy technology adoption in the hotel sector in Queensland, Australia. J. Hosp. Tour. Manag. 2020, 42, 153–172. [Google Scholar] [CrossRef]
  48. Wang, L.; Xu, M.; Ma, K. Experimental characterization of frequency-domain thermal impedance for power module under different boundary conditions. In Proceedings of the 2021 IEEE Energy Conversion Congress and Exposition (ECCE), Vancouver, BC, Canada, 10–14 October 2021; IEEE: New York, NY, USA, 2021; pp. 5665–5669. [Google Scholar]
  49. Ji, X.; Chen, X.; Mirza, N.; Umar, M. Sustainable energy goals and investment premium: Evidence from renewable and conventional equity mutual funds in the Euro zone. Resour. Policy 2021, 74, 102387. [Google Scholar] [CrossRef]
  50. Subramaniyan, J.; Venkatachalapathy, S. Heat transfer studies at different speeds and loads of regenerative air preheater in thermal power plant. Therm. Sci. Eng. Prog. 2021, 22, 100814. [Google Scholar] [CrossRef]
  51. Akpan, P.U.; Fuls, W.F. Application and limits of a constant effectiveness model for predicting the pressure of steam condensers at off-design loads and cooling fluid temperatures. Appl. Therm. Eng. 2019, 158, 113779. [Google Scholar] [CrossRef]
  52. Wang, L.; Bu, Y.; Tang, C.; Lv, C.; Chen, X.; Che, D. Study on the formation process of low-temperature ash deposition induced by ammonium bisulfate in pulverized coal-fired boiler. Asia Pacific J. Chem. Eng. 2020, 15, 5–12. [Google Scholar] [CrossRef]
  53. Hasnain, S.; Ali, M.K.; Akhter, J.; Ahmed, B.; Abbas, N. Selection of an industrial boiler for a soda-ash production plant using analytical hierarchy process and TOPSIS approaches. Case Stud. Therm. Eng. 2020, 19, 100636. [Google Scholar] [CrossRef]
  54. Anitha Kumari, S.; Srinivasan, S. Ash fouling monitoring and soot-blow optimization for reheater in thermal power plant. Appl. Therm. Eng. 2019, 149, 62–72. [Google Scholar] [CrossRef]
  55. Chen, Z.; Li, H.; Gu, Y.; Zhu, W. A novel flexible seal technology and its application in heat transfer of rotary air preheater. Appl. Therm. Eng. 2019, 163, 114414. [Google Scholar] [CrossRef]
  56. Karuppiah, K.; Sankaranarayanan, B.; Ali, S.M.; Kabir, G. Role of ergonomic factors affecting production of leather garment-based SMEs of India: Implications for social sustainability. Symmetry 2020, 12, 1414. [Google Scholar] [CrossRef]
  57. Karuppiah, K.; Sankaranarayanan, B.; Ali, S.M.; Paul, S.K. Key Challenges to Sustainable Humanitarian Supply Chains: Lessons from the COVID-19 Pandemic. Sustainability 2021, 13, 5850. [Google Scholar] [CrossRef]
  58. Niu, S.; Zhang, Z.; Ke, X.; Zhang, G.; Huo, C.; Qin, B. Impact of renewable energy penetration rate on power system transient voltage stability. Energy Rep. 2022, 8, 487–492. [Google Scholar] [CrossRef]
  59. Büyüközkan, G.; Karabulut, Y.; Mukul, E. A novel renewable energy selection model for United Nations’ sustainable development goals. Energy 2018, 165, 290–302. [Google Scholar] [CrossRef]
Figure 1. Framework of the study.
Sustainability 14 03588 g001
Figure 2. Cause–effect relationship among the key factors.
Sustainability 14 03588 g002
Table 1. Linguistic scale [42].
Linguistic ScaleTriangular Fuzzy Numbers
Just important (JI)(1, 1, 1)
Equally important (EI)(1/2, 1, 3/2)
Weakly important (WI)(1, 3/2, 2)
Strongly important (SI)(3/2, 2, 5/2)
Very strongly important (VSI)(2, 5/2, 3)
Absolutely important (AI)(5/2, 3, 7/2)
Table 2. Key factors affecting the coal-fired thermal power plants performance.
Key FactorsDescriptionReferences
Excess operating air levels (F1)It increases the mass flow rates and reduces flue gas inlet temperature.[29,31]
PA/SA ratio (F2)It is the ratio between the primary and secondary air. Increased primary air ratios require lower mill inlet temperature and, thus, more tempering air.[50]
Fluctuation in inlet air/gas temperature (F3)Changes in entering AIR/GAS temperature result in a change in temperature head, which directly affects the drop in gas temperature.[51]
High moisture content in coal (F4)To evaporate the moisture, higher quantity of latent heat is absorbed, thus reducing the flue gas temperature.[22,24]
High level of air ingress (F5)It reduces inlet gas temperature and increases the flue gas mass flow rates. It is quantified by the percentage of oxygen increase in the flue gas.[29,30]
Upstream ash evacuation (F6)Full ash evacuation through flue gas leads to more ash-flow through air preheater.[50,52]
Poor soot blowing (F7)It affects the cleaning performance of the air preheater. It is the high-velocity steam cleaning done online.[24]
More number of mills in service (F8)It increases the mass flow rate of flue gas, leading to choking via ash more erosion.[22]
Poor maintenance practice (F9)Leakages, choking, and air ingress will happen.[23]
Air preheater leakages (F10)There is leakage of high-pressure air into the low-pressure flue gas path (due to differential pressure), high seal clearance (due to hot conditions), and seal erosion/improper seal setting. An increase in air heater leakage increases the station service power requirements of FD and ID fans.[31,34]
Profile of the heating element (F11)It varies the retention time of flue gas in the heating element; also, complicated profile leads to air preheater chocking.[32,52]
Heating element materials (F12)Specific heat capacity and corrosion resistance are important properties. Therefore, the materials are selected based on the required properties.[51,53]
Pressure drop across the air preheater (F13)High-pressure drop is due to the seal leakages and air ingress in the air preheater.[50]
Increase in tempering air (F14)It bypasses the air preheaters in the boiler, thus reducing the heat recovery from the flue gases leaving the boiler. Unfortunately, this increases the boiler exit gas temperature, which increases the dry gas loss in the boiler.[54]
Air preheater element erosion (F15)The erosion of the tube at the entry side requires frequent cleaning of the air heater and insists on using replaceable inserts at the erosion-prone areas.[32,34]
High level of ash fouling (F16)Reduce the heat transfer.Industrial input
Plugging by ash (F17)Highly affects air preheater performance.[30,34]
High level of corrosion (F18)Reduce the heat transfer area. Leads to sector plate leakage, quick seal damage[22]
Air preheater secondary fire (F19)It is due to the burning of unburned heavy oil. deposited in air preheater heating elements. It produce hot zone, uneven expansion of rotor and air preheater heating elements damage.[23]
Malfunctioning of oil burners (F20)Leads to carrying unburnt oil deposits in heating elements[24]
APH motor failures–Only for rotary type (F21)Leads to uneven expansion of rotor, jamming of rotor, and air preheater firing.[53,55]
Improper water washing (F22)Affects the heat transfer rating.[23]
Boiler operation with high overload (F23)Increases the mass flow rates and reduces flue gas inlet temperature.[51]
Low feed water temperature at boiler inlet (F24)It needs more sensible heating in the boiler, so the flue gas inlet temperature to the air preheater will reduced.[52,55]
Table 3. Profile of the experts.
Characteristicsn = 7%
Position Executive engineer228.57
Assistant executive engineer114.28
Superintend engineer228.57
Assistant engineer228.57
Education qualificationGraduate228.57
Post-graduate342.85
Doctorate228.57
Experience5–10 years342.85
10–15 years228.57
Above 15 years228.57
Table 4. Average of pairwise comparison made by experts on factors.
F1F2F3F4F5F6F7F8F9F10F11F12F13F14F15F16F17F18F19F20F21F22F23F24
F1JIEIVSIVSIWIVSIEIEIWIWIEIWIEIWIEIEIWIEIEIEIVSIEIEIVSI
F2EIJIEIWIEIWIEIWIWISIEISISISISISIEISISIWISISIEIWI
F3VSIEIJIVSIEIWIWIWIEIWIVSIEIWIWIWIEIVSIWIVSIWIEIEIVSIVSI
F4AIWIEIJIAIWIEIWIWIWIEIWIWIAIWIEIWIAIWIWIAIEIWIAI
F5SISIVSIAIJIAIAISIAIAISIVSIVSIVSIVSIVSIVSIVSIVSIVSIVSISIVSISI
F6EIWISIEIWIJIWISIEIEIWISIEIWIWIWIWIWIVSIVSIWIWIWIWI
F7VSISIWISIEISIJIEISIWIAIWIEISISISIWIAIAIWIAIAIAIWI
F8EISIVSIVSIAIAIEIJIVSIVSIVSIAIEIEIEISIEISIVSIVSIAISIEISI
F9AIAIVSIAIEIVSIVSIVSIJIVSIVSIAIEIWISIEIVSIEIEIEISIEIAIAI
F10AIAIVSIVSIAIVSIVSIAIVSIJIVSIAIVSIAIVSISIAIVSIVSIAIVSIVSIAIVSI
F11VSIEIVSIEIEIAIVSIAIEIAIJISISIVSIAIEIWISIVSIVSISIAISISI
F12AIEIEIEIVSIAIAIEIEIEIVSIJIEIAIWIAIAIAIWIWIAIWIEIEI
F13AIWIWIWIVSIVSISISISISIWISIJIEIWIWIWIWIWIVSIWIWISIWI
F14WIWIWIVSIVSIWISIVSIVSIWIAISISIJISIEIAIWIWIWIVSIAIEIWI
F15AIVSIAIEIWIWIVSIVSIVSIVSIWIWIEIEIJIVSIWIWIAIWIWIVSIWIWI
F16EIEIAIAIWIWIVSISIWISISIWIWIAIEIJIVSIAIEIWIWIWIVSIWI
F17VSISIAISIVSISIAIAISIVSIAISIVSISIAISIJIAIAISIVSISIVSISI
F18VSIAIEIVSISIVSIWIAIWISIVSIVSISIWIVSIVSIWIJIWISISIEIVSIVSI
F19VSIAIAIWIAIEIAIWIWIVSISIWIVSIVSIVSISIWIAIJIVSIWIAIEISI
F20EIEISIEIAIEIWIWISIWIAIEIEIWIAIEIAIWISIJIAISIVSIWI
F21AIEIEIWIWIAIWISISIAIAIEISISISIAISIWIWIVSIJISIEIAI
F22EIAIEISIAIWIVSIVSISIEIEIWIAIEISISISIWIWIAIVSIJISIVSI
F23VSIEIVSIVSIEIWIWISISIEIEISISISISISIEIVSIWIAIEIVSIJIVSI
F24EISIAIEIWIAIWIVSIVSIAIWIAIEIEISISISISIEIAIVSIWIWIJI
Table 5. Ranking of factors based on weights obtained using FAHP.
FactorsWeightRank
F10.0313624
F20.0332422
F30.0348621
F40.0375020
F50.052992
F60.0325123
F70.042878
F80.042729
F90.044097
F100.057181
F110.044136
F120.0402415
F130.0380319
F140.0424510
F150.0411014
F160.0396016
F170.051963
F180.044465
F190.046434
F200.0380818
F210.0424011
F220.0413912
F230.0391717
F240.0412513
Table 6. Cause and effect relationship of the factors.
Factors ( R + C ) ( R C ) Cause/EffectRank
F10.91330.1184EFFECT24
F20.93120.1019EFFECT22
F30.94670.0857EFFECT21
F40.98040.0500EFFECT19
F51.16390.1314CAUSE2
F60.93170.1022EFFECT23
F71.04290.0105CAUSE8
F81.03320.0003CAUSE11
F91.08120.0480CAUSE6
F101.21480.1813CAUSE1
F111.05500.0237CAUSE7
F121.01340.0194EFFECT15
F131.00540.0256EFFECT17
F141.03060.0014CAUSE10
F151.02940.0032EFFECT12
F161.00920.0236EFFECT16
F171.15310.1227CAUSE3
F181.08290.0516CAUSE5
F191.09270.0573CAUSE4
F200.96840.0652EFFECT20
F211.04110.0085CAUSE9
F221.02390.0082EFFECT14
F231.00760.0269EFFECT18
F241.02310.0063EFFECT13
Publisher’s Note: MDPI stays neutral with regard to jurisdictional claims in published maps and institutional affiliations.

