Abstract
Liquefied natural gas (LNG) is the cleanest fossil fuel available, producing less carbon emissions and fewer pollutants than other fossil fuels. Marine transportation is a key process in the LNG supply chain. The use of tank containers, which are portable equipment, can effectively facilitate multi-mode transportation. LNG evaporation causes pressurization, which is a safety concern during transportation. Ship motion and environmental temperature are the main factors affecting pressure variations. In this study, the effect of ship motion on pressurization and holding time was investigated through three types of experiments, namely, prototype, field, and self-pressurization experiments. The results showed that while increased boil-off gas was generated due to ship motion, this evaporation remained stable in dynamic cases. Higher evaporation rates were obtained under more severe dynamic conditions, and the holding time was shortened. The two different effects of ship motion on pressure development discussed here are the facilitation of pressurization due to the enhancement of heat transfer and the prevention of pressurization due to gas condensation at the vapor–liquid interface. These two effects show varied levels of predominance over the pressure variations depending on different stages of transportation. The holding time in the experiments was able to reach 87 days under the most severe condition, which is long enough for long-term shipping; the safety of transporting LNG in tank containers is further discussed based on the experimental results herein.
1. Introduction
Fossil energy represented by coal, oil, and natural gas is the world’s main primary energy source. The large extent of energy consumption underlies the threat of a serious global climate crisis. According to estimates of the World Resources Institute (WRI), the total global greenhouse gas emissions were 47.5 billion tons in 2018, of which 76% were carbon emissions generated in the process of energy use [1]. As a traditional fossil fuel natural gas has the characteristics of being a clean energy, with a high calorific value per unit, no residue after combustion, and fewer greenhouse gas emissions than coal and oil. It is considered to be a “bridge” in transitioning from fossil energy to new energy. The demand for natural gas has grown rapidly recent years [2].
The global distribution of natural gas resources is uneven. Natural gas transportation is one of the most important processes in the industrial chain. Liquefied natural gas (LNG) is the main form of natural gas moved via marine transportation. LNG is usually transported by LNG ships, tank trucks, or pipelines. Several different facilities are needed for this process, and LNG is typically loaded and unloaded several times in the supply chain (see Figure 1). This may both increase the costs of LNG storage and transportation and cause resource waste. A tank container is a kind of portable equipment that can be used as both storage and transportation equipment, making it easier to combine different modes of transportation without rearranging the contents within tank containers [3]. This mode of transport is cost-effective and highly efficient; moreover, tank container transportation is more applicable for transporting LNG to remote areas or those with seasonal natural gas demand. This form of transportation is of great significance for the extensive application of clean energy.
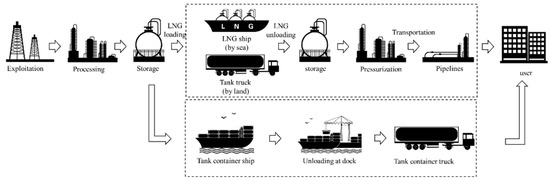
Figure 1.
Comparison of different means for LNG transportation.
One of the key issues that should be carefully considered during the processes of LNG storage and transportation is evaporation. Boil-off gas (BOG) is generated when low-temperature LNG evaporates, which pressurizes tank containers. When the tank pressure reaches the maximum allowable pressure, the BOG should be appropriately and safely handled. For certain LNG ships, the over-pressure BOG can be either reliquefied and returned to the LNG carriers or used as fuel for dual-fuel ships [4]. Additional facilities need to be installed on the ships for these processes. The only way to handle BOG in a tank container is through discharging directly to the environment. BOG is mainly composed of methane, a flammable substance, resulting in safety concerns associated with BOG discharge. Therefore, it is forbidden to discharge BOG during marine transportation. The main method of ensuring the safety of LNG transport in tank containers is to predict the duration that LNG can be safely kept within tank containers; this duration is called the holding time. The key issues in studying holding times are to determine the pressurization and dynamic evaporation of LNG in tank containers.
Tank pressurization due to LNG evaporation is a natural process. It is the main safety concern during tank container transportation, and is caused by the accumulation of BOG that is generated by evaporation. In a static state, the heat sources for evaporation are mainly solar radiation and temperature differences between the inside of the tank container and the environment (see Figure 2). Static evaporation characteristics in cryogenic vessels have been studied using theoretical, CFD, and experimental methods. In theoretical studies, predictions of LNG composition and BOG rate were studied based on equilibrium [5,6,7,8] and non-equilibrium [9,10,11] thermodynamics. In CFD studies, temperature distributions, heat transfer, and evaporation mechanics have been investigated [12,13,14]. It has previously been found that heat transfer at the interface of the vapor and liquid phase is quite small. Instead, heat for evaporation mainly derives from the heat transfer from liquid [9,15,16]. In experimental studies, Niu et al. [17] investigated the evaporation in type B containers using a 1:1000 scaled model. Lin et al. [15] proposed a practical approach to predict BOG rate in a type C container based on a scaled model experimental study. Their experimental results provide an important reference for engineering practice and CFD studies. All of the mentioned studies were conducted under static conditions. The main factor that influences evaporation is environmental temperature. For marine transportation, ship motion is one of the main factors able to affect LNG evaporation; thus, the dynamic characteristics of evaporation and pressurization should be further studied.
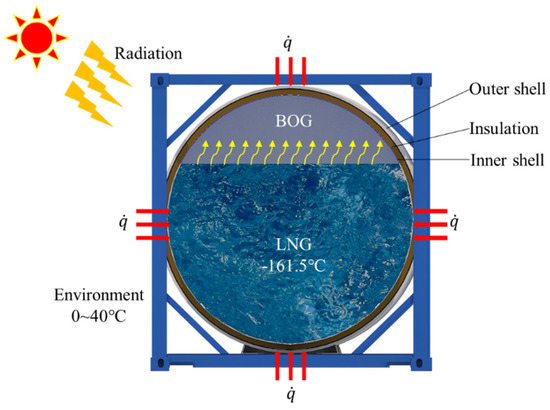
Figure 2.
Schematic of LNG evaporation in tank containers.
During transportation, ship motion causes liquid sloshing, which can be investigated either based on experimental investigations or with the help of numerical simulations [18,19,20,21]. Liquid sloshing may facilitate heat transfer and impact pressure variation in the tank container [22,23,24]. The thermodynamic responses of low-temperature fluids to different excitations are usually studied in the aerospace field. Pressurization, BOG generation, and thermal stratification subjected to periodical excitation in the fuel tank were investigated in [25,26,27]. With the development of marine engineering, liquid sloshing and the thermodynamic responses to it have been studied in marine equipment. For example, Ghafri et al. [28,29] investigated liquid sloshing and thermodynamic responses induced by sloshing. However, the working fluids in the experiments were all water, the thermodynamic properties of which are different from LNG. Dimopoulos et al. [30] and Miana et al. [5,6] studied BOG generation during shipping. In their studies, they considered transport duration, environmental temperature, and heat ingress as variables; however, ship motion was not taken into consideration. Qu et al. [31] proposed a new condensation model considering ship motion. In this model, liquid sloshing induced by ship motion was considered when calculating the condensation flow rate. Sun et al. [32] and Gu et al. [33,34] studied the effect of ship motion on heat transfer of low-temperature fluid in marine equipment. It was found that external excitation had a significant impact on heat transfer in cryogenic vessels. The above-mentioned studies demonstrate that it is necessary to study the effect of external excitations on pressurization and evaporation. However, few studies have been conducted on LNG behavior within tank containers; heat transfer and evaporation of LNG in tank containers needs to be investigated.
Pressurization and dynamic evaporation result from heat transfer subjected to excitation conditions during transportation. Thermodynamic response in tank containers is related to liquid sloshing and heat transfer. Experimental study is a reliable means of investigating these problems. While most of the previous experimental studies were conducted using scaled models, it has been demonstrated by Saleem et al. [35] that the determined thermodynamic response of a low-temperature fluid is sensitive to the model size used for the study. This means that the determined thermodynamic responses will vary with respect to different model sizes. Moreover, LNG composition is another factor that may affect evaporation [30,36]. However, most previous experimental studies used liquid nitrogen as a substitute for LNG due to experimental safety concerns. The involved phenomena and thermodynamic response may be different due to the different thermodynamic properties of these two fluids. Therefore, a prototype experiment using multi-component LNG is necessary in order to systematically study the dynamic characteristics of evaporation and pressurization in tank containers. At present, there are few studies that employ prototype experiments for LNG equipment. Moreover, the characteristics of evaporation and pressurization in tank containers during marine transportation have not been systematically studied. The safety of transporting LNG in tank containers needs to be further discussed.
As mentioned above, environmental temperature and ship motion are two key factors that affect LNG evaporation in tank containers. However, few studies have been carried out to investigate the effect of ship motion on evaporation and pressurization in tank containers. Experimental study is a reliable strategy to resolve these problems. Therefore, in this study, three types of experiments on LNG evaporation were carried out: a laboratory prototype experiment, a field experiment, and a self-pressurization experiment. All the experiments were conducted with prototype 40 ft LNG tank containers used in marine transportation. Multi-component LNG was used in all the experiments to allow more realistic results to be obtained. Through this approach, the effects of ship motion on evaporation and pressurization were studied. The experimental setups are elaborately described in Section 2. In Section 3, the experimental results are discussed. In the laboratory prototype experiment (Section 3.1), ship motion was simulated, allowing the characteristics of LNG evaporation and pressure variation under two dynamic conditions to be studied. In the field experiment (Section 3.2), a real shipping experiment was conducted in order to study pressurization characteristics. A self-pressurization experiment was conducted, and the results of the pressurization process were considered as a reference when analyzing the effect of ship motion on pressurization. Furthermore, the holding time, which is a key factor for a tank container when creating shipping schedules under dynamic conditions, was analyzed as well. In Section 4, the safety of transporting LNG in tank containers is discussed based on the experimental results.
2. Experimental Setup
Three types of experiments were conducted in this study, namely, laboratory prototype, field, and self-pressurization experiments. The experimental setups are described below.
2.1. Tank Container
The tank containers used in all the experiments were 40 ft LNG tank containers, which are horizontal cylindrical containers; the main structure is shown in Figure 3, and the dimensions are listed in Table 1. The tank containers were manufactured by the same company in the same batch. All tank containers were well insulated, and the daily evaporation rate was less than 0.15%/d. The total volume of each tank container was 40 m3. The maximum allowable pressure of the tank containers was 850 kPa (absolute pressure). A pressure sensor and two thermal sensors were installed on the tank containers. The pressure sensor was mounted on the upper position to measure the tank pressure. Two thermal sensors were installed in the upper and lower positions in the tank containers to ensure that temperatures of the vapor phase and liquid phase were measured.
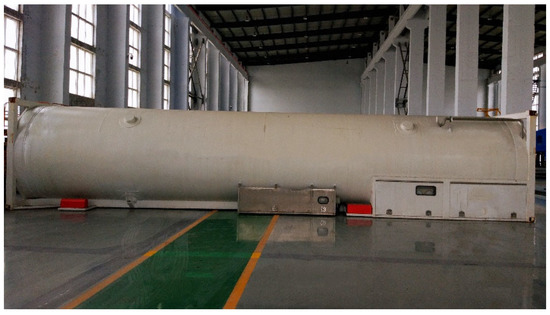
Figure 3.
Main structure of the tank container used in the experiments.

Table 1.
Dimensions of LNG tank containers used in the experiments.
2.2. LNG
The working fluids used in all the experiments were multi-component LNG. The LNG compositions used in the experiment are shown in Table 2. The filling ratio was 90%, which indicates that the initial volume of LNG was about 36 m3. The temperature of the LNG used to fill the tank containers was −158.70 °C, −158.39 °C, and −157.89 °C, respectively, in the prototype, self-pressurization, and field experiment. Temperature was measured by the thermal sensors installed in the tank containers.
Table 2.
Mole fractions of LNG compositions in the experiments (unit: %).
2.3. Prototype Experiment Setup
Evaporation is a continuous process, and BOG is continuously generated in the tank containers throughout the entire process of LNG storage and transportation. Therefore, in the prototype experiment the intensity of LNG evaporation is indicated by the BOG flow rate. Tank container pressure increases due to the accumulation of BOG in the ullage space. The tank pressure is always higher than the atmospheric pressure due to continuous BOG generation. In this experiment, BOG was allowed to flow out of the tank container through gas measurement pipelines and the BOG flow rate was measured by the flow meter. The schematic of dynamic BOG flow rate measurement is shown in Figure 4. The prototype experiment was conducted in an indoor laboratory of Dalian University of Technology. The average room temperature was 25.8 °C during the experiment. In the real tank container transportation experiment, the tank container was fixed on the deck in order to simulate the motion state of the tank container; the tank container was fixed on the simulator, and a single degree-of-freedom (DOF) simulator was adopted to simulate the ship motion during shipping.
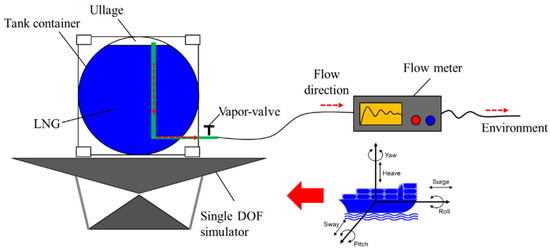
Figure 4.
Schematic of the prototype experiment.
2.3.1. Ship Motion Simulator
In the prototype experiment, ship motion was simulated by a single degree of freedom (DOF) simulator. Even though the main DOFs of ship motion during a voyage are pitching and rolling, anti-sloshing baffles are usually adopted to prevent longitudinal liquid sloshing along the length of tank containers. Therefore, roll motion was simulated in this experiment. The mass of a tank container with 90% filling ratio may reach 35,000 kg. The ship motion simulator used in previous studies cannot meet this loading capacity [37]; therefore, a single DOF was carefully designed. The main parameters of this simulator are shown in Table 3, which was used to simulate the roll motion of the container ship.
Table 3.
Main parameters of single DOF simulator.
The configuration of the single DOF simulator is shown in Figure 5. The structure of the simulator consisted of a working platform, upper support, axis, base, and two hydraulic servo-actuators. The working platform was designed with a square shape in order to broaden the application of the simulator for other experiments. A tank container holder was specifically designed to fix the tank container onto the working platform. The structure was driven by a hydraulic servo system in order to obtain a large and stable driven force. In the experiment, the tank container was firmly fixed on the tank container holder. The roll motion of the ship and tank container was simulated.

Figure 5.
Configuration of single DOF simulator.
2.3.2. Measurement System
The configuration of the measure system is shown in Figure 6. The vapor valve on the tank container was selected as a connection point on the tank container side (see Figure 6a). BOG was passed through the vapor valve from the inner tank container driven by a pressure difference between the inner tank container and the environment. The measurement pipeline was connected to the vapor valve using a flange with a well-sealed joint. Another measurement pipeline was connected to the inlet of the flow meter (see Figure 6c). Due to the difference in the diameter of the two measurement pipelines, a reducing union was used (see Figure 6b). The BOG generated in the tank container flowed out through the pipelines and was measured by a flow meter with an accuracy of ±4 × 10⁻⁶ kg/s, and the measured BOG was then discharged out of the laboratory.
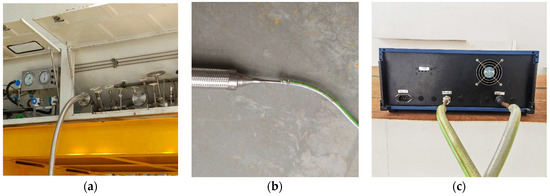
Figure 6.
Configuration of measurement system: (a) on the tank container side; (b) the reducing union; (c) on the flow meter side.
2.3.3. Experimental Conditions
Two dynamic conditions were studied in the prototype experiment, as shown in Table 4. The experimental conditions were supplied by the China Classification Society (CCS) based on real shipping of a container cargo ship. Case 1 was a small amplitude condition in which the ship underwent roll motion within a small range. The amplitude in Case 2 was the limiting criteria of roll motion of merchant ships [38]. The frequencies were the average value under the corresponding amplitude. The experimental conditions were supplied by the single DOF simulator, and the excitations were in sinusoidal curve. Cases 1 and 2 were conducted over the course of 48 h. As a comparison, a self-pressurization experiment was conducted prior to the dynamic case study.
Table 4.
Experimental conditions in prototype experiment.
2.4. Field Experiment Setup
In the field experiment, a 40 ft tank container filling with LNG was transported by a 4250 twenty-foot equivalent unit (TEU) container ship. The tank container was firmly fixed on the deck of the ship. The LNG composition is shown in Table 2. An international shipping route was selected, with a shipping time of 47 days. The shipping time refers to the time between departure and arrival, which means that the cargo ship is always in motion during this period. The average environmental temperature during shipping was 27.23 °C. The pressure of the tank container was 160 kPa at the beginning of transportation, which was set as the initial pressure. The tank pressure and the vapor and liquid temperatures were measured at 1 min intervals.
2.5. Self-Pressurization Experiment
A self-pressurization experiment was conducted in which the tank container was filled with 90% LNG that remained stationary in the laboratory. The tank container remained sealed during the whole period of the experiment. This means that the pressure in the tank container increased while BOG accumulated in the ullage space. The experiment stopped when the safety valve automatically opened and the BOG was discharged. The holding time was then recorded.
2.6. Data Calculation
2.6.1. Tank Pressure
The tank pressure was measured by the pressure sensor installed on the tank container. However, the measurement accuracy was within 10 kPa, which means that pressure variations less than 10 kPa could not be measured. The liquid temperatures during experiments were measured and recorded. The instantaneous pressure variation was measured based on the Antoine equation [39]
where is saturated vapor pressure, is liquid temperature, and , , and are coefficients. The working fluid was considered as pure methane when calculating tank pressure; thus, the values of , , and were 6.69561, 405.420 and 267.777, respectively.
2.6.2. Daily Evaporation Rate
Daily evaporation rate can be calculated by
where is the daily evaporation rate, is the daily LNG mass loss due to evaporation, and is the total LNG mass.
2.6.3. Holding Time
Holding time is a key factor for a tank container. It is defined as the duration from initial pressure to a determined final pressure or maximum allowable pressure (850 kPa in this study) of the tank container and can be calculated based on the thermal equilibrium. Holding time was calculated here based on the following assumptions: (1) the vapor phase and liquid phase are in a saturated state and have the same temperature; (2) the temperature throughout the vapor and liquid phases is homogeneous; (3) the entire heat that is transferred is used for evaporation; and (4) the working fluid is pure methane. The properties were obtained using REFPROP 9.1 software developed by the National Institute of Standards and Technology (NIST).
The total heat transfer to the tank container can be expressed as
where is total heat flux, is the density, is volume, and is enthalpy. The subscripts and indicate liquid phase and vapor phase, while and indicate initial state and final state.
The daily heat transfer can be expressed as
where is daily heat flux and is the latent heat of vaporization.
The holding time is then calculated by
where is the holding time.
In order to obtain more accurate estimations of the holding time, the results were modified as follows [40]:
where is the revised holding time, is the dimensionless time, is the dimensionless pressure, is the filling ratio, is the dimensionless heat flux, and are the initial and final pressure of the tank container, is the critical pressure, is the specific heat, and is the initial temperature of the liquid phase. Equations (6)–(9) were proposed by certain Russian experts based on results from studying the influence of the initial filling rate, pressure and heat leakage on pressurization. The modified results were closer to the actual conditions.
3. Experimental Results
The experimental results are discussed in this section. In Section 3.1, the evaporation rate and tank pressure are analyzed and the holding time is predicted based on the measurements in the prototype experiment. In Section 3.2, tank pressure variations during a real shipping voyage are analyzed. The holding time is again predicted, and the results are compared with those from the self-pressurization experiment.
3.1. Prototype Experiment Results
3.1.1. Evaporation Rate
The instantaneous BOG flow rates are shown in Figure 7a. It was found that the BOG flow rates fluctuated within a small range, 0.250 × 10⁻³–0.290 × 10⁻³ kg/s in Case 1 and 0.285 × 10⁻³–0.307 × 10⁻³ kg/s in Case 2. The BOG flow rate in Case 2 was higher than that in Case 1. This is mainly because Case 2 involved more severe ship motion where liquid sloshing was more violent and heat transfer was further enhanced. However, from a long-term perspective the variations in dynamic states were small. This is mainly because the thermal equilibrium that was built in the static state, although disturbed by the ship motion, was quickly reestablished due to the large amount of low-temperature LNG contained in the tank container; this can be further explained by the variations in liquid temperature shown in Figure 7b.
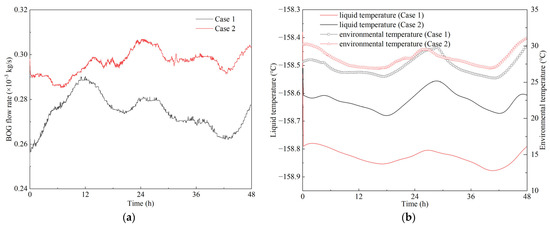
Figure 7.
Variations in (a) BOG flow rate and (b) liquid temperature in the dynamic cases.
In Figure 7b, the variations in liquid temperature were quite small, −158.69 to −158.51 °C in Case 1 and −158.9 to 158.38 °C in Case 2. It has been demonstrated that the heat source is mainly the heat transfer between the liquid and environment [9,15,16]. The temperature variations in Cases 1 and 2 were quite stable, and the heat ingress can be considered as a constant value, which is the main reason the BOG flow rates fluctuated within small ranges. However, the average liquid temperature was lower than in Case 1, which may have caused more heat ingress. Therefore, the BOG flow rate was higher in Case 2.
The evaporation rate was calculated according to the total amount of BOG, referred to as the LNG mass loss. The accumulative mass loss in the prototype experiment is shown in Figure 8. It was found that the curves of accumulative mass loss in different cases were nearly linear; thus, linear fitting was used for regression. The coefficients of determination (R2) were 0.99987, 0.99988, and 0.99995 for the static case, Case 1, and Case 2, respectively. This indicates that the values for accumulative mass loss are consistent with the linear fitting results. The linear trend indicates that LNG evaporation is stable in both static and dynamic states.
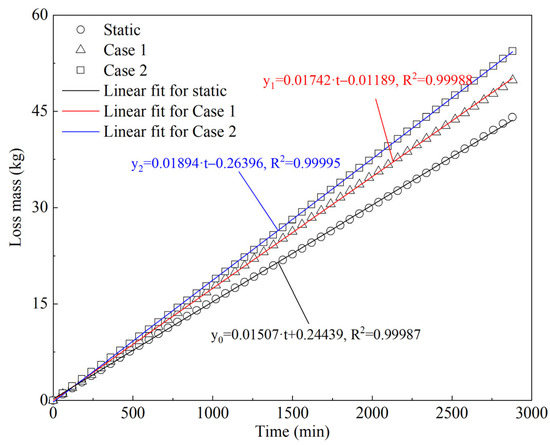
Figure 8.
Accumulative LNG mass loss in static and dynamic cases of prototype experiments.
When comparing the results between static and dynamic states, the slope of the fitting line was found to be smaller in the static than dynamic state. The total mass loss was higher in the static than in the dynamic state as well. The total mass loss was 44.089 kg in the static case, while the total mass loss was 49.084 and 54.367 kg in Cases 1 and 2, respectively. The mass loss increased by 5.75% and 23.31% in Cases 1 and 2, respectively, when comparing with the static case. This indicates that even though the evaporation rate was stable in dynamic states, ship motion significantly facilitated LNG evaporation, and therefore additional BOG was generated. Moreover, the mass loss in Case 2 was 10.76% higher than that in Case 1. This further indicates that more severe conditions cause increased BOG generation.
The evaporation rates were calculated using Equation (2), resulting in 0.128, 0.134, and 0.145%/d in the static case, Case 1, and Case 2, respectively; these values were then used to calculate the holding time.
3.1.2. Tank Pressure
Tank pressure variations are shown in Figure 9. At the beginning of the experiments, tank pressure was 113.96 and 115.34 kPa in Cases 1 and 2, respectively; the pressure then dropped within a very short time. The detailed pressure variations in initial pressure are shown in Figure 10. The dynamic case starts at t = 0, and the tank container remained stable before this point. The pressure dropped from 113.96 to 113.14 kPa and from 115.34 to 111.78 kPa within 10 min after the dynamic cases started in Cases 1 and 2, respectively. More severe conditions led to larger pressure drops. This is mainly because when the tank container started to move, the heat transfer at the interface between the vapor and liquid phase was enhanced. The vapor was partially cooled down and condensed, which caused the tank pressure to decrease. However, the pressure reached its minimum value in a very short time and then tended to be stable. It can be seen in Figure 9 that the pressure fluctuated in a small range after 10 min in the experiments. The pressure variation ranges were 112.50~113.96 and 110.61~111.87 kPa in Cases 1 and 2, respectively. From the perspective of long-term observation, the variations in tank pressure were small, and it was therefore considered stable, and the evaporation in the tank container was quite stable as well.
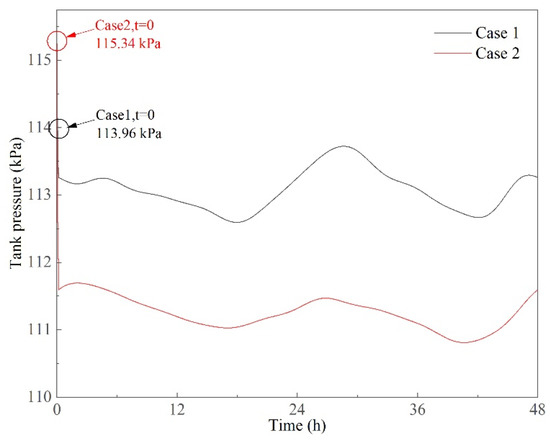
Figure 9.
Pressure variations in dynamic cases of prototype experiments.
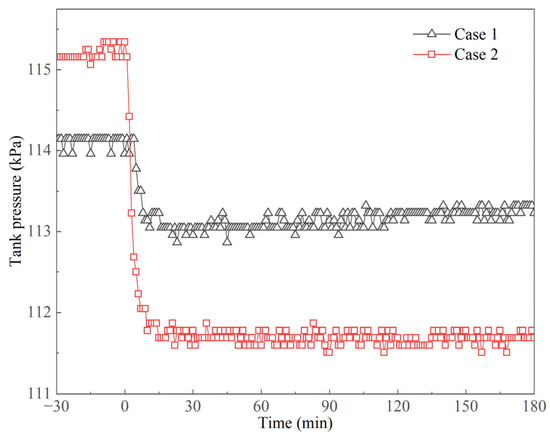
Figure 10.
Pressure variations in the initial period of prototype experiments.
In Figure 7b and Figure 9, liquid temperature and tank pressure varied in a similar fashion, and the variations were regular. This is mainly because the prototype experiment was conducted in an indoor laboratory. The main heat source for LNG evaporation was the environmental temperature. The environmental temperature variation during the experiment is shown in Figure 7b, represented by the square and triangle symbols. It was found that the liquid temperature and tank pressure varied with environmental temperature. With the increase in the environmental temperature, more heat went into the tank container, and therefore, the evaporation rate increased. In this case, more BOG was generated, which caused an increase in liquid temperature and tank pressure.
The pressure differences between the inner tank container and the environment are shown in Figure 11. The pressure difference is defined as
where is the pressure difference and and are the tank pressure and the environmental pressure. The tank pressure was always higher than the environmental pressure because the values of pressure difference were positive. The variations in pressure difference were similar to the tank pressure variations shown in Figure 9. This is mainly because the environmental pressure fluctuated within a very small range in a single day. During the experiment, the environmental pressure ranged from 100.54 to 102.13 kPa, which is within a small range compared with the variations in tank pressure. The pressure differences ranged from 9.77 to 11.05 kPa and from 10.95 to 12.65 kPa in Cases 1 and 2, respectively, representing small variation ranges. As the pressure difference is the main factor that drives BOG flow out of the inner tank container, this further demonstrates that LNG evaporation in the tank container is stable under the dynamic conditions of transport.
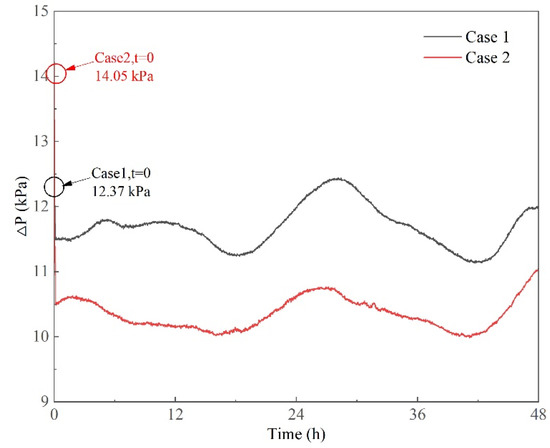
Figure 11.
Pressure difference between inner tank container and environment.
Based on the above analysis, it can be concluded that the pressure variations in the dynamic states are stable except at the beginning of the experiments. This means that the ship motion has an instantaneous impact on pressure development. When the tank container moves under regular excitations, the pressure does not fluctuate irregularly. Moreover, the pressure values in dynamic states are relatively lower than those before the experiments (see Figure 9 and Figure 10). Ship motion has two contradictory influences on pressure development. Ship motion facilitates LNG evaporation due to heat transfer enhancement under dynamic states, which shortens the holding time; on the other hand, ship motion also causes a short-term pressure drop, which extends the holding time to a certain extent. The pressure development in the tank container is simultaneously affected by these two effects, which makes the pressurization process complex.
3.1.3. Holding Time
Holding time was calculated using Equations (5)–(9). Holding times for different final pressures are shown in Figure 12. It was found that at the initial period when tank pressure increased from 100 to 200 kPa, the variations were almost linear. The variations in holding times were similar in both Cases 1 and 2. However, when the tank pressure exceeded 200 kPa, the increase in holding time gradually slowed down, and the holding time in Case 2 became shorter under the same final pressure. This is mainly because the evaporation rate was higher in Case 2 than in Case 1. This means that increased BOG was generated in Case 2, and the speed of pressurization was faster.
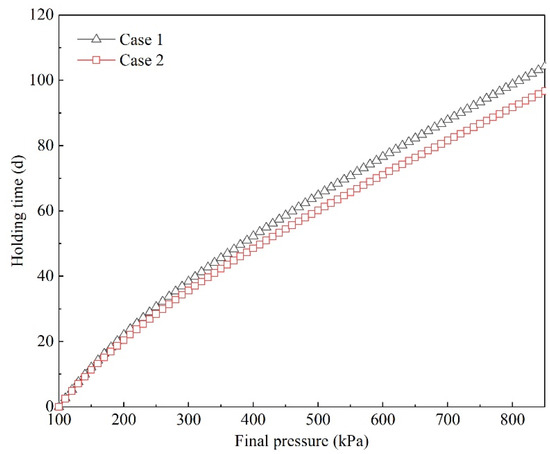
Figure 12.
Predicted holding time in the prototype experiment.
In order to compare the holding times under different experimental conditions, the holding times are summarized in Table 5. The initial pressure is 160 kPa, and the final pressure is 850 kPa. The holding time in the static case was 106 days, which is 22 days less than that measured in the self-pressurization experiment. There are two possible reasons for this error: (1) different actual environmental conditions, especially the environmental temperature; and (2) different insulation properties between different tank containers (even though they were produced by the same company and in the same batch, the insulation properties may be different). The results calculated in the static case were conservative. This is mainly because when calculating the daily heat flux using Equation (4), the daily evaporation rate was considered as a constant value that was obtained from the static case. However, the environmental temperature changed every day, which led to different daily evaporation rate. Moreover, the evaporation rates under different tank pressures were different as well. These factors might result in deviations in the calculated values.
Table 5.
Holding time in experiments.
The holding time in Cases 1 and 2 was 93 and 87 days, respectively, which is lower than in the static case. The holding time was shortened by 13 and 19 days, respectively, mainly because evaporation in dynamic states was enhanced, and higher daily evaporation rates were obtained. The calculated results were conservative, as they did not consider that ship motion may cause pressure drops. However, the holding time in the most severe conditions (Case 2) reached 87 days, which is sufficient for long-distant shipping routes. Therefore, these preliminary results suggest that it is safe to transport LNG in tank containers considering the probability of BOG discharge due to pressurization.
3.2. Field Experiment Results
3.2.1. Tank Pressure
Tank pressure variations are shown in Figure 13. Tank pressure increased in both experiments, and the pressure increased in a stepwise fashion. This is mainly because the measurement accuracy of the pressure sensor was within 10 kPa, which means that pressure variations of less than 10 kPa could not be measured. Tank pressure increased from 160 to 290 kPa after 47 days. In the self-pressurization experiment, tank pressure reached 310 kPa in 47 days from the same initial tank pressure (160 kPa). In the first ten days, the pressurization trends in two experiments were almost the same. After this period, it took a longer time to reach the same pressure in the field experiment. As a result, the pressurization was lower for the same experimental time in the field experiment.
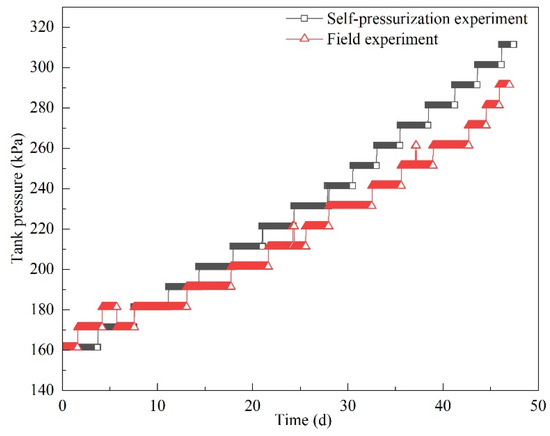
Figure 13.
Pressure variations in the field and self-pressurization experiment.
The pressurization rates are shown in Figure 14. While the pressurization rates in both experiments gradually increased, can clearly be seen that pressurization rates fluctuated significantly in the field experiment. When the tank pressure was less than 260 kPa, the pressurization rate in the self-pressurization experiment was slightly higher than that in the field experiment. When the pressure was 270 kPa, the pressurization rate in the field experiment was 135 kPa/d, while the value was 90 kPa/d in the self-pressurization experiment. Moreover, the pressurization rate was significantly higher in the field experiment. It can be seen in Figure 13 that after about 40 days the same pressure values lasted for a shorter time. Therefore, it is reasonable to predict that if the experiment had been continued, the tank pressure in the field experiment might have reached the maximum allowable pressure (850 kPa) earlier.
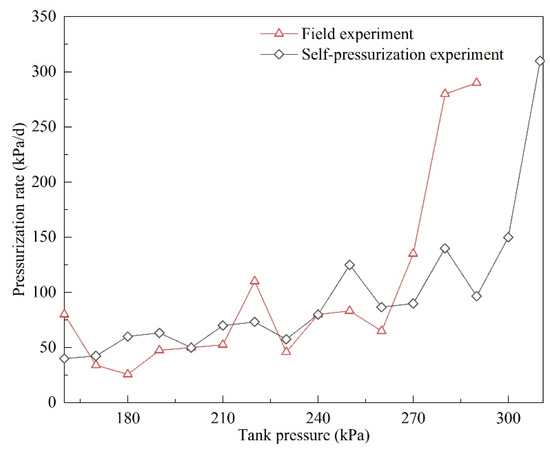
Figure 14.
Pressurization rates in the field and self-pressurization experiments.
As analyzed earlier, ship motion facilitates LNG evaporation. The pressure increase in the self-pressurization experiment should be less than that in the field experiment under the same initial pressure and experimental time. However, the results were contrary to this expectation. This indicates that another effect of ship motion on pressurization development should be taken into consideration. The effect is that sudden changes in ship motion may cause pressure drops. As the accuracy of the pressure sensor was limited, the instantaneous pressure changes in the field experiment were predicted using Equation (1). The liquid temperature used to calculate the pressure was measured by the thermal sensor installed in the tank container. The results are shown in Figure 15.
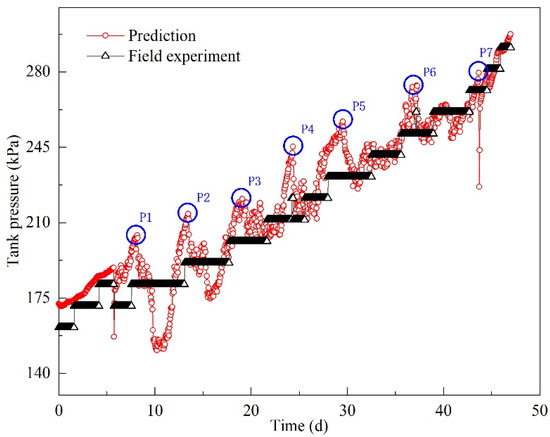
Figure 15.
Instantaneous pressure prediction in field experiments.
In Figure 15, the measured tank pressure increased stepwise. Even though predicted tank pressure showed a main trend of increasing, the pressure frequently fluctuated. The typical pressurization process for the first five days is of linearly increasing tank pressure. However, after that period the tank pressure fluctuates. By analyzing the variations in predicted pressure, similar pressure variations can be observed during the whole pressurization process; that is, the tank pressure increased to a peak value and then decreased. Significant pressure peaks are denoted by blue circles in Figure 15. The peak values are listed in Table 6. The range of depressurization was from 14.83 to 52.89 kPa and the duration of depressurization (from peak value to corresponding valley value) ranged from 1 to 12 h. As analyzed in the prototype experiment, the pressure decrease occurs mainly because heat transfer is enhanced by ship motion. However, the values of depressurization were higher than those in the prototype experiment. This phenomenon can be explained by findings from research conducted by Arndt et al. [22] and Himeno et al. [23]. The initial pressure has an impact on the depressurization value whereby higher initial pressures and more severe sloshing conditions lead to a larger range of depressurization. The initial pressures in the field experiment were peak values that were higher than those in the prototype experiment. As a result, the depressurization ranges are larger.
Table 6.
Summaries in significant pressure variations in field experiment.
3.2.2. Typical Pressure Variations
In order to investigate pressure variations, several typical periods of pressure development were carefully analyzed, with the results shown in Figure 16; the pressure was predicted at 1 h intervals.
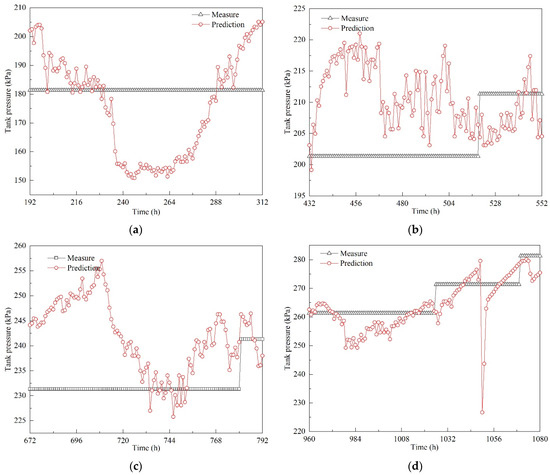
Figure 16.
Typical pressure variations in field experiment: (a) period 1: 192–312 h; (b) period 2: 432–552 h; (c) period 3: 672–792 h; (d) period 4: 960–1080 h.
In period 1 (192–312 h), depressurization began at the 197th hour. Tank pressure gradually decreased, and it reached its first valley value at the 200th hour. Then, the pressure fluctuated around 181 kPa. At the 234th hour, another depressurization process began until the pressure dropped to 155.74 kPa at the 237th hour. After two instances of depressurization, tank pressure gradually increased within 28 h (see Figure 16a). In period 2 (432–552 h), the pressure decreased within the 37th and 38th hour. Then, it fluctuated around 210 kPa (see Figure 16b). In period 3 (672–792 h), a longer process of depressurization was observed, and it took 12 h to drop from 256.98 to 238.17 kPa. Even though the depressurization was relatively small, the duration was much longer. The pressure continued to decrease to 226.99 kPa at the 734th hour; then, tank pressure increased gradually. In period 4 (960–1080 h), a clear increasing trend was observed. During pressurization, several instances of depressurization occurred. The variation ranges were quite small, except for the depressurization that took place during the 1049th to 1050th hour. The pressure dropped from 279.57 to 226.68 kPa.
From the above analysis, it can be concluded that tank pressure varies constantly during transportation due to continuous ship motion. Pressure increase is the main trend, and is accompanied by pressure decrease. Frequent and irregular ship motion causes pressure fluctuations. The pressure developments in Figure 16 clearly show the suppressive effect of ship motion on pressurization. The longest duration of depressurization may exceed 12 h. When pressure reaches a valley value it does not continue to decrease, because BOG generation is a continuous process. Therefore, increased BOG is generated under dynamic conditions. Moreover, depressurization results in temperature decrease in the liquid phase. The temperature difference between the liquid phase and the environment becomes larger, which causes more heat flux in the tank container. Therefore, the effect of depressurization caused by ship motion cannot be neglected when calculating or predicting the holding time.
3.2.3. Holding Time
The field experiment was conducted for 47 days. Based on the experimental data, polynomial fitting was used for regression. It was found that the results of fourth order polynomial fitting were consistent with the pressure variations measured in the field experiment. The fitting results are shown in Table 5 and Figure 17. The polynomial fitting equation can be expressed as
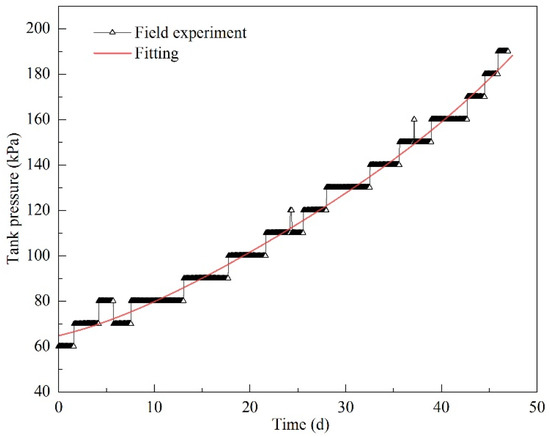
Figure 17.
Polynomial fitting results for pressurization in the field experiment.
The coefficient of determination is 0.98846, which indicates that the equation accurately predicts the pressurization.
Equation (11) was used to predict pressurization from 160 to 850 kPa. The results are shown in Figure 18, and the pressurization in the self-pressurization experiment is shown in Figure 18 for comparison. It can be clearly seen that the slope of the fitting curves became larger over time. This means that the speed of pressurization became faster with the increase in tank pressure. In the initial state, the tank pressure grew slower. With the increase in tank pressure, pressurization is accelerated. This phenomenon is consistent with the prototype experimental results (see Figure 12).
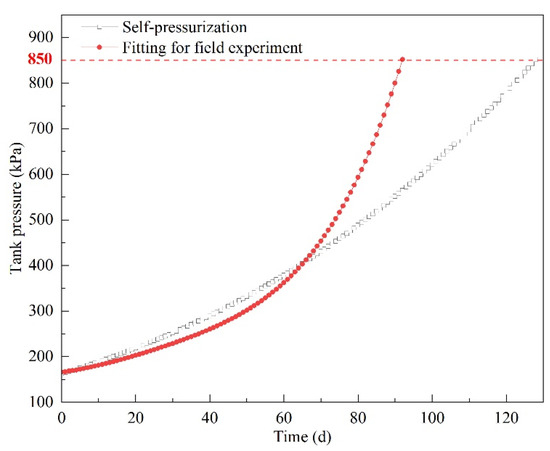
Figure 18.
Fitting results for pressurization from 160 to 850 kPa.
In Figure 18, the pressure in the field experiment was lower than in the self-pressurization experiment for the first 65 days. This phenomenon was consistent with the results of the field experiment and self-pressurization experiment. After 65 days, the pressurization process in the field experiment was predicted using Equation (11). The pressure increased faster in the field experiment. As a result, it took 92 days to reach the maximum allowable pressure (850 kPa), whereas it took 128 days in the self-pressurization experiment. As analyzed above, there are two effects of ship motion on pressurization. In the former period of pressurization, LNG temperature was low and the heat ingress from the environment was relatively high. With the increase in pressure, LNG temperature increased and heat ingress decreased. At this point, even though ship motion may cause depressurization the effect was weakened due to lower liquid temperature and heat ingress. Moreover, with the increase in liquid temperature the volume of liquid increases and the ullage volume decreases, which may weaken the effect of ship motion on depressurization. From a long-term perspective, ship motion shortens the holding time.
4. Discussion
Holding time is an important factor to assess the safety of transporting LNG in tank containers, and is considered as a reference indicator when creating shipping schedules. During transportation, the heat transfer in the tank container is enhanced and increased BOG is generated due to the ship motion; therefore, the tank pressure increases more rapidly. However, ship motion has the opposite effect on pressurization, whereby the liquid in the tank container sloshes due to ship motion and BOG is condensed due to liquid sloshing and heat transfer. Therefore, the pressure may decrease to an extent. Frequent ship motion during transportation increases the complexity of pressure development. In Figure 14 and Figure 18 it can be seen that pressurization rates increase in different experiments, and were found to increase more rapidly under the influence of ship motion. Therefore, conclusions can be drawn to the effect that depressurization is the dominant factor in the earlier stage of transportation, while the effect of evaporation facilitation predominates in the later stage.
As a result of safety concerns, the use of tank containers for LNG transportation is prohibited. The main concern is the probability of BOG discharge during transportation, which mainly occurs because the tank pressure exceeds the maximum allowable pressure. However, the shortest safe period of duration was found to be 87 days in the prototype experiment, which is a is conservative result given that the effect of depressurization was not considered. In the field experiment the predicted total holding time was 92 days, whereas in practice 47 days is considered a long period in marine shipping. Therefore, the holding times calculated or predicted in the experiments indicate that transporting LNG in tank containers is safe if the shipping process is adequately scheduled.
In this study, tank pressure was measured by a pressure sensor installed in the tank container for the field experiment. The accuracy of the pressure sensor was within 10 kPa, and the minimum measurement interval was 1 min. Therefore, the pressurization process was in stepwise fashion (see Figure 13). From the results analysis, it can be inferred that the pressure may vary within several seconds and the range of pressure drop may be less than 10 kPa when the ship motion suddenly changes. More detailed pressure variations could be obtained if the accuracy of the pressure sensor were improved. Pressure sensors with an accuracy within 0.1 kPa and measurement interval within 1 s are recommended in order to further study the detailed pressure variations responding to the sudden ship motion. Furthermore, the detailed ship motion during the 47 days of shipping during the field experiment was not recorded. The ship motion is different and irregular under different sea conditions, and thus the holding time would be different when the ship encounters different sea conditions. However, the trend of pressurization and the response of pressure to ship motion in the tank container have been discussed in the context of the field experiment. The results of the experiments conducted in this study can provide a good reference to study the safety of transporting LNG by tank containers.
5. Conclusions
The effect of ship motion on the pressurization and holding time of LNG in tank containers was characterized in this study through three experiments, namely, prototype, field and self-pressurization experiments. Prototype 40 ft LNG tank containers and multi-component LNG were used in the experiments. Several conclusions from this study are summarized as follows:
- The effect of ship motion on evaporation was studied. It was found that ship motion facilitates LNG evaporation due to heat transfer being enhanced under dynamic conditions. More severe ship motion causes increased BOG generation. However, the evaporation rate is very stable even under the most severe dynamic conditions. Tank pressure fluctuates with the motion of the ship. However, the pressure varies within a very small range when the tank container moves according to regular excitations. This indicates that even though the heat transfer may be enhanced by ship motion, dynamic thermal equilibrium is established inside the tank container.
- Two different effects of ship motion on pressure development were investigated. Ship motion causes liquid sloshing, which enhances the heat transfer between the liquid and environment. Increased BOG is generated, which causes pressure to increase faster than in the static state. On the other hand, the heat transfer at the vapor–liquid interface is enhanced, which causes BOG condensation and tank pressure to decrease. These two effects are present simultaneously during transportation. However, the different effects predominate at different stages. It was found that the effect of depressurization predominates at the early stage of transportation and the effect of pressurization at the later stage. Therefore, the speed of pressure build-up is slower at the early stage, which was 65 days in this study, while it is faster at the later stage. However, from a long-term perspective, it takes a shorter time to reach the maximum allowable pressure when tank containers are subjected to dynamic conditions.
- Holding times in different conditions were analyzed. The initial and final pressure were 160 and 850 kPa. It was shown that the holding time is shortened under dynamic conditions. In the prototype experiment, the holding times in dynamic states were 93 and 87 days, respectively, shorter than in the static case (106 days). The calculated results are conservative because the depressurization effect was not taken into consideration. In the field experiment, the predicted holding time was 92 days. For short-term shipping, ship motion may have a beneficial effect on transportation safety because it may reduce the pressurization rate. For long-term shipping (longer than 60 days, for example) tank pressure may increase more rapidly at a later stage. However, the holding time is longer than 87 days in the most severe condition examined in this study, which is sufficiently long for long-term shipping.
- The safety of transporting LNG in tank containers was assessed based on experimental studies. The experimental results in this study demonstrate that ship motion facilitates LNG evaporation in the tank container. During transportation, ship motion may either facilitate or prevent pressurization. The holding times calculated in this study show that LNG can be safely kept in the tank containers for both short- and long-term shipping. The holding times when subjected to dynamic conditions can meet the demands of shipping schedules.
Based on the above analysis, it was found that transporting LNG in tank containers is a safe and feasible transportation mode. This approach makes it easier to achieve a multi-mode transportation combination by using tank containers. With the application of tank containers, natural gas could be supplied to a greater number of regions, potentially facilitating the earlier realization of a low-carbon energy future.
Author Contributions
Conceptualization, P.Y. and Q.Y.; writing—original draft preparation, P.Y.; writing—review and editing, Y.Y. and S.W.; supervision, Q.Y. All authors have read and agreed to the published version of the manuscript.
Funding
This work was funded by the China Classification Society, Wuhan Rules and Research Institute, grant no. 2016-10.
Data Availability Statement
Not applicable.
Conflicts of Interest
The authors declare no conflict of interest.
Nomenclature
| pressure | |
| ΔP | pressure difference |
| temperature | |
| , , | coefficients in the Antoine equation |
| evaporation rate | |
| daily LNG mass loss | |
| total LNG mass | |
| heat flux | |
| daily heat flux | |
| density | |
| volume | |
| enthalpy | |
| latent heat of vaporization | |
| holding time | |
| revised holding time | |
| dimensionless time | |
| dimensionless pressure | |
| filling ratio | |
| dimensionless heat flux | |
| critical pressure | |
| specific heat |
References
- World Greenhouse Gas Emissions in 2018. Available online: www.wri.org/data/world-greenhouse-gas-emissions-2018 (accessed on 10 November 2021).
- Statistical Review of World Energy. Available online: https://www.bp.com/content/dam/bp/business-sites/en/global/corporate/pdfs/energy-economics/statistical-review/bp-stats-review-2021-full-report.pdf (accessed on 10 November 2021).
- Lee, C.Y.; Song, D.P. Ocean container transport in global supply chains: Overview and research opportunities. Transp. Res. Part B Methodol. 2017, 95, 442–474. [Google Scholar] [CrossRef]
- Kwak, D.H.; Heo, J.H.; Park, S.H.; Seo, S.J.; Kim, J.K. Energy-efficient design and optimization of boil-off gas (BOG) re-liquefaction process for liquefied natural gas (LNG)-fuelled ship. Energy 2018, 148, 915–929. [Google Scholar] [CrossRef]
- Miana, M.; Del Hoyo, R.; Rodrigálvarez, V. Comparison of evaporation rate and heat flow models for prediction of Liquefied Natural Gas (LNG) ageing during ship transportation. Fuel 2016, 177, 87–106. [Google Scholar] [CrossRef]
- Miana, M.; Hoyo, R.D.; Rodrigálvarez, V.; Valdés, J.R.; Llorens, R. Calculation models for prediction of Liquefied Natural Gas (LNG) ageing during ship transportation. Appl. Energy 2010, 87, 1687–1700. [Google Scholar] [CrossRef]
- Migliore, C.; Tubilleja, C.; Vesovic, V. Weathering prediction model for stored liquefied natural gas (LNG). J. Nat. Gas Sci. Eng. 2015, 26, 570–580. [Google Scholar] [CrossRef] [Green Version]
- Pellegrini, L.A.; Moioli, S.; Brignoli, F.; Bellini, C. LNG technology: The weathering in above-ground storage tanks. Ind. Eng. Chem. Res. 2014, 53, 3931–3937. [Google Scholar] [CrossRef]
- Huerta, F.; Vesovic, V. A realistic vapour phase heat transfer model for the weathering of LNG stored in large tanks. Energy 2019, 174, 280–291. [Google Scholar] [CrossRef]
- Huerta, F.; Vesovic, V. Analytical solutions for the isobaric evaporation of pure cryogens in storage tanks. Int. J. Heat Mass Trans. 2019, 143, 118536. [Google Scholar] [CrossRef]
- Migliore, C.; Salehi, A.; Vesovic, V. A non-equilibrium approach to modelling the weathering of stored Liquefied Natural Gas (LNG). Energy 2017, 124, 684–692. [Google Scholar] [CrossRef]
- Lee, D.; Cha, S.; Kim, J.; Kim, J.; Kim, S.; Lee, J. Practical prediction of the boil-off rate of independent-type storage tanks. J. Mar. Sci. Eng. 2021, 9, 36. [Google Scholar] [CrossRef]
- Miana, M.; Legorburo, R.; Díez, D.; Hwang, Y.H. Calculation of Boil-Off Rate of Liquefied Natural Gas in Mark III tanks of ship carriers by numerical analysis. Appl. Therm. Eng. 2016, 93, 279–296. [Google Scholar] [CrossRef]
- Huerta, F.; Vesovic, V. CFD modelling of the isobaric evaporation of cryogenic liquids in storage tanks. Int. J. Heat Mass Trans. 2021, 176, 121419. [Google Scholar] [CrossRef]
- Lin, Y.; Ye, C.; Yu, Y.; Bi, S. An approach to estimating the boil-off rate of LNG in type C independent tank for floating storage and regasification unit under different filling ratio. Appl. Therm. Eng. 2018, 135, 463–471. [Google Scholar] [CrossRef]
- Roh, S.; Son, G. Numerical study of natural convection in a liquefied natural gas tank. J. Mech. Sci. Technol. 2012, 26, 3133–3140. [Google Scholar] [CrossRef]
- Niu, W.C.; Lin, J.C.; Ju, Y.L.; Fu, Y.Z. The daily evaporation rate test and conversion method for a new independent type B LNG mock-up tank. Cryogenics 2020, 111, 103168. [Google Scholar] [CrossRef]
- He, T.; Feng, D.; Liu, L.; Wang, X.; Jiang, H. CFD simulation and experimental study on coupled motion response of ship with tank in beam waves. J. Mar. Sci. Eng. 2022, 10, 113. [Google Scholar] [CrossRef]
- Wright, M.D.; Gambioli, F.; Malan, A.G. CFD based non-dimensional characterization of energy dissipation due to vertical slosh. Appl. Sci. 2021, 11, 10401. [Google Scholar] [CrossRef]
- Gabl, R.; Davey, T.; Ingram, D.M. Roll motion of a water filled floating cylinder—Additional experimental verification. Water 2020, 12, 2219. [Google Scholar] [CrossRef]
- Trimulyono, A.; Hashimoto, H.; Matsuda, A. Experimental validation of single- and two-phase smoothed particle hydrodynamics on sloshing in a prismatic tank. J. Mar. Sci. Eng. 2019, 7, 247. [Google Scholar] [CrossRef] [Green Version]
- Arndt, T.; Dreyer, M.; Behruzi, P.; Winter, M.; VanForeest, A. Cryogenic sloshing tests in a pressurized cylindrical reservoir. In Proceedings of the 45th AIAA/ASME/SAE/ASEE Joint Propulsion Conference & Exhibit, Denver, CO, USA, 2–5 August 2009. [Google Scholar]
- Himeno, T.; Sugimori, D.; Uzawa, S.; Watanabe, T.; Nonaka, S. Heat exchange and pressure drop enhanced by violent sloshing. In Proceedings of the 46th AIAA/ASME/SAE/ASEE Joint Propulsion Conference & Exhibit, Nashville, TN, USA, 25–28 July 2010. [Google Scholar]
- Himeno, T.; Umemura, Y.; Sugimori, D.; Uzawa, S.; Watanabe, T. Investigation on heat exchange enhanced by sloshing. In Proceedings of the 45th AIAA/ASME/SAE/ASEE Joint Propulsion Conference & Exhibit, Denver, CO, USA, 2–5 August 2009. [Google Scholar]
- Liu, Z.; Cai, H.; Feng, Y.; Liu, Y.; Li, Y. Thermodynamic characteristic in a cryogenic storage tank under an intermittent sloshing excitation. Int. J. Hydrogen Energy 2020, 45, 12082–12094. [Google Scholar] [CrossRef]
- Liu, Z.; Li, Y.; Jin, Y. Pressurization performance and temperature stratification in cryogenic final stage propellant tank. Appl. Therm. Eng. 2016, 106, 211–220. [Google Scholar] [CrossRef]
- Wang, L.; Li, Y.; Jin, Y.; Ma, Y. Experimental investigation on pressurization performance of cryogenic tank during high-temperature helium pressurization process. Cryogenics 2015, 66, 43–52. [Google Scholar]
- Grotle, E.L.; Æsøy, V. Dynamic modelling of the thermal response enhanced by sloshing in marine LNG fuel tanks. Appl. Therm. Eng. 2018, 135, 512–520. [Google Scholar] [CrossRef]
- Grotle, E.; Æsøy, V. Numerical simulations of sloshing and the thermodynamic response due to mixing. Energies 2017, 10, 1338. [Google Scholar] [CrossRef] [Green Version]
- Dimopoulos, G.G.; Frangopoulos, C.A. A dynamic model for liquefied natural gas evaporation during marine transportation. Int. J. Thermodyn. 2008, 11, 123–131. [Google Scholar]
- Qu, Y.; Noba, I.; Xu, X.; Privat, R.; Jaubert, J. A thermal and thermodynamic code for the computation of boil-off gas—Industrial applications of LNG carrier. Cryogenics 2019, 99, 105–113. [Google Scholar] [CrossRef]
- Sun, C.; Li, Y.; Han, H.; Zhu, J.; Wang, S. Effect of compound sloshing conditions on pressure drop and heat transfer characteristics for FLNG spiral wound heat exchanger. Appl. Therm. Eng. 2019, 159, 113791. [Google Scholar] [CrossRef]
- Gu, Y.; Ju, Y.L.; Chen, J.; Shi, Z.J. Experimental investigation on pressure fluctuation of cryogenic liquid transport in pitching motion. Cryogenics 2012, 52, 530–537. [Google Scholar] [CrossRef]
- Gu, Y.; Ju, Y. Investigation on the periodically oscillating pressure characteristics of the flow in the rolling pipe. Ocean Eng. 2012, 55, 1–9. [Google Scholar] [CrossRef]
- Saleem, A.; Farooq, S.; Karimi, I.A.; Banerjee, R. A CFD simulation study of boiling mechanism and BOG generation in a full-scale LNG storage tank. Comput. Chem. Eng. 2018, 115, 112–120. [Google Scholar] [CrossRef]
- Adom, E.; Islam, S.Z.; Ji, X. Modelling of boil-off gas in LNG tanks: A case study. Int. J. Eng. Technol. 2010, 2, 292–296. [Google Scholar]
- Wei, Z.J.; Ruan, S.L.; Chen, X.D.; Luo, S.; Yue, Q.J. An experimental investigation of liquid sloshing impact load in a large-scaled prismatic tank. In Proceedings of the 24th International Ocean and Polar Engineering Conference, Busan, Korea, 15–20 June 2014. [Google Scholar]
- Faltiinsen, O.M. Sea Loads on Ships and Offshore Structures, 2nd ed.; Cambridge University Press: Cambridge, UK, 1998; p. 8. [Google Scholar]
- Perry, R.H.; Green, D.W. Perry’s Chemical Engineers’ Handbook, 7th ed.; McGraw-Hill International: Singapore, 1997. [Google Scholar]
- Qin, T.; Shi, Y. Revision and validation of ventless storage model of cryogenic fluid. CIESC J. 2018, 69, 89–94. [Google Scholar]
Publisher’s Note: MDPI stays neutral with regard to jurisdictional claims in published maps and institutional affiliations. |
© 2022 by the authors. Licensee MDPI, Basel, Switzerland. This article is an open access article distributed under the terms and conditions of the Creative Commons Attribution (CC BY) license (https://creativecommons.org/licenses/by/4.0/).