Article

Sustainable Entrepreneurship: Good Deeds, Business, Social and Environmental Responsibility in a Market Experiment

DISEI, Università degli Studi di Firenze, Via delle Pandette 32, 50127 Florence, Italy
*
Author to whom correspondence should be addressed.
Sustainability 2022, 14(6), 3577; https://doi.org/10.3390/su14063577
Submission received: 28 December 2021 / Revised: 8 March 2022 / Accepted: 15 March 2022 / Published: 18 March 2022
(This article belongs to the Special Issue Social Entrepreneurship, Hybrid Organizations and Sustainability)

Abstract

:
We study how commitment of entrepreneurs to sustainability practices might effectively improve the social and environmental impact of market competition. To this end we devised a market experiment in which profit maximization and socially and environmentally concerned behavior were both potential goals of producers. Our subject pool included two distinct types of students having different prosocial attitudes. The two types adopted significantly different strategies in the treatment group, where producers could contribute to a positive externality, whereas they behaved similarly in the control group, where the only objective was profit maximization. Subjects who were ex-ante more prosocial chose to produce with more focus on the positive externality than their counterparts. However, they failed to actually deliver a larger social impact as a consequence of the market outcome. We conclude that producers often commit to social responsibility, even though well-meaning conducts do not necessarily beget equally good outcomes.

1. Introduction

Responsible production and consumption is one core Sustainable Development Goal (SDG 13) of the Agenda 2030 and at the base of the transition process towards a sustainable future (economic, social and environmental). Sustainable entrepreneurship plays a central role in this transition process [1]. In general, simultaneously engaging in social/environmental and economic value creation is a complex task, made more challenging by stakeholder accountability for social value creation and shareholder accountability for financial performance [2]. The recent proliferation of literature reviews reflects the ongoing, lively debate on sustainable entrepreneurship (see among others [3,4,5,6,7,8,9,10,11]). This literature is often related to social entrepreneurship, environmental entrepreneurship and hybrid organizations more broadly [10]. Indeed, Ali [3] underlines that, “Although the sustainable development literature indistinguishably links the environmental and social aspects, still a significant amount of literature focuses on either one or the other”. The present paper is linked to the stream of literature that focuses on the value creation and impact of sustainable entrepreneurship. Sustainable entrepreneurship business models have to balance different combinations of environmental and social scope and a focus on the mass market and profitability (see e.g., [12]). By pursuing this balance, sustainable entrepreneurs face higher complexity and ambiguity with respect to those entrepreneurs aiming at creating economic value only [13]. Further, quoting Weller and Ran [14], “social entrepreneurship is a paradoxical phenomenon wherein seemingly incompatible elements such as business and social logics coexist”. Sustainable entrepreneurs therefore need combining social/environmental value and profitability in some way. Several studies, within this stream, focus on the behavioral aspect of the entrepreneur [3] and on the dependence of sustainable entrepreneurship on entrepreneurs’ behavioral tendency [15] especially in the decision-making process to pursue sustainability. As emphasized in literature reviews, sustainable entrepreneurs can play a catalyst role by converting a vision of sustainability into market reality. However, Fellnhofer et al. [5] identify this as one of the gaps present in the literature. In their review, sustainability is an integral part of entrepreneurship but a key issue remains to be addressed, namely, ”Under what conditions can entrepreneurship simultaneously create economic growth, while advancing social and environmental objectives?” The authors of [6], for instance, raise the related question of how individuals successfully balance the economic, social and environmental dimensions in organizations. Moreover, these authors identify game theory applications as relevant instruments to shed light on causes and consequences of (particular dimensions) of sustainable entrepreneurship and highlight a gap in quantitative researches methods due to a small number of published applied work. In other words, the impact of sustainable entrepreneurship is not sufficiently covered by the literature (see e.g., [8]).
In many contexts individual behavior does not comply with the homo economicus paradigm, which represents individuals as perfectly rational and self-interested (see e.g., [16]) but rather reveals a prosocial and environment-friendly attitude. Indeed, individuals make charitable contributions, engage in voluntary pro-environment actions, donate blood, and sometimes agree to pay higher prices in order to consume responsibly. For this reason we would like to investigate whether prosocial and environmental motivations can also influence the choices of individuals involved in the role of entrepreneurs by making them forego part of their profit for the greater good.
In the theoretical literature there have only been a few instances where firms, or entrepreneurs, were not profit maximizers. Baron [17] offers one of the first attempts to give a theoretical rationale for the behavior of a social entrepreneur undertaking corporate social responsibility (CSR henceforth) activities at a financial loss. More recently, the authors of [18] have developed a model in which firms can have different degrees of CSR, based on the relative weight of profits and social objectives within their utility function.
Several studies analyze the nature and the behaviors of social entrepreneurs (see [10] for a systematic literature review): the results, however, are still too limited regarding the overall understanding of the market mechanisms and empirical analysis seems inconclusive with regard to the actual motivations of social entrepreneurship. A further difficulty is that we can expect significant self-serving bias in answers from direct interviews of managers or entrepreneurs, to overstate their social attitudes and improve their perceived reputation, which parallels what happens with consumers and the well documented gap in terms of stated and actual purchasing decisions when there are socially and environmentally related issues (see [19] for both empirical and survey-based literature regarding social consumerism).
For this reason, as suggested by [20], incentivized experiments may be better suited to examine the actual motivations behind sustainable entrepreneurship as well as, more in general, to study strategic behavior in market environments (see for example [21,22]). An alternative choice would have been that of a conjoint analysis; see e.g., [23,24].
A few experimental studies in recent years have dealt with the phenomena of ethical product differentiation, sustainable entrepreneurship and corporate social responsibility (see [25,26,27,28,29]. These papers share a very similar framework, oftentimes featuring markets with sellers and consumers interacting for a predetermined number of rounds. In each round, sellers must determine a price for a good that has a social attribute (i.e., a positive externality): usually, the higher such attribute of a good, the higher the resulting donation to a charity organization once that good is sold. In [25], the externality of a transaction does not involve a donation to a charity organization but rather a higher payoff for a third player who has no active role in the experiment. A similar design is also adopted in [27,30] both of which focus on fair wages and feature a third player who plays the role of a seller’s employee. In [26] the positive externality consists in the production of a public good shared among all players. In all of these works, irrespective of the particular nuances in the design of the effect of externalities, consumers observe the price and, in some cases, have knowledge of the social quality of each good (and this information may be more or less credible). When all consumers have chosen which goods to buy, each agent is informed of the market outcome and the game is repeated for various rounds.
These papers take advantage of the experimental market to investigate how institutional framework and information setting can affect market outcomes and the behavior of individual actors. For instance, Rode et al. [28] study the relevance of what buyers know about the additional costs related to a specific social attribute. Georgantzis and Vasileiou, and Valente [26,29] focus on the effect of ethical differentiation on market outcomes, consumer behavior and profits. Bartling et al. [25] analyze the influence of increased competitive pressure and the impact of the information about the social quality of each proposal. Both Bartling et al. and Feicht et al. [25,31] consider cases in which a product’s social attribute has varying efficiency in terms of external impact. Feicht et al. [31], in particular, analyze the influence of the commitment power of sellers to donate the initially announced amount. Meanwhile, Etilé and Teyssier [32] go into the issue of credibility in more depth by comparing treatments where sellers have different signaling devices in order to make the social aspects of their proposal credible for consumers. Pigors and Rockenbach [27] investigate the relevance of the kind of information buyers have on the wage received by workers involved in the production of goods sold on the market.
These experiments, however, are typically designed so that there is no way to determine whether producers’ strategies are consistent with standard profit maximization or rather if producers strategies imply genuine willingness to sacrifice profits in the social interest. Indeed, in (all of) the experiments previously cited, market outcomes are the result of the interaction between the social attitudes of both producers and consumers. In order to fully understand the impact of sellers, this aspect needs to be disentangled from the potential heterogeneity of buyers. To do so, while we retain a similar framework in order to analyze sustainable entrepreneurship strategies, we simulate the demand side of the market by means of an algorithm. Such an algorithm is inspired by standard models of vertically differentiated markets, where consumers are “heterogeneously” willing to pay for the quality of the goods, see e.g. [33,34]. This framework has already been adopted by many authors investigating various issues related to CSR and sustainability, see [18,35,36,37,38,39]. In turn, this type of behavior emerges in experimental papers with human - as opposed to computerized - consumers, such as in [26,29]. To our knowledge, the present study is the first to focus exclusively on the attitudes of producers when production entails some social and environmental externality which in turn affect market shares.
Our design inquires the extent to which experimental subjects playing as producers behave as profit maximizers when their choices may have a social impact, marked by a donation to a charity organization that is selected by the individual producer from a predetermined list before the start of the experiment. We contrast the result against a control treatment where the game was the same as in the main treatment, with the only exception that the social dimension of quality was dropped. In that case, the algorithm represents consumers interested in quality per se and market transactions have no external impact.
A further issue we study is whether (and how) subjects with different prosocial and environmental attitudes adopt different strategies and affect the market outcome accordingly. To this end we selected an ad hoc sample of economics majors, recruiting students from two rather different areas of economic studies: Business and Management and Development Studies. Indeed, as we detail below, the two groups of students are quite different, on average, in terms of their attitudes and aspirations. Two recent related papers, Sana et al. and Tu et al. [40,41], study the entrepreneurial attitudes of students: our experimental context however allows us to analyze the effects of potentially different attitudes on actual choices and market outcomes).
Our findings can be summarized as follows. When production may have positive externalities (i.e., in our main treatment), players with higher prosocial and environmental attitudes display greater willingness to contribute to such positive externalities and often ended up earning less, whilst no such differences emerge when such externalities are removed (i.e., in the control). The evidence as to whether prosocial producers generate more positive social/environmental impact is ambiguous. Indeed market competition appeared to act as a countervailing force with respect to the intention to trigger positive impacts. In other words, the drive toward sustainable outcomes is to some extent offset by competitive pressure.

2. Experimental Design and Procedures

2.1. Design

The experiment consists of a simple incentivized duopolistic market environment over ten periods followed by a questionnaire about demographic background, views on consumer ethics and behavioral traits. Subjects play the role of firms, offering a differentiated good for which they have to decide price and quality. The demand side of the market is played by an algorithm.
The experiment involves two between-subject treatments: a main treatment (T) and a control treatment (C). In T, the good’s quality serves two different purposes. Firms can differentiate their products by choosing different quality levels. Besides this, if market share is positive, then quality determines a donation to a charity (which is chosen by the subject during the registration phase). As a result the subjects can choose quality levels in order to both obtain higher profits through product differentiation and/or contribute to the charitable cause. In C, there are no charities involved and only the product differentiation motive remains. In both treatments, each experimental market consists of two sellers and an artificial continuum of buyers. Each pair of randomly matched sellers stick together throughout the 10 periods (fixed matching). Each pair of subjects can be thought of as an isolated universe, identifying a specific market that cannot be influenced by what happens in other pairs/markets. In fact, the subjects of a specific pair are not informed of the choices made by the subjects of other pairs, since such choices have no impact on the outcome of their own market. Earnings are expressed in experimental currency units (ECU).
Each period seller i chooses quality q i and price p i for the supplied good, subject to the constraint 0 q i p i 400 . Likewise, seller j simultaneously and independently chooses q j and p j so that 0 q j p j 400 . Once qualities and prices are selected, an algorithm representing the demand side (see Section 2.1.1 below for the details) determines the market share of each seller, s i and s j . Each player then receives information about both firms’ posted prices and qualities as well as their own market share and resulting payoffs in the current period. At the beginning of the session each seller is informed that their own market share is positively correlated to both the quality of their good and the price of their competitor’s good, and negatively correlated to the price of their good and to the quality of the competitor’s good. Instructions and screen-shots can be found in Supplementary S1.
The profit of seller i is π i = ( p i q i ) s i and it is therefore computed as markup (price minus quality which represents a cost) times market share. Similarly, the other seller gets π j = ( p j q j ) s j .
In T, the instructions specify that each subject has to choose the social/environmental quality of a fictitious good, thus illustrating that such aspect is a potential attribute of the production process (e.g., the use of less polluting material or the absence of child labor in the supply chain). In every round, the choices of seller i give rise to a positive social impact I i = 1.5 q i s i where the use of a multiplicative factor, 1.5 in this case, is a standard way of making donations more appealing with respect to the option of maximizing earnings during the experiment and then donating part of them to a charity when the experiment is over. Conversely, in C, quality is described as inherent to the intrinsic characteristics of the good, with no reference to any external impact.
Participants are aware that at the end of the market game, 1 out of the 10 rounds is randomly drawn to determine the actual earnings (equal to π in that specific round) and, in T, the donations corresponding to I in that round. This choice is meant to prevent possible wealth-effect and/or risk-related distortions of the incentive scheme. (The authors of [42] shows evidence of the influence of an income effect on the experimental choices in a repeated auction laboratory game where all rounds are paid. See [43] for evidence that subjects appear more risk seeking in multiple lotteries when all decisions are paid. See also [44] for a more detailed discussion of pros and cons of alternative payments schemes.) The ECUs are changed into Euros at the end of the experiment at a ratio of 1 Euro for every 20 ECUs.

2.1.1. Market Shares

The algorithm defining the buyers’ behavior and determining the market shares between the two sellers works as follows. Let q 1 < q 2 and p 1 , p 2 be the choices of the two sellers. Then the proportion of consumers in the market served by the two sellers, i.e., market shares s 1 , s 2 will be computed as:
s 1 = 0 2 3 p 2 p 1 q 2 q 1 1 i f i f i f p 1 > p 2 p 2 p 1 q 2 q 1 0 , 3 2 p 2 > p 1 + 3 2 q 2 q 1 a n d s 2 = 1 s 1
The rationale behind this rule is that it reproduces the outcome of a vertically differentiated duopoly facing consumers with an heterogeneous willingness to pay for quality (for a similar setup, see e.g., [45,46]). In particular, suppose there is a unit mass of consumers, whereby consumer k has preferences over price and quality that can be represented by the utility function
U k q , p = v + θ k q p
where θ k is a random variable uniformly distributed in [ 0 , 3 2 ] and measures the willingness to pay for quality and v is a constant, large enough to ensure that U is always positive on the [ 0 , 3 2 ] support (these assumptions imply that no consumer is willing to pay for quality more than its possible social impact, which we set to 1.5, and the median consumer willingness to pay equals exactly half of the social impact). In this context the proportion of consumers preferring good 1 that sells at p 1 and has quality q 1 over good 2 selling at p 2 with quality q 2 > q 1 is determined by the indifferent consumer. There is indeed a threshold θ ^ = p 2 p 1 q 2 q 1 such that consumer k prefers good 1 to good 2 if and only if θ k < θ ^ .
When q 1 = q 2 instead
s 1 = 0 1 2 1 i f i f i f p 1 > p 2 p 1 = p 2 p 1 < p 2 a n d s 2 = 1 s 1
When qualities are equal, the shares are entirely determined by the price difference. When both qualities and prices are equal, the market is equally split between the two firms, so their market share is exactly one half.

2.2. Recruitment

Subjects were recruited from the School of Economics and Management at the University of Florence. The choice of using students as surrogates for business people in experiments simulating business problems is often questioned in the literature (see, e.g., [47]). An early survey of the literature on this topic (see [48]) finds that students’ attitudes are not the same as those of business people; however, research shows that students and non-students respond similarly in decision-making tasks. Despite the fact that no general consensus has been reached on the topic, more recent examples of research work suggesting (with some distinctions) that students can be adequate substitutes for managers in decision-making tasks can be found in [49,50,51]. We invited BSc and MSc students from either Business and Management (BM) or Development Studies (DS) (BM and DS students were recruited both at the bachelor and at the master level, so one BSc and one MSc degree courses were involved for both the business and the development studies tracks, with around 10% of MSc’s students in both cohorts) because we were interested in selecting individuals whose prosocial/pro-environment attitudes were likely to be heterogeneous. Indeed we want to study, among other things, the possible effect of different prosocial attitudes of entrepreneurs on market outcomes and sustainability. To do this, we follow [52] suggesting that the external validity of student-based research could be improved by employing subjects with demographic and interest profiles similar to the population to whom researchers wish to generalize (the interesting debate that ensued is further developed in [53,54]). The AlmaLaurea Survey on Graduates Profiles shows that these two populations hold diverse views along several dimensions and the answers collected in our final questionnaire (in Supplementary S2) corroborates the presence of such differences (see Section 4.2 for a more thorough discussion). Hence, we are led to assume that DS students are more inclined toward sustainability, while BM students are more profit-oriented.
We canvassed every student from the School of Economics and received positive feedback from more than 400 students, with 158 from the Business and Management, 81 from the Development Studies and the remaining from Economics, Statistics and Finance. The initial announcement was extended to all the students in the School of Economics in order to avoid revealing any unnecessary information to the students—most notably the fact that their field of study was an important element of our research. We randomly chose and invited 146 students from the list of respondents—73 from BM courses and 73 from DS—to take part in the experiment. Given our interest in studying how the outcome of the market game was influenced by the subjects’ field of study, we planned a specific procedure in order to ensure a mixed composition of pairs in each session. Table 1 reports the main data related to participation in the experiment with details about the groups’ composition in each treatment.

2.3. Implementation

The experimental sessions were computerized using oTree (see [55]) and were conducted at the University of Florence’s Behavioural and Experimental Economics Laboratory (BEELab) between November 2015 and October 2018. In the T sessions, students received general instructions upon arrival at the registration desk and were asked to choose a charity they wanted to support in case some additional money should emerge during the experiment as a consequence of their own choices. Participants were asked to choose one of six charities—be it international, national or local—with activities ranging from environmental protection to international cooperation and social intervention. The list included in particular: “UNHCR”, “Oxfam”, “Greenpeace”, “Manitese” (an Italian organization involved in international sustainable development cooperation), “Fondazione ANT” and “Noi per voi Onlus” (associations supporting families coping with serious health problems). The C sessions, by contrast, received only general instructions.
At the beginning of the experiment the market game instructions were shown to each participant on the computer screen. A researcher read them aloud and students could ask for clarification at any time. Each subject then had to answer three control questions devised to improve understanding of the game rules and logic. Each session started with the market game and was followed by one or more unrelated experimental activities for a total duration between 80 and 100 min, comprising a final questionnaire covering personal data and behavioral attitudes. The choices made in the main treatment resulted in an average per-subject amount of EUR 7.3 of experimenters’ money being donated to charities, while the average gain was EUR 11.5 per subject. At the end of each session, cash payments were made to students in a separate room by the administrative staff in order to preserve anonymity. The donations to the charities were made on-line and receipts for the bank transfers were e-mailed to all the participants.

3. Theory Predictions and Hypotheses

The design of our experiment follows the previous literature, notably e.g., [31]. Note that in the literature quoted in the introduction and related to the experimental analysis of market games with social externality, a design similar to ours is typically used, with the only exception that real consumers, rather than an exogenous algorithm, determine the market shares of each producer. The context in which experimental subjects must simultaneously choose price and quality resembles a standard economic model of a vertically differentiated duopoly (see [34,45]). In such a context, it is not easy to predict the choices of the duopolists because of the presence of the strategic interaction: the best choice for a firm is always influenced by the choices of its rival. According to economic theory, a reasonable predictor of the overall outcome in a situation of strategic interaction is the Nash equilibrium, i.e., the case in which all parties involved in the strategic interdependence choose their best strategy given the strategies adopted by all other parties. However, it has been shown in the economic literature that in a vertical differentiation model if firms are profit maximizers and choose quality and price simultaneously then there are no Nash equilibria (see [34,56] p. 151). However, while it is reasonable to expect subjects in C to maximize their own payoff, subjects in T could be motivated by the desire to contribute to a charity, besides their self-interest.
In order to understand how a different objective function could affect the players’ strategies, we studied the best reply functions of a profit-maximizing firm and that of a nonprofit firm that is trying to maximize its positive impact on the social welfare (the details and the results are contained in Supplementary S3). In general, the market share of a specific firm is a decreasing function of its markup, hence a nonprofit firm interested only in its positive impact on the social welfare will try to maximize its market share by imposing a zero markup. On the other hand, a profit maximizing firm will always go for a strictly positive markup in order to optimally balance the gains associated to every unit sold with the total quantity of sales. Each duopolist will strategically choose the level of quality to maximize its objective function given the choices of its rival. It is worth noting that higher quality implies higher market share, but for a profit-maximizing firm, quality is a cost to be minimized, while for a nonprofit firm, quality is a goal to be maximized. For this reason, as shown in Supplementary S3, a nonprofit firm will, on average, choose a higher quality than a profit-maximizing firm (more specifically, on the basis of their best reply strategies, nonprofit firms always set quality within the interval between 200 and 400 ECUs, while profit maximizing firms always choose a quality level smaller than 1000/3 ECUs). We prove that when a profit maximizing firm plays a nonprofit one, a Nash equilibrium exists according to which the former chooses a null quality and a price equal to 200, while the latter sets both the quality and the price at the maximum level of 400. Conversely, no Nash equilibrium in pure strategies exists when both competitors are nonprofit firms maximizing social impact (as well as when they are are profit maximizers, as already established in the literature).
In fact, our expectation is that most actual experimental subjects fall somewhere in between exclusive profit maximization and social impact maximization. While analyzing the strategic interaction between subjects who variously balance both objectives is quite difficult (and beyond the scope of this work), and knowledge of the best reply functions for these extreme cases helps suggesting the likely behavior of subjects in the experiment. For example, we can predict that individuals who tend to emphasize social impact over private earnings will set a higher quality and a lower markup with respect to more self-interested individuals.
The presence of possible charity donations should induce subjects having strong prosocial/pro-environment inclinations to produce with higher quality, on top of the strategic motive induced by vertical differentiation. Such effect should not be quite as visible in less prosocial subjects. On the other side, when the quality only holds a strategic value, there is no reason to assume that a different behavior could stem from differences in prosociality. Hence, we expect that BM and DS quality choices be different in T but not in C.
Hypothesis 1a (H1a).
In T, DS students will choose higher quality than BM students.
Hypothesis 1b (H1b).
In C, quality will not significantly differ among BM and DS students.
On a different perspective, the markup (or equivalently, the price) plays a key strategic role in bringing forth market shares and hence the market outcome. For subjects who set the same markup, the one with higher quality would get just a 1 / 3 market share (because higher quality and same markup imply higher price). So in order to give rise to a significant social impact, beside going for high quality, a subject should forgo part of the possible profit by setting markup below that of the competitor. Instead, it is less clear what a clever strategy would be for a profit maximizing agent because an increase in the markup could result in a loss of market share, the optimal choice also depending on the competitor’s choice. So, we again expect that in T, DS students settle on lower markup than BM students. No differences should instead emerge in C.
Hypothesis 2a (H2a).
In T, DS students will choose lower markup than BM students.
Hypothesis 2b (H2b).
In C, markup will not significantly differ among BM and DS students.
The basic idea is that all subjects in C should simply attempt to maximize their private earnings and hence display statistically similar behavior. Conversely, substantial differences between BM and DS are to be expected in T: we conjecture that individuals who are more concerned with sustainability will offer a comparatively greater quality and require a smaller markup.
While our focus is mostly on differences in prosocial/pro-environment attitudes of the two cohorts of students, and how they affect the experimental outcomes, it is also possible that differences in observed behavior between T and C could emerge regardless of students’ type. In particular, when quality has a social byproduct we might expect all or most subjects to ascribe some importance to the external impact of their decisions within the market (social responsibility), thus increasing the overall average quality of their fictional production with respect to the scenario where no such byproduct exists. If this were true we should observe higher quality on average in T than in C.
Hypothesis 3 (H3).
The average quality will be higher in T than in C.
Last, concerning the variables that measure the outcomes of the market game, namely, profits and social impact, it is less obvious to have clear expectations, since the effect of the subjects’ decisions might be possibly mitigated (or intensified) by market forces. In principle, differences on quality and markup may spill over into profits and social impact but, given the key role played by the market shares, it is difficult to anticipate the outcome of the interaction between subjects. We discuss these and other aspects of market interplay in the next section.

4. Results and Discussion

This section presents the experimental data and performs several checks of whether the hypotheses of Section 3 are supported. All of the following analyses were performed by dropping the first observation, given the lack of actual trial periods in the experiment.
The following tables show descriptive statistics for the most relevant variables. Table 2 suggests that all descriptive variables are only marginally higher in T. Figure 1 shows averages at each round. Table 3 shows the results of regressions of the main variables on the current round number, to check for the presence of time trends, with clustered-robust standard errors (at group level). Note that there is no trend in profits and impact, whilst quality has no relevant trend in T but it is decreasing in C. The remaining variables, price and markup, display a slightly decreasing trend in both T and C.
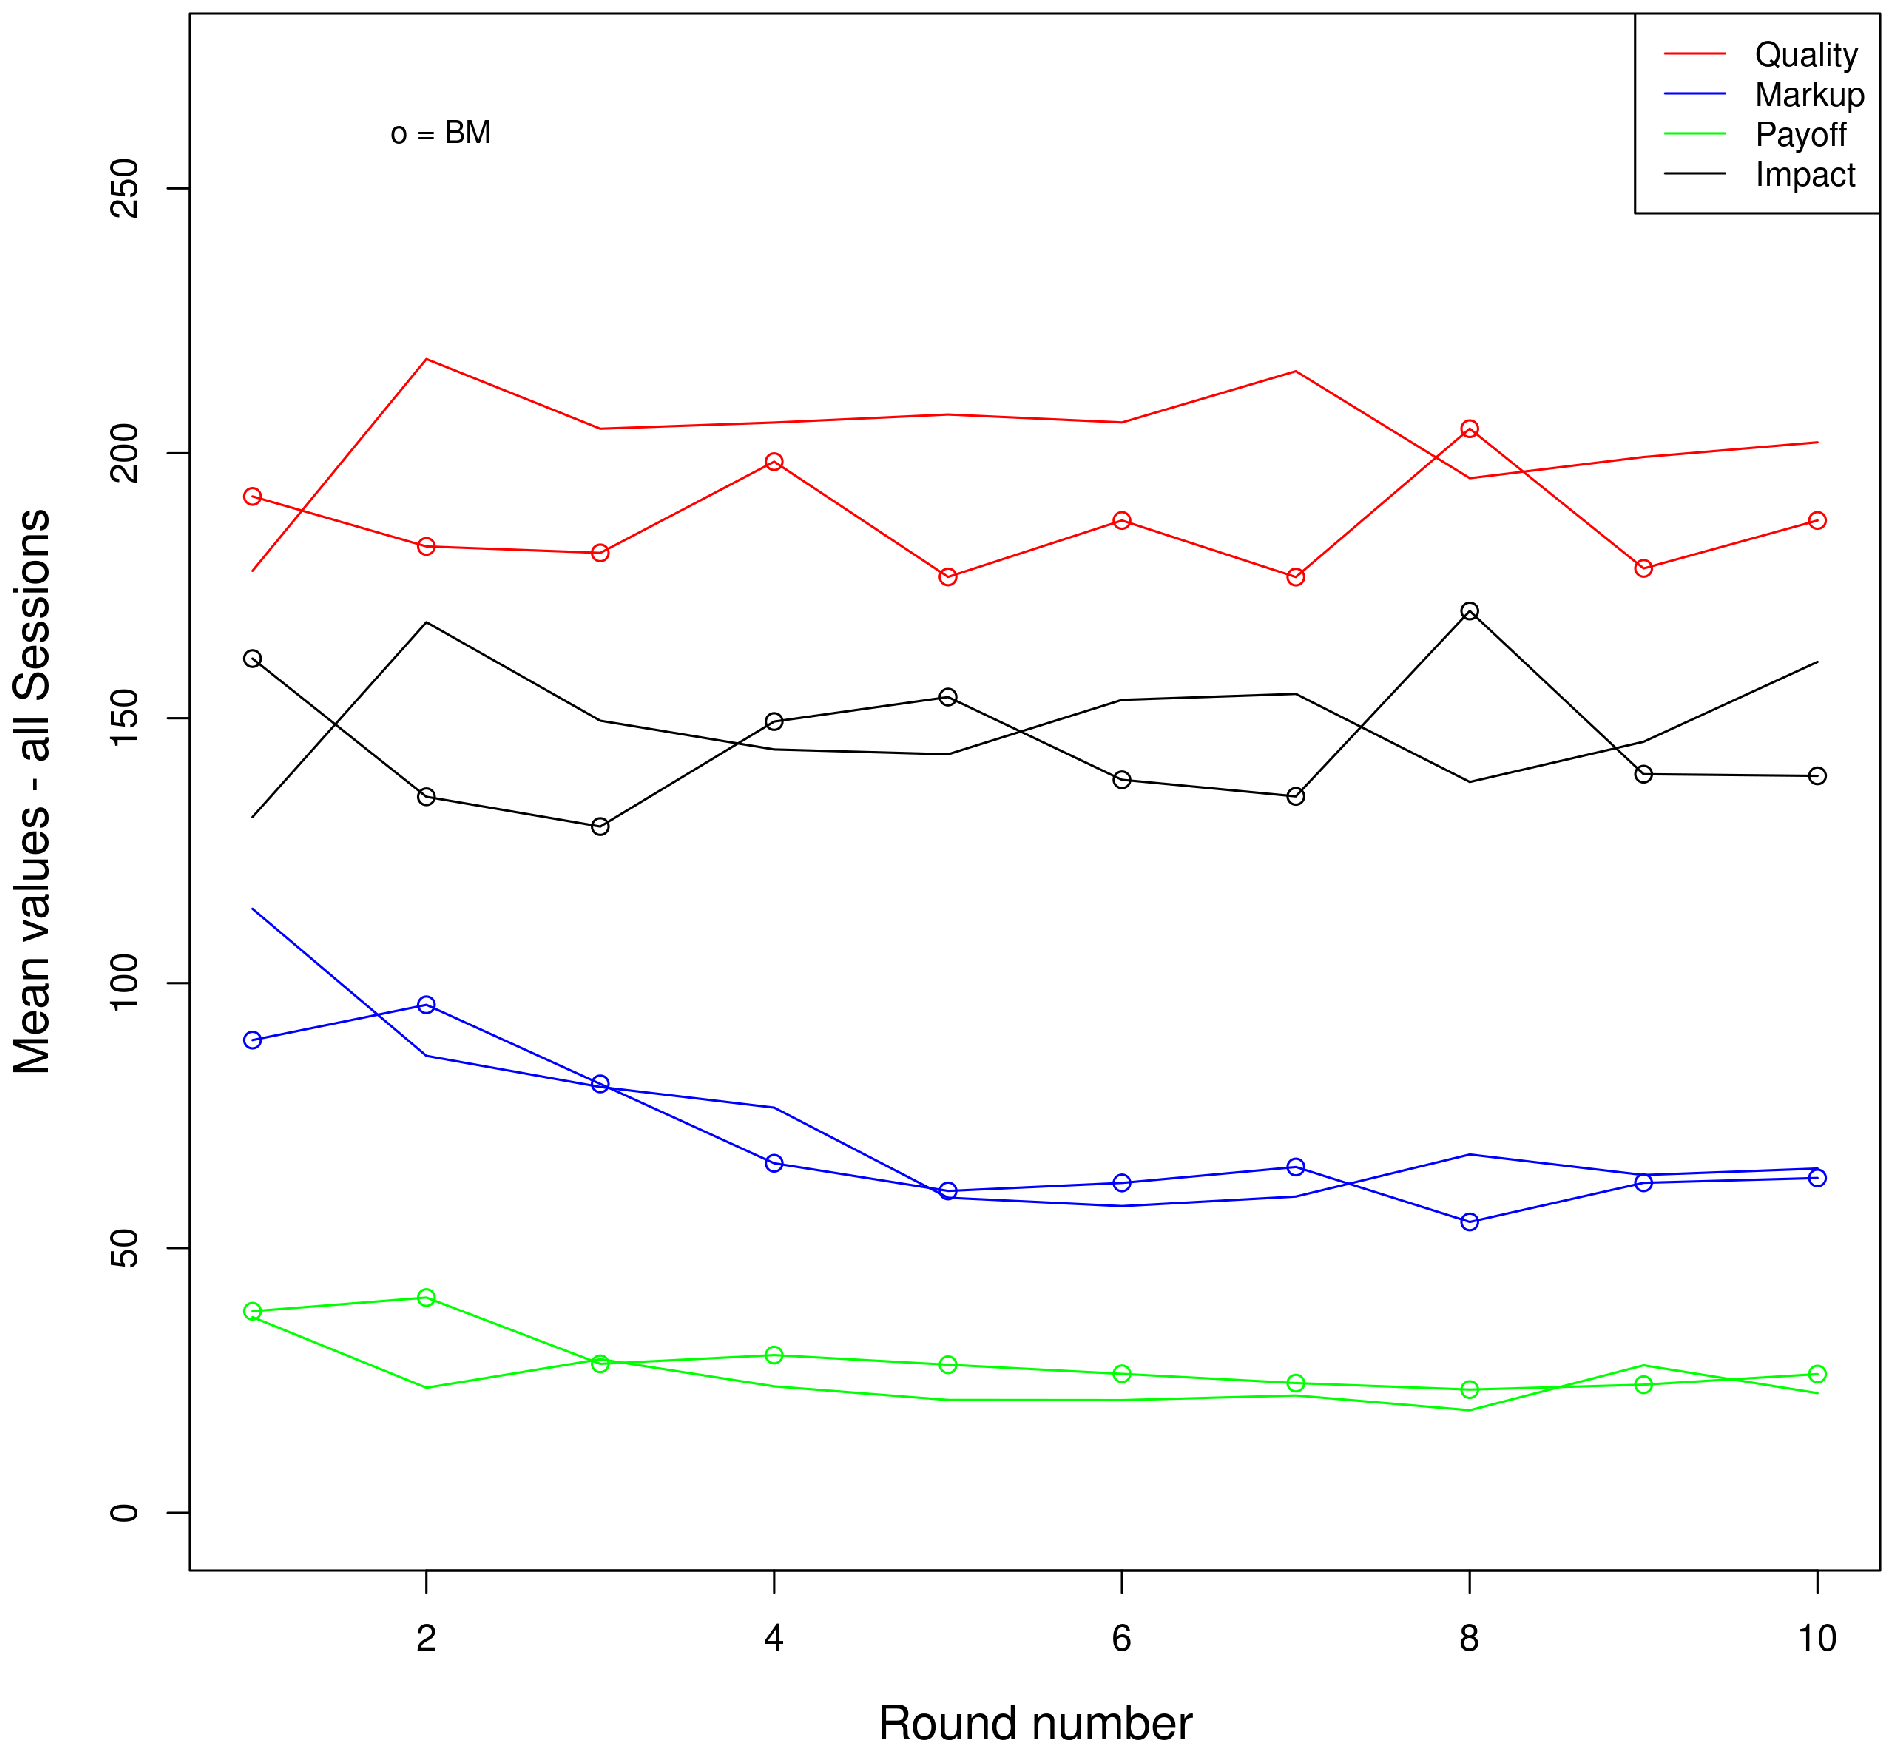
Figure 2 focuses only on T, showing the average choices of DS and BM students. We can observe that, with the only exception of the first round, BM students choose on average a quality level lower than DS ones, but this fact in some rounds does not entail a lower average social impact. Conversely, the two groups of students appear to behave on average very similarly with respect to the markup and they achieve almost the same profit on average at each round.
In order to validate the statements postulated by hypotheses 1 and 2 we resort to regressions. Given the panel structure of our data, whereby dependence (and heterogeneity) may arise both within each pair of matched subjects and at the subject level, we ran regressions of the observed qualities on the dummy DS (equal to 1 for DS students), on the gender and age of the subject, including fixed effects for the specific couple ID which the subject was part of and then computing clustered standard errors at subject ID level.
Table 4, its even-numbered columns in particular, shows that DS and BM behaved similarly in C. Indeed, there is no significant difference in terms of their main strategic variables, i.e., quality and markup (the sixth column shows that the two groups achieve also similar results given that their profits are not statistically different). This result supports H1b and H2b and constitutes evidence that the two groups of experimental subjects cannot be told apart when the only plausible objective is the maximization of earnings.
The odd-numbered columns in Table 4, on the contrary, show some differences in the behavior of DS and BM in T. More specifically, DS students on average set a higher quality than BM students, while no significant differences arise in terms of the markup they set. The former result is consistent with H1a while H2a is not borne out by the data.
Interestingly, if we look at the variables concerning the outcomes, profit and social impact, we obtain different results. Indeed, albeit DS students on average set a higher quality, the difference between DS and BM students in terms of social impact is not statistically significant. As a consequence, DS and BM are clearly different in their intentions with respect to the social impact, but not so much in terms of their actual outcomes. A reversed pattern can be observed in the other two variables: while no significant differences arise in terms of markup, profits are nonetheless higher among BM students than they are among DS students. In this case DS and BM do not seem to differ in their intentions, but they do in terms of actual outcomes.
These relationships—between quality and social impact and between markup and profits—can appear paradoxical, but they are coherent with (and possibly a consequence of) the fundamental mechanism underlying market shares in our experiment. Indeed, given the calibration of the algorithm determining the market shares, when players set a similar markup, the player who picks the higher quality (hence a higher cost) will achieve a lower market share (around 1 / 3 of the whole market). Consequently, given the above mentioned statistics, choices over quality and markup may have placed, on average, DS students at a disadvantage. This is supported by the data, showing that BM students attained larger market shares than DS students (about 55% vs. 45% on average in mixed groups of one BM and one DS student). Whether this prominence was due to superior strategic abilities of BM students, to DS students failing to identify the trade-off between quality and markup needed to hold on to market shares, or simply was the straightforward consequence of heuristics focusing on setting the quality while leaving the markup at a “reasonable” level, it is hard to tell.
However, according to these results, in the experimental market context we designed and for the specific subject pool we used, good intentions proved insufficient to warrant good outcomes. Delivering a larger social impact required to secure a significant market share, failing which the choice of a high quality level remained inconsequential in terms of triggering the positive externality.
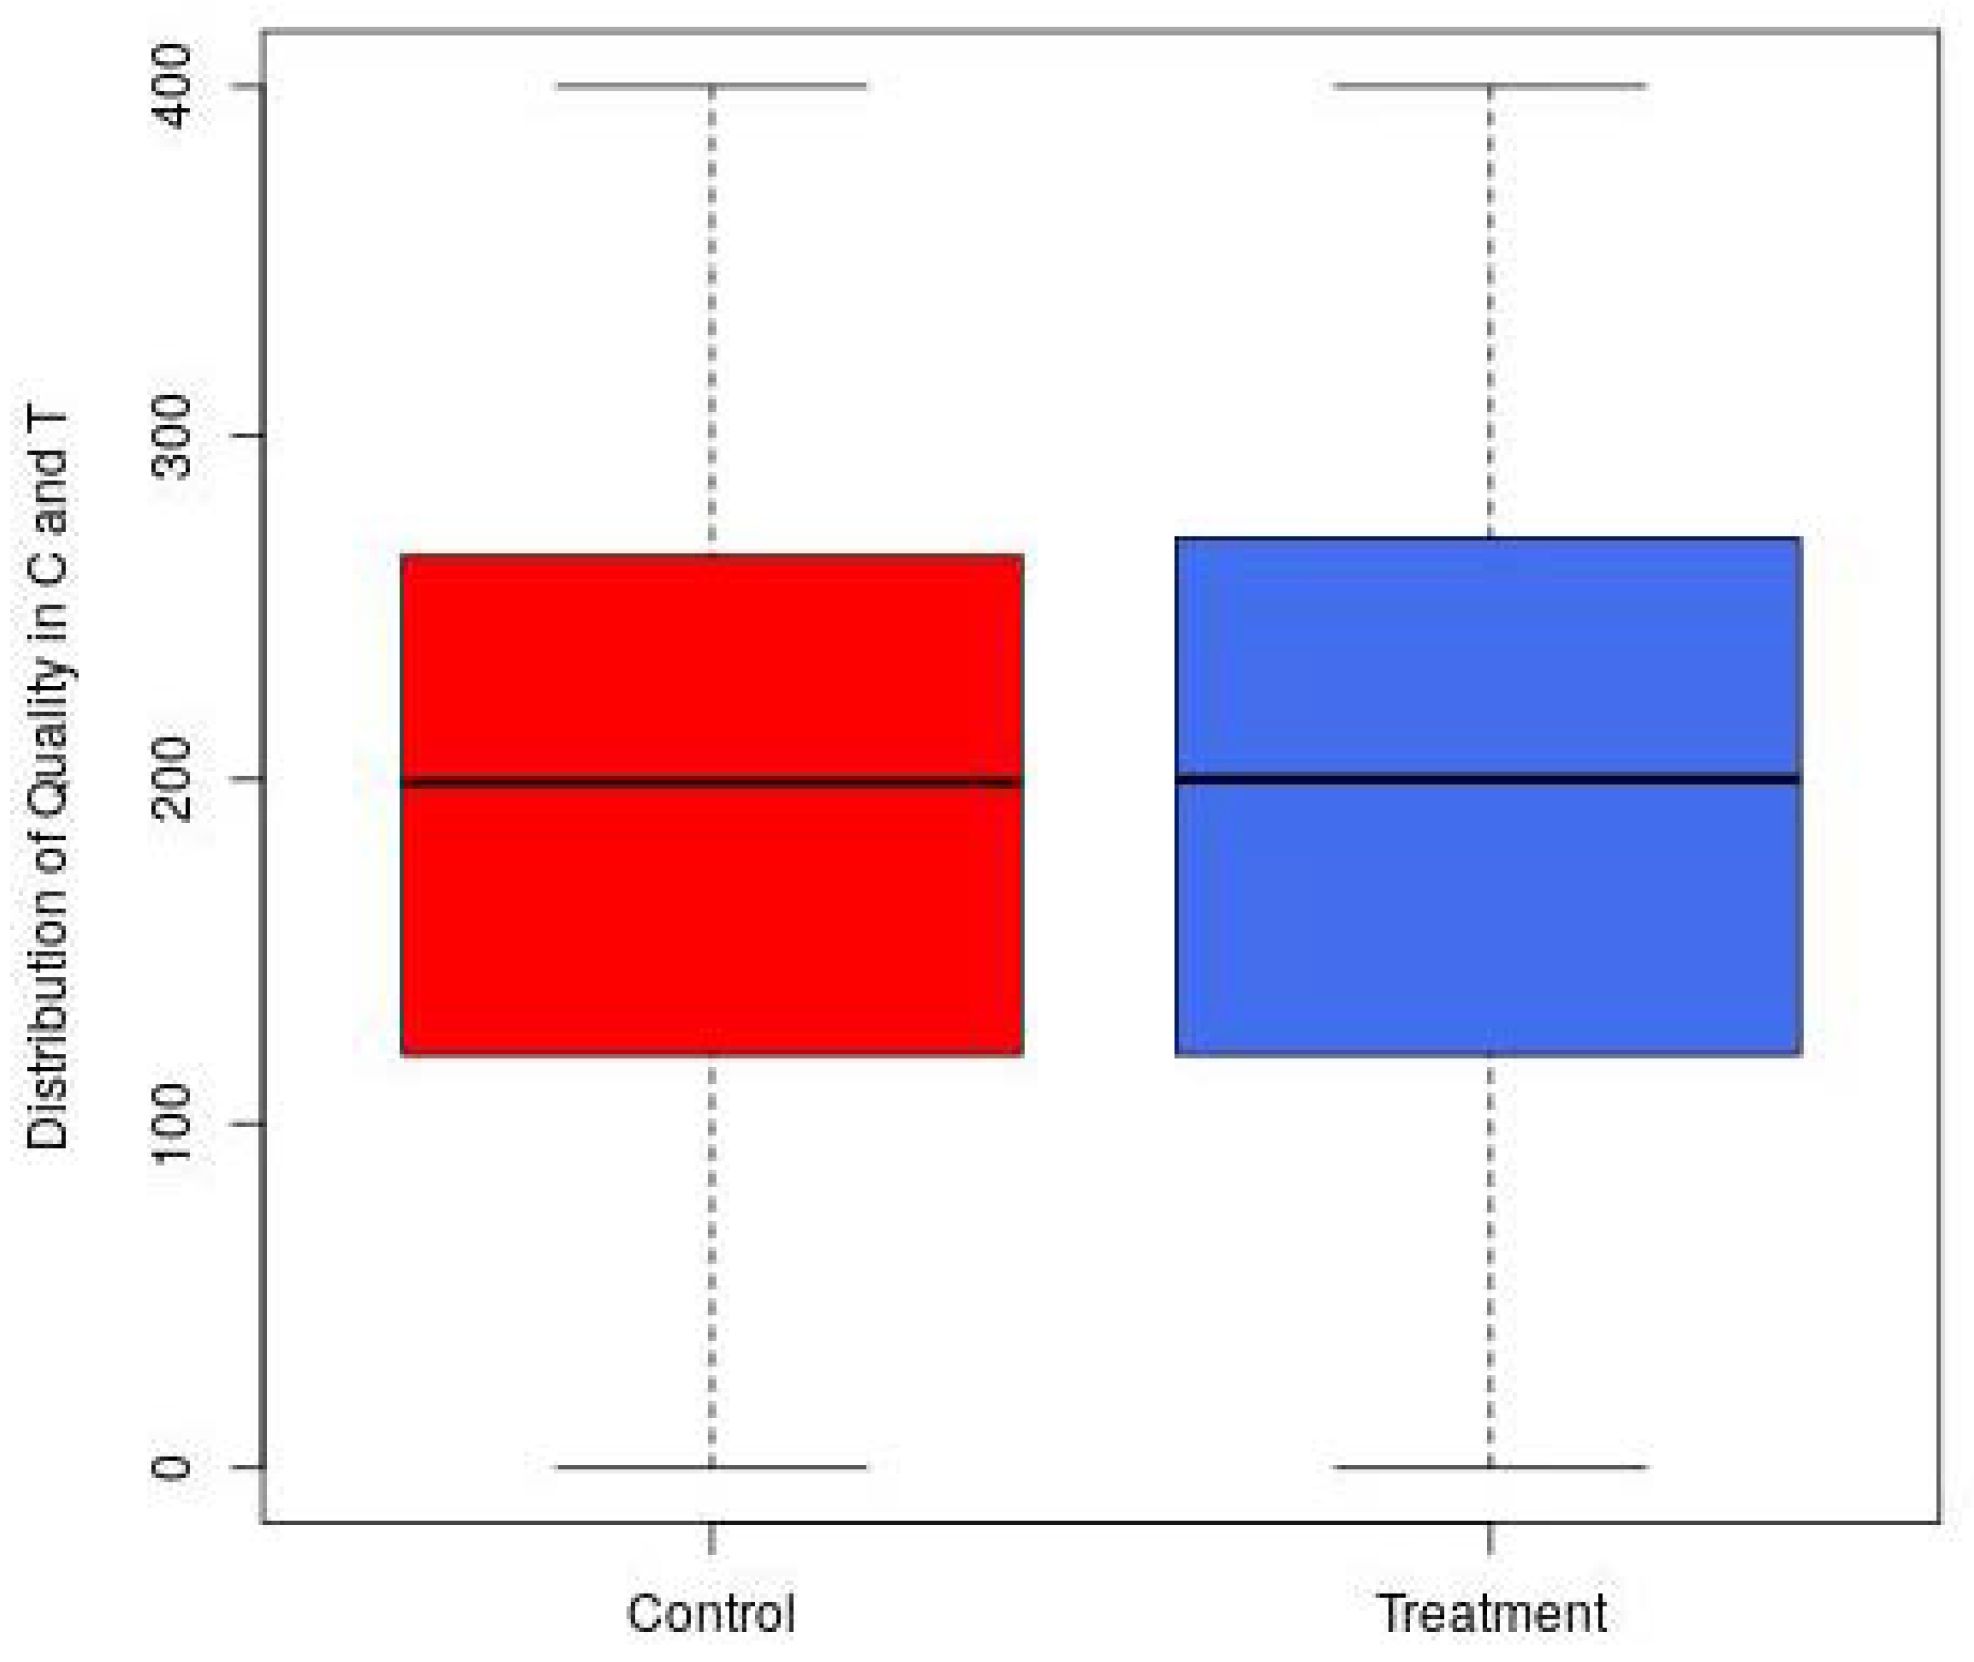
Concerning H3, Figure 3 shows that the distributions of the level of quality chosen by players are very similar in C and T, (p-value = 0.53 in a Wilcoxon rank sum test) which suggests that players do not choose a statistically different level of quality, on average, between the two treatments: the presence of a social impact as a byproduct of the quality of the good in T, bears no impact on the absolute level of the quality chosen on average by players as a whole; it does, however, have an effect on the positioning of subjects with different social attitude. Indeed, in T, DS students choose higher quality (in line with H1a).
Further insights on different behaviors of DS and BM students in T can be gained by looking at the influence of the types of counterparts with which the subjects happened to be matched. Each couple could be Homogeneous, when both subjects were from the same field of study, or Mixed. Interestingly, such circumstance, though unobservable for the subjects, affected their behavior. Indeed, Table 5 shows that while homogeneous groups of DS or BM did not differ significantly in terms of quality, in mixed groups DS subjects chose a higher quality level than BM. Conversely, in homogeneous groups, DS subjects set a lower mark-up, and achieved lower profit than BM, whereas in mixed groups two types did not differ in terms of mark-up, and DS subjects obtained a slightly lower profit than BM. Finally, the variable DS fails to have a significant influence on the social impact. There is evidence, therefore, that H1a fits the observed behavior in mixed groups quite well, while in homogeneous groups we find stronger evidence of H2a.
These results seem to be consistent with theoretical predictions in suggesting that the heterogeneity of objective functions in mixed groups pushes individual choices towards more differentiation of quality, relaxing competition and allowing higher mark-up irrespective of type of subject. In any case, as previously remarked, when firms set a similar mark-up then whoever provides larger quality ends up with a smaller market share and hence lower profits. On the other hand, focusing on homogeneous groups, the association between being a DS and lower mark-up and profits, can be interpreted as a signal of more willingness (relative to BM) to forego individual interest to achieve social impact, which, given the constraints placed by the market mechanism, they failed to deliver: so H3 is not supported. Again, in the specific experimental setting, larger quality and willingness to renounce profits were not sufficient to generate significant social impact.
In the next section, we look further into the data, in order to identify the existence of adjustment patterns in the subjects’ choices round after round and whether such patterns vary between DS and BM students and/or between T and C.

4.1. Learning and Adjustment

In this experiment players need setting price and quality levels consistent with their objective function, while also taking into account the expected outcome of the interaction of their choices with their rival’s in terms of market share. Given the complexity of the strategic environment, we expect agents to rely, to some extent, on observable data from previous interactions, as revealed by the information supplied to subjects after each round about the price and the quality level chosen by each player. Actually, all the previous game history may affect subjects’ choices at any specific round: we only considered the previous round for the sake of simplicity and because after each round players received information regarding that round only. There is a rather well-established literature, within the framework of multi-agent Cournot models, that investigates the adjustment of agents’ choices between rounds and that points out the use of certain heuristics (see [57,58,59]). In particular the heuristics that emerge are adaptive learning (in which one plays the best response to the choices of others in the previous round), imitation (in which one replicates the behavior of rivals), and trial-and-error (players adjusts the choice variable and observe the effect on profit, keeping pace and direction of adjustment in case of positive effect on their own payoff, reversing the direction in the opposite case). In our context, adaptive learning is not applicable because no tool was available to calculate the best response (as is the case in some experiments described in the literature). There is instead scope for the imitation and trial-and-error components. In order to capture the existence of such adjustment patterns in the choice variables we ran regressions (summarized in Table 6) to model the variation in a specific choice between the current and the previous round ( Δ q u a l i t y t and Δ m a r k u p t ). To account for the imitation heuristics the regressors include the observed differences, in the previous round, between choices of subject and competitor. In particular, d q u a l i t y t 1 equals 1, 0 or −1 according to whether, the previous round, the competitor had set quality higher, equal or lower than the player. So there is imitation when the estimated coefficient for this variable is positive. The variable s i g n ( Δ q u a l i t y t 1 ) × s i g n ( Δ p r o f i t t 1 ) is a trial-and-error component whereby previous adjustments are gauged against the corresponding effect on profit, and it is equal to 1 if the signs of the two variations agree, −1 if they disagree and 0 whenever one of them is 0. A positive estimated coefficient signals that changes in payoff reinforce the adjustment pattern. We also distinguish the adjustment patterns of BM and DS students including in each regression the interaction term of each variable and the dummy DS, since we care for the existence (and sign) of possible differences between DS and BM. The other regressors have similar meaning.
Both heuristics are statistically significant for quality and markup adjustment in both C and T (with the sole exception of the trial-and-error component in quality adjustment in C). In contrast no differences are observed between DS and BM, with one exception: in quality adjustment in T, DS mimic the rival less than BM (which does not happen in C). The results are also consistent with our findings of Section 4. Indeed, DS students making—in T—less pronounced adjustments in the direction of the rival is again suggestive of a difference in behavior between DS and BM in T only.
In the following subsection we use data from the final questionnaire in order to validate the distinction between BM and DS students as a meaningful proxy of prosociality within our subject pool.

4.2. Evidence from the Questionnaire on Sustainability Attitudes

The analyses carried out in this paper address the issue of whether subjects with different prosocial attitudes behave differently in our experimental setting. The specific subject pool studied here was selected assuming that the prosocial motivations were strongly associated with the field of study and specifically would differ starkly between students enrolled in Business and Management, and Development Studies. Such choice is supported by evidence from the literature showing that individual differences in motivation (which can be either prosocial or more achievement oriented) play a role in undergraduate degree choice (see e.g., [60]). Besides this, concerning the specific population from which our subject pool was sampled, in a survey administered just before graduation (see https://www.almalaurea.it/en/universita/indagini/laureati/profilo (accessed on 12 October 2020), whose data we averaged over the years 2015 to 2019), students were asked to reveal the most important aspects while searching for a job. BM students mainly focus on earnings and career possibilities ( 68 % and 81 % , respectively), whereas much less importance is attached to the social utility of their future job ( 23 % ). The opposite happens with DS students, for whom the social utility of their future job ( 65 % ) is most important, while placing less emphasis on earnings and career opportunities ( 38 % and 46 % respectively).
In light of these figures, we have assumed being a DS or BM student to be a good proxy for their prosocial attitude. In order to check the robustness of this assumption with regard to our specific sample, we included several questions in our post-experiment questionnaire.
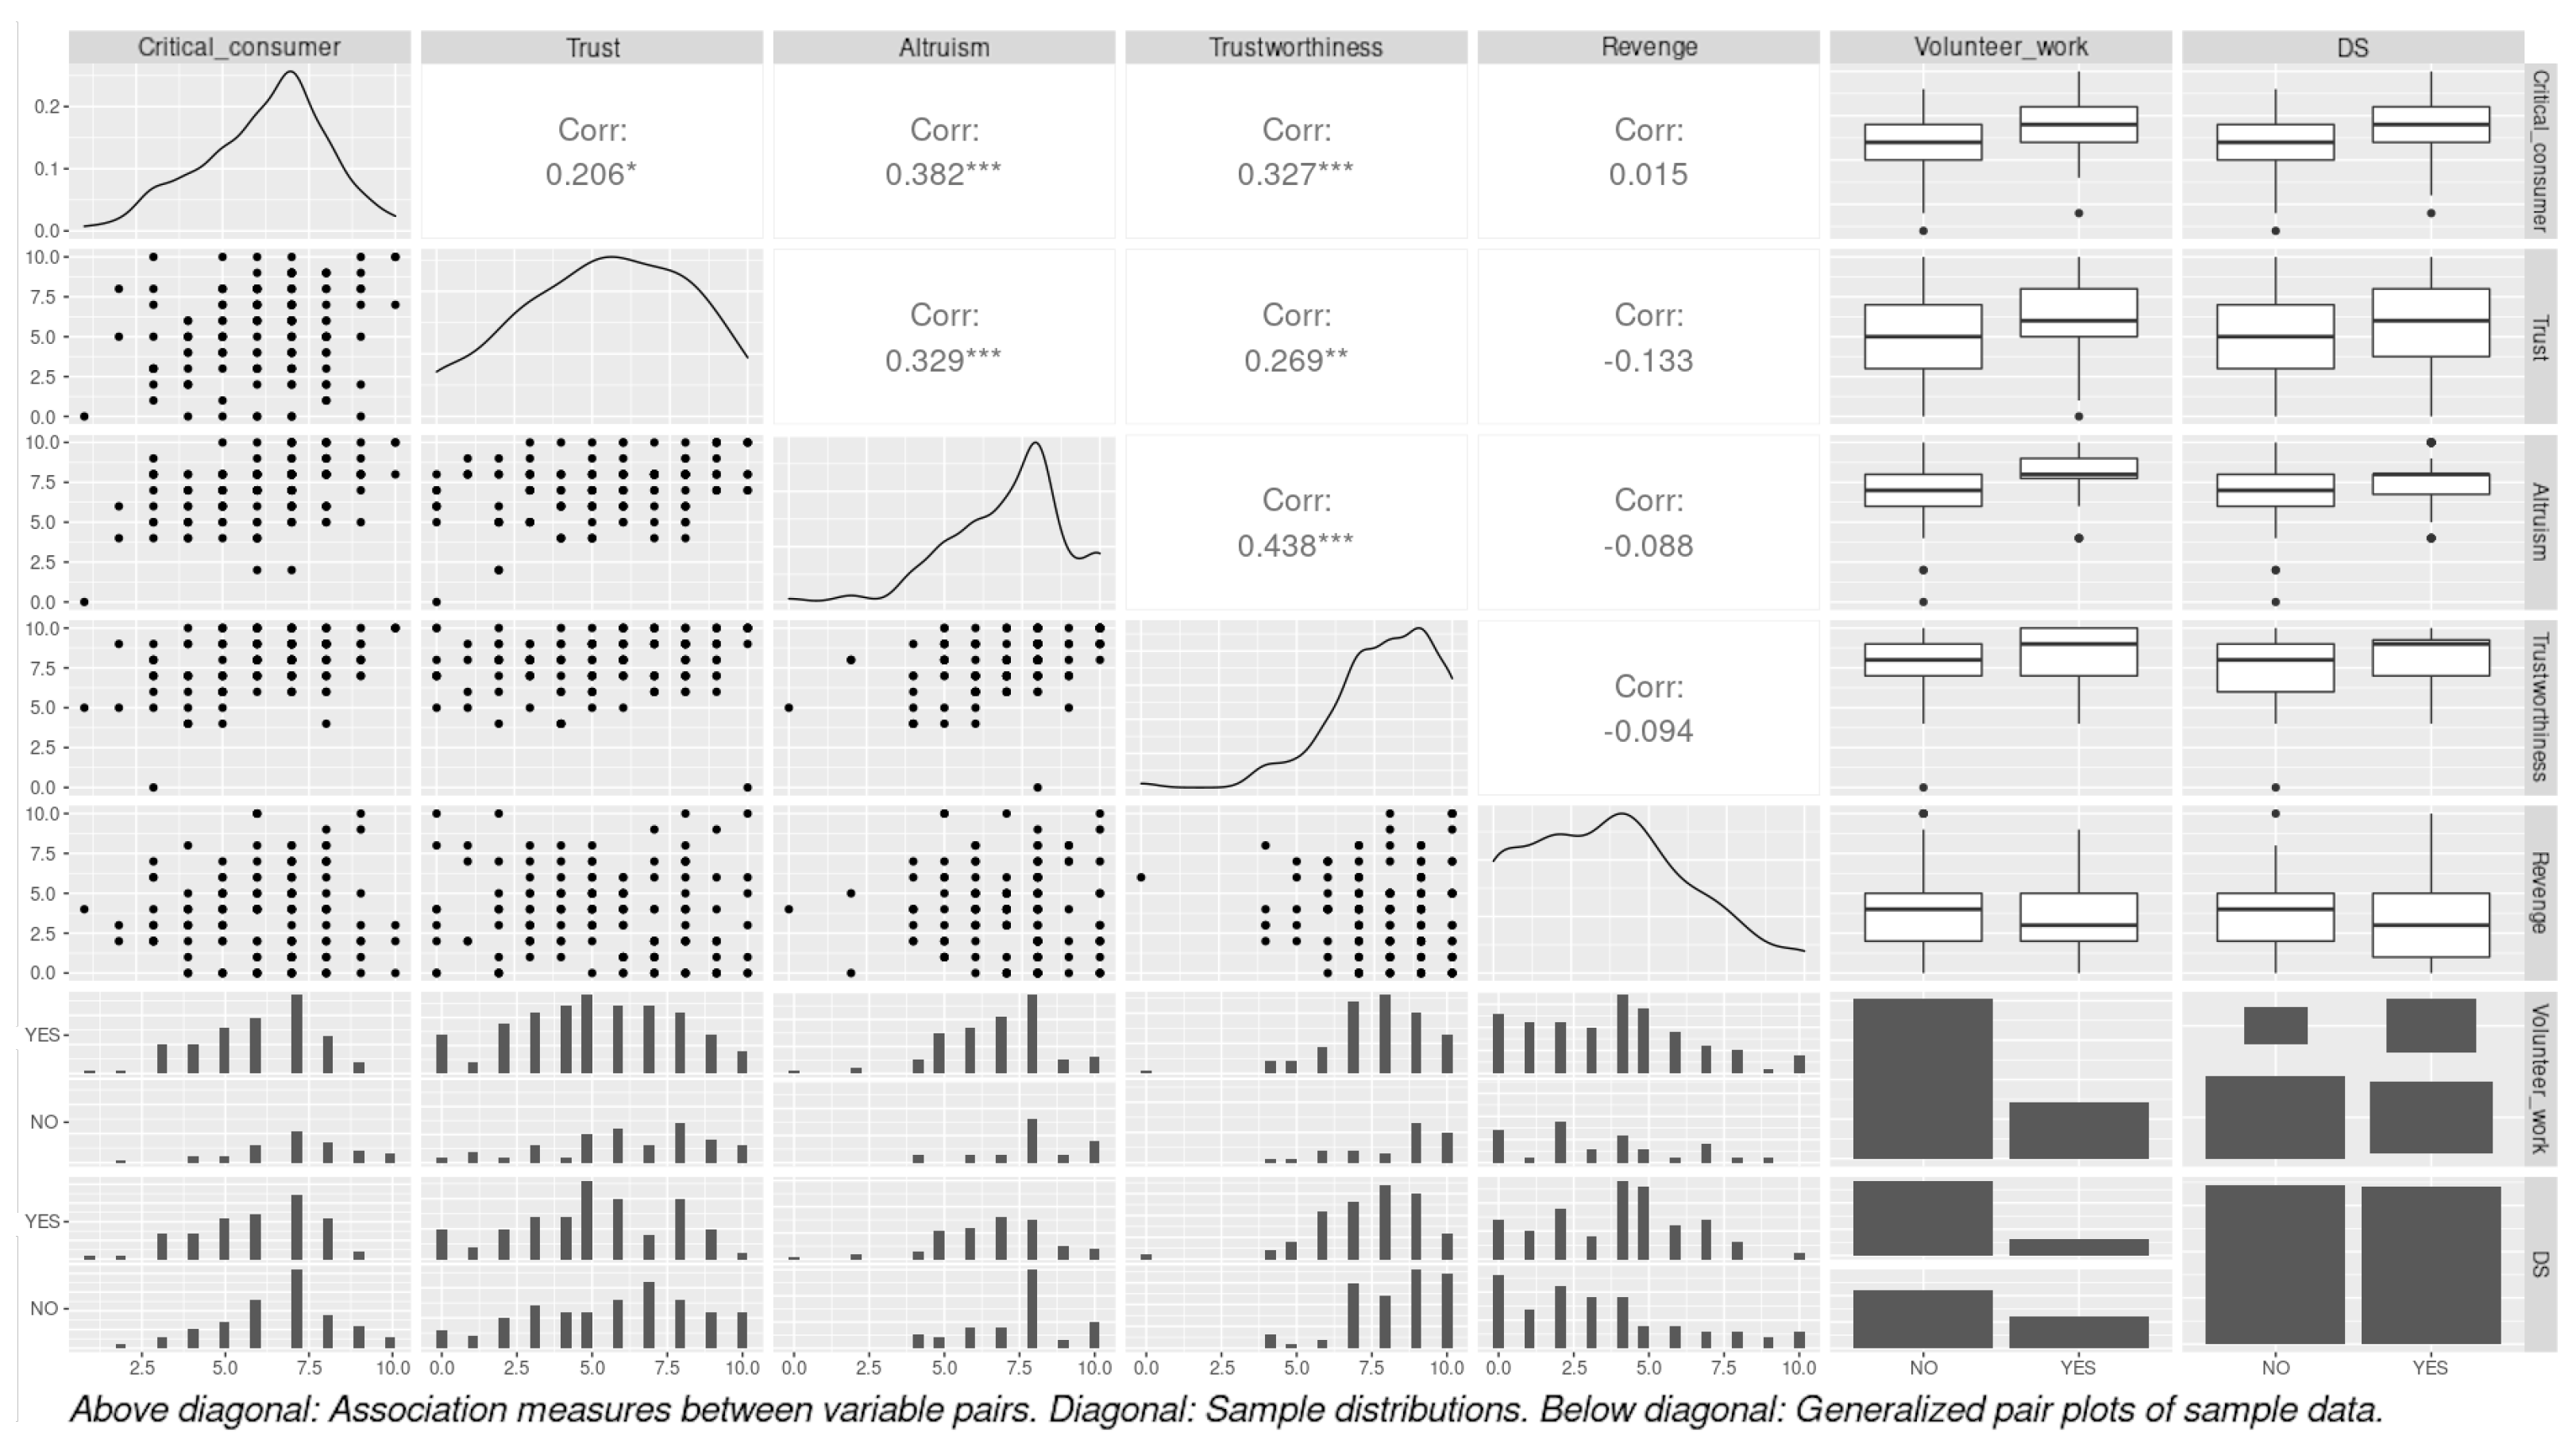
Table 7 shows that the two groups of participants have different working aspirations: while BM students mainly hope to work in the private sector, DS students tend to be interested in working for nonprofit organizations and public administration (especially health and social sectors). Finally, our questionnaire included questions related to relevant behavioral traits, several of which were inspired by the work of [61] regarding preference survey modules to measure risk, time, and social preferences. Such questions solicited answers on a Likert scale from 0 to 10. We formulated an additional question that sought to measure the extent to which our participants thought of themselves as critical consumers (again on a 0–10 scale) and one that asked whether or not they were currently engaged in voluntary work (with a yes or no answer). Table 8 reports the exact wording of these specific questions and the labels which are then used in Table 9 to show test results on the differences between the two groups of students. Accordingly, DS students are more likely than BM students to donate to good causes, return a favor for a stranger (both p-values < 0.01 ) while they declare a lower willingness to take a revenge after being treated unfairly and are more likely to be involved in volunteer work in social or environmental organizations or cultural associations (p-values < 0.05 ). There is also a somewhat weaker evidence of DS students being more careful about their consumption choices and being more trusting of other people. It is reasonable that these behavioral traits concur to outlining the prosocial attitudes of subjects.
In turn, Figure 4 provides an overview of the measures of association between the different variables of the preference survey module. In particular, the portion of the figure above the diagonal shows significant correlations with the expected sign (Spearman rank correlations) between the variables measured on a Likert scale, while the box plots on the right highlight the link between the dummies and the other variables, which again are as expected. Overall, there is evidence that these variables seem to paint a fairly consistent picture of a general prosocial attitude.

5. Conclusions

The experimental design outlined in this paper presents producers having to make choices in terms of price and quality of a fictitious good or service within a duopoly. The role of producers is played by two different groups of students whose prosocial attitude is ex-ante different. The demand side of the market is artificial and is designed to reflect the characteristics of a population of consumers who have a heterogeneous willingness to pay for quality. In the control scenario, different prosociality does not translate into different behavior of producers. In the treatment scenario, selling high quality goods results in proportional payments to a charity (selected by each subject). The presence of such salient implication in terms of a positive social externality triggered a significantly different behavior, whereby more prosocial individuals produced higher quality goods than their counterparts. We can therefore extrapolate that individuals with different training and cultural backgrounds have different motivations and attitudes concerning sustainability practices. However, strategic interactions between subjects with different degrees of prosociality are quite complex and the outcome of this type of competition cannot be taken for granted. In fact, there is only weak evidence that the presence of more producers with a higher degree of prosociality tends to generate a greater positive social impact: the market environment with its competitive pressure makes it difficult for the good deeds to be fully effective. Existing literature often suggests that all new services, activities, projects, and policies should integrate features that promote prosocial and pro social and environmental behaviors among the population so that, in the long run, such behaviors become the norm, e.g., [62]. Sustainable entrepreneurship education for high school and university students may orientate future entrepreneurs and consumers towards sustainability and encourage youth to engage in social entrepreneurial ventures to solve social and environmental problems. The present study contributes to this debate by suggesting that, since such strategy may not suffice, pro-sustainability attitudes need to be integrated, via academia and policy making, by competences about how markets operate. This paper’s focus on the behavioral traits of individuals on the supply side of markets with social externalities could benefit greatly from the use of real entrepreneurs, rather than students, in the laboratory. Indeed, the results of this market experiment might be the outcome of an idealistic approach of subjects who most likely never had to develop effective strategies to survive in competitive markets. Another relevant area for future research concerns the behavior and the intentions of the students to engage in sustainable entrepreneurship upon completion of their university training [7]. Finally, further attempts to understand how different demand conditions might turn into different emerging behavior, could also provide an important test of the robustness of our main conclusions.

Supplementary Materials

The following are available online at https://www.mdpi.com/article/10.3390/su14063577/s1, Supplementary S1: Instructions and screen-shots. Supplementary S2: post-experiment questionnaire. Supplementary S3: technical appendix.

Author Contributions

Conceptualization, M.B., D.C., N.D. and V.V.; Data curation, M.B., D.C., N.D. and V.V.; Formal analysis, M.B., D.C., N.D. and V.V.; Funding acquisition, M.B.; Investigation, D.C., N.D. and V.V.; Methodology, D.C., N.D. and V.V.; Software, D.C. and V.V.; Writing—original draft, M.B., D.C., N.D. and V.V.; Writing—review and editing, M.B., D.C., N.D. and V.V. All authors have read and agreed to the published version of the manuscript.

Funding

We acknowledge the funding of the European Commission to the EFESEIIS Project (Enabling the Flourishing and Evolution of Social Entrepreneurship for Inclusive and Innovative Societies) Grant agreement number 613179.

Institutional Review Board Statement

The study was conducted in accordance with the Declaration of Helsinki and approved by the Scientific and Ethical Committee of the EFESEIIS project on 15 July 2015.

Informed Consent Statement

Informed consent was obtained from all subjects involved in the study.

Data Availability Statement

The dataset is contained in [63] and directly downloadable from https://doi.org/10.17632/24mrx977w2.1 (accessed on 12 October 2020).

Conflicts of Interest

The authors declare no conflict of interest. The funders had no role in the design of the study; in the collection, analyses, or interpretation of data; in the writing of the manuscript, or in the decision to publish the results.

References

  1. Terán-Yépez, E.; Marín-Carrillo, G.M.; del Pilar Casado-Belmonte, M.; de las Mercedes Capobianco-Uriarte, M. Sustainable entrepreneurship: Review of its evolution and new trends. J. Clean. Prod. 2020, 252, 119742. [Google Scholar] [CrossRef]
  2. Foster, W.; Bradach, J. Should nonprofits seek profits? Harv. Bus. Rev. 2005, 83, 92–100. [Google Scholar] [PubMed]
  3. Ali, M. A systematic literature review of sustainable entrepreneurship with thematic analysis. World J. Entrep. Manag. Sustain. Dev. 2021, 17, 742–764. [Google Scholar] [CrossRef]
  4. Anand, A.; Argade, P.; Barkemeyer, R.; Salignac, F. Trends and patterns in sustainable entrepreneurship research: A bibliometric review and research agenda. J. Bus. Ventur. 2021, 36, 106092. [Google Scholar] [CrossRef]
  5. Fellnhofer, K.; Kraus, S.; Bouncken, R.B. The Current State of Research on Sustainable Entrepreneurship. Int. J. Bus. Res. 2014, 14, 163–172. [Google Scholar] [CrossRef]
  6. Greco, A.; de Jong, G. Sustainable entrepreneurship: Definitions, themes and research gaps. In Working Paper Series Rijksuniversiteit Groningen; University of Groningen: Groningen, The Netherlands, 2017; Volume 6. [Google Scholar]
  7. Kummitha, H.; Kummitha, R. Sustainable entrepreneurship training: A study of motivational factors. Int. J. Manag. Educ. 2021, 19, 100449. [Google Scholar] [CrossRef]
  8. Muñoz, P.; Cohen, B. Entrepreneurship Research: Taking Stock and Looking Ahead. Bus. Strategy Environ. 2018, 27, 300–322. [Google Scholar] [CrossRef]
  9. Parrish, B. Sustainability-Driven Entrepreneurship: A Literature Review; SRI PAPERS Sustainability Research Institute, School of Earth and Environment, University of Leeds: Leeds, UK, 2008; Volume 9, ISSN 1753-1330. [Google Scholar]
  10. Ran, B.; Weller, S. An Exit Strategy for the Definitional Elusiveness: A Three-Dimensional Framework for Social Entrepreneurship. Sustainability 2021, 13, 563. [Google Scholar] [CrossRef]
  11. Volkmann, C.; Fichter, K.; Klofsten, M.; Audretsch, D.B. Sustainable entrepreneurial ecosystems: An emerging field of research. Small Bus. Econ. 2019, 56, 1–9. [Google Scholar] [CrossRef]
  12. Jolink, A.; Niesten, E. Sustainable Development and Business Models of Entrepreneurs in the Organic Food Industry. Bus. Strategy Environ. 2015, 24, 386–401. [Google Scholar] [CrossRef]
  13. Cohen, B.; Smith, B.B.; Mitchell, R. Toward a sustainable conceptualization of dependent variables in entrepreneurship research. Bus. Strategy Environ. 2008, 17, 107–119. [Google Scholar] [CrossRef]
  14. Weller, S.; Ran, B. Social Entrepreneurship: The Logic of Paradox. Sustainability 2020, 12, 10642. [Google Scholar] [CrossRef]
  15. Wagner, M. Effects of innovativeness and long-term orientation on entrepreneurial intentions: A comparison of business and engineering students. Int. J. Entrep. Small Bus. 2011, 12, 300. [Google Scholar] [CrossRef]
  16. Meier, S. A survey of economic theories and field evidence on pro-social behavior. In Economics and Psychology: A Promising New Cross-Disciplinary Field; Frey, B.S., Stutzer, A., Eds.; MIT Press: Cambridge, MA, USA, 2007; pp. 51–87. [Google Scholar]
  17. Baron, D.P. Corporate social responsibility and social entrepreneurship. J. Econ. Manag. Strategy 2007, 16, 683–717. [Google Scholar] [CrossRef]
  18. Doni, N.; Ricchiuti, G. Market equilibrium in the presence of green consumers and responsible firms: A comparative statics analysis. Resour. Energy Econ. 2013, 35, 380–395. [Google Scholar] [CrossRef] [Green Version]
  19. Devinney, T.M.; Auger, P.; Eckhardt, G. The Myth of the Ethical Consumer; Cambridge University Press: Cambridge, UK, 2010. [Google Scholar]
  20. Schmitz, J.; Schrader, J. Corporate social responsibility: A microeconomic review of the literature. J. Econ. Surv. 2015, 29, 27–45. [Google Scholar] [CrossRef]
  21. Normann, H.-T.; Ruffle, B. Introduction to the special issue on experiments in industrial organization. Int. J. Ind. Organ. 2011, 29, 1–3. [Google Scholar] [CrossRef]
  22. Potters, J.; Suetens, S. Oligopoly experiments in the current millennium. J. Econ. Surv. 2013, 27, 439–460. [Google Scholar] [CrossRef]
  23. Horiuchi, Y.; Markovich, Z.; Yamamoto, T. Does Conjoint Analysis Mitigate Social Desirability Bias? Political Anal. 2021, 1–15. [Google Scholar] [CrossRef]
  24. Shepherd, D.A.; Zacharakis, A. Venture capitalists’ expertise: A call for research into decision aids and cognitive feedback. J. Bus. Ventur. 2002, 17, 1–20. [Google Scholar] [CrossRef]
  25. Bartling, B.; Weber, R.A.; Yao, L. Do markets erode social responsibility? Q. J. Econ. 2015, 130, 219–266. [Google Scholar] [CrossRef]
  26. Georgantzis, N.; Vasileiou, E. An experiment on energy saving competition with socially responsible consumers: Opening the black box. J. Behav. Exp. Econ. 2015, 58, 1–10. [Google Scholar]
  27. Pigors, M.; Rockenbach, B. Consumer social responsibility. Manag. Sci. 2016, 62, 3123–3137. [Google Scholar] [CrossRef] [Green Version]
  28. Rode, J.; Hogarth, R.M.; Le Menestrel, M. Ethical differentiation and market behavior: An experimental approach. J. Econ. Behav. Organ. 2008, 66, 265–280. [Google Scholar] [CrossRef] [Green Version]
  29. Valente, M. Ethical differentiation and consumption in an incentivized market experiment. Rev. Ind. Organ. 2015, 47, 51–69. [Google Scholar] [CrossRef]
  30. Danz, D.; Engelmann, D.; Kübler, D. Do Legal Standards Affect Ethical Concerns of Consumers? An Experiment on Minimum Wages; Discussion Paper: Collaborative Research Center Transregio 190; Ludwig-Maximilians-Universität München: Munich, Germany; Humboldt-Universität zu Berlin: Berlin, Germany, 2020; Volume 234. [Google Scholar]
  31. Feicht, R.; Grimm, V.; Seebauer, M. An experimental study of corporate social responsibility through charitable giving in Bertrand markets. J. Econ. Behav. Organ. 2016, 124, 88–101. [Google Scholar] [CrossRef] [Green Version]
  32. Etilé, F.; Teyssier, S. Signaling corporate social responsibility: Third-party certification vs. brands. Scand. J. Econ. 2016, 118, 397–432. [Google Scholar] [CrossRef]
  33. Gabszewicz, J.; Thisse, J.F. Price competition, quality and income disparities. J. Econ. Theory 1979, 20, 340–359. [Google Scholar] [CrossRef]
  34. Mussa, M.; Rosen, S. Monopoly and product quality. J. Econ. Theory 1978, 18, 301–317. [Google Scholar] [CrossRef]
  35. Bansal, S.; Gangopadhyay, S. Tax/subsidy policies in the presence of environmentally aware consumers. J. Environ. Econ. Manag. 2003, 45, 333–355. [Google Scholar] [CrossRef]
  36. Eriksson, C. Can green consumerism replace environmental regulation? A differentiated-products examples. Resour. Energy Econ. 2004, 26, 281–293. [Google Scholar] [CrossRef]
  37. Garcia-Gallego, A.; Georgantzis, N. Market effects of changes in consumers’ social responsibility. J. Econ. Manag. Strategy 2009, 18, 235–262. [Google Scholar] [CrossRef] [Green Version]
  38. Lombardini-Riipinen, C. Optimal tax policy under environmental quality competition. Environ. Resour. Econ. 2005, 32, 317–336. [Google Scholar] [CrossRef]
  39. Rodriguez-Ibeas, R. Environmental product differentiation and environmental awareness. Environ. Resour. Econ. 2007, 36, 237–254. [Google Scholar] [CrossRef]
  40. Sana, H.A.; Alkhalaf, S.; Zulfiqar, S.; Al-Rahmi, W.M.; Al-Adwan, A.S.; AlSoud, A.R. Upshots of Intrinsic Traits on Social Entrepreneurship Intentions among Young Business Graduates: An Investigation through Moderated-Mediation Model. Sustainability 2021, 13, 5192. [Google Scholar] [CrossRef]
  41. Tu, B.; Bhowmik, R.; Hasan, M.K.; Asheq, A.A.; Rahaman, M.A.; Chen, X. Graduate Students’ Behavioral Intention towards Social Entrepreneurship: Role of Social Vision, Innovativeness, Social Proactiveness, and Risk Taking. Sustainability 2021, 13, 6386. [Google Scholar] [CrossRef]
  42. Ham, J.C.; Kagel, J.H.; Lehrer, S.F. Randomization, endogeneity, and laboratory experiments: The role of cash balances in private value auctions. J. Econom. 2005, 125, 175–205. [Google Scholar] [CrossRef] [Green Version]
  43. Schmidt, B.; Hewig, J. Paying out one or all trials: A behavioral economic evaluation of payment methods in a prototypical risky decision study. Psychol. Rec. 2015, 65, 245–250. [Google Scholar] [CrossRef]
  44. Charness, G.; Gneezy, U.; Halladay, B. Experimental methods: Pay one or pay all. J. Econ. Behav. Organ. 2016, 131, 141–150. [Google Scholar] [CrossRef]
  45. Moorthy, K.S. Product and price competition in a duopoly. Mark. Sci. 1988, 7, 141–168. [Google Scholar] [CrossRef] [Green Version]
  46. Wauthy, X. Quality choice in models of vertical differentiation. J. Ind. Econ. 1996, 44, 345–352. [Google Scholar] [CrossRef]
  47. Hughes, C.T.; Gibson, M.L. Students as surrogates for managers in a decision-making environment: An experimental study. J. Manag. Inf. Syst. 1991, 8, 153–166. [Google Scholar] [CrossRef]
  48. Ashton, R.H.; Kramer, S.S. Students as surrogates in behavioral accounting research: Some evidence. J. Account. Res. 1980, 18, 1–15. [Google Scholar] [CrossRef]
  49. Remus, W. Will behavioral research on managerial decision making generalize to managers? Manag. Decis. Econ. 1996, 17, 93–101. [Google Scholar] [CrossRef]
  50. Song, Y.; Arnott, D.; Gao, S. Graduate students as surrogates for managers in business intelligence and analytics research: A preliminary study. J. Decis. Syst. 2020. [Google Scholar] [CrossRef]
  51. Trottier, K.; Gordon, I.M. Students as surrogates for managers: Evidence from a replicated experiment. Can. J. Adm. Sci. 2018, 35, 146–161. [Google Scholar] [CrossRef] [Green Version]
  52. Gordon, M.E.; Slade, L.A.; Schmitt, N. The “Science of the Sophomore” revisited: From conjecture to empiricism. Acad. Manag. Rev. 1986, 11, 191–207. [Google Scholar]
  53. Gordon, M.E.; Slade, L.A.; Schmitt, N. Student guinea pigs: Porcine predictors and particularistic phenomena. Acad. Manag. Rev. 1987, 12, 160–163. [Google Scholar] [CrossRef]
  54. Greenberg, J. The college sophomore as guinea pig: Setting the record straight. Acad. Manag. Rev. 1987, 12, 157–159. [Google Scholar] [CrossRef]
  55. Chen, D.L.; Schonger, M.; Wickens, C. oTree—An open-source platform for laboratory, online, and field experiments. J. Behav. Exp. Financ. 2016, 9, 88–97. [Google Scholar] [CrossRef]
  56. Stokey, N. Job Differentiation and Wages. Q. J. Econ. 1980, 95, 431–449. [Google Scholar] [CrossRef] [Green Version]
  57. Bigoni, M.; Fort, M. Information and learning in oligopoly: An experiment. Games Econ. Behav. 2013, 81, 192–214. [Google Scholar] [CrossRef] [Green Version]
  58. Huck, S.; Normann, H.T.; Oechssler, J. Learning in Cournot oligopoly—An experiment. Econ. J. 1999, 109, 80–95. [Google Scholar] [CrossRef]
  59. Offerman, T.; Potters, J.; Sonnemans, J. Imitation and Belief Learning in an Oligopoly Experiment. Rev. Econ. Stud. 2002, 69, 973–997. [Google Scholar] [CrossRef] [Green Version]
  60. Skatova, A.; Ferguson, E. Why do different people choose different university degrees? Motivation and the choice of degree. Front. Psychol. 2014, 5, 1244. [Google Scholar] [CrossRef] [PubMed] [Green Version]
  61. Falk, A.; Becker, A.; Dohmen, T.; Huffman, D.; Sunde, U. The Preference Survey Module: A Validated Instrument for Measuring Risk, Time, and Social Preferences; IZA Discussion Paper; Forschungsinstitut zur Zukunft der Arbeit: Bonn, Germany, 2016; Volume 9674. [Google Scholar]
  62. Yunus, M.; Biggeri, M.; Testi, E. Social Economy and Social Business Supporting Policies for Sustainable Human Development in a Post-COVID-19 World. Sustainability 2021, 13, 12155. [Google Scholar] [CrossRef]
  63. Biggeri, M.; Colucci, D.; Doni, N.; Valori, V. Incentivized market experiment with vertical differentiation and positive externalities. Mendeley Data 2022, 1. [Google Scholar] [CrossRef]
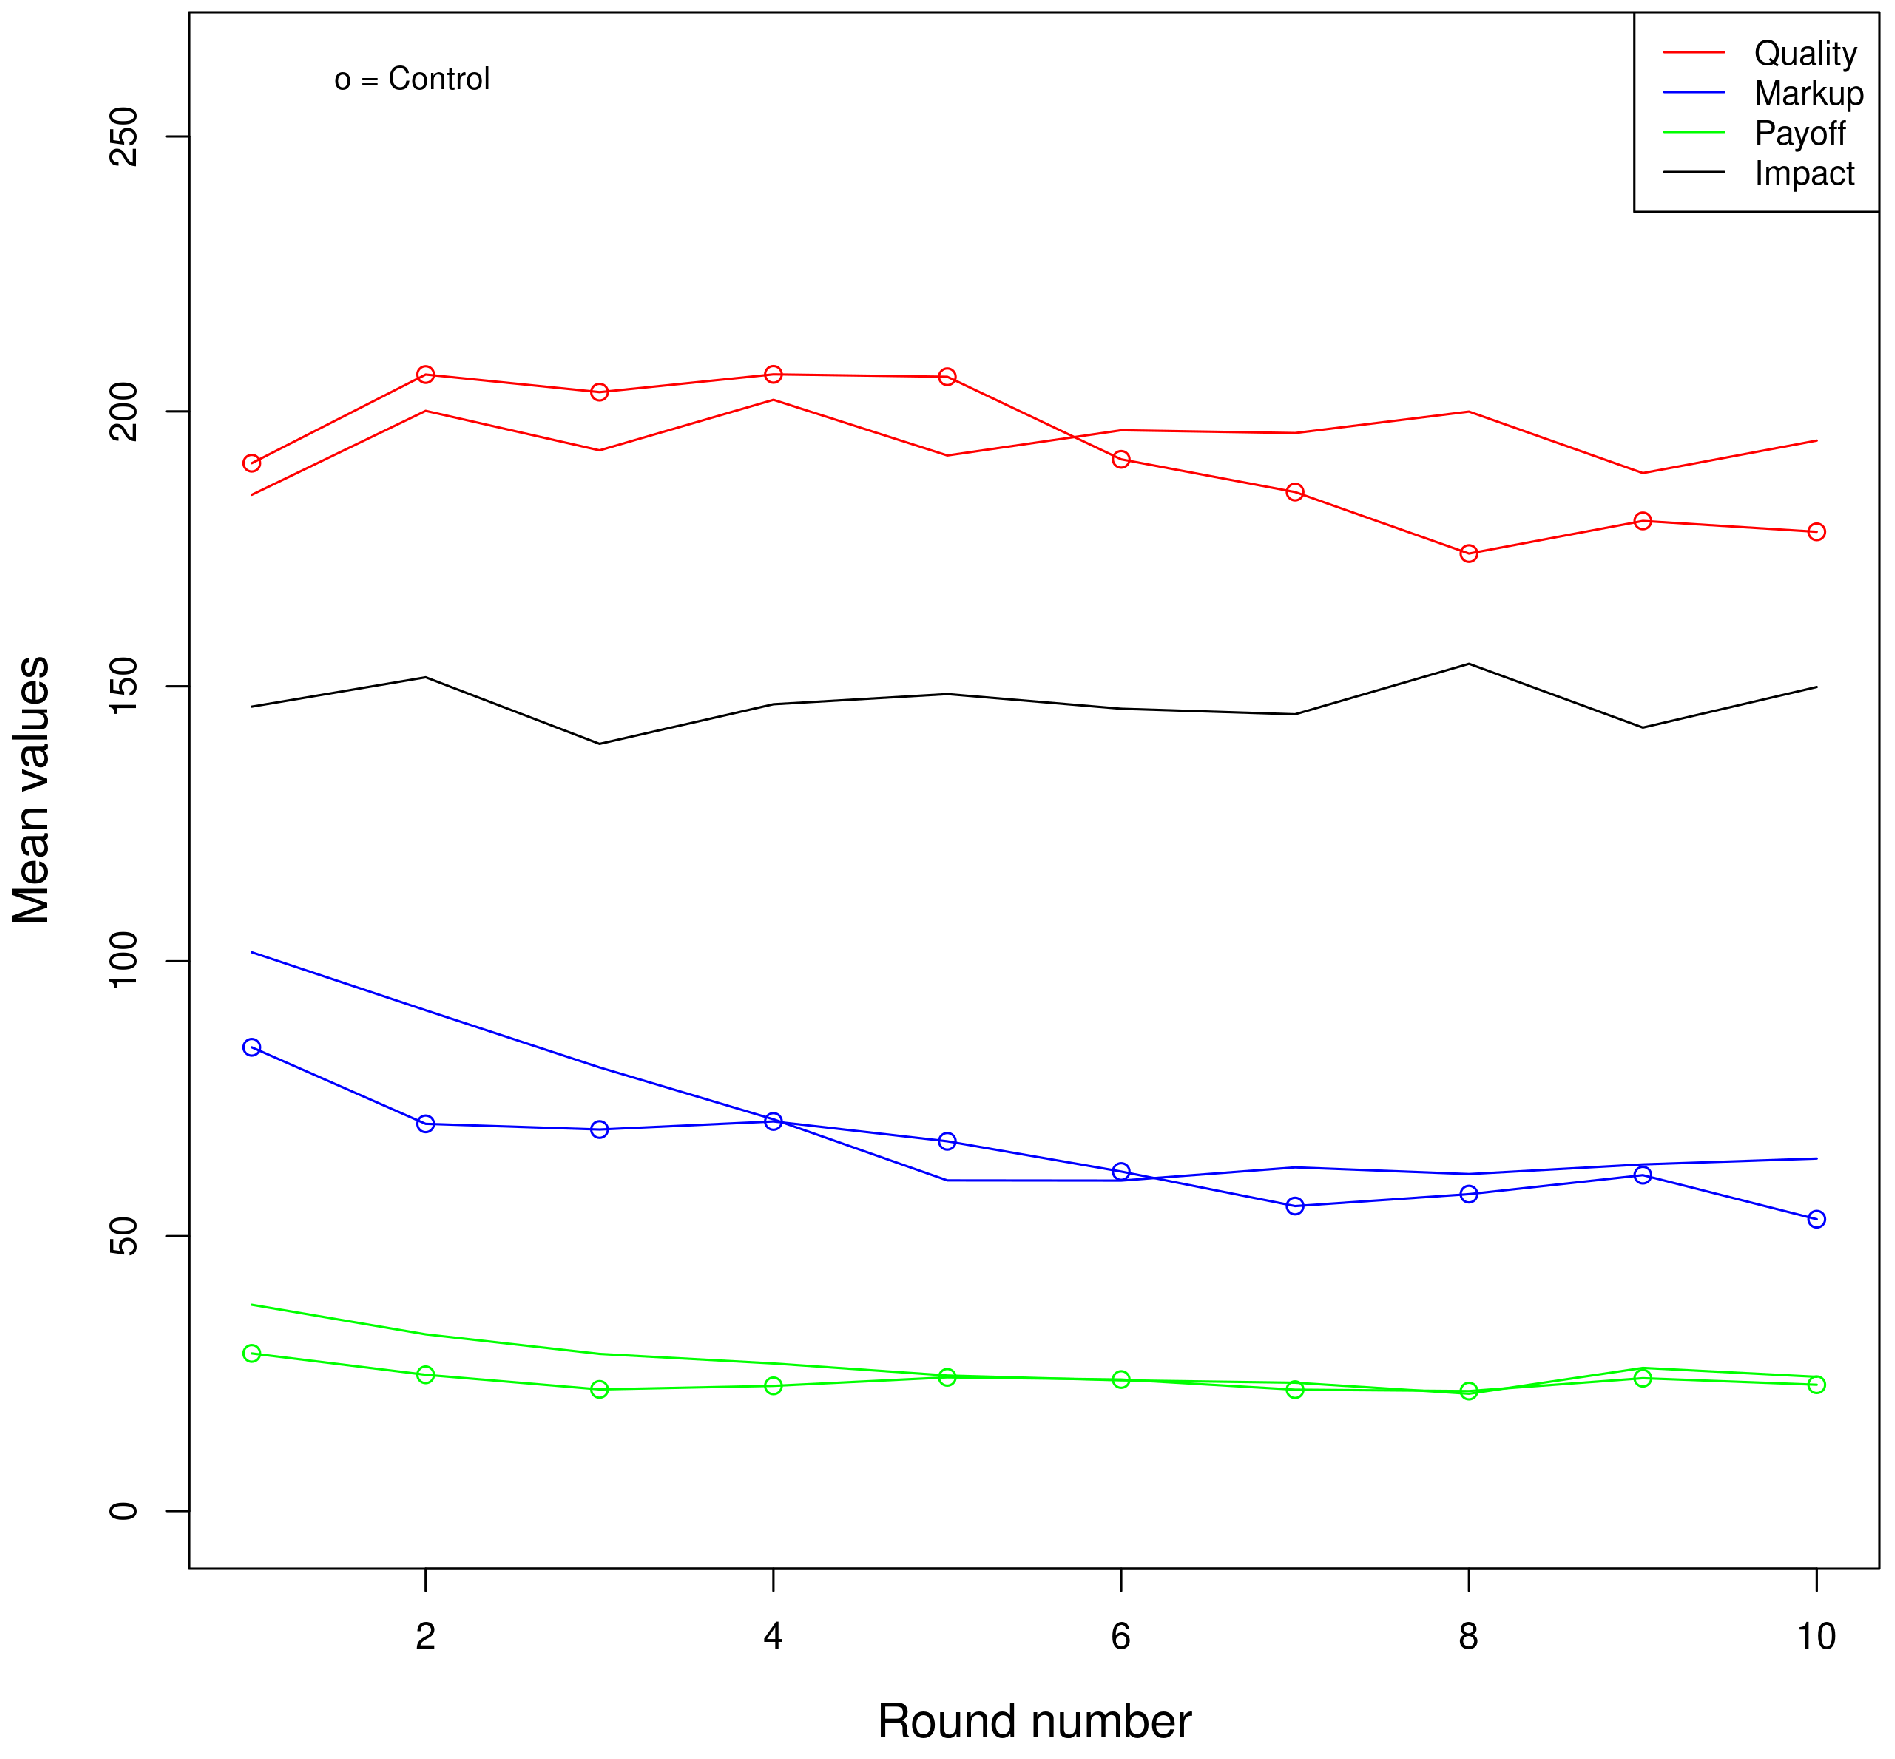
Figure 1. Main variables averages in T and C.
Sustainability 14 03577 g001
Figure 2. Main variables averages in T: DS vs. BM.
Sustainability 14 03577 g002
Figure 3. Quality in C and T.
Sustainability 14 03577 g003
Figure 4. Measures of associations within questionnaire variables. * p < 0.1; ** p< 0.05; *** p< 0.01.
Sustainability 14 03577 g004
Table 1. Subjects and groups composition.
SubjectsGroups
TotalsBMDSBM-BMBM-DSDS-DS
T824141121712
C643232101210
Total1467373222922
Table 2. (a) Descriptive statistics for T. (b) Descriptive statistics for C.
(a)
StatisticsNMeanSt. Dev.
Quality738195.6101.2
Markup73868.268.6
Profit73825.634.2
Impact738147.0134.6
(b)
StatisticNMeanSt. Dev.
Quality576192.497.1
Markup57662.961.0
Profit57623.227.5
Table 3. Trend in the main variables.
VariableEstimatep-Value
Quality-C−4.5140.008
Quality-T−0.5710.669
Price-C−6.7220.00004
Price-T−3.5430.01
Profit-C−0.0880.836
Profit-T−0.8470.06
Markup-C−2.2080.011
Markup-T−2.9730.00004
Impact-T0.2140.904
Table 4. Differences between DS and BM (in T and C).
Dependent Variable
QualityMarkupProfitImpact
TCTCTCT
(1)(2)(3)(4)(5)(6)(7)
DS34.361−12.582−0.3563.754−8.411−2.9054.573
(14.026)(8.291)(9.248)(6.104)(5.245)(2.363)(17.713)
p = 0.015p = 0.130p = 0.970p = 0.539p = 0.109p = 0.219p = 0.797
female8.3629.189−1.4671.759−7.081−4.943−0.303
(8.796)(5.871)(4.849)(7.517)(2.744)(2.895)(14.783)
p = 0.342p = 0.118p = 0.763p = 0.815p = 0.010p = 0.088p = 0.984
age−1.755−9.1690.5802.9910.058−1.5381.108
(1.141)(1.813)(0.719)(2.832)(0.402)(0.937)(1.978)
p = 0.124p = 0.00000p = 0.420p = 0.291p = 0.885p = 0.101p = 0.576
Constant270.257350.49080.19253.62537.92595.947160.628
(28.868)(48.450)(20.912)(66.582)(10.675)(22.396)(83.391)
p = 0.000p = 0.000p = 0.0002p = 0.421p = 0.0004p = 0.00002p = 0.055
Observations738576738576738576738
R 2 0.5130.4710.5100.4350.3630.2990.178
Adjusted R 2 0.4830.4370.4800.3990.3230.2550.127
F Statistic17.009 *** (df = 43; 694)14.143 *** (df = 34; 541)16.819 *** (df = 43; 694)12.238 *** (df = 34; 541)9.186 *** (df = 43; 694)6.785 *** (df = 34; 541)3.487 *** (df = 43; 694)
Note: OLS estimates, with coupleID fixed effects (dummy variables estimated coefficients not included here). Standard errors in parenthesis are clustered by subject ID. *** p < 0.01.
Table 5. Differences between DS and BM in T-Homogeneous (H) vs. Mixed (M) groups.
Dependent variable
QualityMarkupProfitImpact
(H)(M)(H)(M)(H)(M)(H)(M)
DS−41.96431.087−83.9080.567−30.675−9.439−65.3806.450
(26.197)(14.031)(17.580)(9.696)(7.830)(5.571)(76.715)(17.923)
p = 0.110p = 0.027p = 0.00001p = 0.954p = 0.0001p = 0.091p = 0.395p = 0.719
female20.032−47.403−5.18316.909−6.751−3.8125.294−44.895
(8.983)(14.994)(5.423)(5.011)(2.961)(2.629)(16.574)(25.013)
p = 0.026p = 0.002p = 0.340p = 0.001p = 0.023p = 0.148p = 0.750p = 0.073
age−2.404−1.7590.6840.692−0.7680.9223.774−2.080
(2.031)(1.096)(1.112)(0.907)(0.564)(0.444)(3.049)(1.486)
p = 0.237p = 0.109p = 0.539p = 0.446p = 0.174p = 0.038p = 0.216p = 0.162
Constant278.707227.28279.769−5.86255.933−6.12499.177192.202
(47.485)(25.061)(28.686)(19.716)(14.205)(7.929)(98.261)(42.478)
p = 0.000p = 0.000p = 0.006p = 0.767p = 0.0001p = 0.440p = 0.313p = 0.00001
Observations432306432306432306432306
R 2 0.5400.4930.3570.6110.2550.4370.1620.218
Adjusted R 2 0.5110.4590.3170.5850.2090.3990.1100.166
F Statistic19.050 *** (df = 25; 406)14.622 *** (df = 19; 286)9.016 *** (df = 25; 406)23.658 *** (df = 19; 286)5.567 *** (df = 25; 406)11.676 *** (df = 19; 286)3.130 *** (df = 25; 406)4.204 *** (df = 19; 286)
Note: *** p < 0.01.
Table 6. Adjustments in choice variables over time.
Dependent Variable
Δ quality t Δ markup t
(1)(2)(3)(4)
d q u a l i t y t 1 31.55346.643
(5.539)(4.945)
p = 0.000p = 0.000
d q u a l i t y t 1 × D S 6.163−16.660
(7.582)(6.592)
p = 0.417p = 0.012
s i g n ( Δ q u a l i t y t 1 ) × s i g n ( Δ p r o f i t t 1 ) 4.94314.384
(5.757)(5.400)
p = 0.391p = 0.008
s i g n ( Δ q u a l i t y t 1 ) × s i g n ( Δ p r o f i t t 1 ) × D S 5.836−6.251
(7.784)(7.243)
p = 0.454p = 0.389
d m a r k u p t 1 19.13224.254
(3.027)(3.125)
p = 0.000p = 0.000
d m a r k u p t 1 × D S 0.063−3.764
(5.072)(4.887)
p = 0.991p = 0.442
s i g n ( Δ m a r k u p t 1 ) × s i g n ( Δ p r o f i t t 1 ) 8.0067.521
(2.928)(3.162)
p = 0.007p = 0.018
s i g n ( Δ q u a l i t y t 1 ) × s i g n ( Δ p r o f i t t 1 ) × D S 1.5260.321
(4.811)(5.139)
p = 0.752p = 0.951
Constant−1.7950.583−1.265−3.359
(3.669)(3.140)(2.300)(2.238)
p = 0.625p = 0.853p = 0.583p = 0.134
Observations512656512656
R 2 0.1490.1960.1400.139
Adjusted R 2 0.1430.1910.1340.134
Residual Std. Error81.487 (df = 507)79.082 (df = 651)51.353 (df = 507)57.320 (df = 651)
F Statistic22.270 *** (df = 4; 507)39.654 *** (df = 4; 651)20.694 *** (df = 4; 507)26.360 *** (df = 4; 651)
Note: Standard errors in parenthesis are clustered by subject ID.*** p < 0.01.
Table 7. Working aspirations.
Where Would You Like to Work in 10 Years?DSBM
In the public administration (health or social sector)12.3%1.4%
In the public administration (other sectors)16.4%8.2%
As a freelance9.6%16.4%
In a private enterprise8.2%63%
In a nonprofit organization43.8%2.7%
I do not wish to answer19.2%9.6%
Note: larger than 100% sum due to multiple selections allowed.
Table 8. Behavioral preference survey module—Questions.
QuestionsLabel
How well does the statement “As long as I am not
convinced otherwise I always assume that people have
only the best intentions” describe you as a person?
Trust
How willing are you to give to good causes without
expecting anything in return?
Altruism
How would you rate your willingness to return a favor
to a stranger?
Trustworthiness
How well does the following statement describe you as a
person: “If I am treated very unjustly, I will take revenge
at the first opportunity, even if there is a cost to do so”?
Revenge
A critical consumer makes consumption choices based on
predefined criteria, such as environmental and social
sustainability, which have the same importance of price
and quality of the products/services. Given this definition,
define your own level of criticality as a consumer.
Critical consumer
Are you currently a voluntary member of an organisation
or association?
Volunteer work
Table 9. Behavioral preference survey module—Results.
Median DSMedian BMp-Value
Trust650.07075
Altruism870.00213
Trustworthiness980.001231
Revenge340.03132
Critical consumer760.05419
Odds DSOdds BMp-Value
Volunteer work0.540.230.02041
Note: p-values are for a one-tailed Fischer exact test for “Volunteer work”, one-tailed Mann-Whitney U-test for the remaining variables.
Publisher’s Note: MDPI stays neutral with regard to jurisdictional claims in published maps and institutional affiliations.