
Flexible Photovoltaic System on Non-Conventional Surfaces: A Techno-Economic Analysis

 ,
, 

 , ,
, ,
Abstract
:1. Introduction
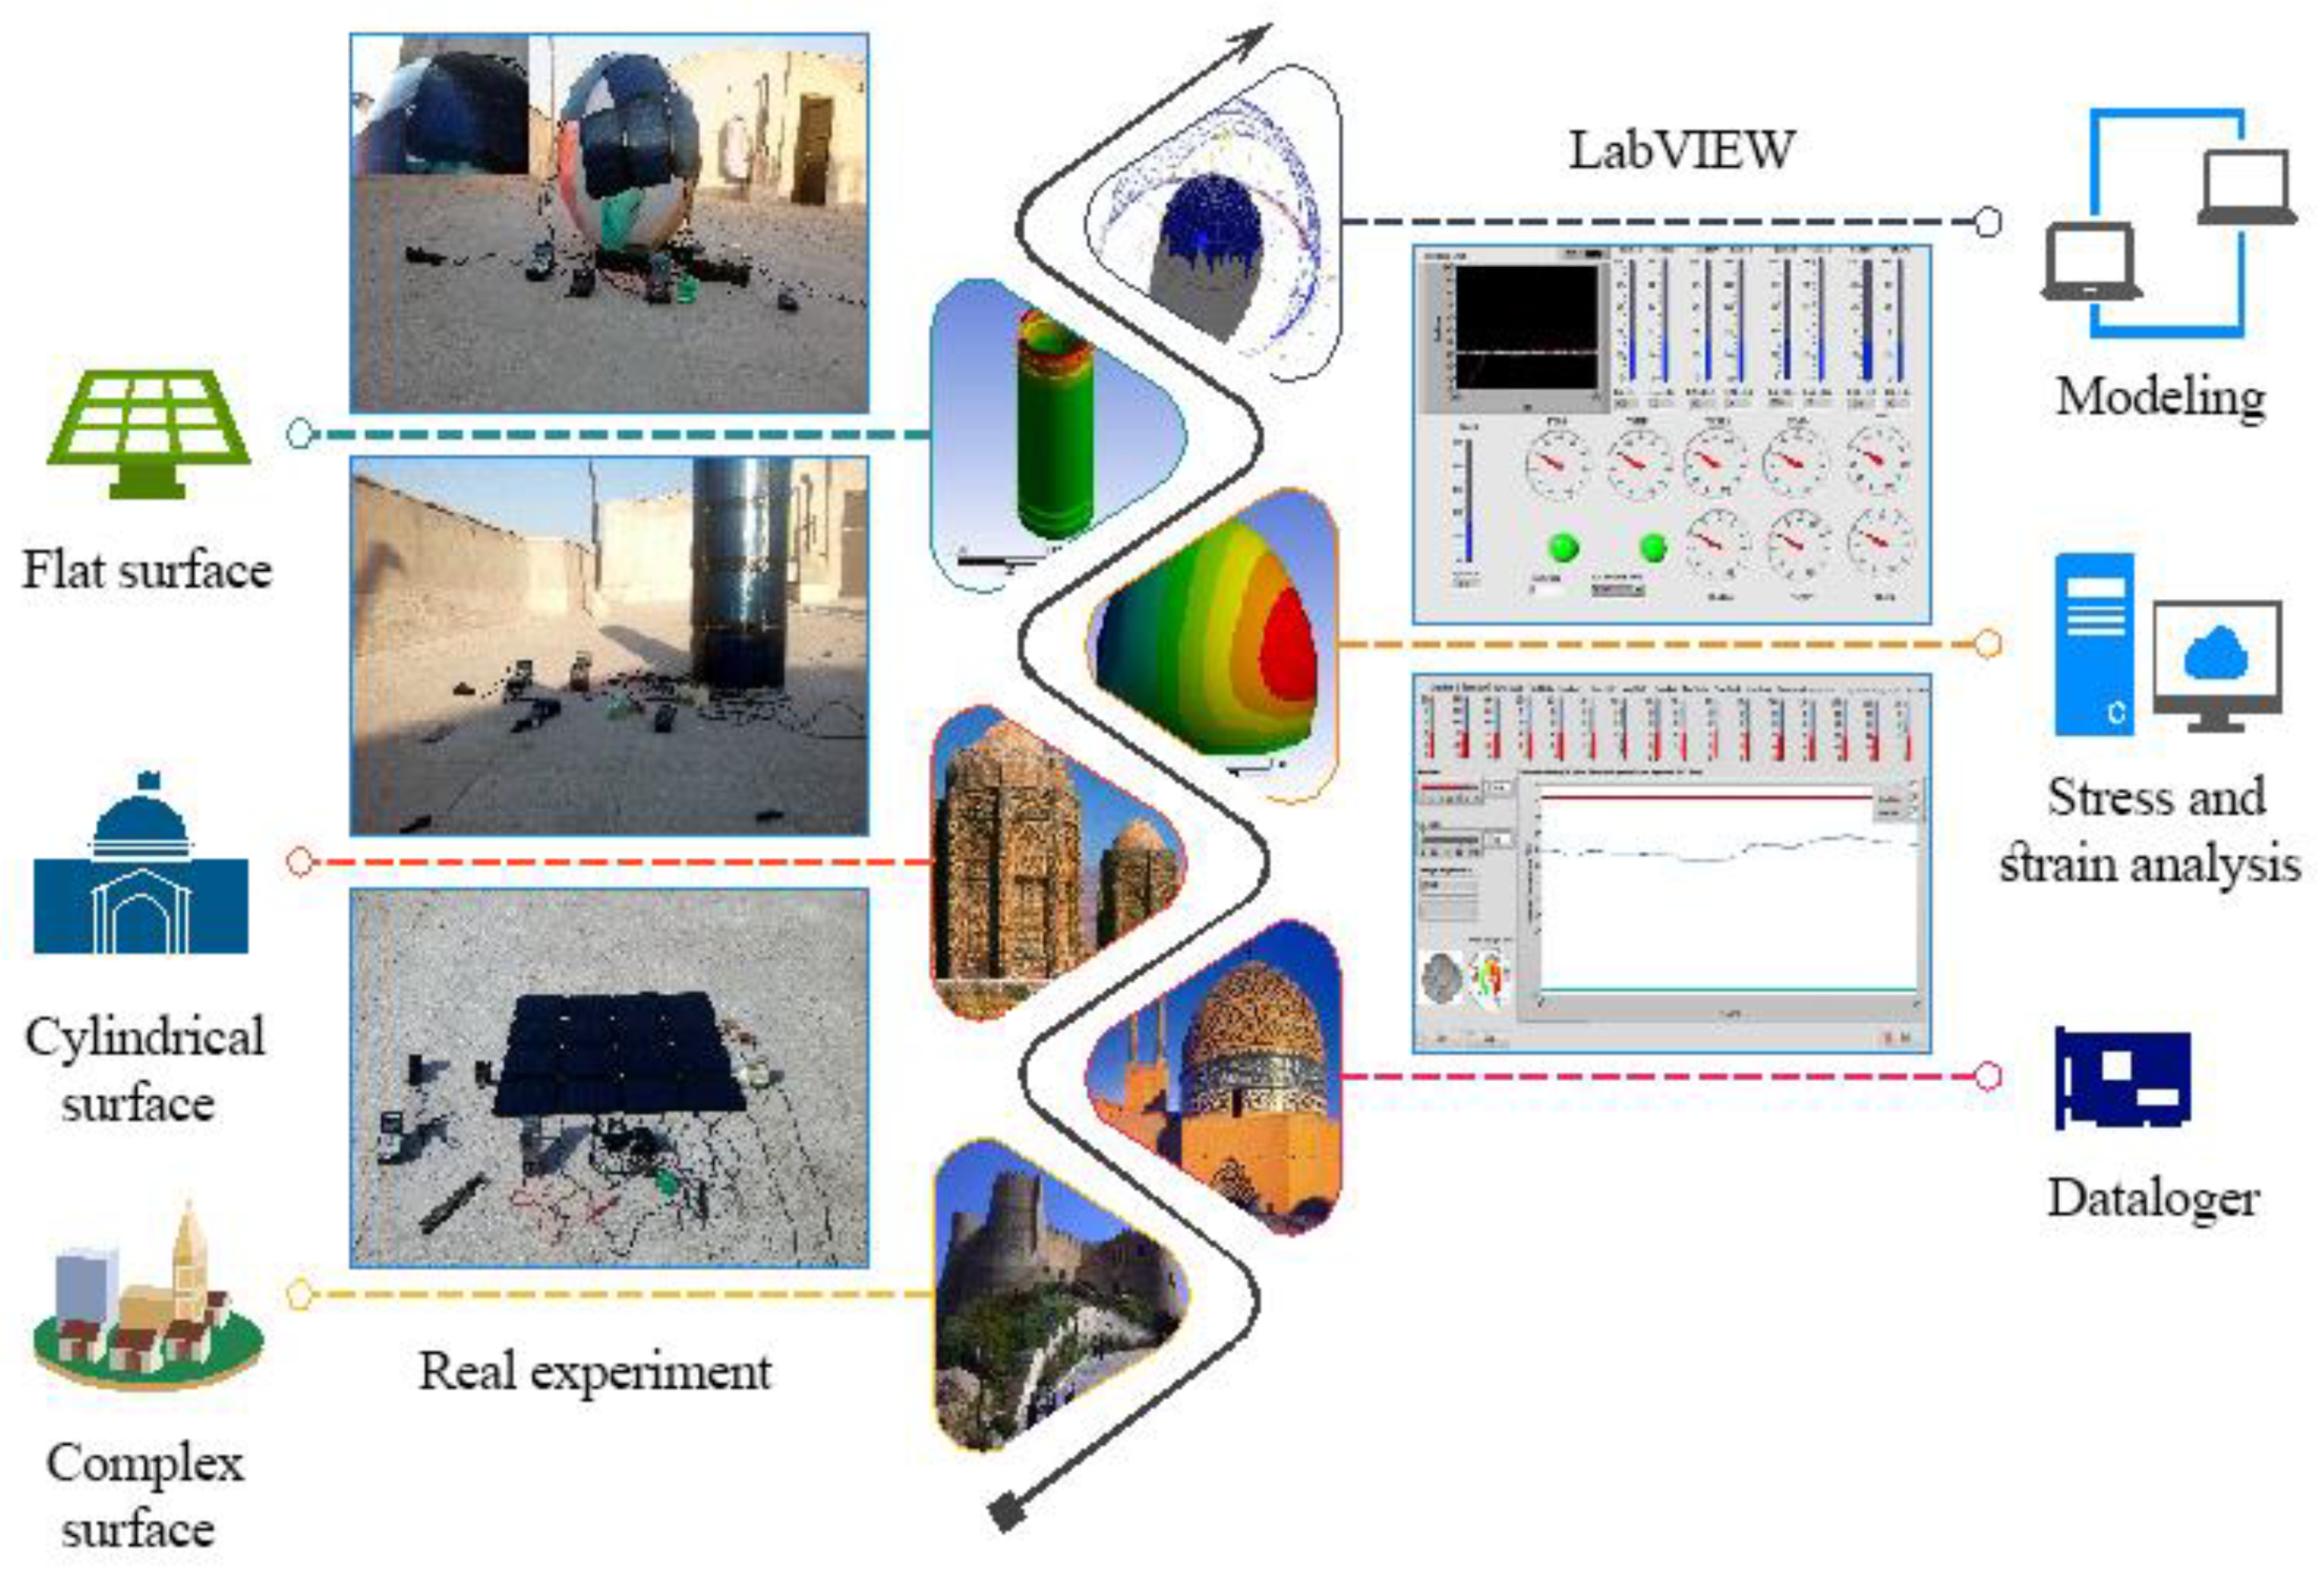
2. Materials and Methods
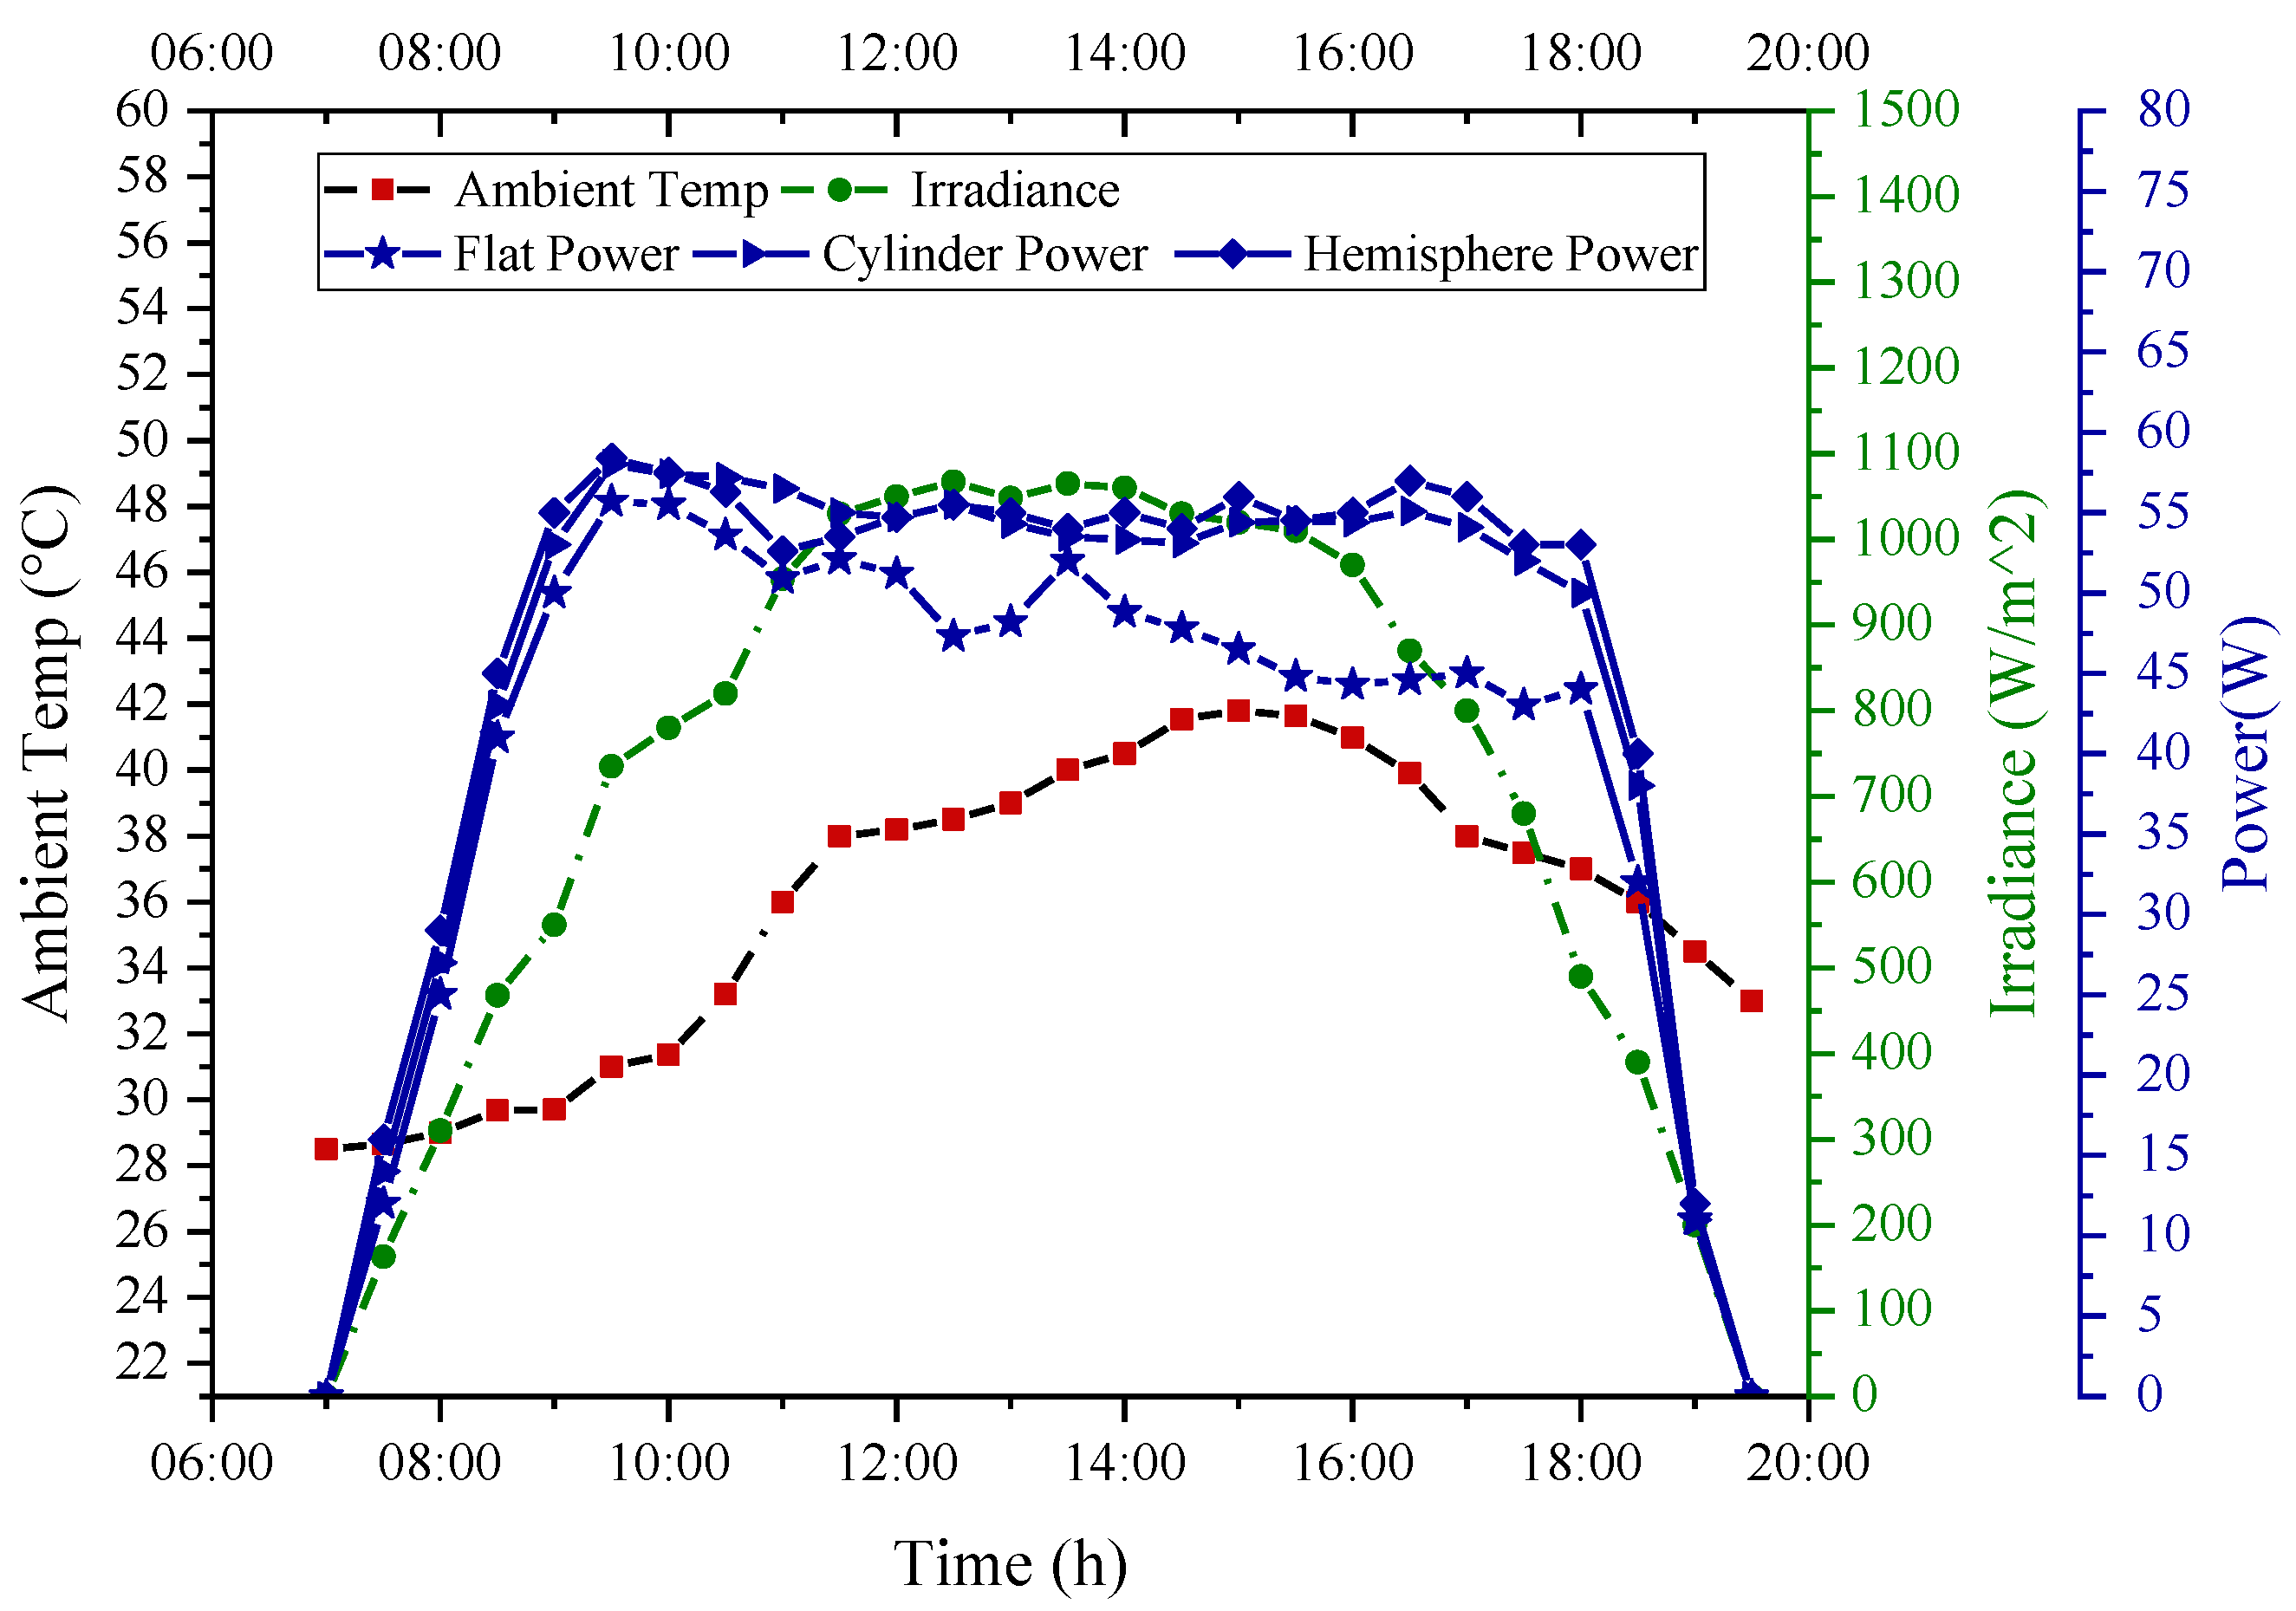
3. Results and Discussion
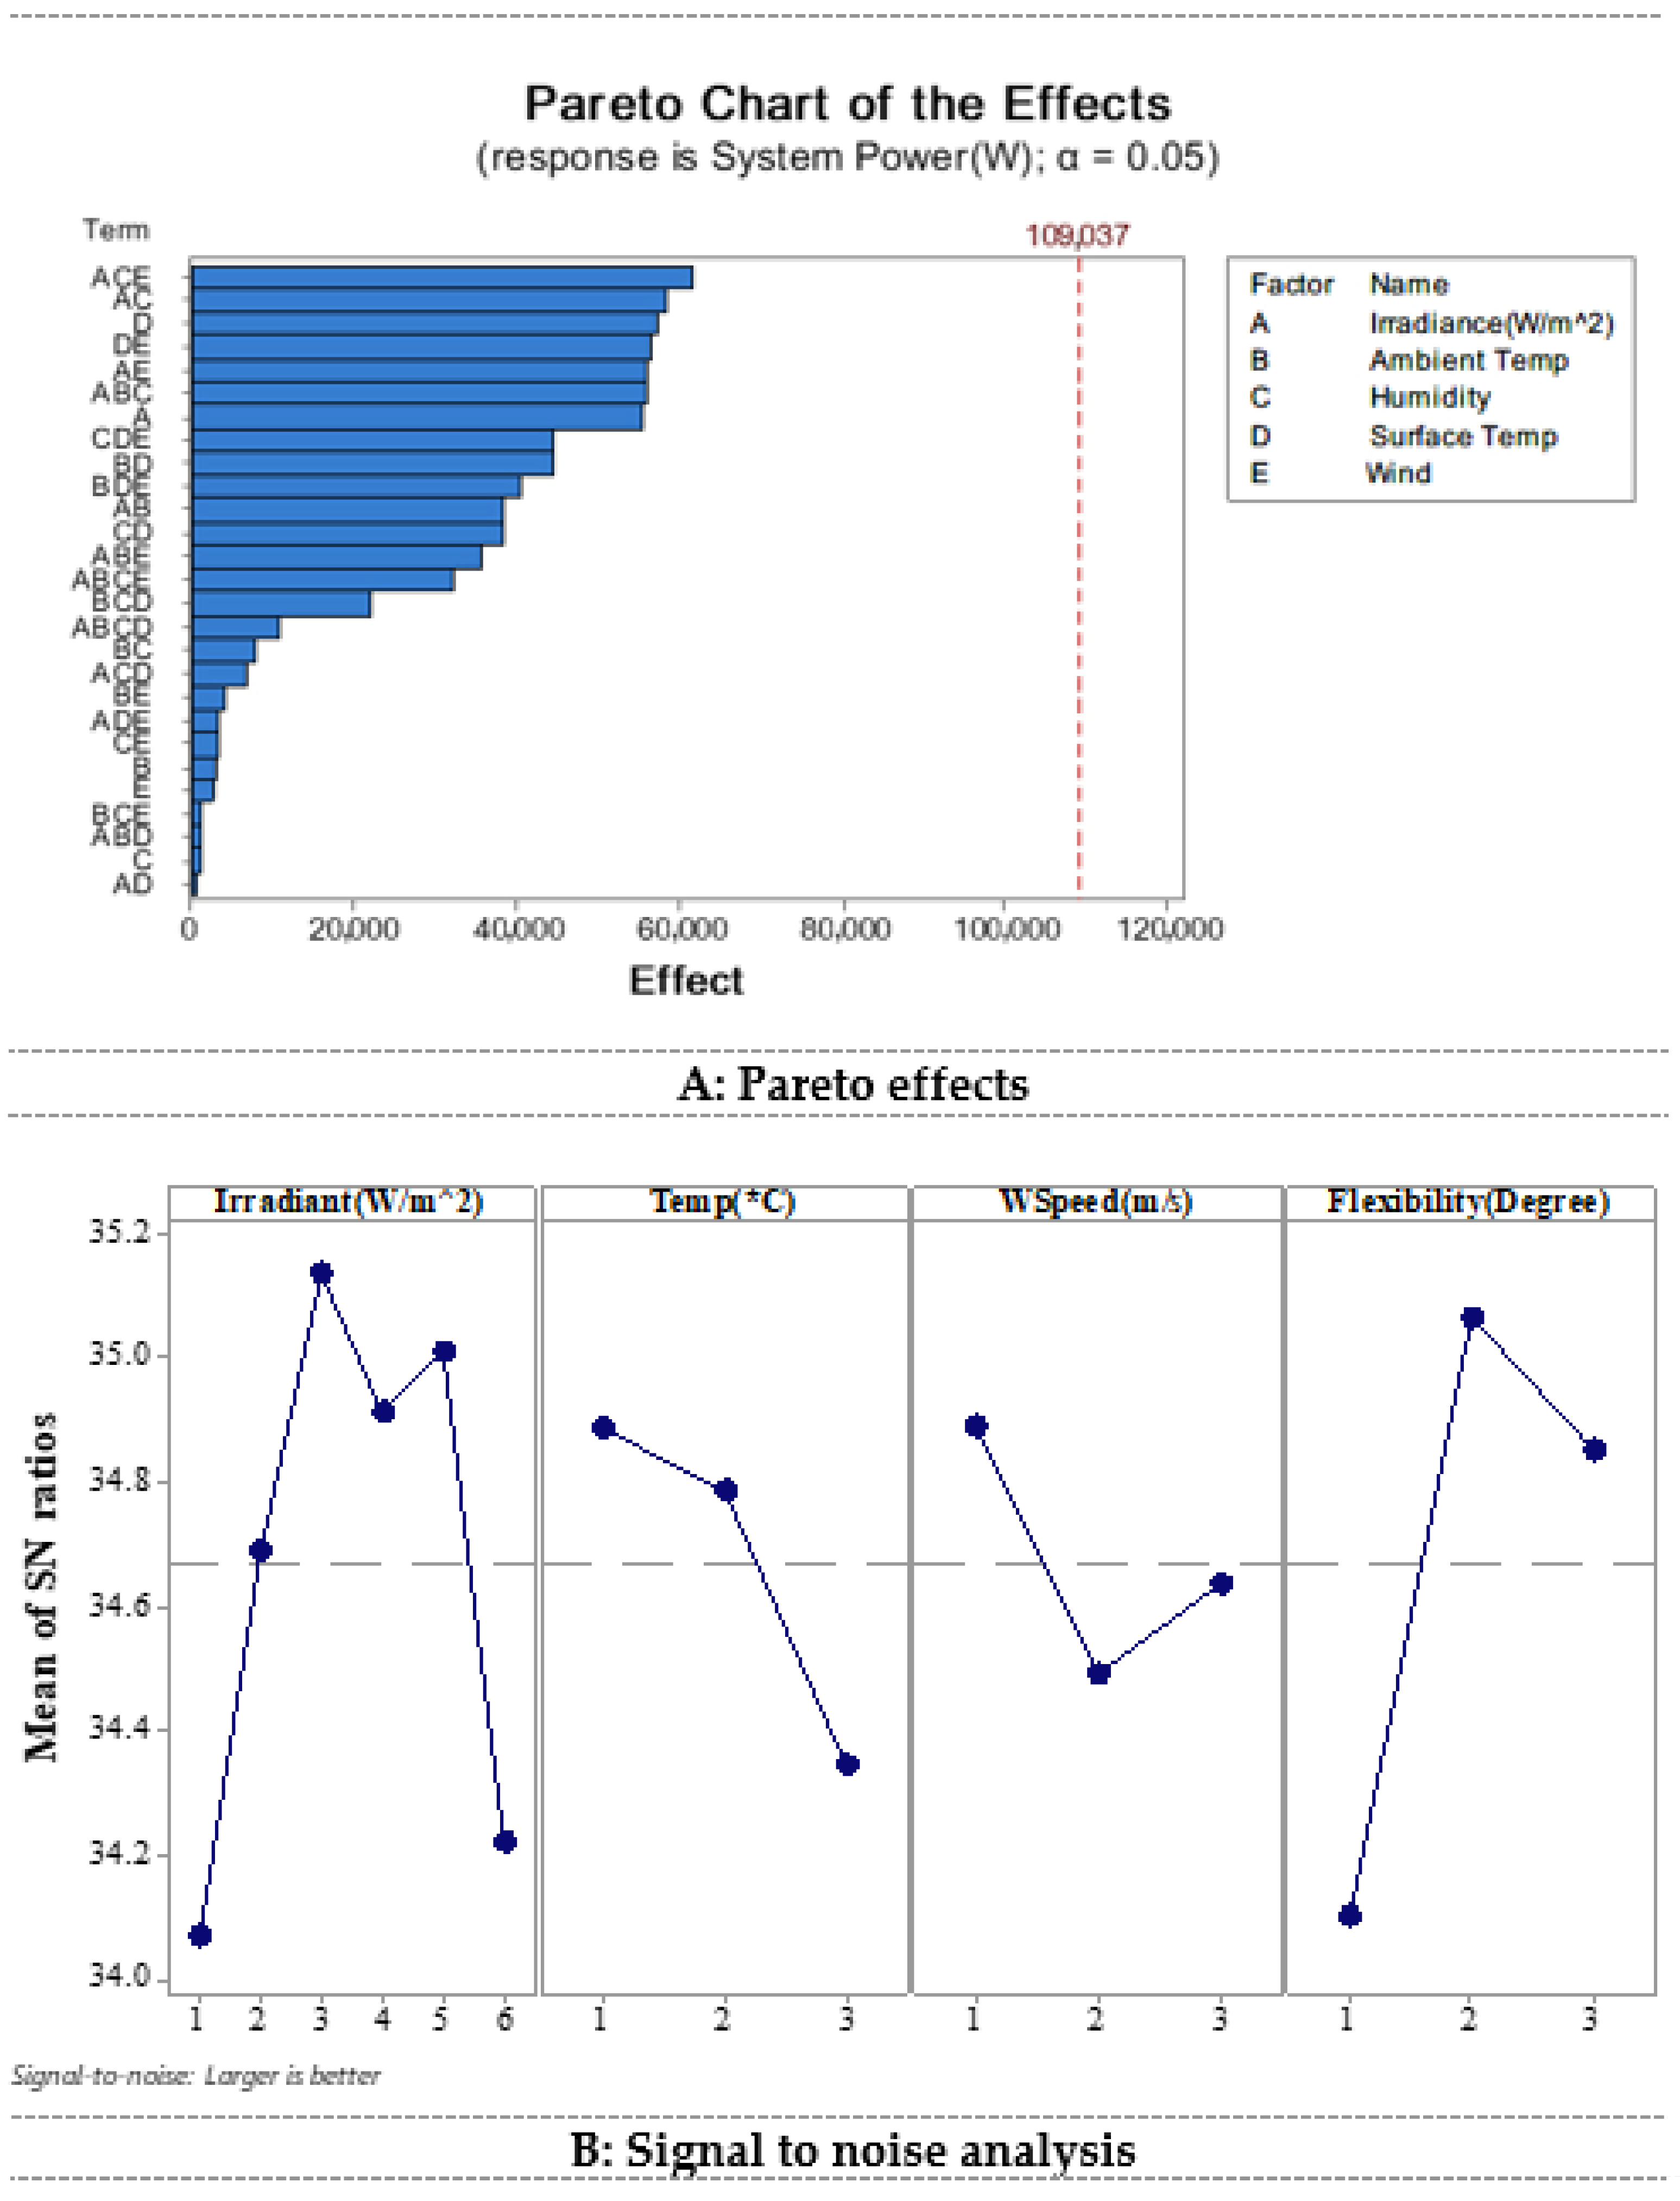
- These systems have good performance in the range of 500 to 800 W/m2. If the ambient temperature is between 20 and 30 °C, there will be no fall in performance due to the temperature on the cylindrical surface.
- For the next selection of the hemisphere’s surface, it is best to have a consistent temperature, radiation, and wind speed parameters. The second level of radiation is 500–800 W/m2, the first level of temperature is 20–30 °C, and the first level of wind is 0–1 m/s.
- The third choice for use of systems is for higher radiation up to more than 1000 W/m2 in the middle of the day. This condition can occur in areas closer to the equator. The third level of radiation is 800–1100 W/m2 and the first level of temperature is 20–30 °C, whereas the third level of wind is 2–3 m/s on the flat surface.
4. Conclusions
Author Contributions
Funding
Institutional Review Board Statement
Informed Consent Statement
Data Availability Statement
Conflicts of Interest
Nomenclature
| Symbols | Greek Symbols | ||
| A | Area (m2) | γ | Wind Speed (m·s−1) |
| Ccf | Net Annual Cash Flow ($) | η | Efficiency (%) |
| CFi | Cash Flow in the Time Period ($) | Subscript | |
| Cinv | Initial Investment ($) | mmp | Maximum Power Point |
| F | Flexibility (Degree) | sc | Short Circuit Current |
| FF | Fill Factor (%) | oc | Open Circuit Voltage |
| FiT | Feed in Tariff ($·kWh−1) | Abbreviations | |
| G | Irradiance (W·m−2) | a-Si | Amorphous Silicon |
| I | Current (A) | BCR | Benefit Cost Ratio |
| IRR | Internal Rate of Return (%) | BPV | Built Integrated Photovoltaic |
| NCFi | Net Cash Flow for Period i ($) | BOS | Balance of System |
| NPV | Net Present Value ($) | c-Si | Crystalline Silicon |
| P | Power (W) | FPVs | Flexible Photovoltaic Systems |
| r | Discount Rate (%) | GHG | Greenhouse Gases |
| St | Array Layer (m2) | PBP | Payback Period |
| S/N | Signal to Noise (dB) | PV | Photovoltaic |
| T | Temperature (°C) | RSM | Response Surface Methodology |
| t | Time (s) | SNR | Signal to Noise Ratio |
| V | Voltage (V) | STC | Standard Test Conditions |
References
- Liobikienė, G.; Butkus, M. Determinants of greenhouse gas emissions: A new multiplicative approach analysing the impact of energy efficiency, renewable energy, and sector mix. J. Clean. Prod. 2021, 309, 127233. [Google Scholar] [CrossRef]
- Jäger-Waldau, A. Overview of the Global PV Industry. Compr. Renew. Energy 2022, 1, 130–143. [Google Scholar] [CrossRef]
- IEA. Global Energy Review 2021—Analysis—IEA n.d. Available online: https://www.iea.org/reports/global-energy-review-2021 (accessed on 27 August 2021).
- Hasanien, H.M. Performance improvement of photovoltaic power systems using an optimal control strategy based on whale optimization algorithm. Electr. Power Syst. Res. 2018, 157, 168–176. [Google Scholar] [CrossRef]
- Yazid, M.N.A.W.M.; Sidik, N.A.C.; Mamat, R.; Najafi, G. A review of the impact of preparation on stability of carbon nanotube nanofluids. Int. Commun. Heat Mass Transf. 2016, 78, 253–263. [Google Scholar] [CrossRef]
- Hong, Y.Y.; Beltran, A.A.; Paglinawan, A.C. A robust design of maximum power point tracking using Taguchi method for stand-alone PV system. Appl. Energy 2018, 211, 50–63. [Google Scholar] [CrossRef]
- O’Shaughnessy, E.; Cruce, J.; Xu, K. Rethinking solar PV contracts in a world of increasing curtailment risk. Energy Econ. 2021, 98, 105264. [Google Scholar] [CrossRef]
- Ettefaghi, E.; Ghobadian, B.; Rashidi, A.; Najafi, G.; Khoshtaghaza, M.H.; Rashtchi, M.; Sadeghian, S. A novel bio-nano emulsion fuel based on biodegradable nanoparticles to improve diesel engines performance and reduce exhaust emissions. Renew. Energy 2018, 125, 64–72. [Google Scholar] [CrossRef]
- Najafi, G.; Ghobadian, B. LLK1694-wind energy resources and development in Iran. Renew. Sustain. Energy Rev. 2011, 15, 2719–2728. [Google Scholar] [CrossRef]
- Awad, O.I.; Ali, O.M.; Mamat, R.; Abdullah, A.A.; Najafi, G.; Kamarulzaman, M.K.; Yusri, I.; Noor, M. Using fusel oil as a blend in gasoline to improve SI engine efficiencies: A comprehensive review. Renew. Sustain. Energy Rev. 2017, 69, 1232–1242. [Google Scholar] [CrossRef] [Green Version]
- Chan, A.L.S. Effect of adjacent shading on the energy and environmental performance of photovoltaic glazing system in building application. Energy 2019, 187, 115939. [Google Scholar] [CrossRef]
- Oduyemi, O.; Okoroh, M. Building performance modelling for sustainable building design. Int. J. Sustain. Built Environ. 2016, 5, 461–469. [Google Scholar] [CrossRef] [Green Version]
- Zeb, R.; Salar, L.; Awan, U.; Zaman, K.; Shahbaz, M. Causal links between renewable energy, environmental degradation and economic growth in selected SAARC countries: Progress towards green economy. Renew. Energy 2014, 71, 123–132. [Google Scholar] [CrossRef]
- Azadbakht, M.; Esmaeilzadeh, E.; Esmaeili-Shayan, M. Energy consumption during impact cutting of canola stalk as a function of moisture content and cutting height. J. Saudi Soc. Agric. Sci. 2015, 14, 147–152. [Google Scholar] [CrossRef] [Green Version]
- Shukla, A.K.; Sudhakar, K.; Baredar, P.; Mamat, R. BIPV based sustainable building in South Asian countries. Sol. Energy 2018, 170, 1162–1170. [Google Scholar] [CrossRef]
- Rabab Mudakkar, S.; Zaman, K.; Shakir, H.; Arif, M.; Naseem, I.; Naz, L. Determinants of energy consumption function in SAARC countries: Balancing the odds. Renew. Sustain. Energy Rev. 2013, 28, 566–574. [Google Scholar] [CrossRef]
- Edalati, S.; Ameri, M.; Iranmanesh, M.; Tarmahi, H.; Gholampour, M. Technical and economic assessments of grid-connected photovoltaic power plants: Iran case study. Energy 2016, 114, 923–934. [Google Scholar] [CrossRef]
- Al-Falahi, M.D.A.; Jayasinghe, S.D.G.; Enshaei, H. Hybrid algorithm for optimal operation of hybrid energy systems in electric ferries. Energy 2019, 187, 115923. [Google Scholar] [CrossRef]
- Zohoori, M. Exploiting Renewable Energy Sources in Iran. Interdiscip. J. Contemp. Res. Bus. 2012, 4, 849–862. [Google Scholar]
- Solangi, K.H.; Islam, M.R.; Saidur, R.; Rahim, N.A.; Fayaz, H. A review on global solar energy policy. Renew. Sustain. Energy Rev. 2011, 15, 2149–2163. [Google Scholar] [CrossRef]
- Salehi-Isfahani, D.; Mostafavi-Dehzooei, M.H. Cash transfers and labor supply: Evidence from a large-scale program in Iran. J. Dev. Econ. 2018, 135, 349–367. [Google Scholar] [CrossRef]
- Esmaeili Shayan, M. Solar Energy and Its Purpose in Net-Zero Energy Building. In Zero-Energy Build—New Approaches and Technologies; Pérez-Fargallo, A., Oropeza-Perez, I., Eds.; IntechOpen: London, UK, 2020. [Google Scholar] [CrossRef]
- Esmaeili Shayan, M.; Najafi, G.; Gorjian, S. Design Principles and Applications of Solar Power Systems, 1st ed.; ACECR Publication-Amirkabir University of Technology Branch: Tehran, Iran, 2020. (In Persian) [Google Scholar]
- Barr, M.C.; Rowehl, J.A.; Lunt, R.R.; Xu, J.; Wang, A.; Boyce, C.M.; Im, S.G.; Bulović, V.; Gleason, K.K. Direct Monolithic Integration of Organic Photovoltaic Circuits on Unmodified Paper. Adv. Mater. 2011, 23, 3500–3505. [Google Scholar] [CrossRef] [PubMed]
- Chen, J.E.J.; Kang, S.; Zhao, X.; Zhu, H.; Deng, Y.; Peng, Q.; Zhang, Z. Modeling and characterization of the mass transfer and thermal mechanics of the power lithium manganate battery under charging process. Energy 2019, 187, 115924. [Google Scholar] [CrossRef]
- Padmanathan, K.; Govindarajan, U.; Ramachandaramurthy, V.K.; Oli Selvi, T.S.; Jeevarathinam, B. Integrating solar photovoltaic energy conversion systems into industrial and commercial electrical energy utilization—A survey. J. Ind. Inf. Integr. 2018, 10, 39–54. [Google Scholar] [CrossRef]
- Dehghan, M.; Rahgozar, S.; Pourrajabian, A.; Aminy, M.; Halek, F.S. Techno-economic perspectives of the temperature management of photovoltaic (PV) power plants: A case-study in Iran. Sustain. Energy Technol. Assess. 2021, 45, 101133. [Google Scholar] [CrossRef]
- Keshtegar, B.; Mert, C.; Kisi, O. Comparison of four heuristic regression techniques in solar radiation modeling: Kriging method vs RSM, MARS and M5 model tree. Renew. Sustain. Energy Rev. 2018, 81, 330–341. [Google Scholar] [CrossRef]
- Ghritlahre, H.K.; Prasad, R.K. Application of ANN technique to predict the performance of solar collector systems—A review. Renew. Sustain. Energy Rev. 2018, 84, 75–88. [Google Scholar] [CrossRef]
- Esmaeili Shayan, M.; Ghasemzadeh, F. Nuclear Power Plant or Solar Power Plant. In Nuclear Power Plants-Processes from Cradle to the Grave, Landon; Awwad, N., Ed.; IntechOpen: London, UK, 2020. [Google Scholar] [CrossRef]
- Najafi, G.; Ghobadian, B.; Yusaf, T.; Rahimi, H. Combustion analysis of a CI engine performance using waste cooking biodiesel fuel with an artificial neural network aid. Am. J. Appl. Sci. 2007, 4, 756–764. [Google Scholar] [CrossRef] [Green Version]
- Mat Yasin, M.H.; Mamat, R.; Najafi, G.; Ali, O.M.; Yusop, A.F.; Ali, M.H. Potentials of palm oil as new feedstock oil for a global alternative fuel: A review. Renew. Sustain. Energy Rev. 2017, 79, 1034–1049. [Google Scholar] [CrossRef] [Green Version]
- Yin, Y.; Liu, T.; He, C. Day-ahead stochastic coordinated scheduling for thermal-hydro-wind-photovoltaic systems. Energy 2019, 187, 115944. [Google Scholar] [CrossRef]
- Mohammadi, M.; Ghasempour, R.; Razi Astaraei, F.; Ahmadi, E.; Aligholian, A.; Toopshekan, A. Optimal planning of renewable energy resource for a residential house considering economic and reliability criteria. Int. J. Electr. Power Energy Syst. 2018, 96, 261–273. [Google Scholar] [CrossRef]
- Bloem, J.J.J.; Lodi, C.; Cipriano, J.; Chemisana, D. An outdoor Test Reference Environment for double skin applications of Building Integrated PhotoVoltaic Systems. Energy Build. 2012, 50, 63–73. [Google Scholar] [CrossRef]
- JMP. JNP. JP Solar 2017. Available online: http://jpsolar.net (accessed on 15 February 2018).
- Yan, J.; Luo, G.; Xiao, B.; Wu, H.; He, Z.; Cao, Y. Origin of high fill factor in polymer solar cells from semiconducting polymer with moderate charge carrier mobility. Org. Electron. 2015, 24, 125–130. [Google Scholar] [CrossRef]
- Abdolbaqi, M.K.; Azmi, W.H.; Mamat, R.; Mohamed, N.M.Z.N.; Najafi, G. Experimental investigation of turbulent heat transfer by counter and co-swirling flow in a flat tube fitted with twin twisted tapes. Int. Commun. Heat Mass Transf. 2016, 75, 295–302. [Google Scholar] [CrossRef] [Green Version]
- Esmaeili Shayan, M.; Najafi, G.; Lorenzini, G. Phase change material mixed with chloride salt graphite foam infiltration for latent heat storage applications at higher temperatures and pressures. Int. J. Energy Environ. Eng. 2022. [Google Scholar] [CrossRef]
- Esmaeili Shayan, M.; Najafi, G.; Ghobadian, B.; Gorjian, S.; Mazlan, M. Sustainable Design of a Near-Zero-Emissions Building Assisted by a Smart Hybrid Renewable Microgrid. Int. J. Renew. Energy Dev. 2022, 11, 471–480. [Google Scholar] [CrossRef]
- Schwab, B.; Lusztig, P. A Comparative Analysis of the Net Present Value and the Benefit-Cost Ratio as Measures of the Economic Desirability of Investments. J. Financ. 1969, 24, 507. [Google Scholar] [CrossRef]


| Characteristic | Unit | Value |
|---|---|---|
| Power 1 | W | 3.5 |
| Short-circuit current | A | 0.3 |
| Absolute point voltage | V | 12 |
| Open circuit voltage | V | 14 |
| Dimensions | mm | (290,210,5) |
| Factor | Variables | Units | Taguchi | RSM | |||
|---|---|---|---|---|---|---|---|
| Level 1 | Level 2 | Level 3 | Low Actual | High Actual | |||
| A | Irradiance | W/m2 | 200–500 | 500–800 | 800–1100 | 200 | 1100 |
| B | Temperature | °C | 20–30 | 30–40 | 40–50 | 20 | 50 |
| C | Wind Speed | m/s | 0–1 | 1–2 | 2–3 | 0 | 3 |
| D | Flexibility | Degree | Flat | Cylinder | Hemisphere | 0 | π |
| Systems | Power Production (kWh·USD) | Total Revenue Per Year (USD) |
|---|---|---|
| Flat | 810.369 × 0.05 | 40.518 |
| Cylinder | 960.124 × 0.05 | 48.006 |
| Hemispherical | 1000.165 × 0.05 | 50.008 |
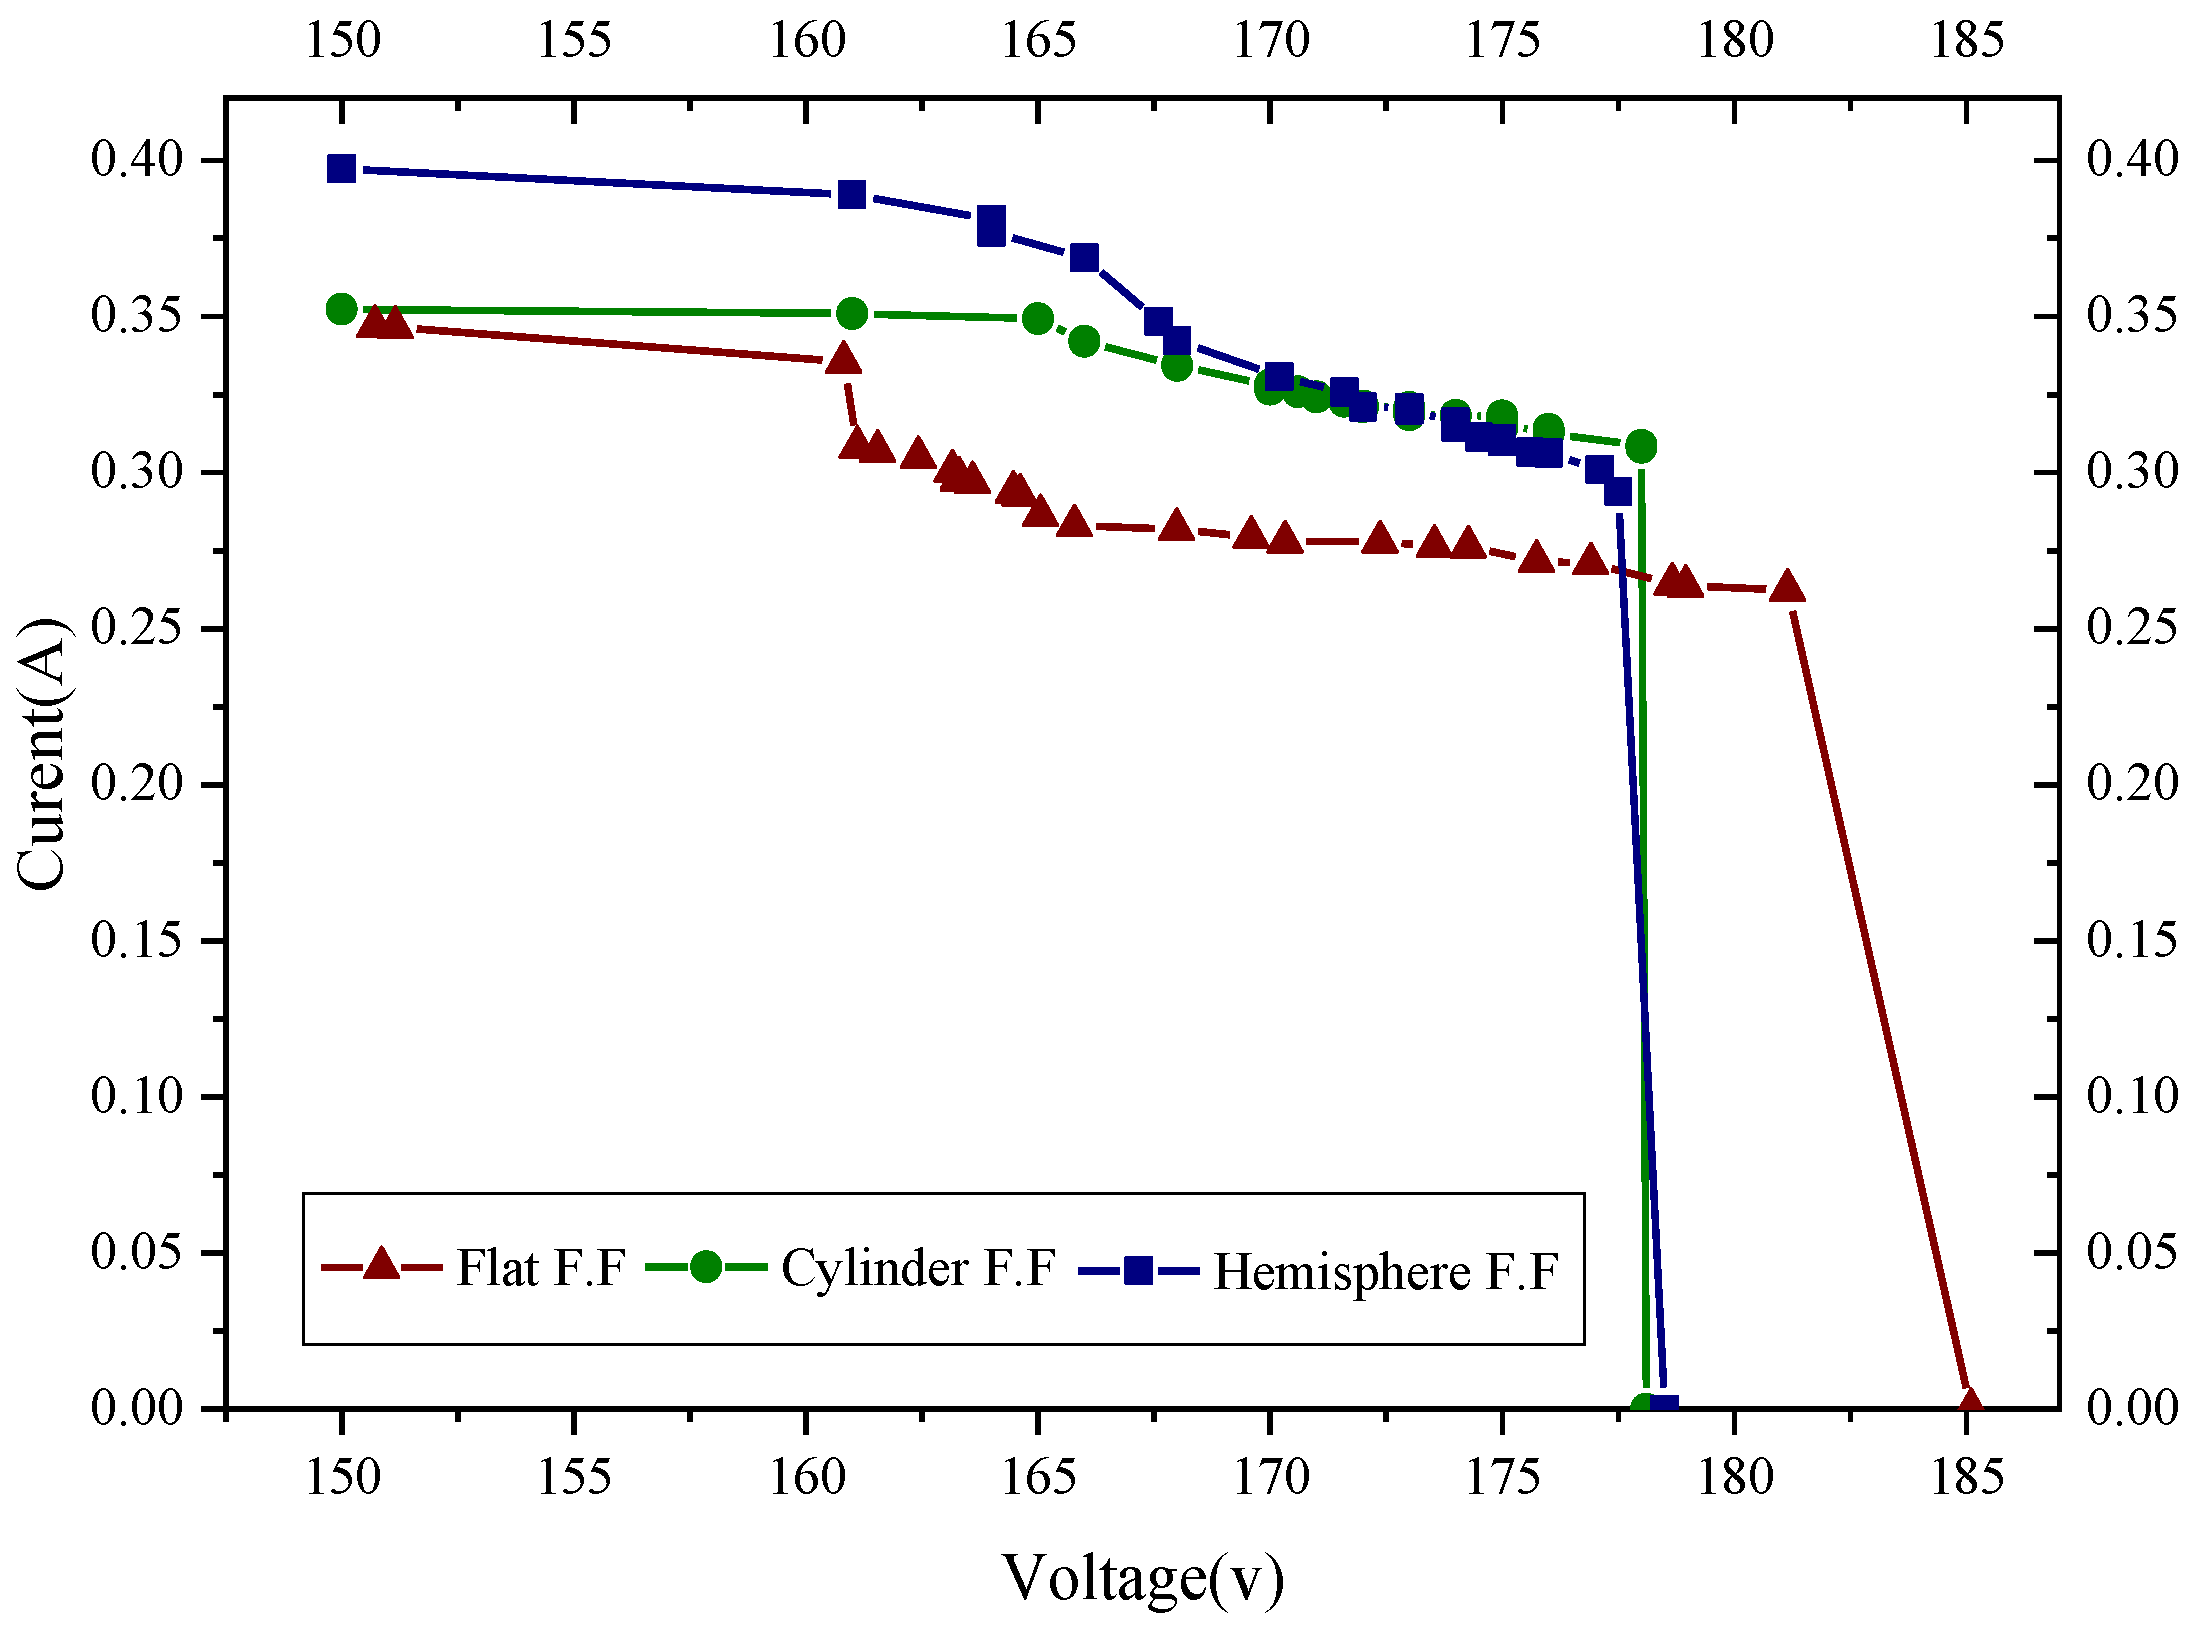
| Power Plan | MP * Taguchi (W) | MP RSM (W) | FF (%) | P * (%) | OCV * (V) | SCC * (A) | IRR | NPV * |
|---|---|---|---|---|---|---|---|---|
| Flat S. | 57.84 | 56.6 | 73 | 7.1 | 185 | 0.34 | 34.8 | 697.5 |
| Cylindrical S. | 59.87 | 57.71 | 88 | 7.4 | 179 | 0.35 | 39.2 | 900.8 |
| Hemisphere S. | 58.27 | 61.14 | 84 | 7.4 | 178 | 0.36 | 40.4 | 955.1 |
Publisher’s Note: MDPI stays neutral with regard to jurisdictional claims in published maps and institutional affiliations. |
© 2022 by the authors. Licensee MDPI, Basel, Switzerland. This article is an open access article distributed under the terms and conditions of the Creative Commons Attribution (CC BY) license (https://creativecommons.org/licenses/by/4.0/).
Share and Cite
Esmaeili Shayan, M.; Najafi, G.; Ghobadian, B.; Gorjian, S.; Mazlan, M.; Samami, M.; Shabanzadeh, A. Flexible Photovoltaic System on Non-Conventional Surfaces: A Techno-Economic Analysis. Sustainability 2022, 14, 3566. https://doi.org/10.3390/su14063566
Esmaeili Shayan M, Najafi G, Ghobadian B, Gorjian S, Mazlan M, Samami M, Shabanzadeh A. Flexible Photovoltaic System on Non-Conventional Surfaces: A Techno-Economic Analysis. Sustainability. 2022; 14(6):3566. https://doi.org/10.3390/su14063566
Chicago/Turabian StyleEsmaeili Shayan, Mostafa, Gholamhassan Najafi, Barat Ghobadian, Shiva Gorjian, Mohamed Mazlan, Mehdi Samami, and Alireza Shabanzadeh. 2022. "Flexible Photovoltaic System on Non-Conventional Surfaces: A Techno-Economic Analysis" Sustainability 14, no. 6: 3566. https://doi.org/10.3390/su14063566
APA StyleEsmaeili Shayan, M., Najafi, G., Ghobadian, B., Gorjian, S., Mazlan, M., Samami, M., & Shabanzadeh, A. (2022). Flexible Photovoltaic System on Non-Conventional Surfaces: A Techno-Economic Analysis. Sustainability, 14(6), 3566. https://doi.org/10.3390/su14063566