Article

Changes in People’s Mobility Behavior in Greece after the COVID-19 Outbreak

1
School of Traffic and Transportation Engineering, Central South University, Changsha 410075, China
2
School of Mechanical Engineering, National Technical University of Athens, 15780 Athens, Greece
*
Author to whom correspondence should be addressed.
Sustainability 2022, 14(6), 3567; https://doi.org/10.3390/su14063567
Submission received: 25 January 2022 / Revised: 24 February 2022 / Accepted: 5 March 2022 / Published: 18 March 2022

Abstract

:
The lockdown and social distancing policies to reduce COVID-19 spread and perceived safety threats of COVID-19 significantly affected people’s travel behavior. Greece has been suffering from the COVID-19 pandemic, and people’s mobility behavior has been greatly affected. This study aims at: (1) exploring the variations in individuals’ trip frequencies by mode and purpose before and after the COVID-19 outbreak; (2) understanding the effects of individual differences (i.e., sociodemographic details) and perceptions towards COVID-19 (i.e., the perceived threats of COVID-19) on people’s mobility behavior changes after the outbreak; (3) underlining the individuals’ perceptions of the COVID-19 threat on the willingness of public transportation usage. Overall, 403 responses were collected in late 2020. A series of random parameter Probit modeling results reveal multiple individual and perception factors affecting the changes in mobility behavior in Greece. The results from structural equation modeling indicate that perceived COVID-19 threats affect the attitudes and subjective norms towards people’s intentions to use public transportation. The results from this study provide valuable insights for transportation authorities to develop effective strategies to manage traffic during the spread of disease for a possible future epidemic.

1. Introduction

The World Health Organization declared COVID-19 (Coronavirus disease 2019) as a pandemic in March 2020 [1]. COVID-19 has been adversely affecting all aspects of human societies [2,3] after its outbreak in late 2019. As of 27 July 2021, the number of COVID-19 confirmed cases had reached over 194 million, and nearly 4.16 million have died [4]. To control the spread of COVID-19 in its early period, governments took a series of actions, including closure of non-essential businesses, self-isolation, and travel bans [5,6]. Traditional offline working shifted to online working and telecommuting [7,8]. Additionally, the COVID-19 pandemic situation has been largely affecting people’s travel behavior around the world [9].
Recently, many studies around the globe, i.e., China [10,11], Italy [12], Australia [13], Sweden [14], Spain [15], the United States [16], Pakistan [9], Germany [17,18,19], Greece [20], Jordan [21], and Turkey [1], have been focusing on the variations in people’s mobility and travel behavior during COVID-19. Past studies pointed out that trip frequencies, travel duration, mode choice, commuting, and public transport usage worldwide have been receiving adverse effects of the COVID-19 pandemic [22,23]. A review of previous studies highlights that few modeling efforts have been conducted in the past to explore the relationship among mobility behaviors (travel trips by modes and by purposes), sociodemographic, and COVID-19 severity periods.
The mobility behavior changes mentioned in the previous studies were sensitive to the local context, including regional variations, socioeconomics, culture, and territorial boundaries. For example, shared bikes became popular mobility options for people living in Thessaloniki, Greece [8]. In contrast, the average trip duration in New York, Chicago, and Boston has been increased together with reduction in bike trips due to COVID-19 [24]. Likewise, the effects of socioeconomic characteristics, including gender, income, and age, on change in travel behavior were observed in Greece [22].
Whilst there have been multiple studies conducted to explore the COVID-19 impacts on travel behavior, the studies using modeling attempt to explore the relationship of change in mobility behaviors (i.e., travel trip frequencies and travel purposes) with respect to the change in COVID-19 severity periods are limited especially in the Greek context. Furthermore, past studies relied on the data from the early stages of the COVID-19 outbreak, rather than the last months of 2020 when Greece faced the peak of COVID-19 confirmed cases and deaths. Furthermore, the current understanding of perceived COVID-19 threats on behavioral intentions towards public transport usage is also limited.
Thus, this study aims to fill this research gap and provide suggestions and references for relevant authorities regarding transportation management in pandemics. This study consists of three main objectives. First, to reveal the changes in the people’s mobility behavior in aspects of average weekly travel frequencies and trips by transportation modes and by purpose before and after the COVID-19 outbreak. Second, to quantify the influence of sociodemographic characteristics, public perceptions, and COVID-19 perceived fears on the changes in trip frequency by travel modes and travel purposes after the COVID-19 outbreak. Third, to measure the influence of the attitudes, subjective norms, and perceived COVID-19 threats on the behavioral intentions to use public transportation.
The current study differs from previous ones [8,20] that explored the COVID-19 impacts in Greece in some aspects. For example, this study uses the data collected in November and December of 2020 to explore the factors affecting the travel frequencies by modes and change in travel purposes after the outbreak together with the effects of the perceived threat from COVID-19 on the public intentions regarding public transportation usage. By adopting the random parameter probit modeling approach, this study extends the existing literature by exploring the heterogeneity across the self-reported responses. Besides, the structural equation modeling approach benefited this study by exploring the relationship among perceived COVID-19 threat, attitudes, subjective norms, and public transportation usage intentions. To sum up, this study provides a detailed picture of the mobility changes due to COVID-19 as it covers sociodemographic aspects, changes in travel frequencies and travel purposes, and public perceptions of safety threats of COVID-19.
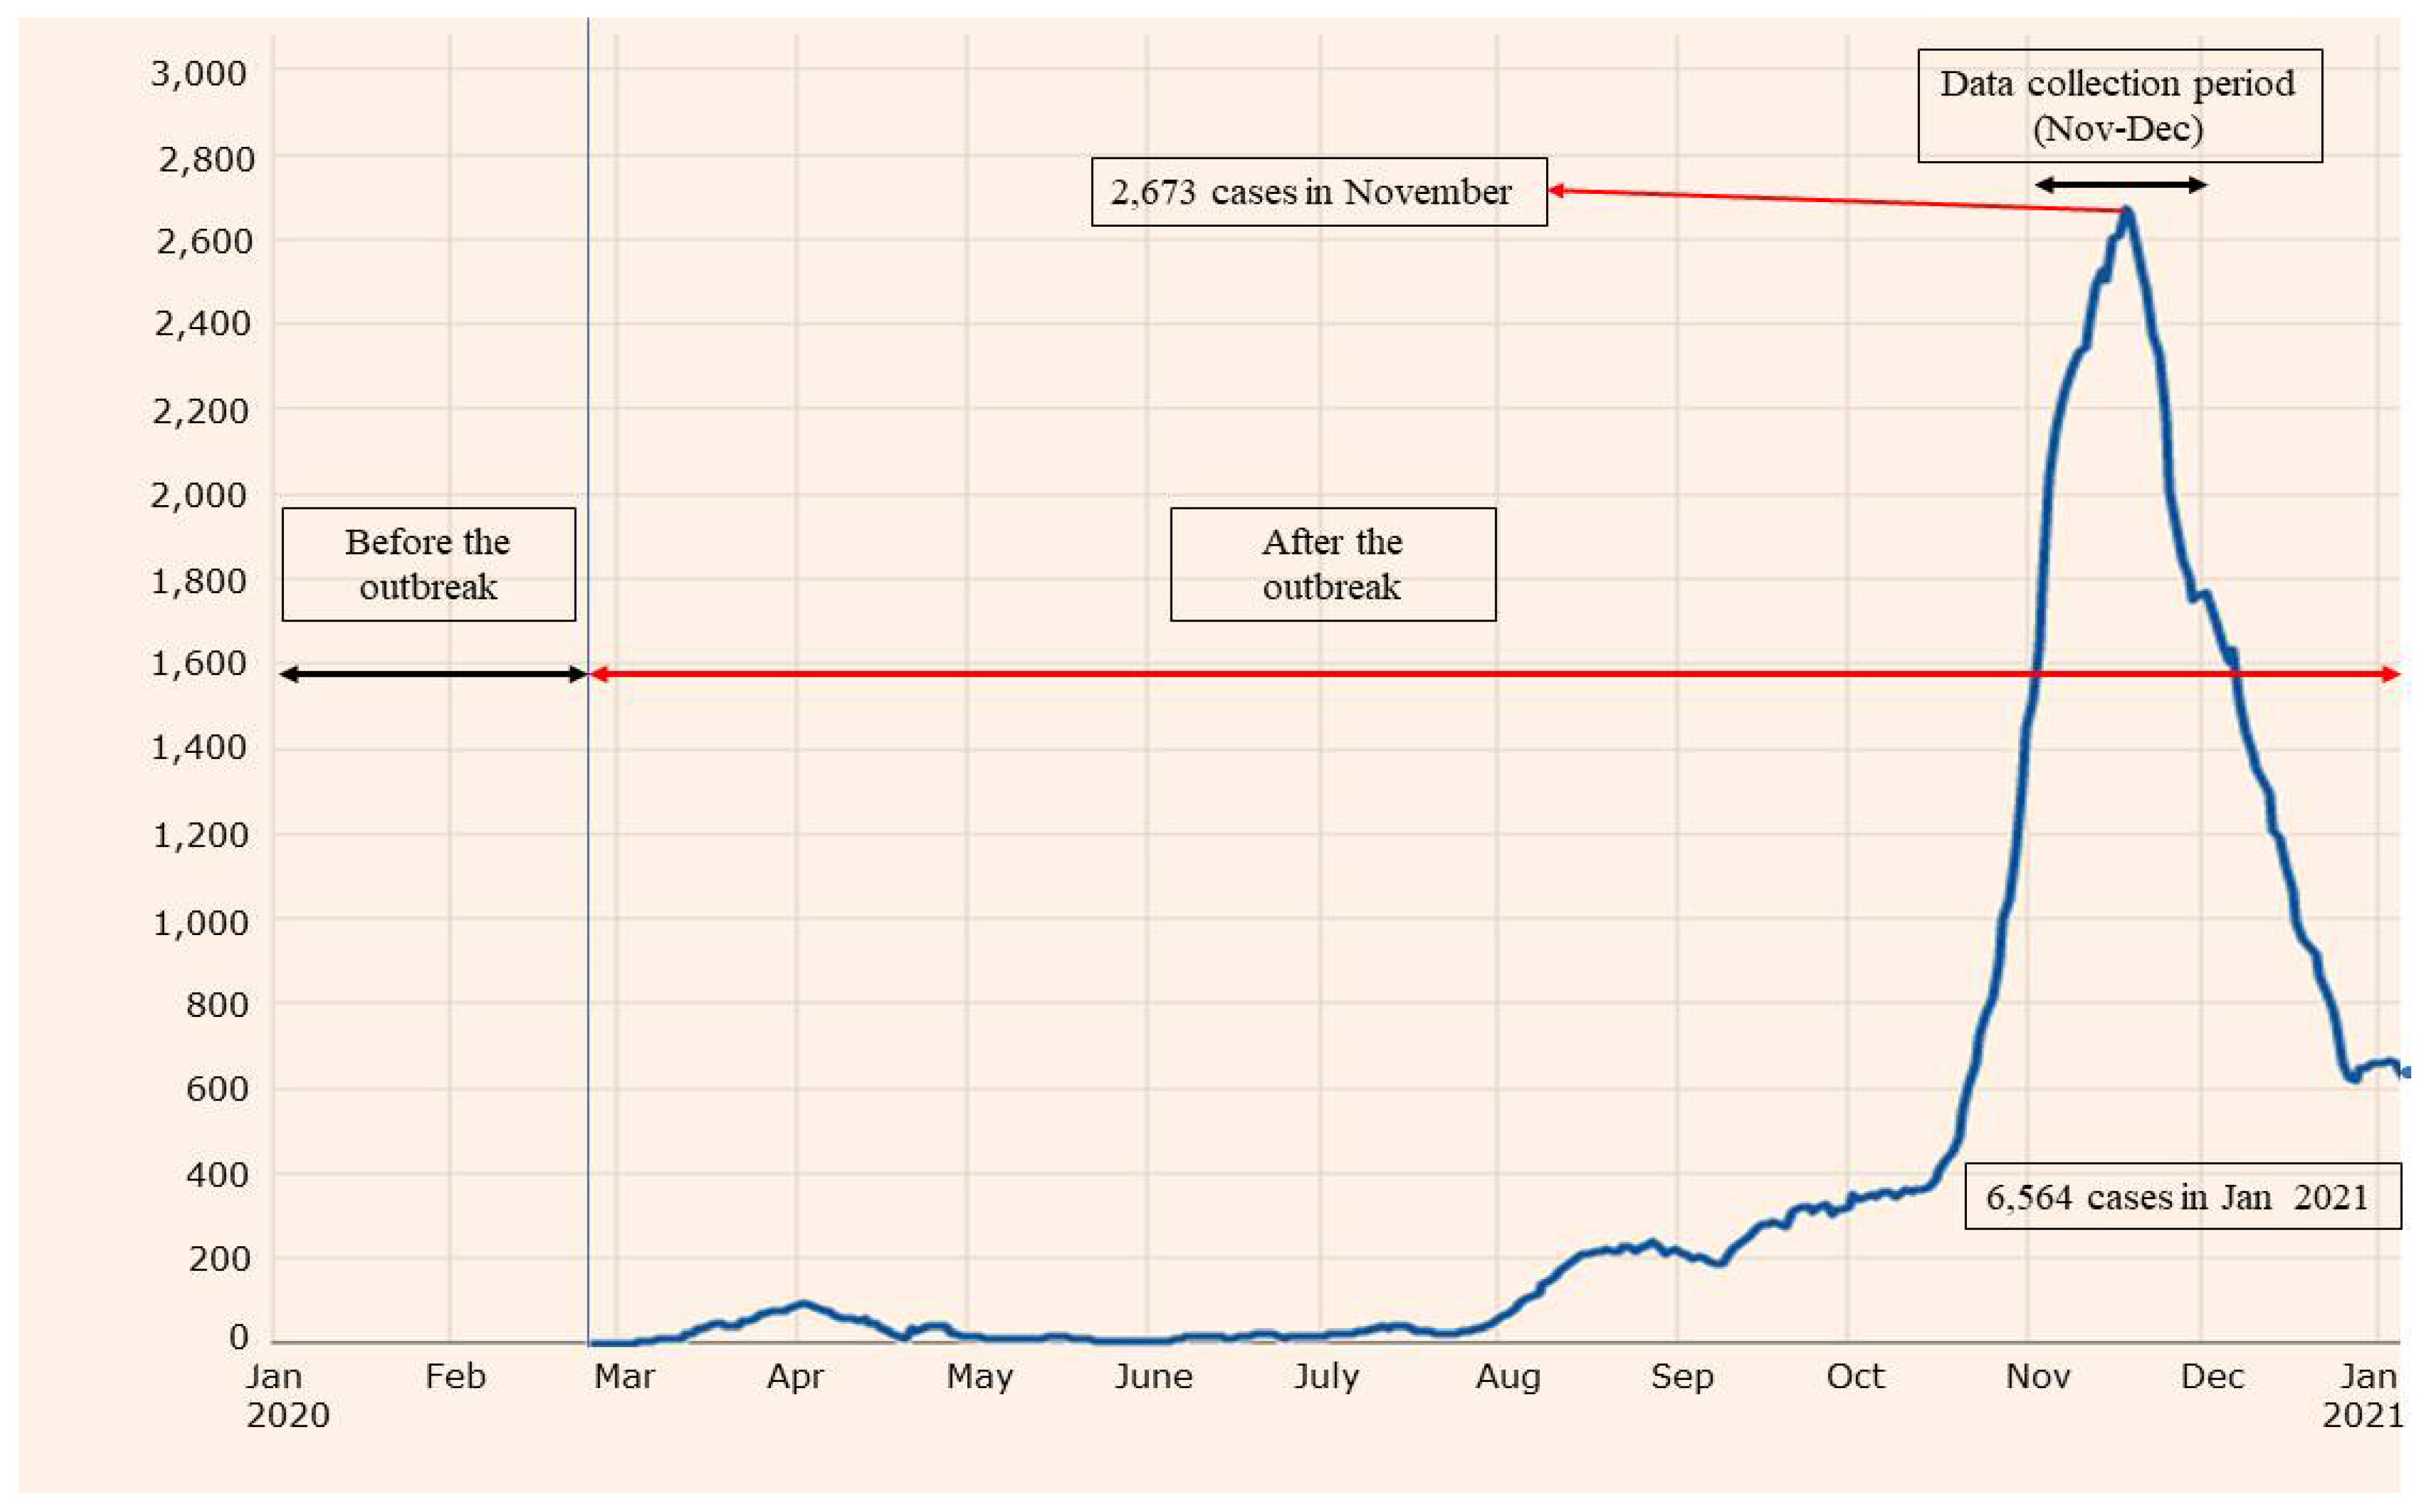
In Greece, COVID-19 cases started to be confirmed in the last days of February 2020 [20]. The increasing trend in the confirmed COVID-19 cases varied throughout the year, as presented in Figure 1. After the outbreak, Greece implemented lockdown measures [5], resulting in a slow increase in the number of confirmed COVID-19 cases in the first few months. The end of Greece’s first lockdown period ended in early May 2020, but a few months later, specifically in early November, the country was locked down all over again with strict measures. Even with tough restrictions in place, the confirmed COVID-19 cases dramatically increased in November and December 2020, as shown in Figure 1.
For understanding, this study included two time periods, i.e., before the outbreak and after the outbreak, as shown in Figure 1. As mentioned previously, Greece has experienced nationwide lockdowns. When the national lockdown was not active, there were still active restrictions carried out by the government. For most of the outbreak period, schools and universities were closed down, and teaching was mostly conducted online. Likewise, work from home was maintained at a high level but varied depending mainly on different companies’ policies. The government regularly emphasized social distancing, and face masks were kept mandatory only in indoor places and on transportation. The entertainment sector also saw restrictions, which kept entertainment-related places shut due to their indoor nature or large potential crowds.

Willingness to Use Public Transportation

COVID-19 has adversely affected the public transportation systems worldwide. As a result, public transportation’s ridership has continuously decreased and has received negative public perceptions [25]. To this view, researchers and policymakers are interested in people’s intentions to use public transportation to develop marketing strategies and managerial applications to increase ridership [26,27]. The transportation policy-related soft measures, which include voluntary changes through psychological and behavioral strategies, play an essential role in motivating people to use public transportation by enhancing intentions to use public transportation [28,29]. Therefore, it is of great interest to explore the willingness to use public transportation in Greece to propose managerial implications for the transportation agencies supporting the increase in ridership in the post-pandemic world.
The behavioral theories that have remained prominent in transportation literature to explore people’s behavioral intentions and willingness, include the theory of reasoned action [30], theory of planned behavior [31], the social cognitive theory [32], technology acceptance model [33], and unified theory of acceptance and use of technology [34]. For example, Alzahrani et al. [35] applied the theory of reasoned action to explore the consumers’ intentions to use hybrid electric vehicles in Saudi Arabia. Baig et al. [29] used the theory of planned behavior to identify the factors to promote pro-social behavior necessary for inclusive public transportation. The social cognitive theory has been applied to explore the media influence on the public acceptance of automated vehicles [36]. The technology acceptance model and unified theory of acceptance and use of technology have been applied to explore the intentions to use electric vehicles [37] and shared electric car-sharing systems [37].
Past studies indicate that the applications of social and behavioral theories vary according to the context of the behavior and influential factors [38]. The behavioral intentions to use public transportation in the post-pandemic period have not been sufficiently explored in the Greek context. Additionally, theory of reasoned action can be considered as the basic theory to explore behavioral intentions holding an explanatory power across various cultural contexts [39]. Therefore, the present study applied the theory of reasoned action to explore the intentions to use public transportation in the post-pandemic period. According to the theory of reasoned action, attitudes and subjective norms influence people’s behavioral intentions. The attitude refers to unfavorableness or favorableness towards performing a behavior [40]. Subjective norms indicate the perceived social pressure that others (parents, spouse, friends) desire the individual to perform or not perform a behavior [41]. To capture the safety threats of COVID-19, perceived COVID-19 threats were also considered to predict the behavioral intentions to use public transportation following previous studies [42,43]. Perceived COVID-19 threats mean one’s feeling of fear from COVID-19, which is also a reason for people to avoid public transportation after pandemics [43].
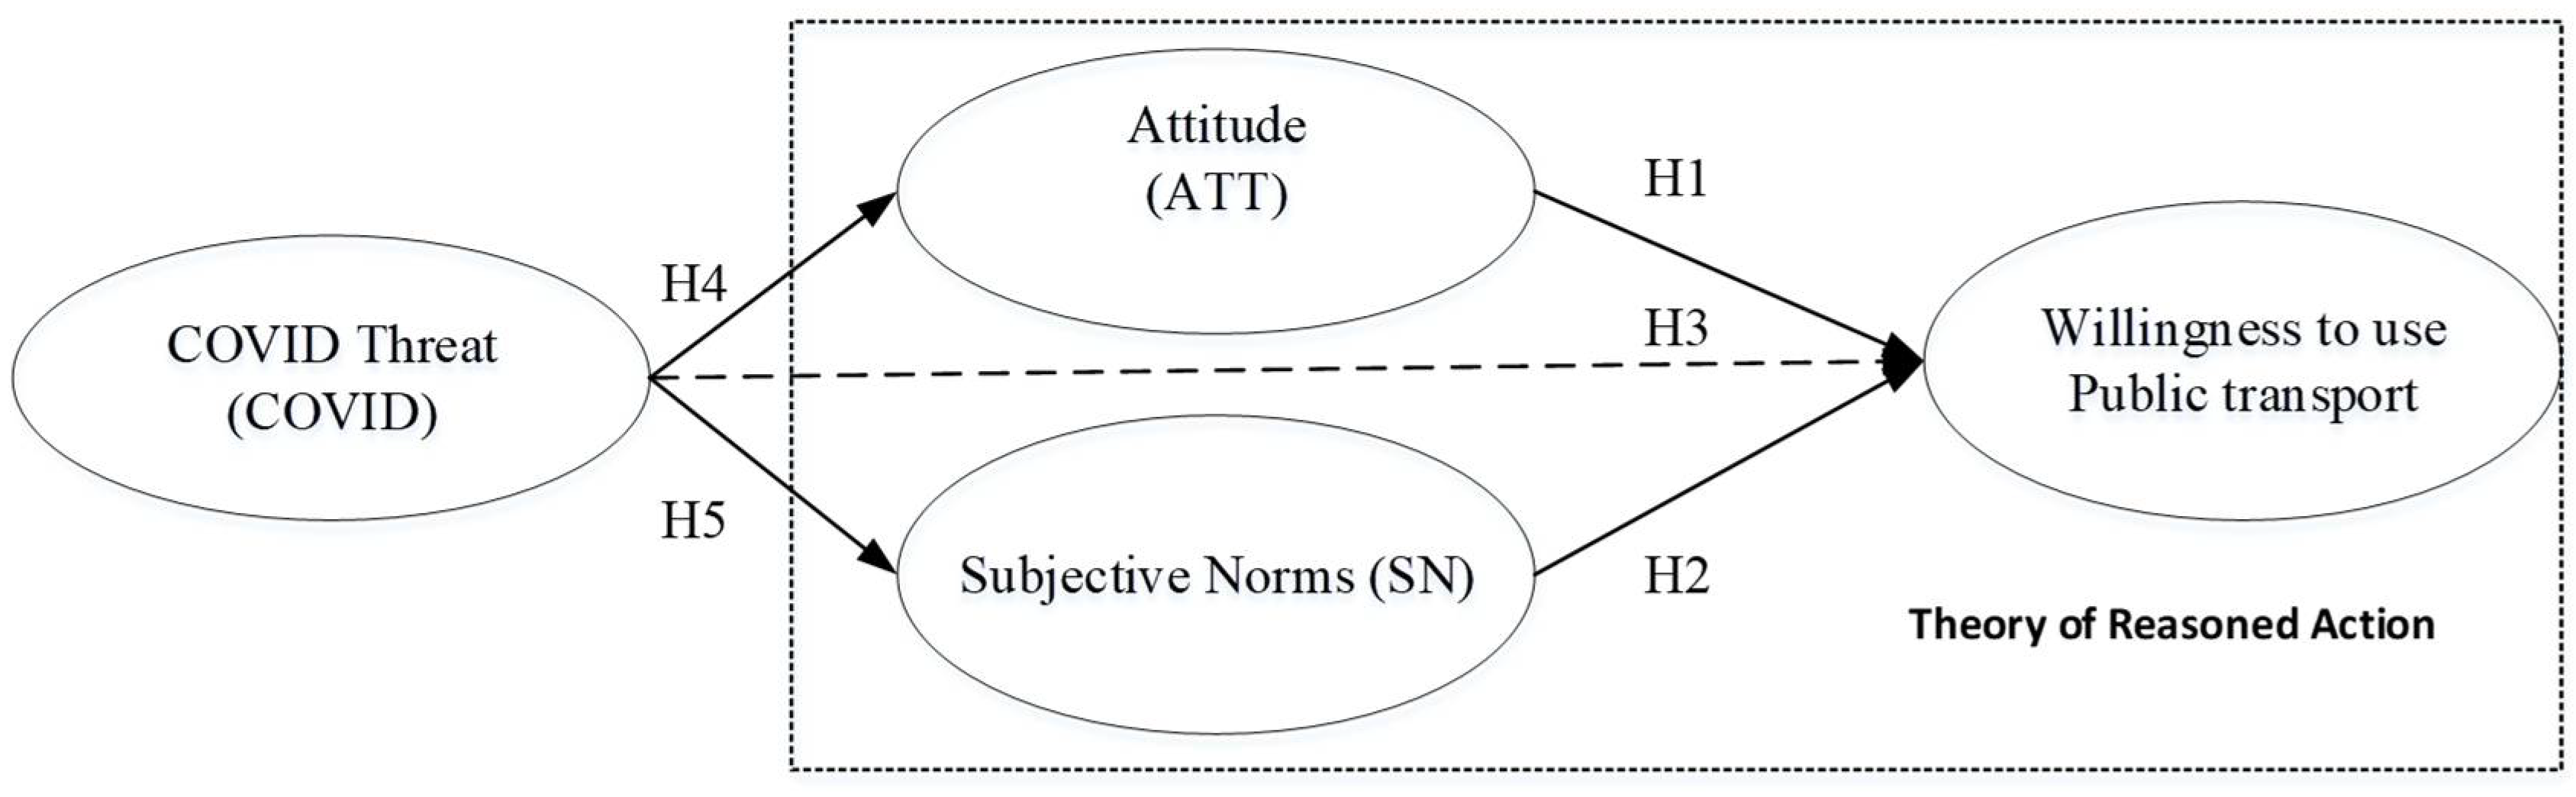
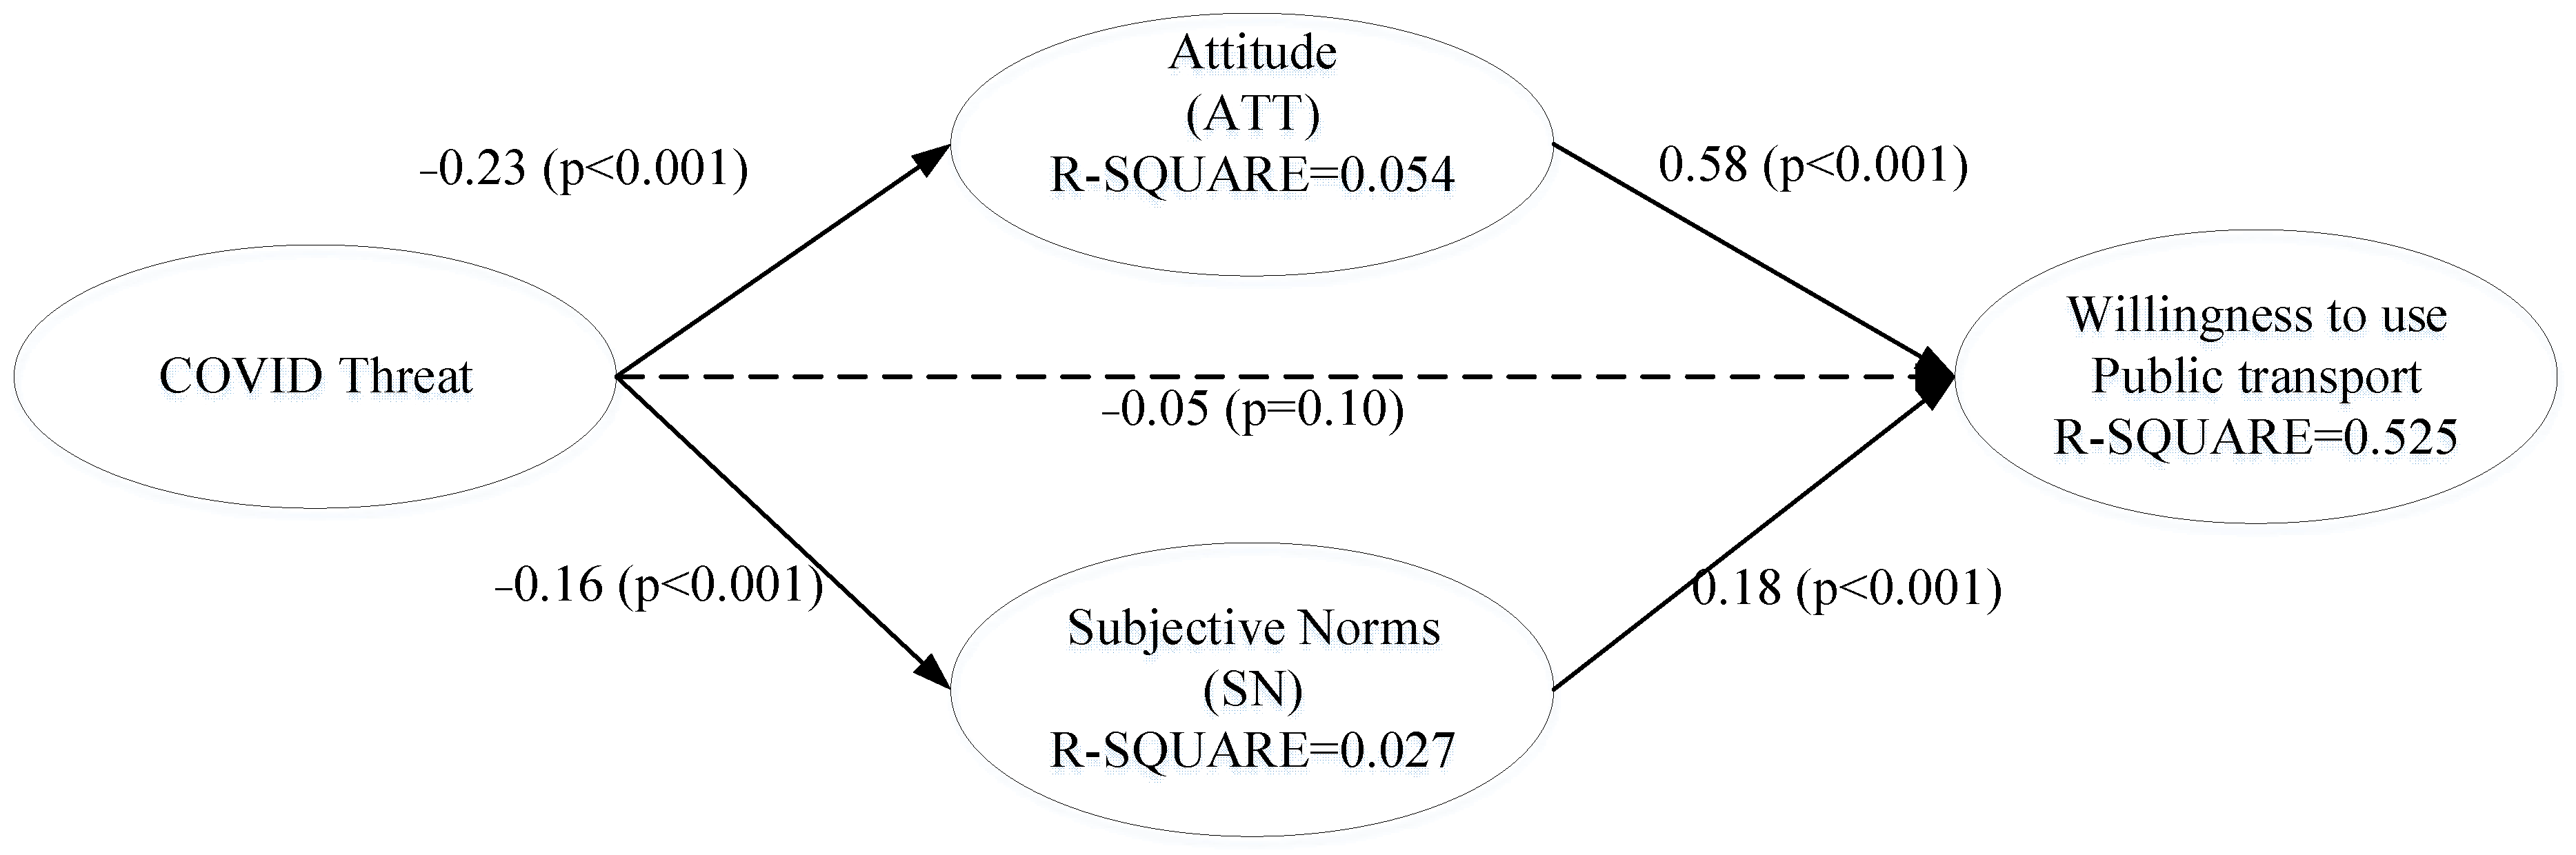
A hypothesis model was developed consisting of subjective norms, attitudes, perceived safety threats of COVID-19, and willingness to use public transportation. The hypothesis (H1) indicates that the attitudes are directly and positively related to the intentions to use public transportation, as indicated in Figure 2. Hypothesis (H2) emphasizes that subjective norms directly affect the intentions to use public transportation. This study assumed that the attitude (H4), subjective norms (H5), and willingness to use public transportation (H3) were affected by the perceived COVID-19 threats, as shown in Figure 2.

2. Methods

2.1. Questionnaire Design

A three-fold questionnaire was designed to collect the required data for this study. The first part included the participants’ trip frequencies by mode and travel purposes before and after the outbreak of COVID-19. Further details were asked regarding COVID-19 severity, the mode of transportation participants feel is safer, and the extent to which COVID-19 impacts flexible travel. The respondents were also asked to choose travel purposes, including commuting/school/university/picking up children, buying necessities, visiting hospitals, entertainment and visiting relatives and friends, and religious activities.
The second part was based on the hypothesis derived from the theory of reasoned action [30], as shown in Figure 2. A five-point Likert scale ranging from 1 = strongly disagree to 5 = strongly agree was used to rate the items to measure attitudes [40], subjective norms [41], and intentions to use public transport [28] in the post-pandemic period, as shown in Table 1. In line with a previous study [43], a seven-point Likert scale ranging from (1 = not true at all) to (7 = true at all) was used to rate the items for the perceived COVID-19 threats.
The third part included the sociodemographic details of the respondents, including gender, age, education level, occupation, place of residence, place of occupation, the impact of COVID-19 on occupation status, and monthly family income.

2.2. Data Collection

Considering the COVID-19 pandemic situation, it was not possible to collect data by distributing paper-based questionnaires among respondents. Therefore, responses were procured through an online questionnaire survey using a convenience sampling procedure, consistent with previous studies [44,45]. The questionnaire was developed in Google Forms. The web link containing the questionnaire was distributed randomly on social media (mainly on Facebook) among Greeks. To confirm the location of the target audience, the respondents were asked to specify the location of their residence. The questionnaire was available online from the 27 November 2020 to the 11 December 2020. The data collection exercise resulted in the collection of 415 responses. After deleting the incomplete and invalid responses, 403 valid responses were used for the data analysis.
It should be noted that the majority of the data collected in this study refers to Attica, a region in Greece. The aim that the questionnaire survey was conducted focusing particularly on the region of Attica is twofold. At first, Attica is the metropolitan area of Greece where almost half of the country’s population resides, including Athens, which is the capital of Greece. Therefore, by targeting this highly densely populated area with a highly complex transportation system, the survey is able to provide us with valuable insights. Secondly, this region is the only one in Greece, where beyond private cars, all types of transport modes exist, namely underground and aboveground rail (and tram), an extensive network of bus lines, bicycle road sections, etc. Meanwhile, in this region, there are also various types of operations, i.e., public workers, small and big businesses, major universities, etc. As a result, it is the appropriate place to explore the impact of the pandemic on people’s mobility behavior. Besides, such regions are commonly found in many European metropolitan cities, and because of that, this study can be useful since its results can be compared with others of similar cases. As far as the sampling process is concerned, the convenience sampling procedures for the respondents’ inclusion in an online questionnaire survey may have sampling bias. However, convenience sampling was found acceptable by recent studies given the pandemic situation and urgency to collect data exploring mobility behaviors [44,45]. This research was exploratory in nature, and in this sense, a representative sample was not of utmost importance. In this case, this study tried to go for volume and area coverage, thus the questionnaire was open to the public by posting it on social media, and at the same time, we targeted specific individuals to cover different areas of Attica. Both the final sample size and its distribution in the whole region helped in drawing the initial conclusions. The valuable results drawn from this study can trigger future research endeavors focusing on examining the mobility behavior of specific groups.

2.3. Analytical Method

Following the aim of the study, three analytical approaches were used to achieve the objectives of the study. First, the reduction in people’s travel trips and the change in travel purposes after the outbreak were presented using descriptive analysis. Second, the random parameter probit model approach was adopted to explore the relationship between participants’ sociodemographic features, perceptions of COVID-19 impacts, and mobility behavior changes after the outbreak. Third, the structural equation modeling approach was used to provide insights regarding the effects of attitudes, subjective norms, and perceived COVID-19 threats on willingness to use public transportation in the post-pandemic period.

2.3.1. Descriptive Analysis for Objective 1

The self-reported travel frequencies and the distribution of frequencies by travel modes and by travel purpose before and after the COVID-19 outbreak were compared through graphical representation.

2.3.2. Random Parameter for Objective 2

The random-parameter probit model allows parameters to vary across observations to capture the unobserved heterogeneity. As this study included the data collected through a questionnaire survey, responses were expected to have some unobserved correlations among error terms as the same respondent responded for multiple questions. For the random parameter probit model of travel frequencies, change in the trip frequencies (b) before the outbreak to (a) after the outbreak and coded as: b−a > 0 → 1 (decrease in trips), 0 → (no decrease in trips) was taken as a dependent variable. For the random parameter probit model of travel purposes, the dependent variable was the change in travel purpose (b) before the outbreak to (a) after the break and coded as: b−a > 0 → 1 (change in travel purpose), 0 → (no change).
A mathematical expression of the binary outcome of the model [46,47,48] can be expressed as:
Z i = β i β X i + ε i , y i = 1   i f   Z i > 0 ,   a n d   y i = 0   o t h e r w i s e
with the cross-equation correlated error terms,
ε i   ~   N [ 0 , 1 ]
where X is the explanatory variable determining the change in trips, including an increase or decrease after the COVID-19 outbreak or change in travel purposes based on characteristics of observation ί, y resembles an integer binary outcome of zero or one for both dependent variables, β is estimable parameters, ε is a random error that is assumed to be normally distributed with zero mean and a variance of one.
The unobserved heterogeneity with each group of observations generated by participants can be defined as follows:
β J = β + u j
where β is estimable parameters and u j   is a randomly distributed term for each respondent j with variance σ 2 and mean zero. For the adopted modeling approach, each β is defined for each respondent j, contrasting to the traditional random parameter modeling with each β is calculated for each observation i. In other words, Equation (3) demonstrates that each participant will have their own value of β. This study assumes that the random parameters are normally distributed, with the mean and standard deviations calculated and presented in the modeling results section.

2.3.3. Structural Equation Modeling for Objective 3

The effects of the perceived threat from COVID-19 on the behavioral intentions to use public transportation in the post-pandemic world were analyzed using structural equation modeling (SEM). A partial least square path modeling (PLSPM) approach of SEM was employed to capture the relationship among variables (latent constructs), consistent with previous studies [36,49,50]. It includes two models, i.e., the measurement model and the structural model. The measurement model can be written mathematically as [51]:
ξ = B ξ + ζ
where ξ represents the vector values of latent variables, B refers to the coefficients’ matrix of their relationships, and ζ indicates the residuals of the inner model. The basic PLSPM design assumes a recursive inner model that is subject to predictor specification. For this study, each manifest variable in a certain structural model is assumed to be generated as a linear function of its latent variables and the residual ε:
X x = Λ x ξ + ε x
where Λ represents the loading (pattern) coefficients. We used a package called “plspm” in R software to conduct structural equation modeling through the PLSPM [49].

3. Results

3.1. Respondents’ Characteristics

The participants’ characteristics, including gender, age, education level, occupation, place of residence, place of occupation, the impact of COVID-19 on occupation, and monthly family income, are included in Table 2. Female respondents (54.3%) were slightly higher than male respondents. Nearly half of the respondents were less than 24, accounting for 54.4%. Furthermore, most participants had a bachelor’s degree or equivalent education level (64.8%) and a monthly household income of EUR 1500 to less than EUR 3000 (37.5%). Those who participated in the questionnaire survey were mainly students (44.9%), and the least number of participants without a job, accounting for only 3.5%. Most respondents lived in the Islands (31.5%), and most respondents’ place of occupation was central Athens (22.8%). Regarding the impacts of COVID-19 on occupations, around 23% of the respondents indicated that they were still working full time, as shown in Table 2. Comparatively, only 1.5% of participants were those who mentioned that they had lost their jobs, followed by the shift to part-time (2.7%), and temporarily laid off (4.2%).

3.2. Descriptive Analysis

The descriptive details about the reduction in overall self-reported travel frequencies and the distribution of frequencies by travel modes and by travel purpose after the COVID-19 outbreak are included in this section. The descriptive analysis of the travel frequencies in two periods (before the outbreak and after the outbreak) provides useful insights to understand the change in individuals’ travel behavior.

3.2.1. Change in Travel Frequency

A reduction in total travel frequencies can be seen in Figure 3. The total travel frequencies before the outbreak were (9.95) per week, which has been reduced to almost less than half after the outbreak (3.71). Findings indicate that COVID-19 has severely affected individuals’ traveling activities. Fear from COVID-19, lockdown, and travel restriction can be the reason for such a massive reduction in travel frequencies in Greece.

3.2.2. Change in Mode Choices

The average travel frequencies by mode indicate a sudden reduction in almost all of the travel modes’ ridership, as shown in Figure 4. After the outbreak, average travel frequencies by all modes decreased. Compared with all other modes, the average travel frequencies by public transportation (e.g., bus, train) decreased significantly (from 3.85 to 0.69) after the outbreak. The reduction in travel frequencies is justifiable in the light of the policies of maintaining social distance and other measures active after that period to prevent COVID-19 spread. Interestingly, the walking trips and the trips by two-wheelers have slightly changed only due to COVID-19. It indicates individuals’ preferences to walk and use two-wheelers in the pandemic period.

3.2.3. Changes of Trips by Travel Purposes

The self-reported change in the individuals’ trips by travel purposes after the outbreak is presented in Figure 5. The percentage of keep represents the individuals who make trips both before and after the outbreak, percentages for the began refer to those who make trips only after the outbreak, stopped refer to those who made trips only before the outbreak, and none stands for those who make no trip regardless of time period. The results indicate that almost half of the individuals (44.9%) stopped having commute trips after COVID-19. Likewise, a large proportion of individuals (45.7%) stopped making trips for entertainment. For buying necessities, 79.2% of individuals reported still making their trips after COVID-19. The majority of individuals made no religious trips regardless of the COVID-19 time period. However, 17.1% of individuals have stopped making religious trips after COVID-19. The findings indicate that the commute and entertainment trips were dramatically reduced. However, a small reduction in trips to buy necessities was observed after COVID-19.

3.3. Factors Affecting the Change in Travel Frequencies by Modes

According to Table 3, Table 4, Table 5, Table 6, Table 7 and Table 8, respondents’ personal (e.g., occupation, the impact of COVID-19 on individuals’ flexible travel) and perceived details (e.g., if respondents feel stressed due to COVID-19) significantly affect their mobility behavior causing a reduction in average weekly trips. However, the significant factors affecting the change in average trips varied by travel mode. Table 3, Table 4, Table 5, Table 6, Table 7 and Table 8 illustrates the modeling results for the change in total trips, change in bus trips, change in car trips, change in taxi trips, change in two wheelers’ trips and change in walking trips. The random parameter probit model fitted the data well considering the log-likelihood ratio and McFadden Pseudo R-square values mentioned in Table 3, Table 4, Table 5, Table 6, Table 7 and Table 8.
Regarding the change in total trips, most of the individuals, including office workers, non-office workers, self-employed or business owners, retired or jobless, had a low probability of reducing their trips compared to students, as shown in Table 3. Regarding the perceived COVID-19 threat, the individuals who perceived no stress from COVID-19 had a low probability of decreasing their trips compared to those who perceived stress regarding COVID-19. On the other hand, the ones who perceived moderate stress regarding COVID-19 had a high tendency to decrease their weekly trips. The individuals who perceived minor or no COVID-19 impacts on flexible travel were less likely to decrease their trip than those who perceived major impacts on flexible travel. These findings indicate that COVID-19 perceptions control peoples’ mobility behavior and shape variations in travel trips.
The results regarding the change in trips by bus (Table 4) indicate that the individuals who live in South Athens, Piraeus, outside Attica, North Athens, West Athens, Central Athens, and East Attica, were more likely to decrease their trips by bus, except those who live in West Attica, compared to the respondents living in Islands. The reduction in bus trips for the individuals living in Central Athens varied across the respondents as it was a random parameter with a standard deviation of 2.87. The possible reason was the high usage of the bus in areas other than the Islands before the outbreak in combination with the reduced need of travel after the outbreak. Participants aged between 25 to 44 years and over 45 years had a low probability of decreasing their trips compared to the youngsters with an age of under 24 years. However, the tendency to reduce the number of bus trips was less likely and varied across the respondents belonging to the age group varying from 25 years old to 44 years old. Age groups up to 24 years old were more likely to decrease their trips by bus than the rest, as these groups included the majority of school and university students who reduced their trips due to remote teaching. The diversity of changes found in the older age groups was most likely due to the different working measures taken by companies. A massive reduction in public transportation trips indicates several challenges to public transportation, including a reduction in revenue and management cost increase due to COVID-19 preventive measures. It also indicated the need for additional transport policy measures to enhance the resilience of public transportation against COVID-19 impacts.
Regarding the change in car trips before the outbreak to after the outbreak period, Table 5 indicates that highly educated individuals were more likely to decrease their car trips than those who have a bachelor’s degree. Compared to those who reported no impact from COVID-19 on their job, the individuals who were temporarily laid off or still working remotely had a high tendency to reduce their car trips. As many companies applied remote working measures due to COVID-19, it was reasonable that the individuals working from home were more likely to reduce their car use. However, the individuals who lost jobs or were still working full time had a low tendency to reduce the trips by cars, and the reduction varied across the individuals.
Regarding the change in trips by taxi (Table 6), all age groups had low probability of decreasing their trips compared to the age group under 24 years old. However, the reduction in taxi trips was randomly distributed across the responses from the individuals with an age of 25 to 44 years and over 45 years. Furthermore, males had a low probability of reducing their trips by taxis compare to females.
For the trips by two-wheelers (Table 7), the individuals who perceived that they were not threatened or were moderately threatened had a high probability of reducing the trips than those who felt threatened by COVID-19. Regarding fear perception, the individuals who perceived no fear or moderate fear had a low probability of reducing two-wheeler trips.
For the walking trips (Table 8), the majority of individuals, including office workers, non-office workers, self-employed or business owners, retired or jobless, had a low probability of reducing the trips after COVID-19, compared to students, as shown in Table 3. Interestingly, male respondents had a high tendency to reduce the walking trips compared to female respondents. Walking did not appear to have such a drop as the other modes mentioned previously.

3.4. Factors Affecting the Change to Trips by Travel Purposes

After COVID-19, the majority of the individuals, including office workers, non-office workers, self-employed or business owners, and retired, were less likely to give up the commute trips compared to students who stopped during that period of time as universities shut down, as shown in Table 9. Considering the log-likelihood ratio tests and Macfadden Pseudo R-square values, the random parameter probit model fitted the data well.
Among all travel purposes, the trips for buying necessities were still ongoing after the COVID-19 outbreak. Male participants were less likely to give up the trips for buying necessities, as compared to female participants, as shown in Table 10. However, the likelihood to give up the trips to buy necessities varied across the males, as indicated by the standard deviation of random parameter. Compared to the individuals with bachelors’ education, the individuals with masters or higher qualifications were more likely to give up trips to buy necessities. In contrast, the ones who had middle or high school education were less likely to give up buying necessities trips. Compared to the individuals who perceived major impacts of COVID-19 on flexible travel, all others who perceived minor impacts, no impacts, or moderate impacts were less likely to give up the trips to buy necessities. Results indicate the need for economic and efficient online shopping platforms to buy necessities so that individuals do not need to go out to buy necessities. On the other hand, the authorities responsible for ensuring the preventive measures for the spread of COVID-19 should focus on the routes and places important for buying necessities. In addition, individuals who had a major impact on their flexible travel were more likely to give up the trips for buying necessities. These findings could be interpreted as the result of the stress caused by the disease to many people and the aftermath of the national lockdown, which was previously active.
For individuals who travel to visit relatives and friends (Table 11), those who perceived minor, moderate, or major impacts of COVID-19 on flexible travel were less likely to reduce their trips to visit relatives and friends compared to those who perceived major impacts of COVID-19 on flexible travel.
Regarding trips for religious activities (Table 12), males were less likely to give up the religious trips compared to females. Compared to individuals aged under 24 years, middle-aged people aged 25 to 44 years were less likely to give up trips for religious activities; however, the individuals aged over 45 were more likely to give up trips for religious activities. Regardless of age groups, most people did not attend such activities, as is displayed earlier in descriptive analysis by the research data.

3.5. Structural Equation Modeling

3.5.1. Measurement Model

The measurement model was developed from the data. The tests for the validity and reliability of the items were conducted. The values greater than 0.7 for the Cronbach alpha and composite reliability are the criteria to meet the reliability and validity [52,53]. The values in Table 13 indicate that the constructs of the present study have met the criteria and can be considered suitable for further analysis. The Fornell–Larcker criterion was also employed to test validity [54,55]. Following the Fornell–Larcker criterion, the correlations of the latent constructs, if arranged in off-diagonals of the matrix, then values of correlations should be lower than the values of diagonals containing the square root of the average variance extracted (AVE). The Fornell–Larcker criterion was achieved, as shown in Table 13. Further, as suggested by Sanchez [52], factor loadings were used to evaluate that the items appropriately load on their respective construct (Table 14). Following previous studies [42,52], the items in the present study met the criteria of factor loadings greater than 0.5 and were considered acceptable to conduct further analysis. Communalities are the square of factor loadings indicating the amount of variability explained by a latent construct [52]. All of the communalities in Table 14 are >0.50, indicating that each of the constructs captured more than 50% variability of the items.

3.5.2. Structural Model

Following the hypothesized model of the present study, the structural model consisting of people’s attitude, subjective norms, and perceived COVID-19 threats with public transportation usage intentions is presented in Figure 6. Results indicate that attitude positively affects (β = 0.58, p < 0.001) public transportation usage intentions of the individuals and hypothesis (H1) was accepted. Likewise, subjective norms (β = 0.18, p < 0.001) were found to have significant effects on the behavioral intentions to use public transportation, and hypothesis H2 was accepted. The perceived COVID-19 threat’s negative effects on the public transportation usage intentions (β = −0.05, p = 0.10) were not supported by this study, and hypothesis (H3) was not accepted. Perceived COVID-19 threat negatively affected the subjective norms (β = −0.16, p < 0.001) and attitudes (β = −0.23, p < 0.001) regarding public transportation usage. The R-square value for the variable willingness to use public transportation was >0.5, indicating a good fit of the model. Furthermore, a bootstrapping test with 5000 subsamples was conducted, and the results have confirmed the model. Results show that the participants have a positive attitude and perceived positive social norms about public transportation. However, the perceived COVID-19 threat negatively affects the attitudes and subjective norms, causing reduction in public transportation usage. In the post-pandemic world, transportation organizations need to adopt strategies easing the perceived COVID-19 threat to enhance public transportation ridership.

4. Discussion and Implications

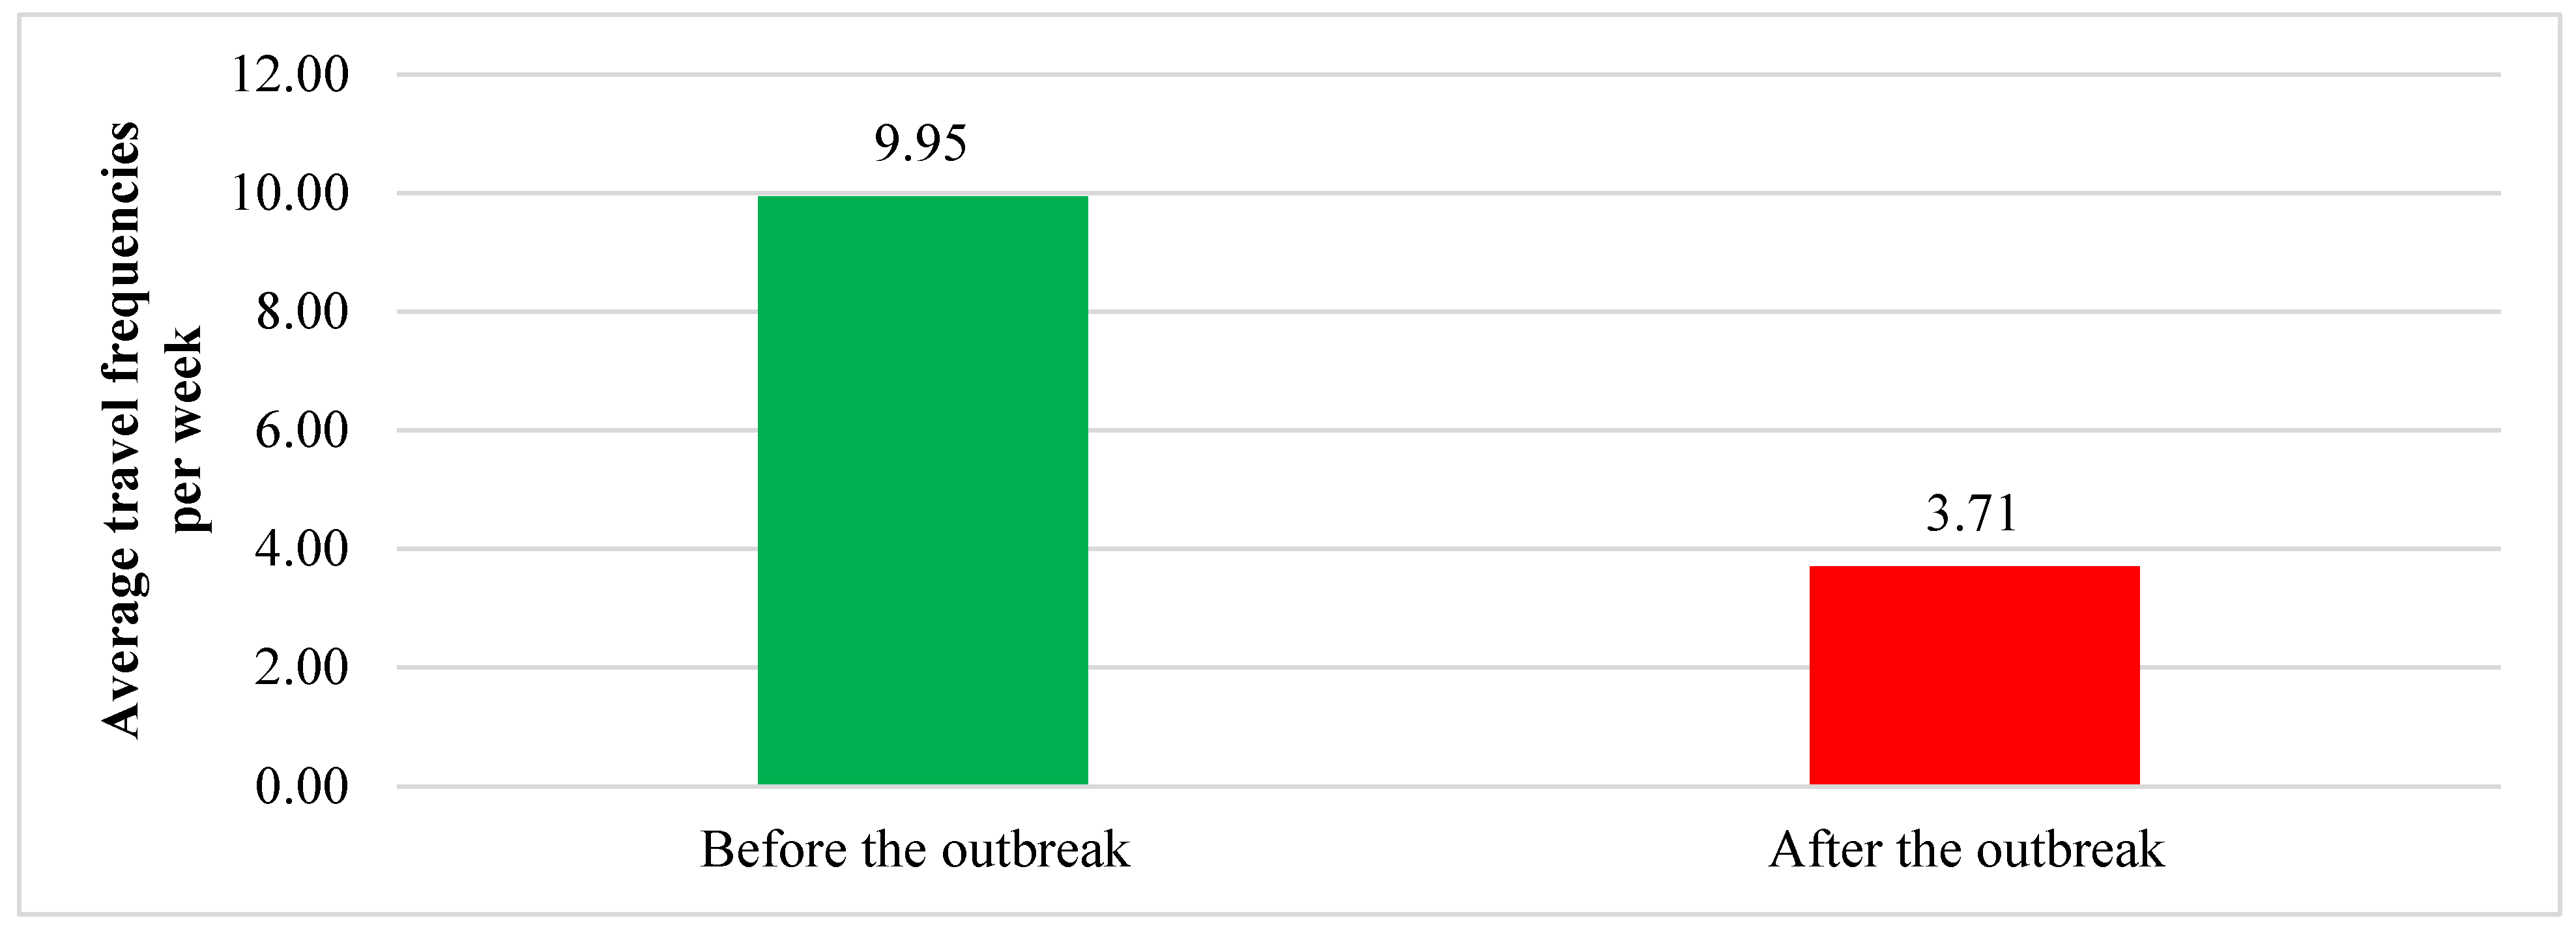
Through the descriptive analysis method, total traveling frequencies appeared to be down by more than 50% (
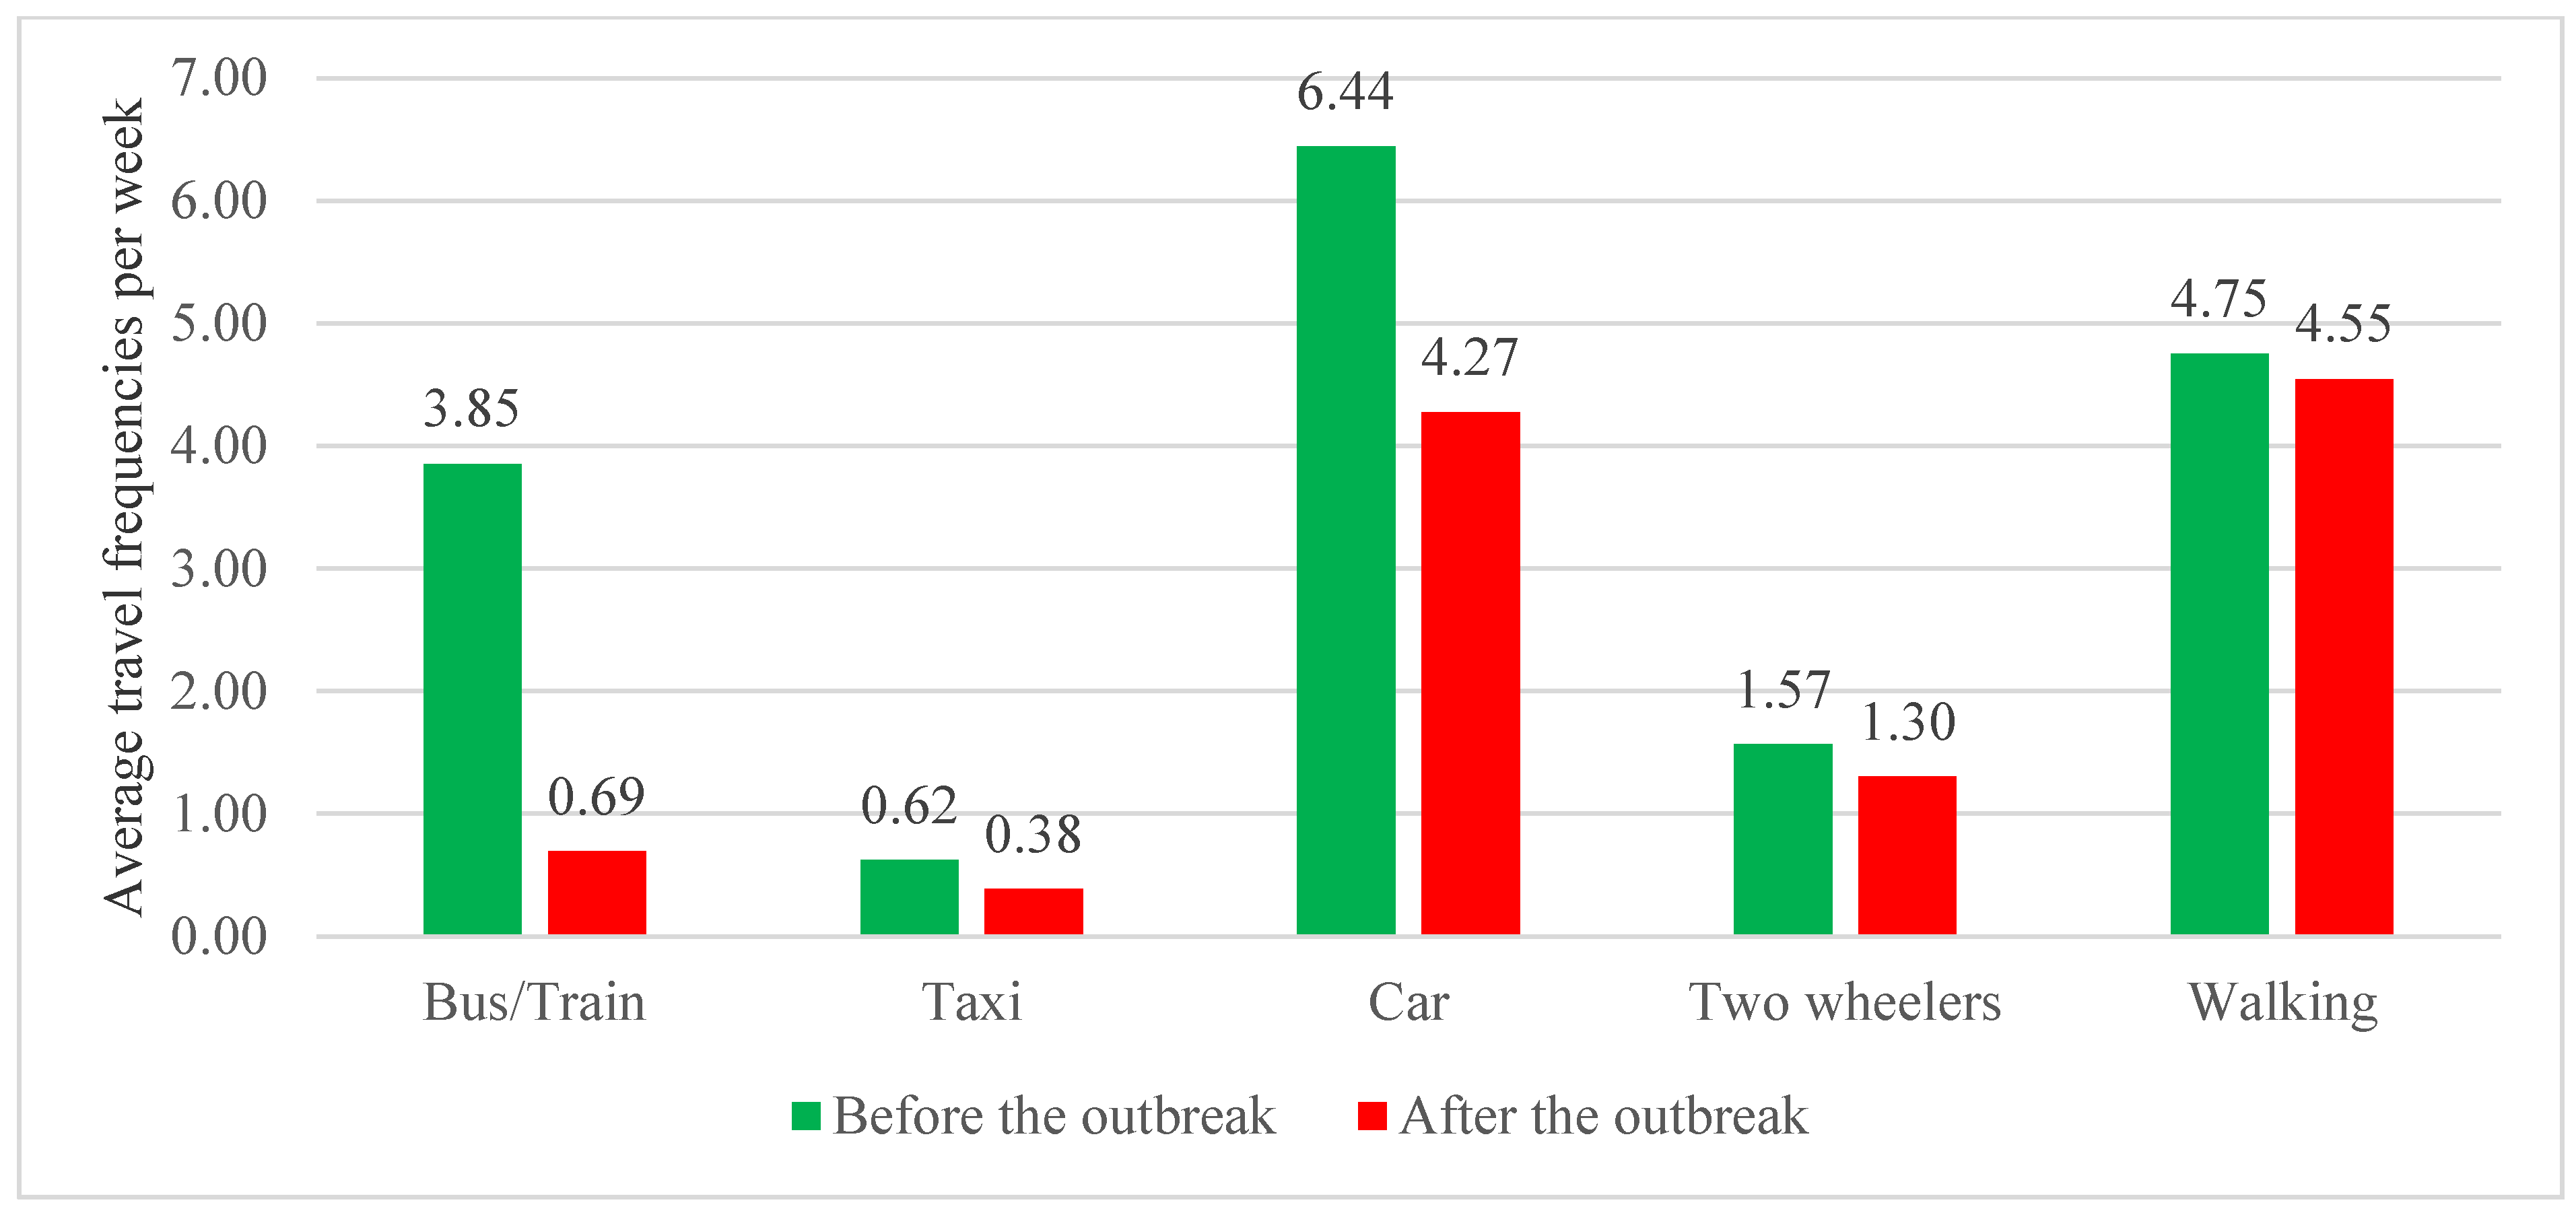
Figure 3), signaling adverse impacts of the COVID-19 outbreak on people’s mobility behavior. All modes were found to have taken a hit except two-wheelers and walking, which appeared only to have minor reductions (Figure 4). A plausible reason for the significant reduction in bus/train usage is the decrease in the need to travel and the fear of catching COVID-19 in the compact spaces that public transport provides. On the contrary, walking was found to be preferred as a contact-free mode of traveling by people. This shift towards active transportation can prevent individuals from shifting back towards motorized transportation through supportive measures, management, and organizational support.
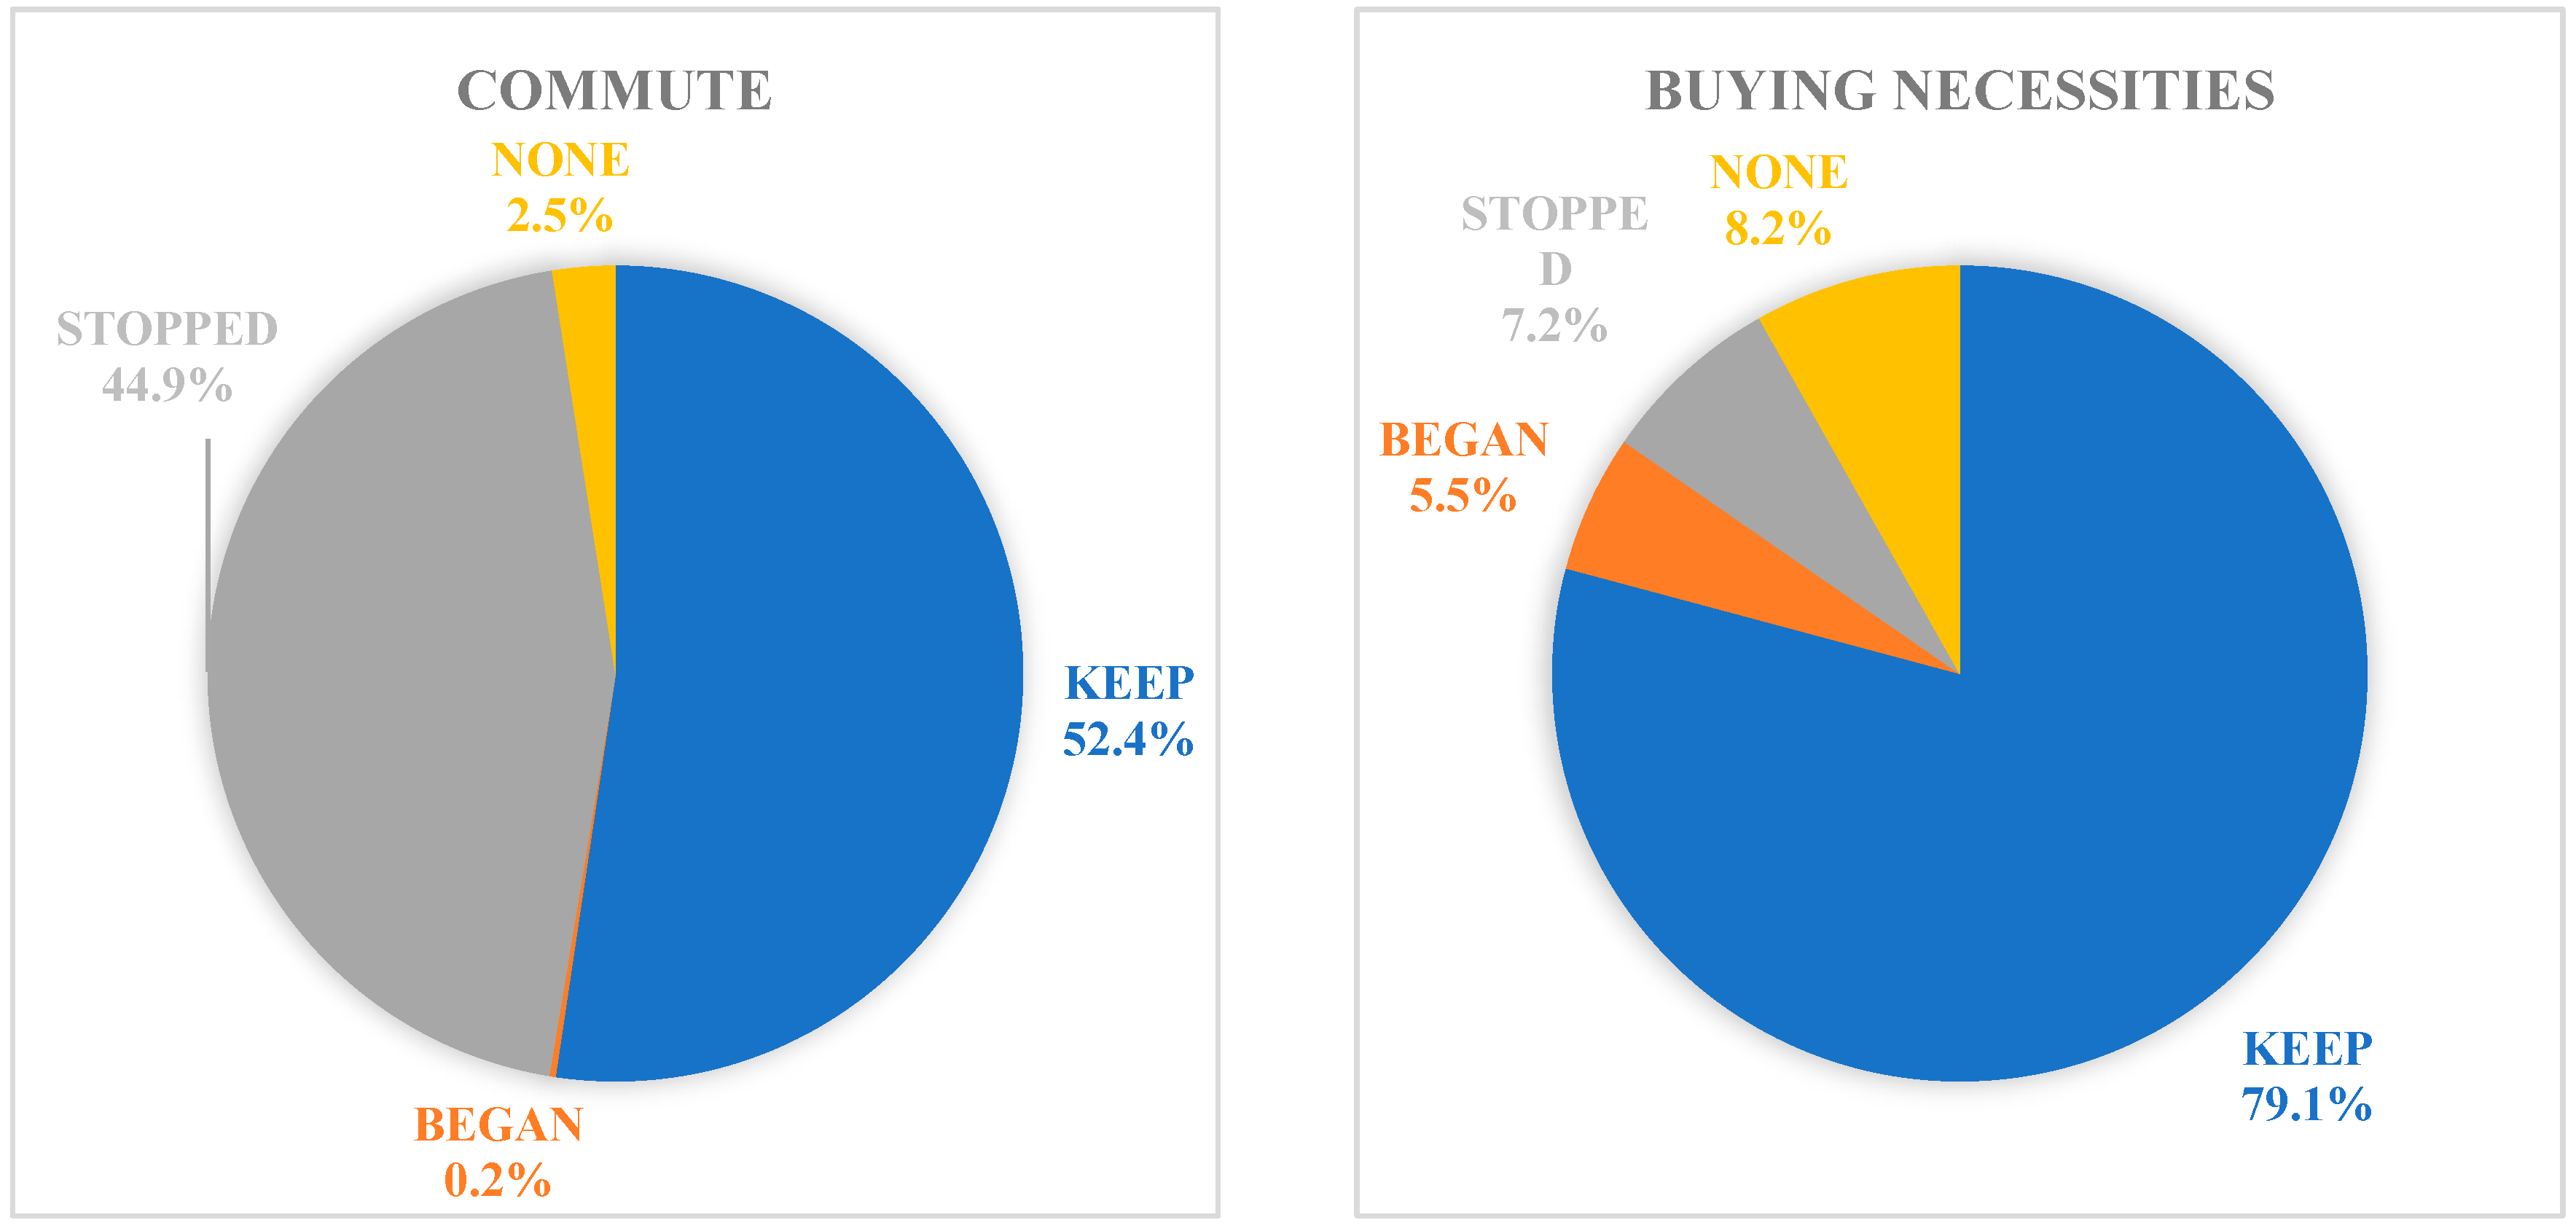
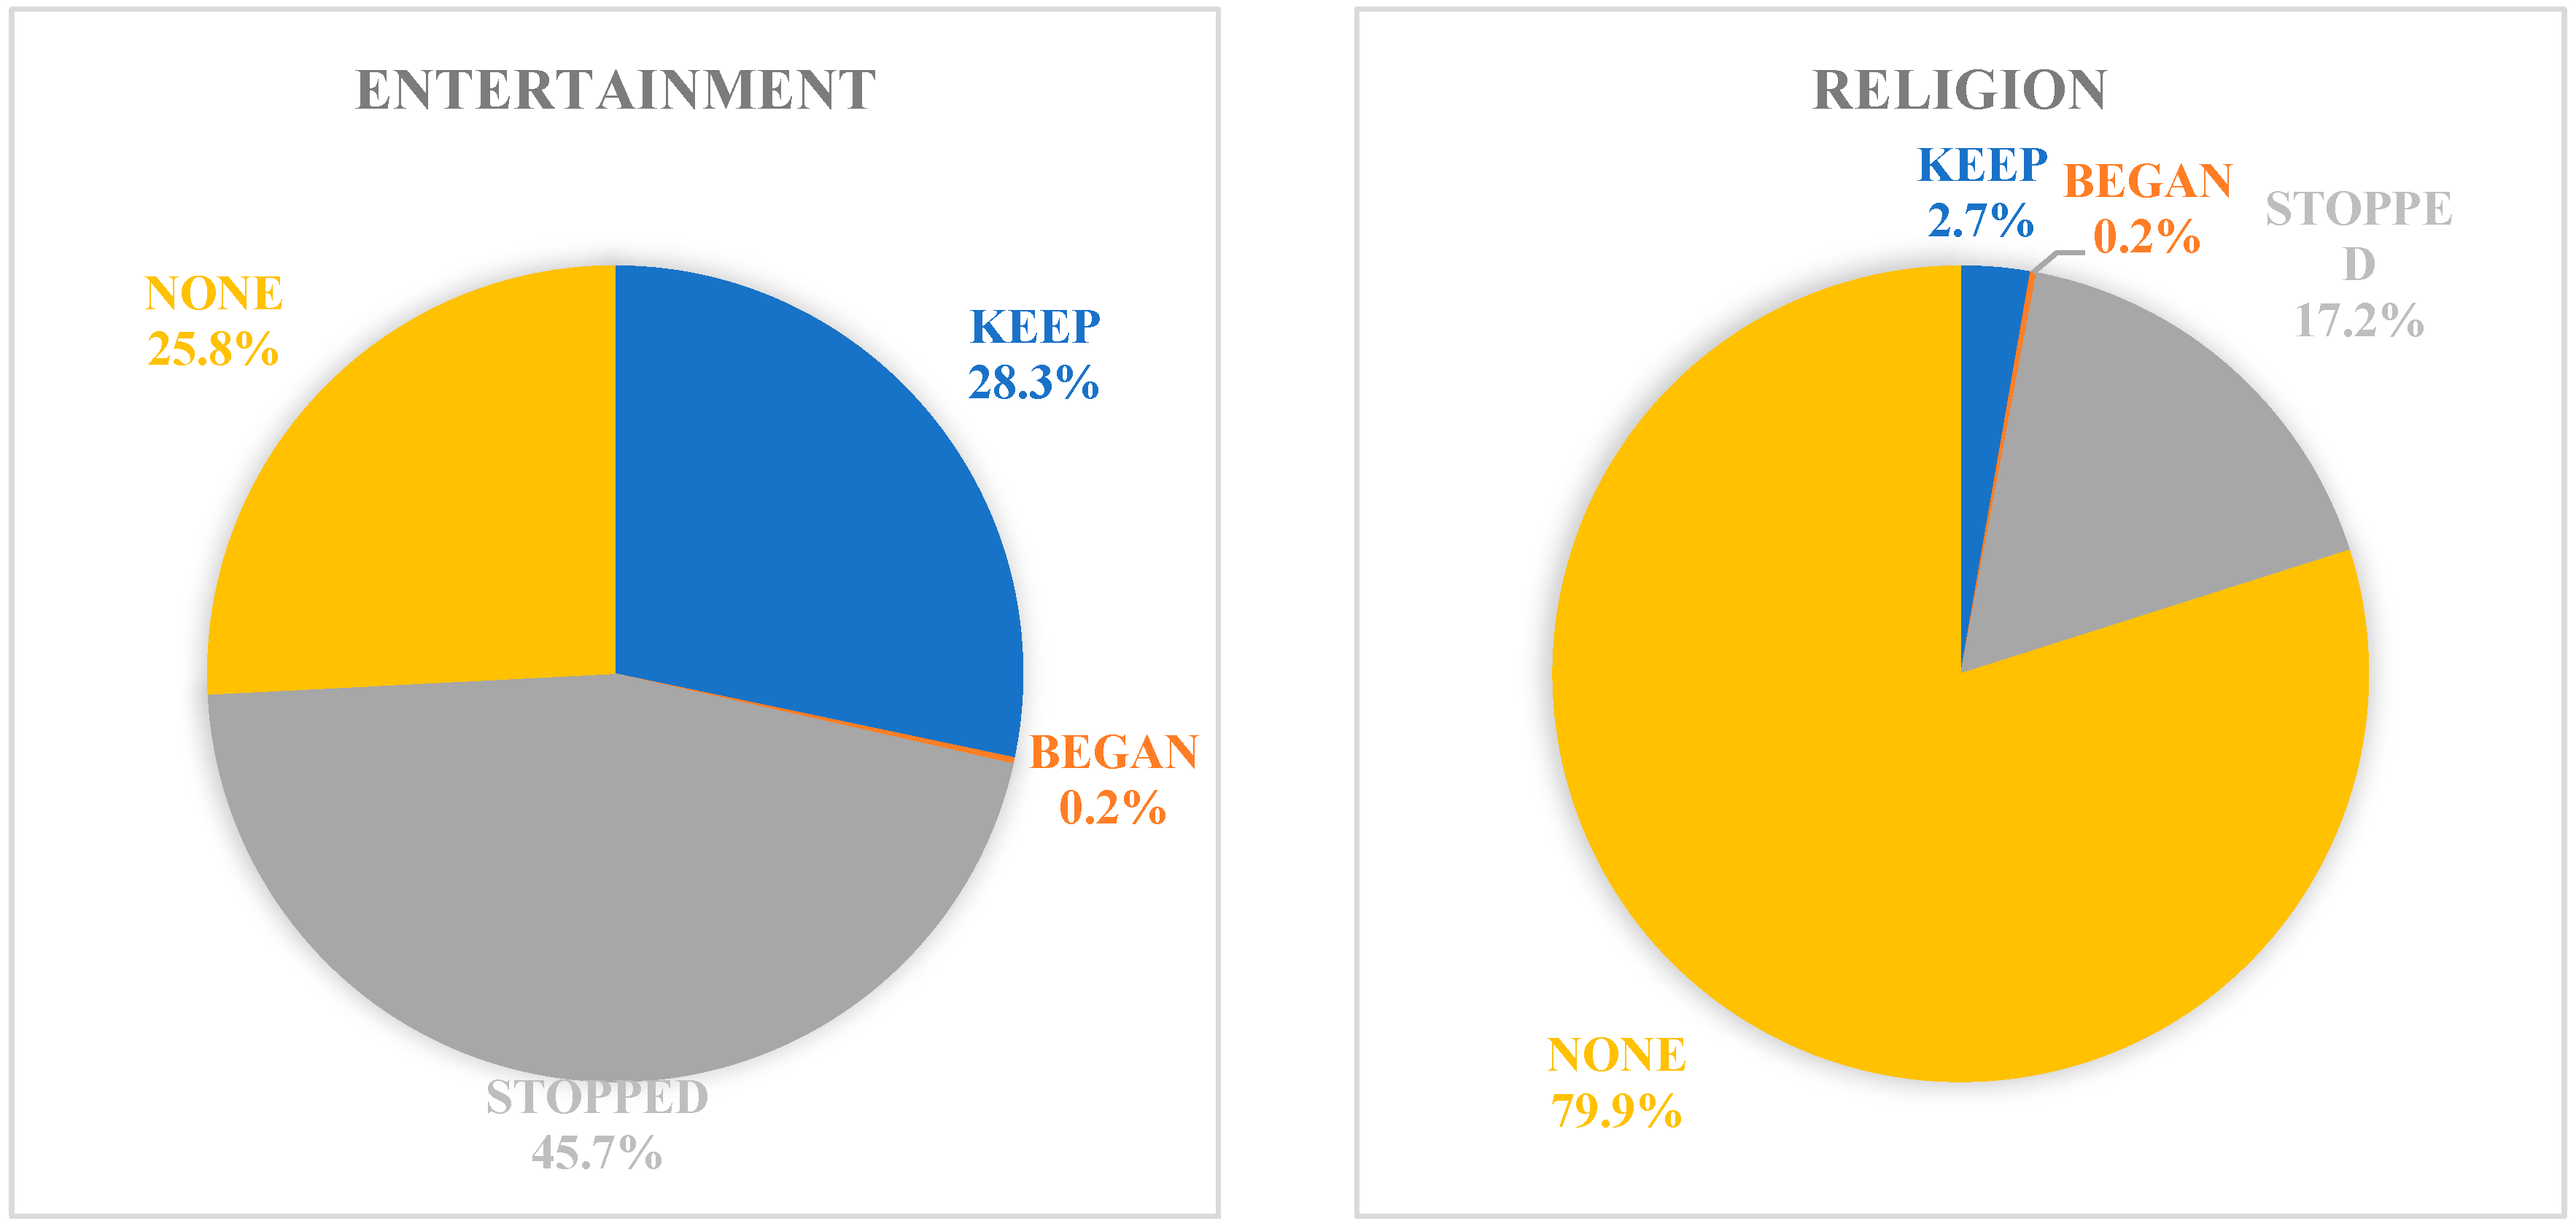
A huge percentage of people were found to have stopped commute trips, possibly due to the switch to remote working and online teaching, respectively. Similarly, entertainment trips were also reduced because social gathering places, including bars and cinemas, remained closed. On the other hand, trips for buying necessities appeared to have no dramatic change as they essentially cannot drop significantly due to their vital role in everyday life.
A comparison with similar research studies is important for the best possible understanding of the results. Unfortunately, there are no studies available researching the same post-outbreak period, but there are plenty in the city of Thessaloniki in Greece during the first lockdown period. Based on data, Politis, Georgiadis, Papadopoulos, et al. (2021) found a 50% reduction in total daily travel trips and a huge decline in public transportation ridership, as well as a rise in walking as a mode of travel. Furthermore, total car usage was found to be similar to the pre-pandemic period. Their results are in agreement with the ones from this current study. In addition, Politis, Georgiadis, Papadopoulos, et al. (2021) found that the percentage of public transportation use in total trips approached zero. It should be noted that the public transportation network in Thessaloniki is limited to mostly buses, thus making this finding seem logical. On the other hand, this study showed a reduced ridership of buses/trains. In contrast with this research, age was found to similarly affect travel frequency after the pre-pandemic and the pandemic period.
By shedding light on the dynamics of people’s travel behaviors and public perceptions of COVID-19, this study offers insightful findings for transportation planning and policy development. The reduction in commuters’ trips indicates the potential of working from home after the COVID-19 outbreak. Nevertheless, the telecommuting rates during the pandemic differ by sociodemographic features and job type [56]. Thus, findings suggest policymakers consider promoting telecommuting in the post-pandemic as it has the potential for a sustainable future by reducing traffic congestion and improving air quality [16].
The variations were found in sociodemographic features and perceived perceptions based on travel modes and travel purposes affecting travel frequency change. It indicates that the policymakers need to explicitly consider travel modes and travel purposes for traffic management in pandemics. The random parameter approach highlighted the individual’s heterogeneity to reduce travel frequencies and change in travel purposes. The insightful results explaining the significant factors and individuals’ heterogeneity indicate that sociodemographic oriented and local areas-based preventive measures will be more effective for travel behavior management after the COVID-19 outbreak.
A new opportunity for active transportation has been observed in this study’s findings. Meanwhile, road pricing policies should be revisited, considering the new trends in the distribution of travel modes. Transport policies to promote active transportation should be formulated to sustain mobility by walking. Perceptions of COVID-19 significantly affected the change in total trips indicating the need to boost the dissemination of information about COVID-19 to the general public. The perceived safety threats of the spread of COVID-19 due to traveling in public and shared transportation can be reduced by implementing hygienic measures, sanitizations of vehicles, and standard temperature checks for drivers and passengers. The rewarding strategies can be introduced for the responsible behaviors of wearing masks while traveling on public transportation leading to a decrease in the perceived safety threats of being infected by COVID-19 while traveling on public transportation. The dynamic reward system will be more effective considering the heterogeneity of responses found in this study.
Finally, the findings indicated that the COVID-19 threat negatively impacted both attitude and subjective norms towards the willingness to use public transportation. It was also found that both attitude and subjective norms are still positive towards public transportation usage. Taking it all into account, even though it was found that the COVID-19 threat did not have a direct relationship with willingness to use public transportation, it impacted it through attitude and subjective norms. The reduction in public transportation usage will result in a decline in revenue in the long run, causing massive economic losses. Such economic losses may posit compromise in service quality affecting public transportation adversely. Rethinking fare structures considering off and peak hours will become necessary after COVID-19 [57]. Transportation authorities should formulate some strategies to cope with a post-pandemic situation. Providing incentives to lower-income groups who use public transportation [57], shaping inclusiveness for people with disabilities [29], and starting awareness campaigns will help bring the riders back to public transportation in the post-pandemic world. More research is needed to find alternate ways to manage the increased cost of public transportation due to COVID-19 preventive measures, as highlighted in a previous study [15]. Recent studies [58,59] on policy development can be followed to derive policy measures from the present study’s findings.

5. Conclusions, Limitations, and Future Works

By shedding light on the change in mobility behavior in Greece before and after COVID-19, this study provides useful information regarding the relationship of individuals’ sociodemographic factors, change in mobility behavior, and public perceptions of COVID-19. The study’s findings are helpful for transportation planners and policymakers interested in the variations in travel trips and the preparation of traffic management plans. This study confirms that COVID-19 affected individuals’ travel in Greece. Transportation organizations should consider collecting and incorporating people’s mobility data for the planning of a resilient transportation system to prevent future health threats. In a post-pandemic world, people are less willing to use public transportation as they perceive COVID-19 as a threat. Transportation authorities should organize sufficient efforts to attract citizens back to public transportation. The implementation of the preventive strategies of COVID-19, including the cleaning and disinfecting of public buses, availability of sanitizers, and ensuring the wearing of masks by passengers, will be helpful in reducing perceived COVID-19 threats by the public. Findings suggest that individuals’ sociodemographic features and perceptions about COVID-19 have a relation with the behavioral change after the outbreak. Thus, inclusive transportation planning should incorporate such information in policy preparation. Further research should be conducted to expand the current study and to find more avenues to minimize the worsening effects of pandemics on individuals’ mobility.
The findings of the study must be interpreted in light of certain limitations. This study relied on the self-reported data collected through convenience sampling due to COVID-19 standard operating procedures mainly reflecting the respondents’ personal opinions, which should be expanded by collecting a large population sample through random sampling. This study used the theory of reasoned action to explore willingness to use public transportation and highlighted the basic theoretical model explaining the effects of perceived COVID-19 safety threats. Future studies are recommended to consider the addition of further variables affecting intentions to use public transportation, such as willingness to pay for hygienic services, perceived behavioral control, self-efficacy, service quality, passengers’ behaviors (wearing masks), and service frequency. Further studies can replicate the methodology to extend the current findings in Greece and other countries’ contexts. More understanding of travel behavior is required to develop effective mitigating strategies in fighting against the COVID-19 pandemic.

Author Contributions

The authors confirm contribution to the paper as follows: conceptualization, methodology, formal analysis, writing-original draft, model formulation and estimation, investigation: F.B. and R.M.; conceptualization, methodology, formal analysis, writing-original draft, writing—review and editing, model formulation, and estimation, investigation, funding acquisition: J.L.; data collections, formal analysis, literature search, and review, writing—review and editing: K.K.; writing—review and editing: E.T.; investigation, data collections, formal analysis, literature search, and review, writing—review and editing: P.N.; writing—review and editing. All authors have read and agreed to the published version of the manuscript.

Funding

This work was supported by the National Key R&D Program of China (2020YFB1600400) and the Innovation-Driven Project of Central South University (2020CX013).

Institutional Review Board Statement

Not Applicable.

Informed Consent Statement

Not Applicable.

Data Availability Statement

The datasets generated during and/or analyzed during the current study are not publicly available due to data privacy reasons.

Acknowledgments

The authors are thankful to Zhang Jinbao for his help in conducting this study.

Conflicts of Interest

The authors declare that they have no competing interest.

References

  1. Shakibaei, S.; de Jong, G.C.; Alpkökin, P.; Rashidi, T.H. Impact of the COVID-19 pandemic on travel behavior in Istanbul: A panel data analysis. Sustain. Cities Soc. 2021, 65, 102619. [Google Scholar] [CrossRef] [PubMed]
  2. Lu, H.; Stratton, C.W.; Tang, Y.W. Outbreak of pneumonia of unknown etiology in Wuhan, China: The mystery and the miracle. J. Med. Virol. 2020, 92, 401–402. [Google Scholar] [CrossRef] [PubMed] [Green Version]
  3. Rojas-Rueda, D.; Morales-Zamora, E. Built Environment, Transport, and COVID-19: A Review. Curr. Environ. Health Reports 2021, 8, 138–145. [Google Scholar] [CrossRef] [PubMed]
  4. World Health Organization. WHO Coronavirus Disease (COVID-19) Dashboard. Available online: https://covid19.who.int/info (accessed on 11 February 2021).
  5. Fouda, A.; Mahmoudi, N.; Moy, N.; Paolucci, F. The COVID-19 pandemic in Greece, Iceland, New Zealand, and Singapore: Health policies and lessons learned. Health Policy Technol. 2020, 9, 510–524. [Google Scholar] [CrossRef] [PubMed]
  6. Li, Y.; Li, M.; Rice, M.; Zhang, H.; Sha, D.; Li, M.; Su, Y.; Yang, C. The impact of policy measures on human mobility, COVID-19 cases, and mortality in the US: A spatiotemporal perspective. Int. J. Environ. Res. Public Health 2021, 18, 996. [Google Scholar] [CrossRef] [PubMed]
  7. Bin, E.; Andruetto, C.; Susilo, Y.; Pernestål, A. The trade-off behaviours between virtual and physical activities during the first wave of the COVID-19 pandemic period. Eur. Transp. Res. Rev. 2021, 13, 14. [Google Scholar] [CrossRef]
  8. Nikiforiadis, A.; Ayfantopoulou, G.; Stamelou, A. Assessing the Impact of COVID-19 on Bike-Sharing Usage: The Case of Thessaloniki, Greece. Sustainability 2020, 12, 8215. [Google Scholar] [CrossRef]
  9. Abdullah, M.; Ali, N.; Hussain, S.A.; Aslam, A.B.; Javid, M.A. Measuring changes in travel behavior pattern due to COVID-19 in a developing country: A case study of Pakistan. Transp. Policy 2021, 108, 21–33. [Google Scholar] [CrossRef]
  10. Zhang, J.; Lee, J. Interactive effects between travel behaviour and COVID-19: A questionnaire study. Transp. Saf. Environ. 2021, 3, 166–177. [Google Scholar] [CrossRef]
  11. Liu, W.; Yue, X.G.; Tchounwou, P.B. Response to the COVID-19 Epidemic: The Chinese Experience and Implications for Other Countries. Int. J. Environ. Res. Public Health 2020, 17, 2304. [Google Scholar] [CrossRef] [Green Version]
  12. Ceccato, R.; Rossi, R.; Gastaldi, M. Travel Demand Prediction during COVID-19 Pandemic: Educational and Working Trips at the University of Padova. Sustainability 2021, 13, 6596. [Google Scholar] [CrossRef]
  13. Beck, M.J.; Hensher, D.A. Insights into the impact of COVID-19 on household travel and activities in Australia—The early days under restrictions. Transp. Policy 2020, 96, 76–93. [Google Scholar] [CrossRef] [PubMed]
  14. Hiselius, L.W.; Arnfalk, P. When the impossible becomes possible: COVID-19’s impact on work and travel patterns in Swedish public agencies. Eur. Transp. Res. Rev. 2021, 13, 17. [Google Scholar] [CrossRef]
  15. Awad-Núñez, S.; Julio, R.; Gomez, J.; Moya-Gómez, B.; González, J.S. Post-COVID-19 travel behaviour patterns: Impact on the willingness to pay of users of public transport and shared mobility services in Spain. Eur. Transp. Res. Rev. 2021, 13, 20. [Google Scholar] [CrossRef]
  16. Shamshiripour, A.; Rahimi, E.; Shabanpour, R.; Mohammadian, A. (Kouros) How is COVID-19 reshaping activity-travel behavior? Evidence from a comprehensive survey in Chicago. Transp. Res. Interdiscip. Perspect. 2020, 7, 100216. [Google Scholar] [CrossRef] [PubMed]
  17. Anke, J.; Francke, A.; Schaefer, L.-M.; Petzoldt, T. Impact of SARS-CoV-2 on the mobility behaviour in Germany. Eur. Transp. Res. Rev. 2021, 13, 10. [Google Scholar] [CrossRef]
  18. Kolarova, V.; Eisenmann, C.; Nobis, C.; Winkler, C.; Lenz, B. Analysing the impact of the COVID-19 outbreak on everyday travel behaviour in Germany and potential implications for future travel patterns. Eur. Transp. Res. Rev. 2021, 13, 27. [Google Scholar] [CrossRef]
  19. König, A.; Dreßler, A. A mixed-methods analysis of mobility behavior changes in the COVID-19 era in a rural case study. Eur. Transp. Res. Rev. 2021, 13, 15. [Google Scholar] [CrossRef]
  20. Politis, I.; Georgiadis, G.; Papadopoulos, E.; Fyrogenis, I.; Nikolaidou, A.; Kopsacheilis, A.; Sdoukopoulos, A.; Verani, E. COVID-19 lockdown measures and travel behavior: The case of Thessaloniki, Greece. Transp. Res. Interdiscip. Perspect. 2021, 10, 100345. [Google Scholar] [CrossRef]
  21. Darwish, M.; Campisi, T.; Rumman, G.A. The Impact of COVID-19 Pandemic on the Perception of Public Transportation Users in Amman (Jordan). In Computational Science and Its Applications–ICCSA 2021; Springer: Cham, Switzerland, 2021; pp. 386–402. [Google Scholar] [CrossRef]
  22. Politis, I.; Georgiadis, G.; Nikolaidou, A.; Kopsacheilis, A.; Fyrogenis, I.; Sdoukopoulos, A.; Verani, E.; Papadopoulos, E. Mapping travel behavior changes during the COVID-19 lock-down: A socioeconomic analysis in Greece. Eur. Transp. Res. Rev. 2021, 13, 21. [Google Scholar] [CrossRef]
  23. Shibayama, T.; Sandholzer, F.; Laa, B.; Brezina, T. Impact of COVID-19 lockdown on commuting: A multi-country perspective. Eur. J. Transp. Infrastruct. Res. 2021, 21, 70–93. [Google Scholar] [CrossRef]
  24. Padmanabhan, V.; Penmetsa, P.; Li, X.; Dhondia, F.; Dhondia, S.; Parrish, A. COVID-19 effects on shared-biking in New York, Boston, and Chicago. Transp. Res. Interdiscip. Perspect. 2021, 9, 100282. [Google Scholar] [CrossRef] [PubMed]
  25. Tirachini, A.; Cats, O. COVID-19 and Public Transportation: Current Assessment, Prospects, and Research Needs. J. Public Transp. 2020, 22, 1–21. [Google Scholar] [CrossRef]
  26. Al-Rashid, M.A.; Goh, H.C.; Harumain, Y.A.S.; Ali, Z.; Campisi, T.; Mahmood, T. Psychosocial barriers of public transport use and social exclusion among older adults: Empirical evidence from Lahore, Pakistan. Int. J. Environ. Res. Public Health 2021, 18, 185. [Google Scholar] [CrossRef] [PubMed]
  27. Ashraf Javid, M.; Abdullah, M.; Ali, N.; Dias, C. Structural equation modeling of public transport use with COVID-19 precautions: An extension of the norm activation model. Transp. Res. Interdiscip. Perspect. 2021, 12, 100474. [Google Scholar] [CrossRef] [PubMed]
  28. Borhan, M.N.; Ibrahim, A.N.H.; Miskeen, M.A.A. Extending the theory of planned behaviour to predict the intention to take the new high-speed rail for intercity travel in Libya: Assessment of the influence of novelty seeking, trust and external influence. Transp. Res. Part A Policy Pract. 2019, 130, 373–384. [Google Scholar] [CrossRef]
  29. Baig, F.; Zhang, D.; Lee, J.; Xu, H. Shaping inclusiveness of a transportation system: Factors affecting seat-yielding behavior of university students in public transportation. Transp. Res. Part A Policy Pract. 2022, 155, 79–94. [Google Scholar] [CrossRef]
  30. Ajzen, I.; Fishbein, M. Understanding Attitudes and Predicting Social Behaviour; Prentice-Hall: Englewood Cliffs, NJ, USA, 1980. [Google Scholar]
  31. Ajzen, I. The theory of planned behavior. Organ. Behav. Hum. Decis. Process. 1991, 50, 179–211. [Google Scholar] [CrossRef]
  32. Bandura, A. Social Cognitive Theory of Mass Communication. Media Psychol. 2001, 3, 265–299. [Google Scholar] [CrossRef]
  33. Davis, F.D. Perceived Usefulness, Perceived Ease of Use, and User Acceptance of Information Technology. MIS Q. 1989, 13, 319. [Google Scholar] [CrossRef] [Green Version]
  34. Venkatesh; Morris; Davis; Davis User Acceptance of Information Technology: Toward a Unified View. MIS Q. 2003, 27, 425. [CrossRef] [Green Version]
  35. Chen, C.; Chao, W. Habitual or reasoned? Using the theory of planned behavior, technology acceptance model, and habit to examine switching intentions toward public transit. Transp. Res. Part F Traffic Psychol. Behav. 2011, 14, 128–137. [Google Scholar] [CrossRef]
  36. Lee, J.; Baig, F.; Li, X. Media Influence, Trust, and the Public Adoption of Automated Vehicles. IEEE Intell. Transp. Syst. Mag. 2021, PP, 2–15. [Google Scholar] [CrossRef]
  37. Tran, V.; Zhao, S.; Diop, E.B.; Song, W. Travelers’ Acceptance of Electric Carsharing Systems in Developing Countries: The Case of China. Sustainability 2019, 11, 5348. [Google Scholar] [CrossRef] [Green Version]
  38. Singh, V.; Singh, V.; Vaibhav, S. A review and simple meta-analysis of factors influencing adoption of electric vehicles. Transp. Res. Part D Transp. Environ. 2020, 86, 102436. [Google Scholar] [CrossRef]
  39. Madden, T.J.; Ellen, P.S.; Ajzen, I. A Comparison of the Theory of Planned Behavior and the Theory of Reasoned Action. Personal. Soc. Psychol. Bull. 1992, 18, 3–9. [Google Scholar] [CrossRef]
  40. Hsiao, C.H.; Yang, C. Predicting the travel intention to take High Speed Rail among college students. Transp. Res. Part F Traffic Psychol. Behav. 2010, 13, 277–287. [Google Scholar] [CrossRef]
  41. Zhang, D.; Schmöcker, J.-D.; Fujii, S.; Yang, X. Social norms and public transport usage: Empirical study from Shanghai. Transportation 2016, 43, 869–888. [Google Scholar] [CrossRef]
  42. Lee, J.; Baig, F.; Pervez, A. Impacts of COVID-19 on individuals’ mobility behavior in Pakistan based on self-reported responses. J. Transp. Health 2021, 22, 101228. [Google Scholar] [CrossRef]
  43. Lamb, T.L.; Winter, S.R.; Rice, S.; Ruskin, K.J.; Vaughn, A. Factors that predict passengers willingness to fly during and after the COVID-19 pandemic. J. Air Transp. Manag. 2020, 89, 101897. [Google Scholar] [CrossRef]
  44. Thombre, A.; Agarwal, A. A paradigm shift in urban mobility: Policy insights from travel before and after COVID-19 to seize the opportunity. Transp. Policy 2021, 110, 335–353. [Google Scholar] [CrossRef]
  45. Bh, A.; TM, R. A comprehensive analysis of the trip frequency behavior in COVID scenario. Transp. Lett. 2021, 13, 395–403. [Google Scholar] [CrossRef]
  46. Sarwar, M.T.; Anastasopoulos, P.C.; Golshani, N.; Hulme, K.F. Grouped random parameters bivariate probit analysis of perceived and observed aggressive driving behavior: A driving simulation study. Anal. Methods Accid. Res. 2017, 13, 52–64. [Google Scholar] [CrossRef]
  47. Li, Y.; Gu, R.; Lee, J.; Yang, M.; Chen, Q.; Zhang, Y. The dynamic tradeoff between safety and efficiency in discretionary lane-changing behavior: A random parameters logit approach with heterogeneity in means and variances. Accid. Anal. Prev. 2021, 153, 106036. [Google Scholar] [CrossRef]
  48. Greene, W.H. NLOGIT Version 5: Reference Guide; Econometric Software Inc.: Plainview, NY, USA, 2012. [Google Scholar]
  49. Sanchez, G.; Trinchera, L.; Russolillo, G. plspm: Tools for Partial Least Squares Path Modeling (PLS-PM) 2017. Available online: https://github.com/gastonstat/plspm (accessed on 8 March 2022).
  50. Lee, J.; Baig, F.; Talpur, M.A.H.; Shaikh, S. Public Intentions to Purchase Electric Vehicles in Pakistan. Sustainability 2021, 13, 5523. [Google Scholar] [CrossRef]
  51. Henseler, J.; Ringle, C.M.; Sinkovics, R.R. The use of partial least squares path modeling in international marketing. In Advances in International Marketing; Emerland Group Publishing Limiter: Bingley, UK, 2009; Volume 7979, pp. 277–319. [Google Scholar] [CrossRef] [Green Version]
  52. Sanchez, G. PLS Path Modeling with R; Trowchez Editions; Berkeley, 2013. Available online: https://www.gastonsanchez.com/PLS_Path_Modeling_with_R.pdf (accessed on 8 March 2022).
  53. Dong, H.; Ma, S.; Jia, N.; Tian, J. Understanding public transport satisfaction in post COVID-19 pandemic. Transp. Policy 2021, 101, 81–88. [Google Scholar] [CrossRef]
  54. Fornell, C.; Larcker, D.F. Evaluating Structural Equation Models with Unobservable Variables and Measurement Error. J. Mark. Res. 1981, 18, 39–50. [Google Scholar] [CrossRef]
  55. Henseler, J.; Ringle, C.M.; Sarstedt, M. A new criterion for assessing discriminant validity in variance-based structural equation modeling. J. Acad. Mark. Sci. 2015, 43, 115–135. [Google Scholar] [CrossRef] [Green Version]
  56. Matson, G.; McElroy, S.; Circella, G.; Lee, Y. Telecommuting Rates During the Pandemic Differ by Job Type, Income, and Gender. Policy Brief. 2021, 1–3, UC Davis: National Center for Sustainable Transportation. [Google Scholar] [CrossRef]
  57. Hensher, D.A.; Wei, E.; Beck, M.J.; Balbontin, C. The impact of COVID-19 on cost outlays for car and public transport commuting—The case of the Greater Sydney Metropolitan Area after three months of restrictions. Transp. Policy 2021, 101, 71–80. [Google Scholar] [CrossRef]
  58. Zhang, J. Transport policymaking that accounts for COVID-19 and future public health threats: A PASS approach. Transp. Policy 2020, 99, 405–418. [Google Scholar] [CrossRef] [PubMed]
  59. Budd, L.; Ison, S. Responsible Transport: A post-COVID agenda for transport policy and practice. Transp. Res. Interdiscip. Perspect. 2020, 6, 100151. [Google Scholar] [CrossRef] [PubMed]
Figure 1. Seven-day average of newly confirmed cases in Greece.
Sustainability 14 03567 g001
Figure 2. Hypothesis model.
Sustainability 14 03567 g002
Figure 3. COVID-19 impact on travel frequencies/week.
Sustainability 14 03567 g003
Figure 4. COVID-19 impacts on travel frequencies by modes per week.
Sustainability 14 03567 g004
Figure 5. Changes of trips by purpose. Keep: make trips both before and after the outbreak; Began: make trips only after the outbreak; Stopped: made trips only before the outbreak; None: make no trip regardless of time period.
Sustainability 14 03567 g005aSustainability 14 03567 g005b
Figure 6. Structural model.
Sustainability 14 03567 g006
Table 1. Items used to measure latent constructs.
Latent ConstructsItem NumbersStatements
Q1Thinking about the coronavirus (COVID-19) makes me feel threatened.
COVIDQ2I am afraid of the coronavirus (COVID-19).
Q3I am stressed around other people because I worry I will catch the coronavirus (COVID-19).
Q4People who are important to me support me to use public transportation.
SNQ5People who influence me, want me to take public transportation instead of any alternative means.
Q6People whose opinions I value prefer that I should take public transportation to travel.
Q7For me, taking public transport is good.
ATTQ8For me, taking public transportation is convenient.
Q9For me, taking public transportation is safe.
Q10I am willing to use public transportation for my next travel.
INTQ11I plan to take public transportation when I travel next time.
Q12In the future, I intend to use public transportation to meet my travel needs.
COVID = COVID-19 perceived threats; SN = Subjective norms; ATT = Attitudes; INT = Willingness to use public transport.
Table 2. Respondents’ Details.
VariablesCharacteristicsFrequenciesPercentages
Gender Male18445.7%
GenderFemale21954.3%
Age 18–24 years22154.84%
Age25–44 years7318.12%
45 years or more10327.04%
Highest education level Lower than bachelor’s degree8120.1%
Highest education levelBachelor’s degree or equivalent26164.8%
Master’s degree or higher5115.1%
Occupation Student18144.9%
OccupationOffice worker 8922.1%
Non-office worker7017.4%
Self-employed/business owner286.9%
Retired215.2%
Unemployed143.5%
Place of residence North Athens368.9%
Place of residenceWest Athens143.5%
Central Athens6917.1%
South Athens409.9%
West Attica164.0%
East Attica225.5%
Piraeus317.7%
Islands12731.5%
None of the above/outside Attica4811.9%
Place of occupation North Athens4811.9%
Place of occupationWest Athens123.0%
Central Athens9222.8%
South Athens184.4%
West Attica164.0%
East Attica143.5%
Piraeus276.7%
Islands6014.9%
None of the above/outside Attica4210.4%
Unemployed/retired7418.4%
Impact of COVID-19 on occupation Still working full-time9523.6%
Impact of COVID-19 on occupationStill working full-time remotely7318.1%
Shifted to part-time offline112.7%
Temporary laid off174.2%
Lost the Job61.5%
Student shifted to study remotely9924.6%
None of the above10225.3%
Household monthly income
(EUR 1 = ~USD 1.22)
Less than EUR 700399.7%
Household monthly incomeEUR 700–149913934.5%
(EUR 1 = ~USD 1.22)EUR 1500–299915137.5%
EUR 3000–49004511.1%
More than EUR 5000297.2%
Average monthly household income in Greece = ~EUR 1253
Table 3. Factors affecting change in people’s total trips.
VariablesChange in Total Trips
βS.E
Constant3.78848 ***0.58014
Standard deviation of constant 1.01044 ***0.18548
Occupation: studentReference
Occupation: office workers−1.54745 ***0.48466
Occupation: non-office workers−1.64196 ***0.51069
Occupation: self-employed/business owner−2.72773 ***0.61906
Occupation: retired−2.12528 ***0.57992
Occupation: jobless−1.64877 **0.82118
Perceived COVID-19 perception: stressedReference
Perceived COVID-19 perception: no stress−0.242140.37526
Perceived COVID-19 perception: moderate stress1.48071 *0.79432
Standard deviation of moderate stress4.37988 ***0.96259
Impacts on flexible travel: major impactsReference
Impacts on flexible travel: minor impacts−1.62438 ***0.43009
Impacts on flexible travel: no impacts−2.51814 ***0.60139
Impacts on flexible travel: moderate impacts1.08827 *0.58208
Standard deviation of moderate impacts2.51386 ***0.53131
Log likelihood (full)−92.9429
K (number of parameters)14
Log likelihood (intercept)−116.14525
McFadden Pseudo R-squared0.19977
Chi Square46.405 (d.f = 13, p value = 0.00001
Note: ***, **, * indicate significance at 1%, 5%, 10% levels, respectively. N = 403, β = coefficient, S.E. = Standard Error.
Table 4. Factors affecting changes to people’s bus trips.
VariablesChange in Bus Trips
βS.E
Constant0.50509 ***0.15867
Standard deviation of Constant 0.84518 ***0.10586
Live in IslandsReference
Live in South Athens1.10200 ***0.32613
Live in Piraeus0.58577 **0.28697
Live in none of the above/outside Attica0.410560.27312
Live in North Athens1.44412 **0.71369
Standard deviation of live in North Athens6.74165 ***2.3608
Live in West Athens1.41426 ***0.42631
Live in Central Athens2.36030 ***0.51407
Standard deviation of live in Central Athens2.87981 ***0.615
Live in West Attica−0.530920.41233
Live in East Attica1.03881 ***0.39637
Aged under 24Reference
Aged between 25 to 44−1.27355 ***0.20802
Standard deviation of aged between 25 to 440.42452 *0.21663
Aged over 45−1.27355 ***0.20802
Log likelihood (full)−186.577
K (number of parameters)15
Log likelihood (intercept)−225.85533
McFadden Pseudo R-squared0.17391
Chi Square78.557 (d.f = 14, p value = 0.00001)
Note: ***, **, * indicate significance at 1%, 5%, 10% levels, respectively. N = 403, β = coefficient, S.E. = standard Error.
Table 5. Factors affecting changes to people’s car trips.
VariablesChange in Car Trips
βS.E
Constant−0.040010.13918
Education: bachelor’s degreeReference
Education: middle/high school0.103610.17748
Education: master’s degree or higher0.93423 ***0.35976
Standard deviation of master’s degree or higher3.70914 ***0.854
Impact on employment: noneReference
Impact on employment: temporary laid off0.379530.33512
Impact on employment: lost job−0.390720.54728
Impact on employment: student shifted to study remotely0.008280.18165
Impact on employment: still working full-time−0.98580 ***0.22641
Standard deviation of still working full-time0.44662 **0.18816
Impact on employment: still working full-time remotely1.79920 ***0.53155
Standard deviation of still working full-time remotely3.98929 ***0.95654
Log likelihood (full)−234.902
K (number of parameters)12
Log likelihood (intercept)−255.85712
McFadden Pseudo R-squared0.08190
Chi Square41.909 (d.f = 11, p value = 0.00001)
Note: ***, **, * indicate significance at 1%, 5%, 10% levels, respectively. N = 403, β = coefficient, S.E. = Standard Error.
Table 6. Factors affecting changes to people’s taxi trips.
VariablesChange in Taxi Trips
βS.E
Constant−0.92955 ***0.13445
Standard deviation of Constant0.55805 ***0.10269
FemaleReference
Male−0.66658 ***0.20339
Aged under 24Reference
Aged between 25 to 44−0.73293 **0.34825
Standard deviation of aged between 25 to 440.65839 **0.30718
Aged over 45−0.61483 **0.31338
Standard deviation of aged over 451.20239 ***0.29046
Log likelihood (full)−144.081
K (number of parameters)7
Log likelihood (intercept)−151.23545
McFadden Pseudo R-squared0.04731
Chi Square14.31 (d.f = 6, p value = 0.02)
Note: ***, **, * indicate significance at 1%, 5%, 10% levels, respectively. N = 403, β = coefficient, S.E. = Standard Error.
Table 7. Factors affecting changes to people’s two-wheeler rips.
VariablesChange in Two-Wheelers Trips
βS.E
Constant−1.79351 ***0.17848
Standard deviation of Constant0.19042 *0.10249
Perceived COVID-19 threat: threatenedReference
Perceived COVID-19 threat: no threat0.74214 *0.44355
Perceived COVID-19 threat: moderately threatened0.87813 **0.37014
Standard deviation of moderately threatened1.16784 ***0.27868
Perceived fear from COVID-19: afraidReference
Perceived fear from COVID-19: moderately afraid−1.31347 ***0.43798
Standard deviation of COVID-19: moderately afraid1.14385 ***0.33746
Perceived fear from COVID-19: not afraid−0.85226 **0.40652
Standard deviation of not afraid0.38275 *0.20473
Log likelihood (full)−77.767
K (number of parameters)9
Log likelihood (intercept)−111.75666
McFadden Pseudo R-squared0.30414
Chi Square67.979 (d.f = 6, p value = 0.00001)
Note: ***, **, * indicate significance at 1%, 5%, 10% levels, respectively. N = 403, β = coefficient, S.E. = Standard Error.
Table 8. Factors affecting changes to people’s walking trips.
VariablesChange in Walking Trips
βS.E
Constant−0.71376 ***0.12921
Standard deviation of Constant0.19465 **0.07879
StudentReference
Occupation: office workers−2.36494 ***0.72237
Standard deviation of office workers2.93096 ***0.75832
Occupation: non-office workers−0.52060 **0.21277
Occupation: self-employed/business owner−0.83074 **0.41712
Standard deviation of self-employed/business owner0.72060 *0.40096
Occupation retired−0.3190.31559
Occupation jobless−0.150850.40199
FemaleReference
Male0.35160 **0.15788
Log likelihood (full)−201.039
K (number of parameters)10
Log likelihood (intercept)−208.622342
McFadden Pseudo R-squared0.03635
Chi Square15.167 (d.f = 9, p value = 0.08)
Note: ***, **, * indicate significance at 1%, 5%, 10% levels, respectively. N = 403, β = coefficient, S.E. = Standard Error.
Table 9. Factors affecting the changes to individuals’ travel to commute after COVID-19 outbreak.
VariablesCommute
βS.E
Constant0.55157 ***0.09888
Standard deviation of constant0.14553 **0.07218
Occupation: studentReference
Occupation: office workers−1.57514 ***0.19593
Standard deviation of office workers0.33451 *0.1744
Occupation: non-office Worker, −1.89885 ***0.30773
Standard deviation of non-office workers1.30128 ***0.3352
Occupation: self-employed/business owner, −1.35515 ***0.28502
Occupation: retired−0.86330 ***0.29737
Occupation: jobless0.019010.36896
Log likelihood function −176.550
K (number of parameters)9
Log likelihood (intercept)−221.24071
McFadden Pseudo R-squared 0.20201
Chi Square89.381 (d.f = 8, p value = 0.075)
Note: ***, **, * indicate significance at 1%, 5%, 10% levels, respectively. N = 403, β = coefficient, S.E. = Standard Error.
Table 10. Factors affecting the changes to individuals’ travel to buy necessities after the COVID-19 outbreak.
VariablesBuy Necessary
βS.E
Constant−2.03704 ***0.24549
Standard deviation of constant0.83951 ***0.17552
Gender: femaleReference
Gender: male−1.99436 ***0.6366
Standard deviation of male2.22038 ***0.47878
Education: bachelor’s degreeReference
Education: middle/high school−2.01700 *1.09624
Standard deviation of middle/high school1.86531 **0.77217
Education: master’s degree or higher0.81338 **0.34564
Standard deviation of master’s degree or higher0.96791 ***0.33353
Log likelihood function −91.868
K (number of parameters)8
Log likelihood (intercept)−97.73293
McFadden Pseudo R-squared 0.0625
Chi Square11.728 (d.f = 7, p value = 0.1)
Note: ***, **, * indicate significance at 1%, 5%, 10% levels, respectively. N = 403, β = coefficient, S.E. = Standard Error.
Table 11. Factors affecting the changes to individuals’ travel to visit relatives and friends after the COVID-19 outbreak.
VariablesVisit Relatives and Friends
βS.E
Constant0.23003 **0.098
Standard deviation of constant1.24550 ***0.12862
Impacts on flexible travel: major impactsReference
Impacts on flexible travel: minor impacts−1.35768 ***0.33115
Impacts on flexible travel: no impacts−2.31260 ***0.70314
Impacts on flexible travel: moderate impacts−2.22786 ***0.39911
Standard deviation of moderate impacts3.91327 ***0.66791
Log likelihood function −238.958
K (number of parameters)10
Log likelihood (intercept)−257.65567
McFadden Pseudo R-squared 0.07257
Chi Square37.396 (d.f = 9, p value = 0.075)
Note: ***, **, * indicate significance at 1%, 5%, 10% levels, respectively. N = 403, β = coefficient, S.E. = Standard Error.
Table 12. Factors affecting the changes to individuals’ travel to perform religious activities after the COVID-19 outbreak.
VariablesReligious
ΒS.E
Constant−0.99534 ***0.12931
Gender: femaleReference
Gender: male−2.64362 ***0.61329
Standard deviation of male2.83317 ***0.54899
Age: under 24 yearsReference
Age: 25 to 44 years−1.16122 **0.57245
Standard deviation of aged 25 to 442.59008 ***0.66306
Age: over 45 years0.54188 ***0.2053
Log likelihood function −170.188
K (number of parameters)6
Log likelihood (intercept)−177.19778
McFadden Pseudo R-squared 0.03956
Chi Square14.020 (d.f = 5, p value = 0.015)
Note: ***, **, * indicate significance at 1%, 5%, 10% levels, respectively. N = 403, β = coefficient, S.E. = Standard Error.
Table 13. Reliability and validity tests.
Latent FactorsReliability IndicatorsFornell–Larcker Criterion
(Diagonals = Correlations, Off-Diagonals= √AVE)
Cronbach AlphaComposite ReliabilityAVECOVIDSNATTINT
COVID0.880.930.800.90−0.16−0.23−0.22
SN0.870.920.79−0.160.890.600.55
ATT0.750.860.66−0.230.600.810.71
INT0.830.900.75−0.220.550.710.86
COVID = COVID-19 perceived threats; SN = Subjective norms; ATT = Attitudes; INT = Willingness to use public transport.
Table 14. Factor loadings of the items.
Latent ConstructsQuestion NumbersFactor LoadingCommunality
Q10.900.82
COVIDQ20.930.87
Q30.850.73
Q40.870.76
SNQ50.920.85
Q60.880.77
Q70.840.71
ATTQ80.800.64
Q90.800.64
Q100.930.86
INTQ110.910.82
Q120.750.56
Publisher’s Note: MDPI stays neutral with regard to jurisdictional claims in published maps and institutional affiliations.

