1. Introduction
The emergence of the COVID-19 pandemic has prompted a new view on the relationship between sustainable development and worldwide tourism. Over the past decades, this relationship was mainly investigated from the perspective of the unwanted effects of tourism—often in the form of mass tourism—on the environmental quality of regions or cities (see, e.g., [
1,
2]). Spatial density and geographical proximity were the characteristic features of mass tourism. However, recently, we have observed a significant shift in the spatial behavior of visitors to regions and cities; the contagious effect of the coronavirus has caused a global awareness of the health risks of high human density in entertainment centers, theatres, museums, and other public events. Consequently, new sustainability motives in the tourism sector found their origin in environmental concerns and health concerns (in agreement with Goal Three of the SDGs). Density and proximity were increasingly seen as negative sustainability externalities, with the consequence that tourists and recreationers were re-discovering spacious and green areas ranging from urban parks to regional or national parks. Such green areas were not completely serving as substitutes for densely populated tourism centers, but to some extent, they acted as complimentary amenities mitigating COVID-19 infections. This has profoundly impacted the steady pattern of tourism trends over the past years.
The global rise in welfare, the ongoing rise in leisure time, and the improvement of geographical accessibility have, over the past decades, prompted an unprecedented increase in tourist movements, not only locally or regionally but also internationally [
3,
4]. Agglomerations with favorable connectivity have especially benefitted from this megatrend. This holds for tourist hubs such as Paris, Rome, Amsterdam, San Francisco, New York, Bangkok, or Tokyo favoring urban tourism and for Malaga, Nice, Antalya, Bali, Cape Town, or Miami favoring beach and nature tourism prominently. Clearly, this demarcation of tourism types is less sharp, and mixed cases are abundantly available. Even the traditional dichotomy between urban and rural tourism never led to entirely disjointed appearances of these two types of tourism, as both centripetal and centrifugal forces (for instance, urban tourists who also make trips to rural areas or rural tourists who also make trips to cities) co-exist and interact. It is thus clear that both urban agglomerations and rural areas exert both repulsion and attraction forces on visitors.
From the perspective of sustainable tourism behavior, the trend towards less concentrated mass tourism patterns and more spatial dispersion is already present over a longer period. Consequently, environmental attractiveness factors and human health considerations come together in the period of the COVID-19 pandemic. It seems plausible that sustainability motives—interpreted in a broad sense—will exert a far-reaching impact on tourism behavior in the future.
Apart from wellness tourism [
5,
6,
7], health considerations have only played a modest role in quantitative tourism studies in contrast to sustainability considerations in modern tourism research. However, the COVID-19 pandemic has generated a different mindset in the motivation and decisions of tourists, in particular regarding modal choice, destination choice, and daily—often crowded—tourist amenities choice (e.g., shopping malls, museums, theatres). Currently, the pandemic is viewed as a risk of density for people and a health threat due to geographical proximity. Therefore, the question arises whether COVID-19 will act as a ‘game changer’ for contemporary (mass) tourism.
The present study aims to assess the tourism implications for Las Vegas as a center of mass tourism (mainly gambling and entertainment activities) and addresses the question of whether health concerns may be responsible for significant changes in the geography of tourism in this area. A significant new phenomenon may be the spatial choice responses of tourists in terms of spatial tourism deconcentration from the main agglomeration onward. This phenomenon might lead to a hybrid form of destination choice with a strong orientation towards a significant tourist hub (i.e., Las Vegas), but a deconcentrated mobility pattern of tourists who spend a significant part of their time outside the crowded urban agglomeration (e.g., by visiting natural parks) or outdoor entertainment places.
The present applied modeling study is organized as follows: after this introductory section in which the hybrid tourism deconcentrated form of tourist concentrations is introduced, we sketch the contours of our analytical framework in
Section 2. Next, in
Section 3, a conceptual model based on a so-called hybrid or Galaxy structure is depicted.
Section 4 is then devoted to the analytical and modeling framework, while
Section 5 describes the database used for studying whether COVID-19 is indeed a game-changer for tourism in Las Vegas. Next, modeling experiments are presented in
Section 6, while a description and interpretation of findings are discussed in
Section 7. Finally,
Section 8 offers concluding remarks.
2. COVID-19 and Tourism: Contextualization
The COVID-19 pandemic has confronted people worldwide with the vulnerability of our socio-economic and health systems. Policy intervention measures (e.g., lock-down measures, constraints on physical closeness, mobility restraints) left deep traces in the daily functioning of our societies. In parallel, the increased awareness of COVID-19 risks for personal health led to a critical judgment of citizens regarding their daily environment. Especially high population density, close physical proximity, and physical interactions were often regarded as potential threats [
8].
Interdependent urban challenges—including pandemics—call for response measures (short- and long-run) of greater strategic scope and effectiveness than just rethinking ‘intelligent lock-down’ solutions, sometimes articulated in policy-response plans. More than ever, cities today are, on the one hand, struggling for global sustainability, vitality, attractiveness, and quality of life to keep a heterogeneous landscape of stakeholders (with different needs and interests) satisfied and happy. However, they are on a complex battlefield, coping with the expansion of COVID-19 infections, vaccination programs and acceptance, effective coordination of extensive complementary policy implications, and a trustful response to protect people. Furthermore, they need to plan for a complete and rapid recovery with a more resilient response that offers cities and their stakeholders a clear competitive advantage of sustainability and attractiveness to keep delivering high-quality tourist goods and services and enhance (health) safety and vital city life.
One of the fields dramatically affected by COVID-19 is the hospitality sector [
9]. The popularity of mass tourism to attractive places (cultural cities, popular beaches) showed a sharp decline, with some recovery in the second part of 2021. One of the striking phenomena was that people were seeking more individualized forms of tourism and recreation. According to some authors [
10], this will prompt a new trend towards rural tourism, or at least to extra-urban forms of tourism (inner- vs. outer-city destinations). Even though rural tourism is not an entirely new trend [
11,
12], it is undeniable that low-density tourism—often outside of the main tourist attractions—has become fashionable during the pandemic.
An important question is whether new types of extra-urban tourism will be competitive with mass urban tourism in terms of economic efficiency, ecological sustainability, and social status. This question will be the subject of this study which will address whether the corona crisis is a game-changer for traditional mass tourism. Unfortunately, the empirical evidence—from different countries and cities all over the world—does not directly lead to unambiguous findings. In particular, since the intertemporal curves of COVID-19 variants reflect different cycles over the past months, the short-term relationship between tourism flows and pandemics is hard to trace against the time-varying background factors of government interventions and lock-down measures [
13]. This phenomenon resembles the range of distinct economic dynamic cycles distinguished in growth theory, ranging from short-term business cycles via medium-term Juglar cycles to long-run Kondratiev cycles.
We may hypothesize that, if the COVID-19 pandemic is substantially and structurally influencing tourism decisions, it may adopt different forms ranging from avoiding crowded urban agglomerations or mass tourism in crowded resorts to substituting shared accommodation facilities (e.g., hotels) for individualized accommodation types (e.g., individual apartments) or to more subtle forms of nature tourism. In addition, the frequency of making tourist trips might also be negatively affected. Additionally, intermediate (hybrid) tourist constellations might emerge, such as traveling to a popular tourist destination but instead of spending most of the time in crowded areas, choosing extra-urban tourist destinations that are less congested (e.g., natural parks, countryside recreation). There is some evidence that the latter new form of tourist behavior is gaining importance which leads us to hypothesize that in the new ‘post-COVID reality’, mixed types of tourism may emerge in the form of a spatial spread of tourists around major accessible tourist destinations. Consequently, it is interesting to test the proposition that the dichotomy of urban-rural tourism may be mitigated by the new trend of ‘deconcentrated tourism concentration’.
The latter type of hybrid tourism is a merger of two different types of traditional tourism, viz. mass tourism in attractive locations (e.g., cultural tourism to Venice or Amsterdam or entertainment tourism to Las Vegas or Bangkok) and individualistic tourism to remote or rural areas (e.g., nature tourism). It means that tourists wish to enjoy both attractions by avoiding a permanent stay in high-density tourist accommodations while compensating this negative externality by visiting a more eco-based and healthy place in the surroundings.
The main challenge of the present study is to frame this new type of tourism by building an analytical framework for exploring the interactivity between tourism choice mechanisms, tourism destination places (e.g., inner vs. outer cities), the implications of the COVID-19 pandemics spread, the COVID-19 policy response measures, and the intensity of human-social interactions (in particular, geographical mobility) in the fluctuating space-time pattern of tourist choices. Finally, the analysis frame developed in the present study will be applied and tested for the Las Vegas Metro area.
3. COVID-19 and Tourism: Conceptualization
The force field of COVID-19 is complex, as the combination of epidemiological spread patterns among groups or regions, time-varying vaccination programs (with different vaccines and different degrees of protection for specific social-medical groups), and different governmental intervention measures (e.g., mobility restrictions, lock-down measures) lead to dynamic and complex patterns. All these forces impact tourist choices and behaviors, e.g., destination choices, local destination mobility, and local visits to tourist amenities. The integrated assessment of COVID-19 impacts on spatial tourism patterns will be oriented towards an analysis of the above proposition on ‘deconcentrated concentration’ of tourism patterns. This latter concept will be explained in more detail now.
Deconcentration is a term derived from industrial organization theory. It refers to a physical and managerial dispersion of functions and activities from a central corporate organization towards spatially and functionally separate divisions while maintaining a concentration of central competencies intact. This means that essentially a satellite network constellation is created, with a balance between spatial concentration (‘hub’) and functional deconcentration of activities. This regular business model is also replicated in the geography of spatial systems, where the concept of polycentricity has gained much popularity (see, e.g., [
14,
15]). A polycentric system is a geographical configuration with a combination of centralized and decentralized functions, where agglomeration forces and spatial network linkages provide a hierarchical structure with functional spatial specialization.
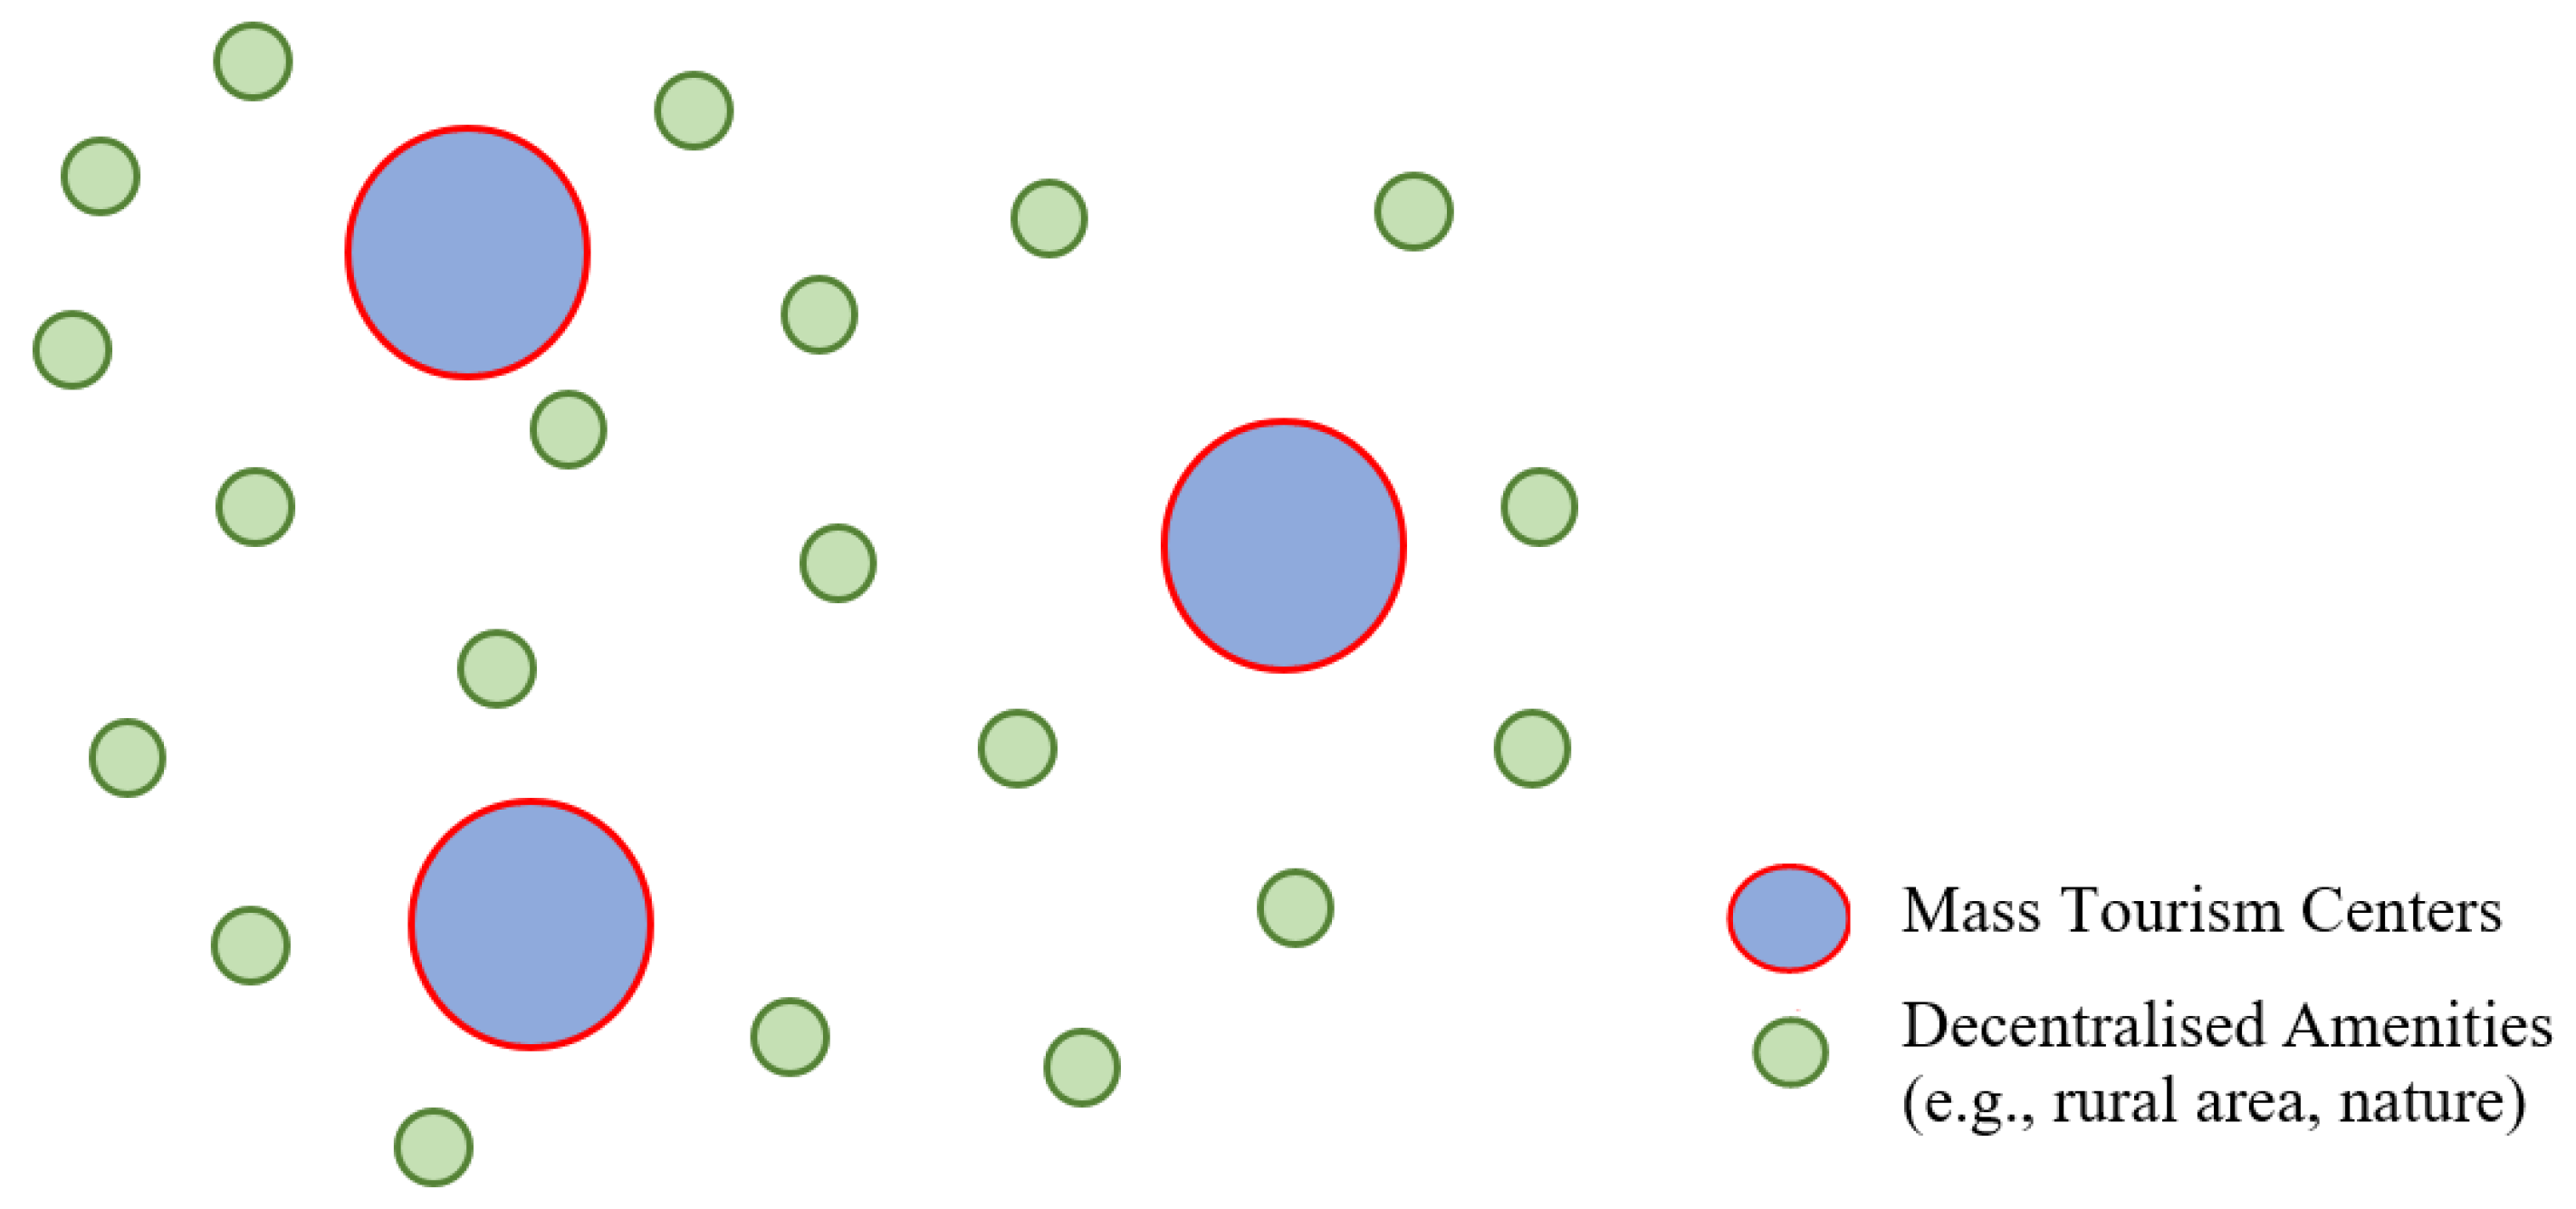
This polycentric conceptualization of spatial functions in terms of a major hub and complementary satellites will be used to describe the dispersion of tourism flows to Las Vegas during the COVID-19 pandemic. In this period, the awareness grew that a high concentration of tourists in a given tourist destination accompanied with a high density and close proximity of people is a potential threat to human health. To mitigate health risks in congested tourist concentrations such as Las Vegas, many visitors to Las Vegas were tempted to combine a visit to mass entertainment places with a healthy environmental trip outside, in particular trips to the Natural Parks outside the Las Vegas metropolitan area, even up to a daily distance of 300–450 miles. They might also combine a visit to several medium-sized environmental amenities with a trip to a major Natural Park destination (in a way similar to the ‘intervening opportunities’ idea advocated by Stouffer [
16]). This behavior in corona times was recently described as ‘the path of least resistance’ [
17]. In the present study, tourists’ spatial pattern of risk-avoiding mobility behavior in corona times will be called the ‘Galaxy’ system. The hypothetical spatial structure of this proposition is illustratively mapped out in
Figure 1 in the form of a spatial ‘Galaxy model.’
The literature on such emerging spatial ‘Galaxy’ constellations is sparse, but a few publications partly address these issues. Examples are found in the existing works of literature [
18,
19] that studied the shift to small-scale and less mass-oriented tourist amenities. More generally, there is a noticeable shift to more sustainable and individualized forms of tourism [
20] or outdoor activities [
21].
4. Analytical Framework and Modelling Context
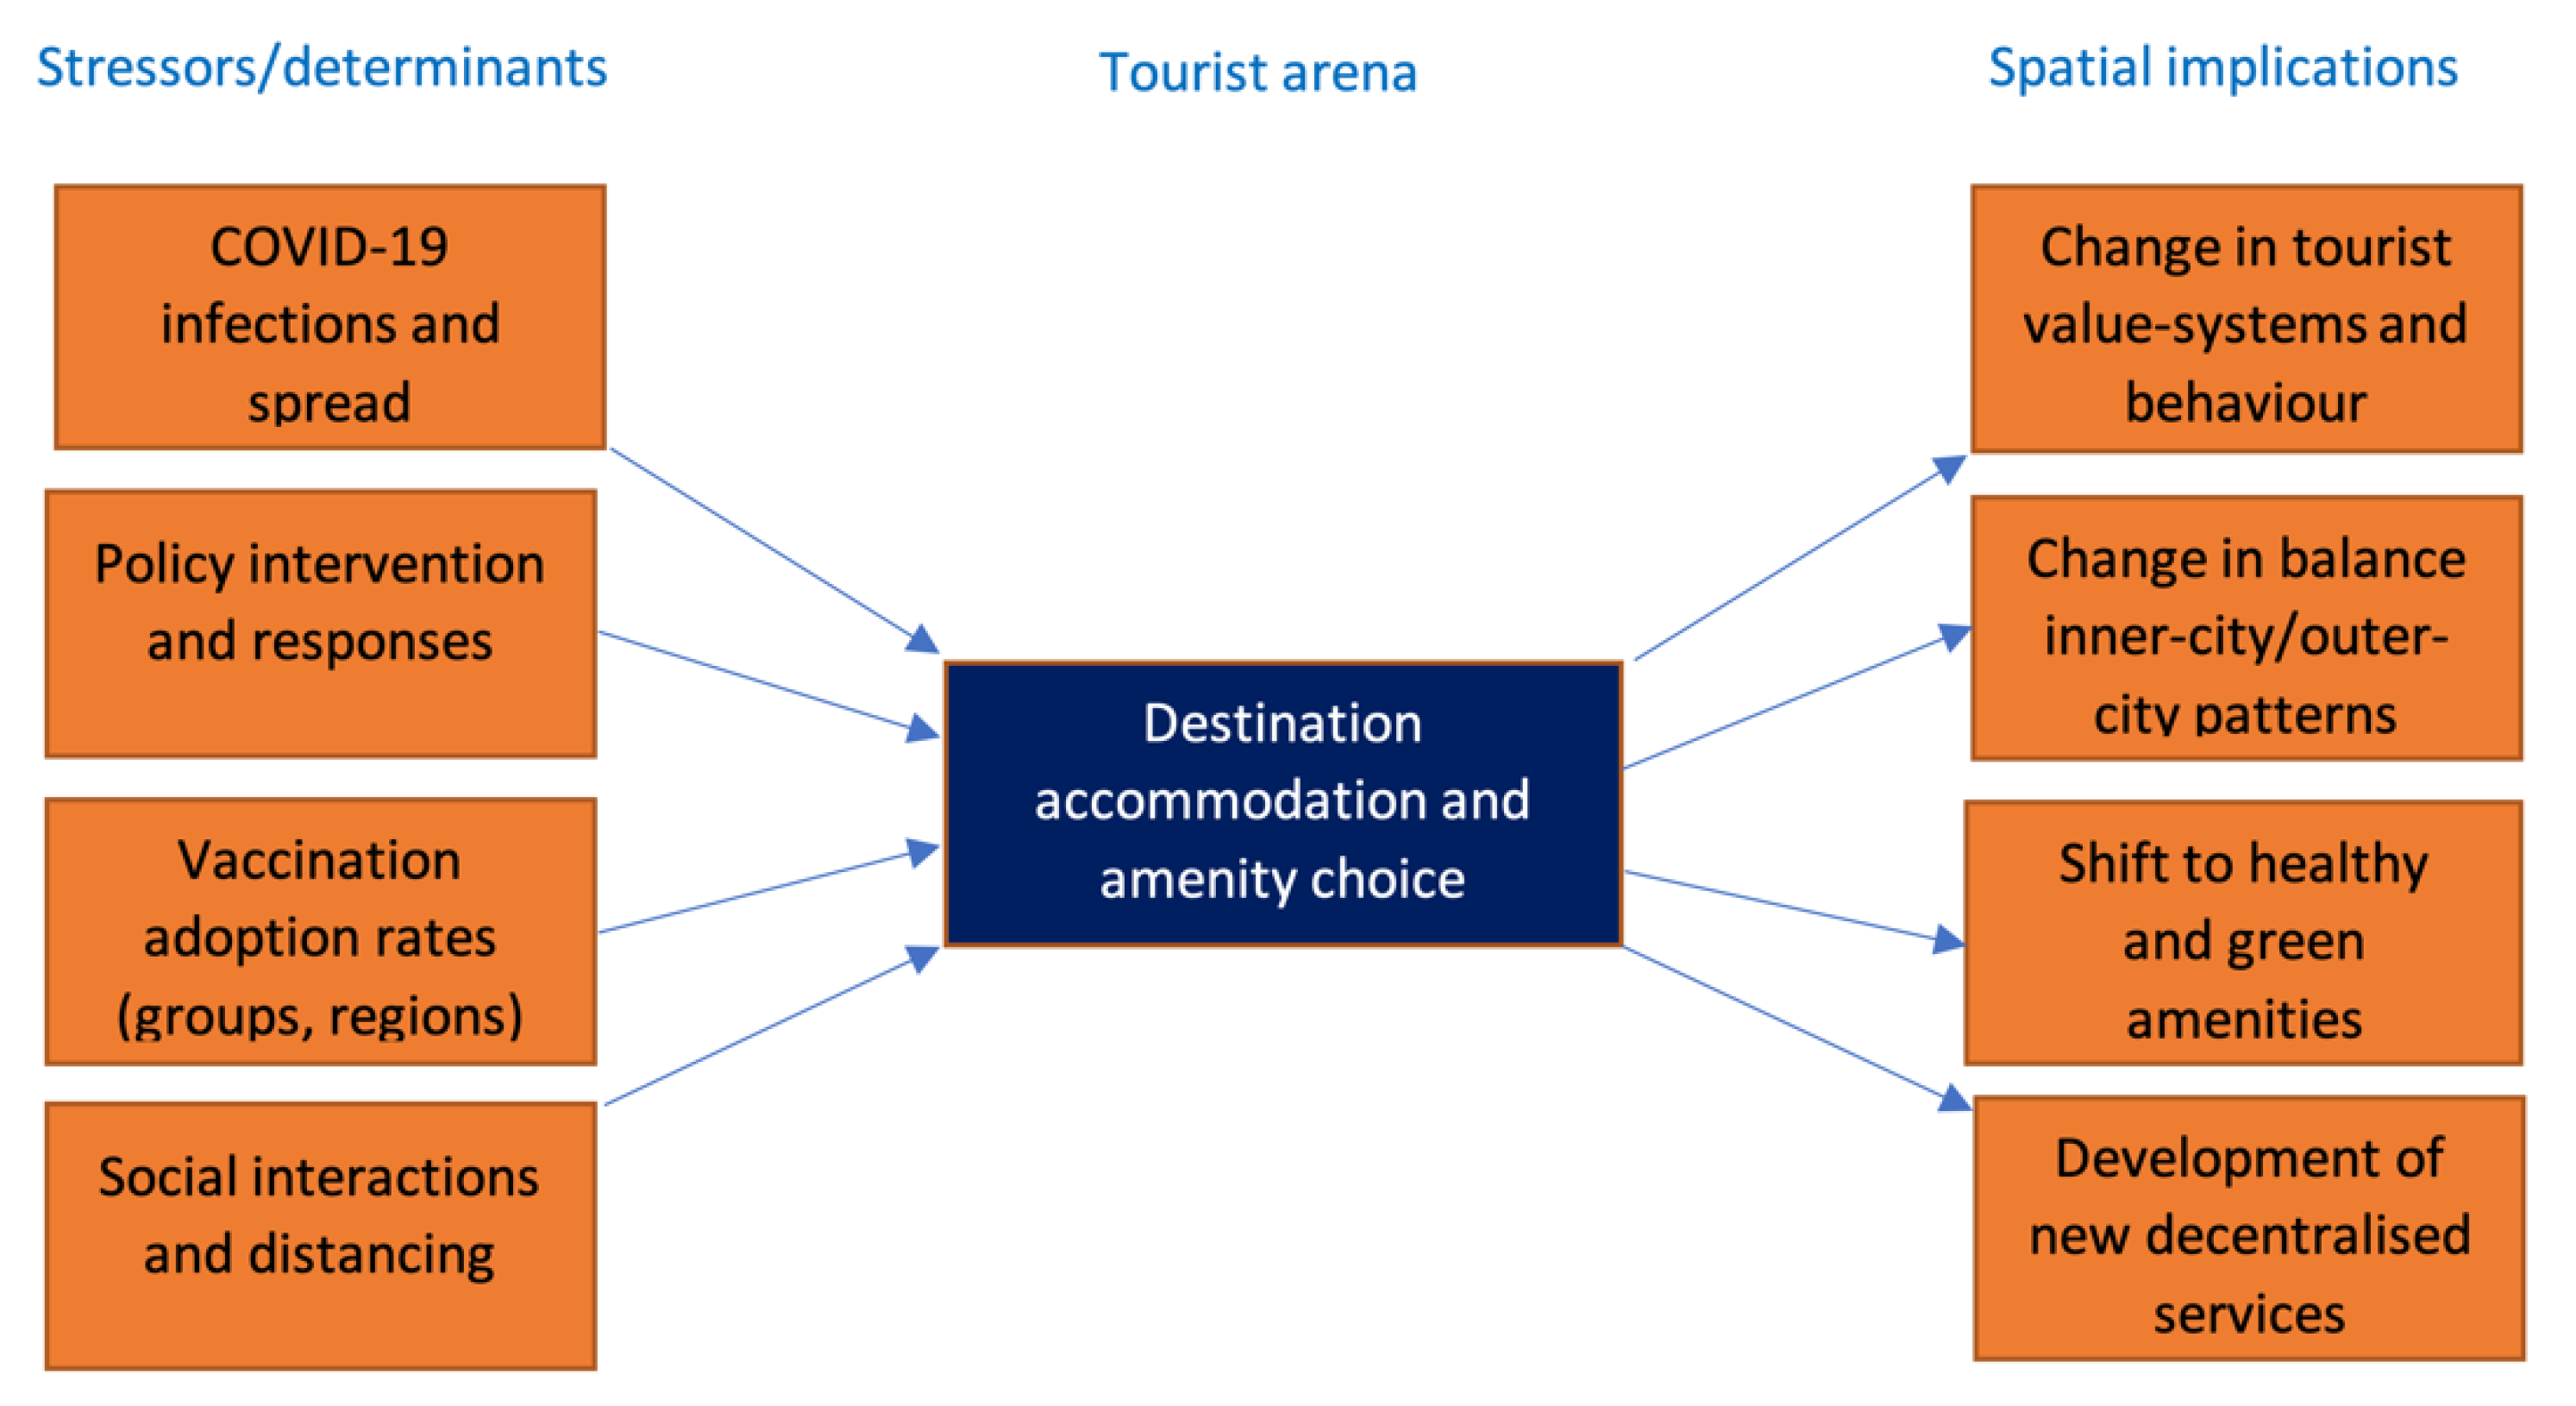
The coronavirus pandemic has influenced tourist behavior from two significant angles: (i) the real or perceived risk of spatially clustered tourism flows which may potentially be a considerable health risk; (ii) the moderating impact of governmental restrictions on mobility and ‘social closeness’ (ranging from lock-down measures to vaccination requirements). Clearly, there is interactivity between different travel motives and the related flows of tourists. It turns out that the health risks of tourist visits may manifest themselves in two factors: (i) interior crowdedness of visitors in tourist accommodations (e.g., hotels, Airbnb facilities), with the consequence that dense tourist accommodations are increasingly avoided to the benefit of more individualized and spacious forms of tourism accommodations (like luxury Airbnb facilities); (ii) exterior crowdedness of visitors in public urban space (e.g., shopping streets, historic districts), with the consequence, that visitors search increasingly for out-of-center amenities (including parks or natural areas). This force field is essentially depicted in the Galaxy image in
Figure 1, which maps out the dynamics in spatial tourist constellations as a result of the pandemic, and in a more general sense of health and sustainability motives.
This new development calls for an appropriate analytical framework describing the interactivity between tourist flows, (interior and exterior) tourist destinations choices, choices for specific types of tourist accommodation (within both the hotel and Airbnb sector), COVID-19 response strategies and government intervention measures, and human/social interaction patterns and mobility. The case study area to be investigated is Las Vegas, an urban agglomeration characterized by mass tourism but nowadays increasingly exposed to hybrid forms of tourism (i.e., a combination of urban and regional/rural/nature tourism). The analytical framework employed to test the deconcentrated tourism concentrations proposition is depicted in
Figure 2. The data and the model to test this new force field will be described in
Section 5 and
Section 6, respectively. However, first, we will provide some further background information on tourism flows in the Las Vegas area.
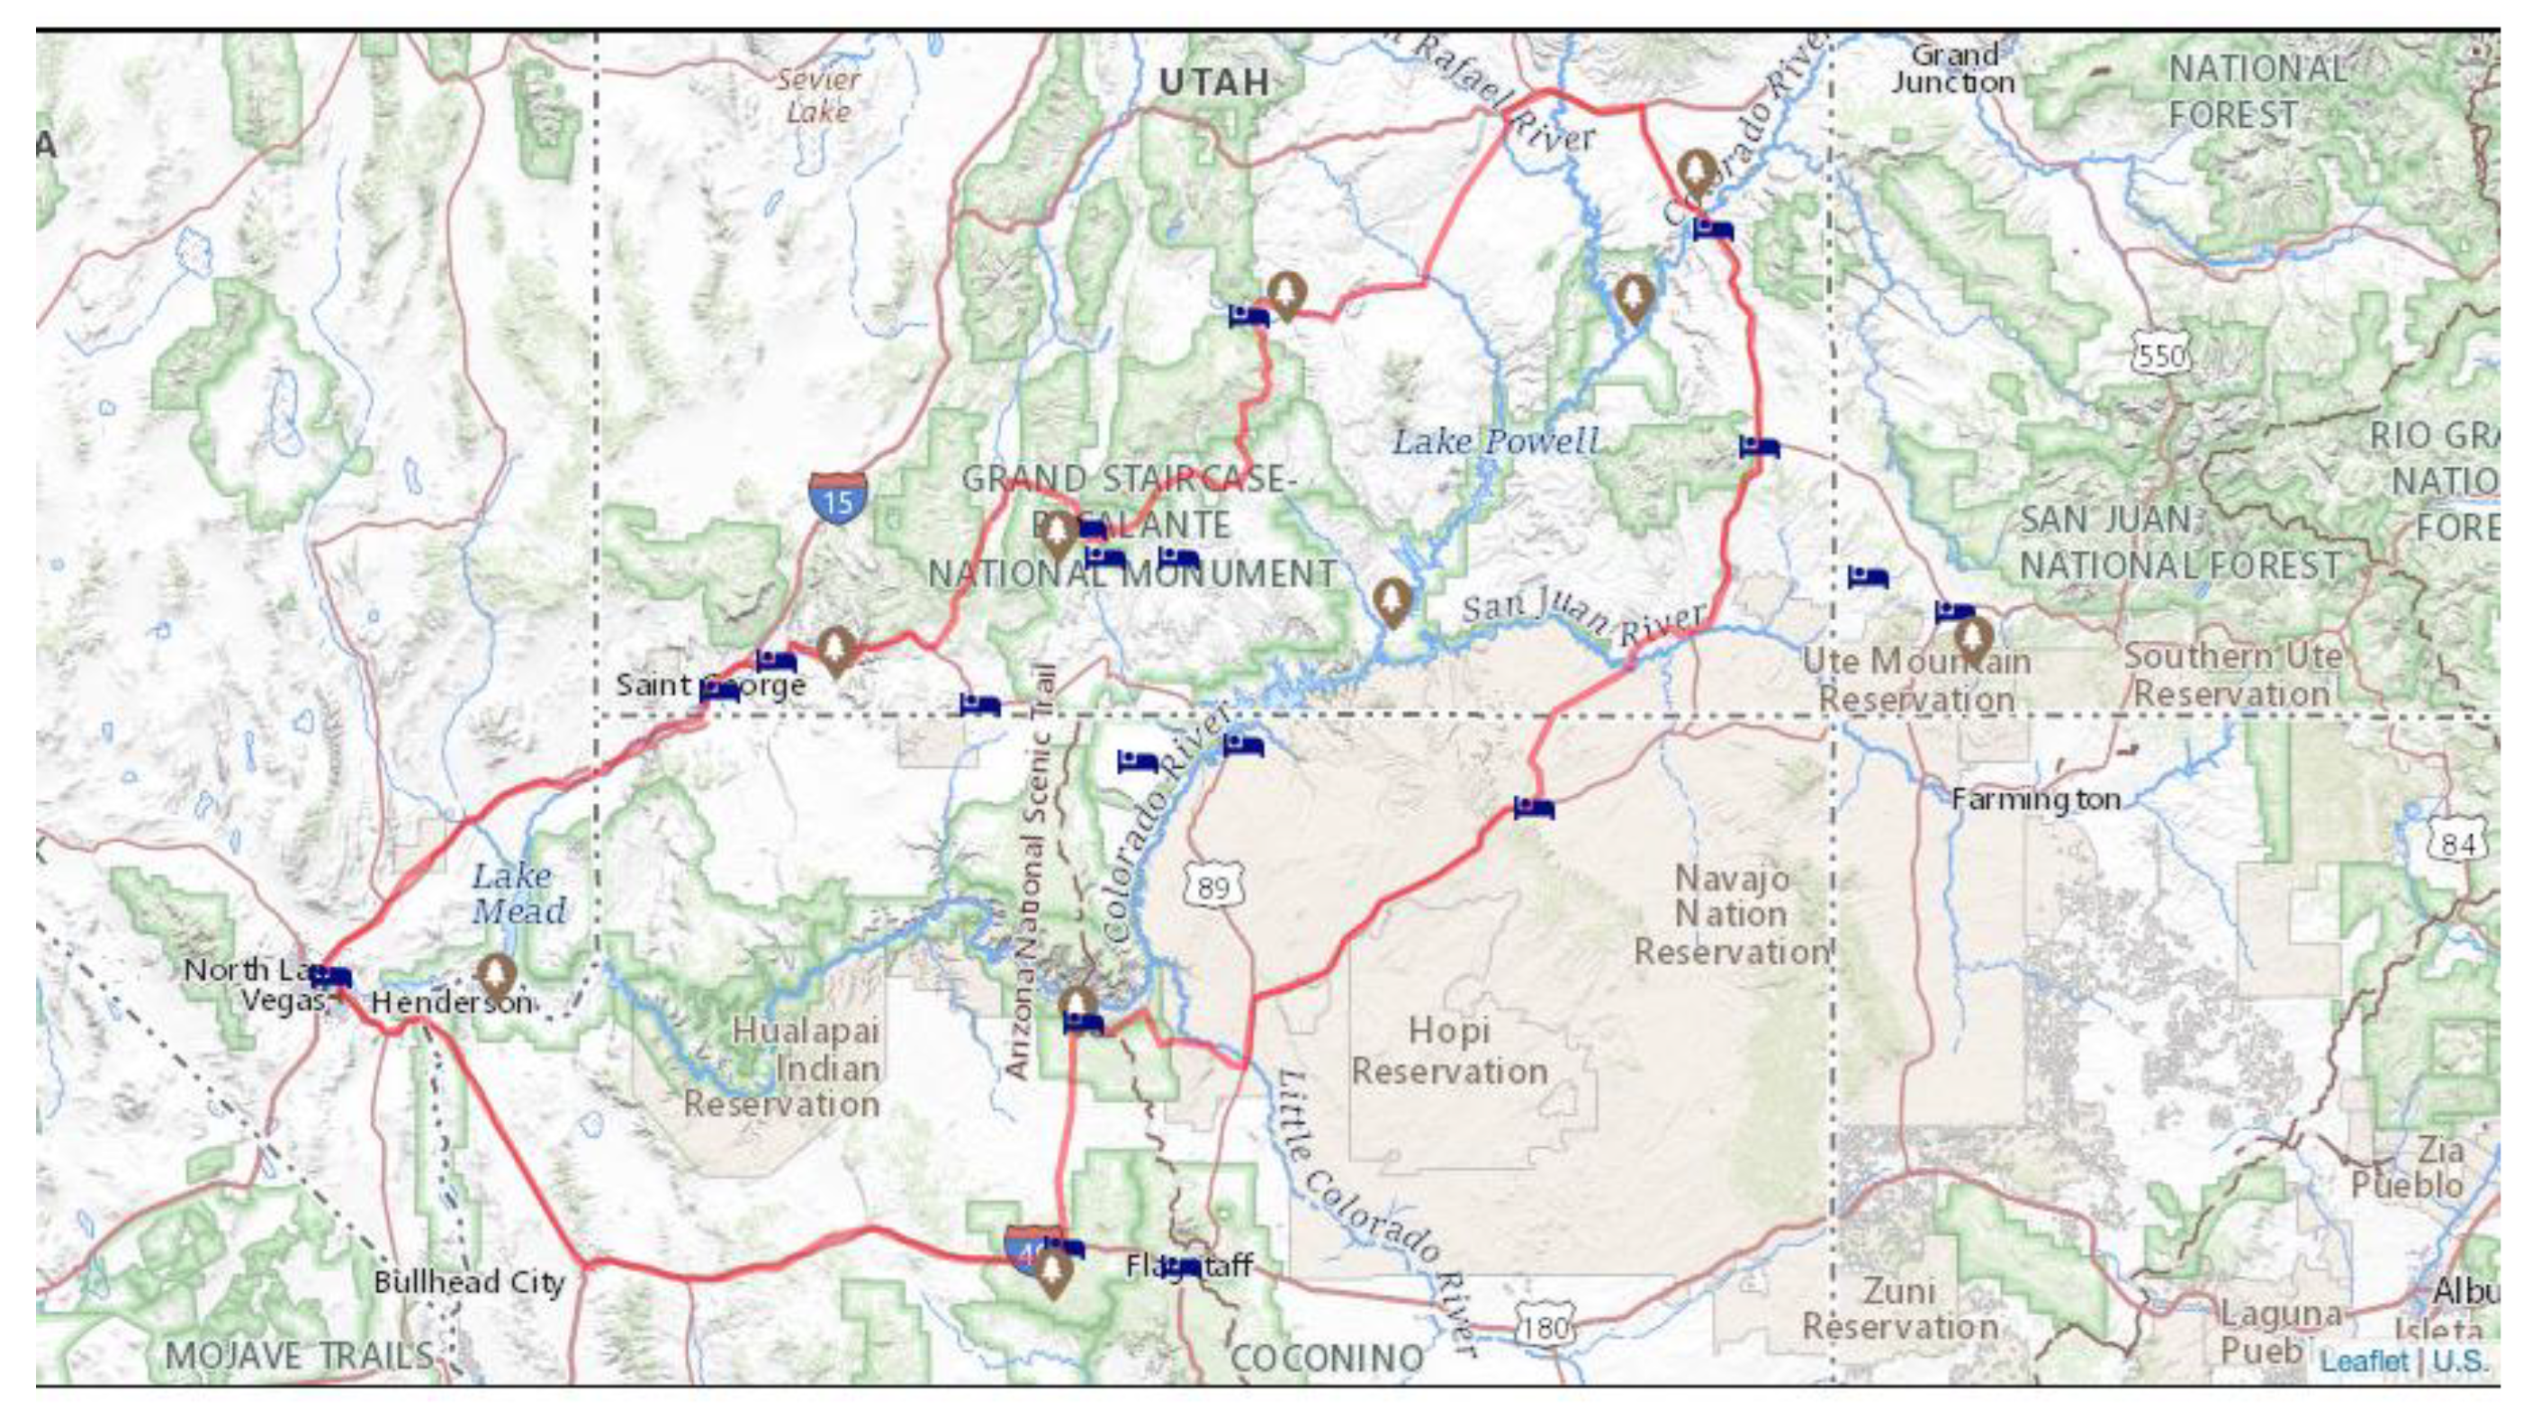
In the context of our research on deconcentration trends of tourists, we note that Las Vegas offers a wide variety of tourism activities ranging from its traditional casinos, shows and entertainment, world-class restaurants and bars, and the popular national parks that are easily accessible [
22]. According to National Geographic, McCarran International, Las Vegas, Nevada, serves as a gateway airport to the Southwest Canyon Circle Drive that links Grand Canyon with the other two prevalent national parks in Southern Utah, Bryce Canyon and Zion Canyon [
23]. A web-based organization to advocate for federal and state parks, US-Parks.com (accessed on 9 March 2022), describes ‘The Grand Circle Road Trip’ as one of the most well-known and appreciated road trips that link the most popular National Parks in the U.S. It suggests Las Vegas as a gateway point for travelers to start and end the road trip looping around Utah and Arizona, as shown in
Figure 3 below.
Las Vegas Convention and Visitor Authority (LVCVA), a government agency that promotes tourism in Southern Nevada and serves as a destination marketing organization, performs monthly visitor surveys, and publishes an annual visitor profile study for the Las Vegas Tourism industry. Therefore, the LVCVA is the most reliable public source for tourism trend analysis concerning visitor behaviors and activities for Las Vegas visitors [
24]. For the 8-year period from 2010 to 2018, the share of Las Vegas visitors who visited the five closest nearby national parks increased continuously (The five closest national parks and national recreation areas are Lake Mead National Recreational Area and Hoover Dam, Death Valley National Park, Zion Canyon National Park, Bryce National Park, and Grand Canyon National Park). These five closest national parks are located within 280 miles of Las Vegas (approximately 4.5 h of driving distance from Las Vegas). All these parks offer a one-day-long trip package for visitors to Las Vegas. Additionally, the other six national parks in this study located within 460 miles from Las Vegas (roughly 7 h of driving distance) still attract lots of tourists who visit the nearby national parks through the gateway city, Las Vegas, as shown in
Figure 3.
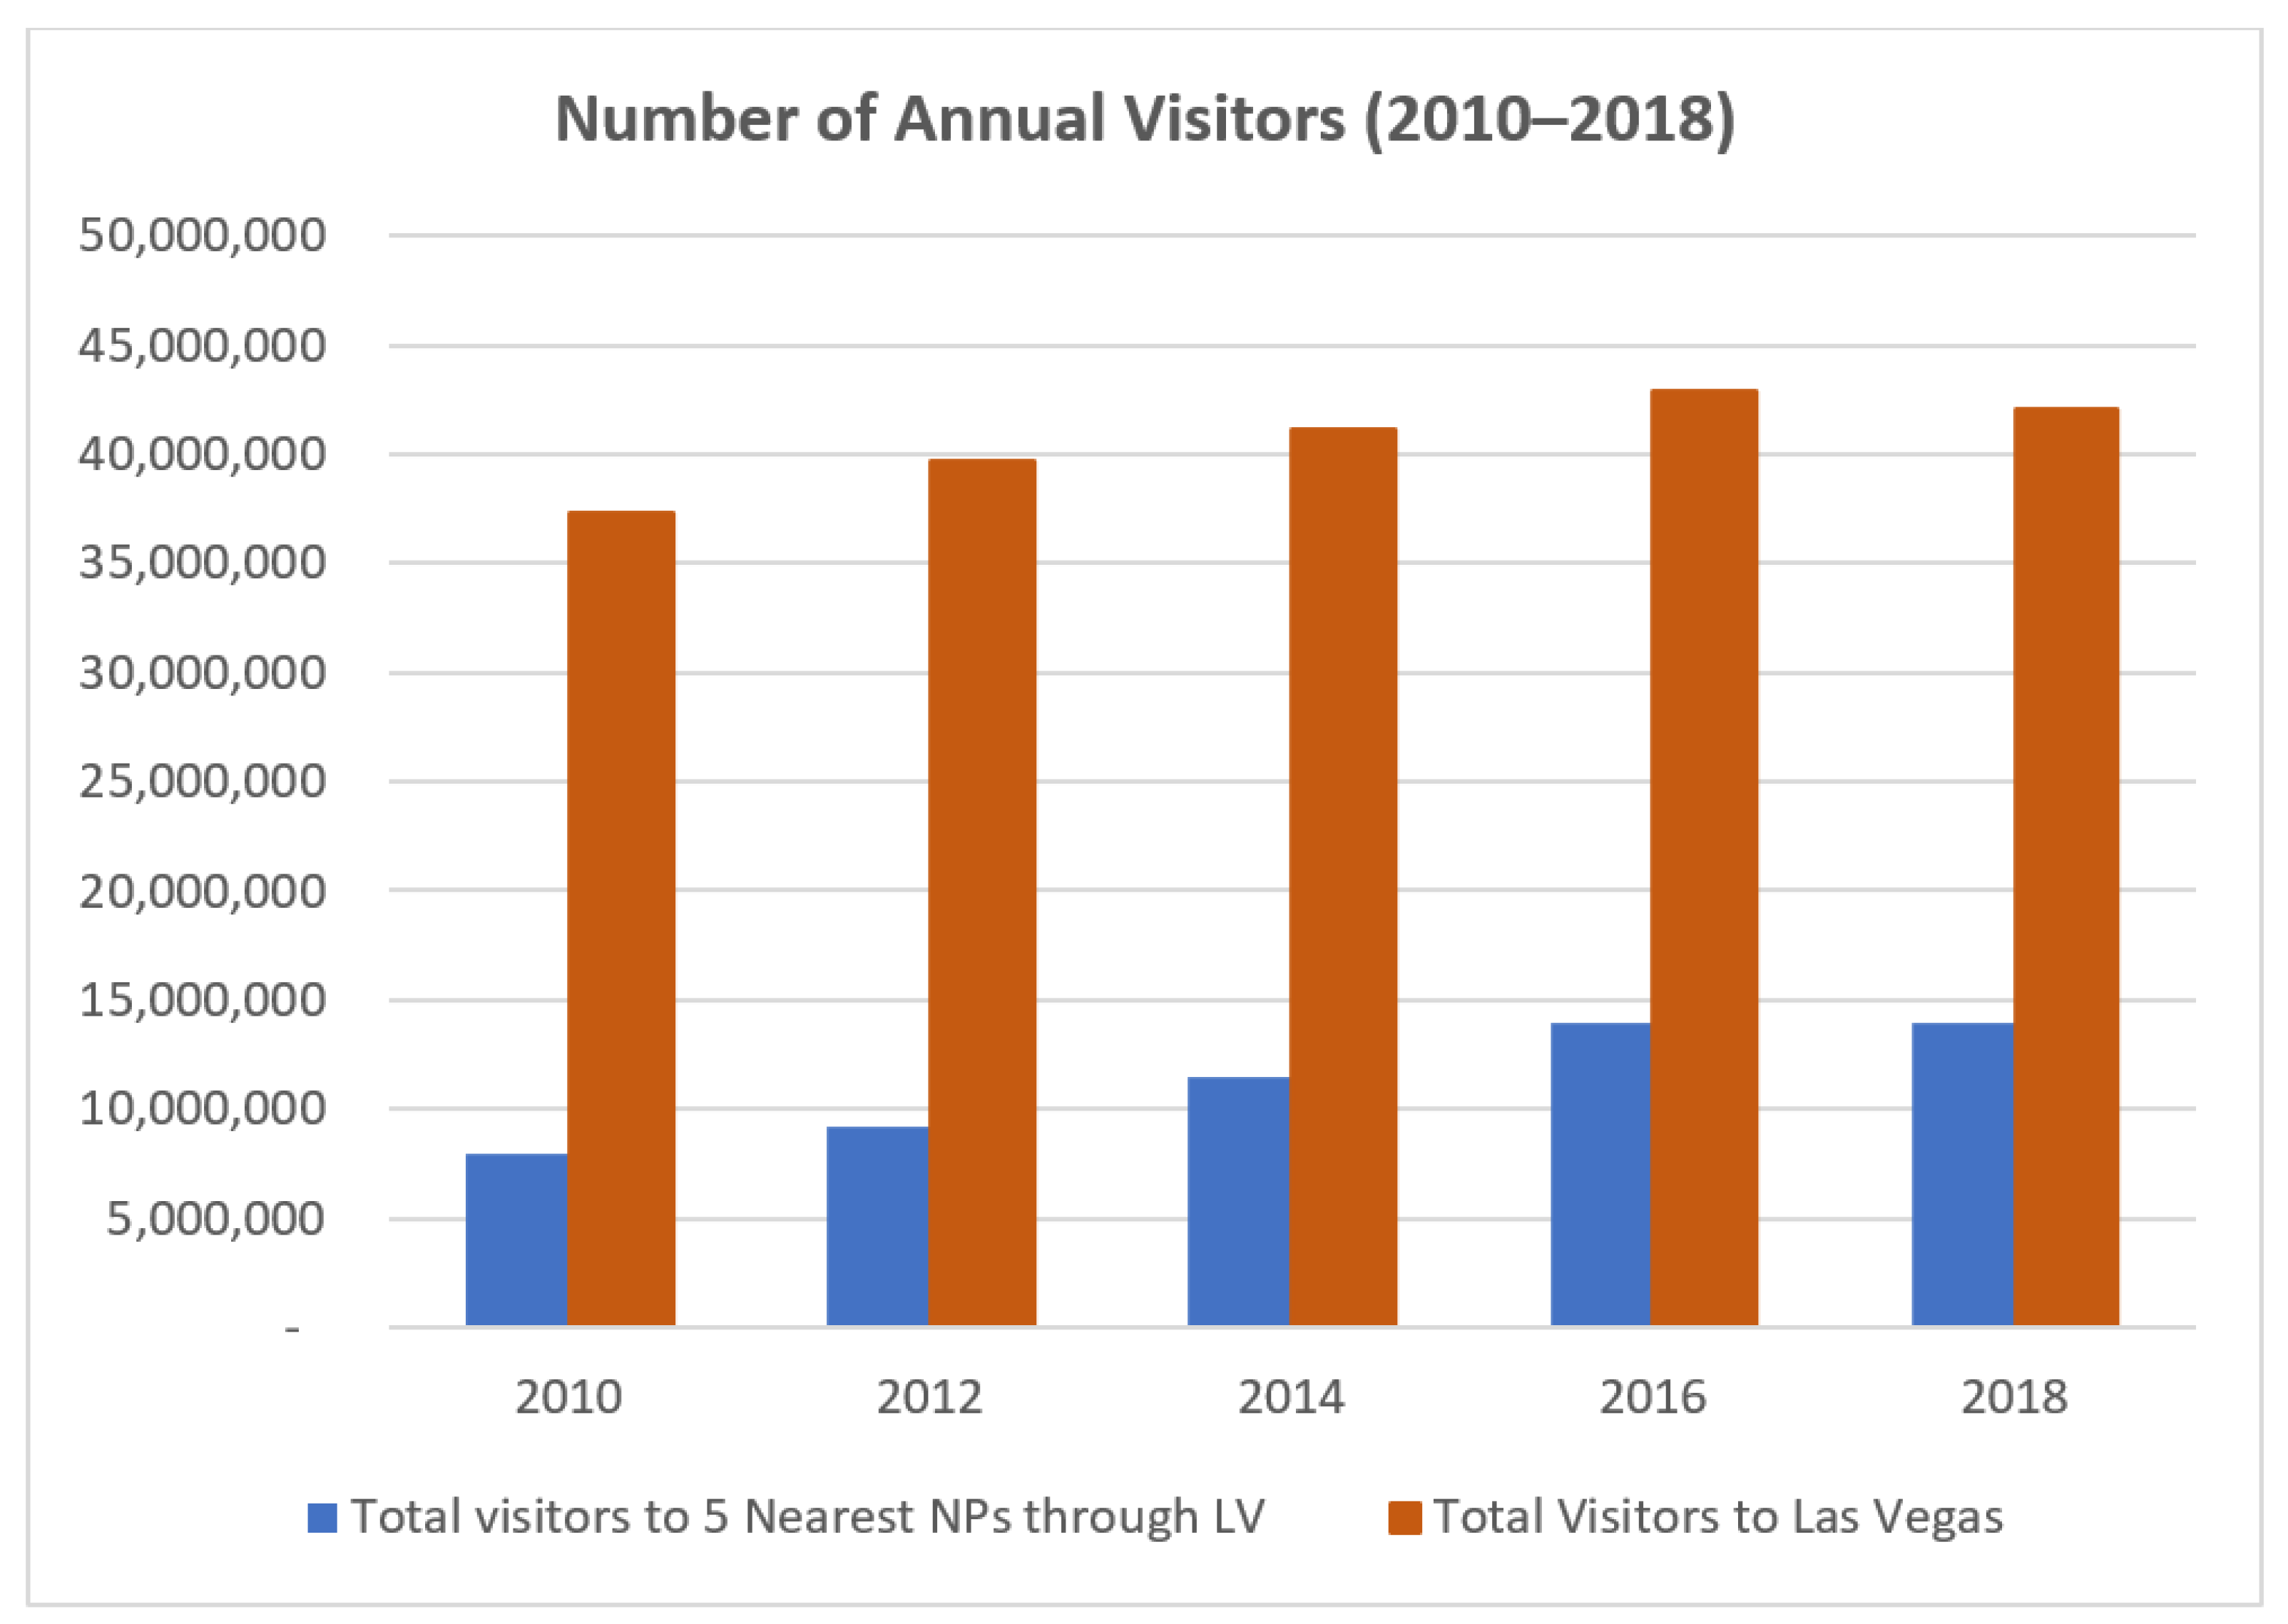
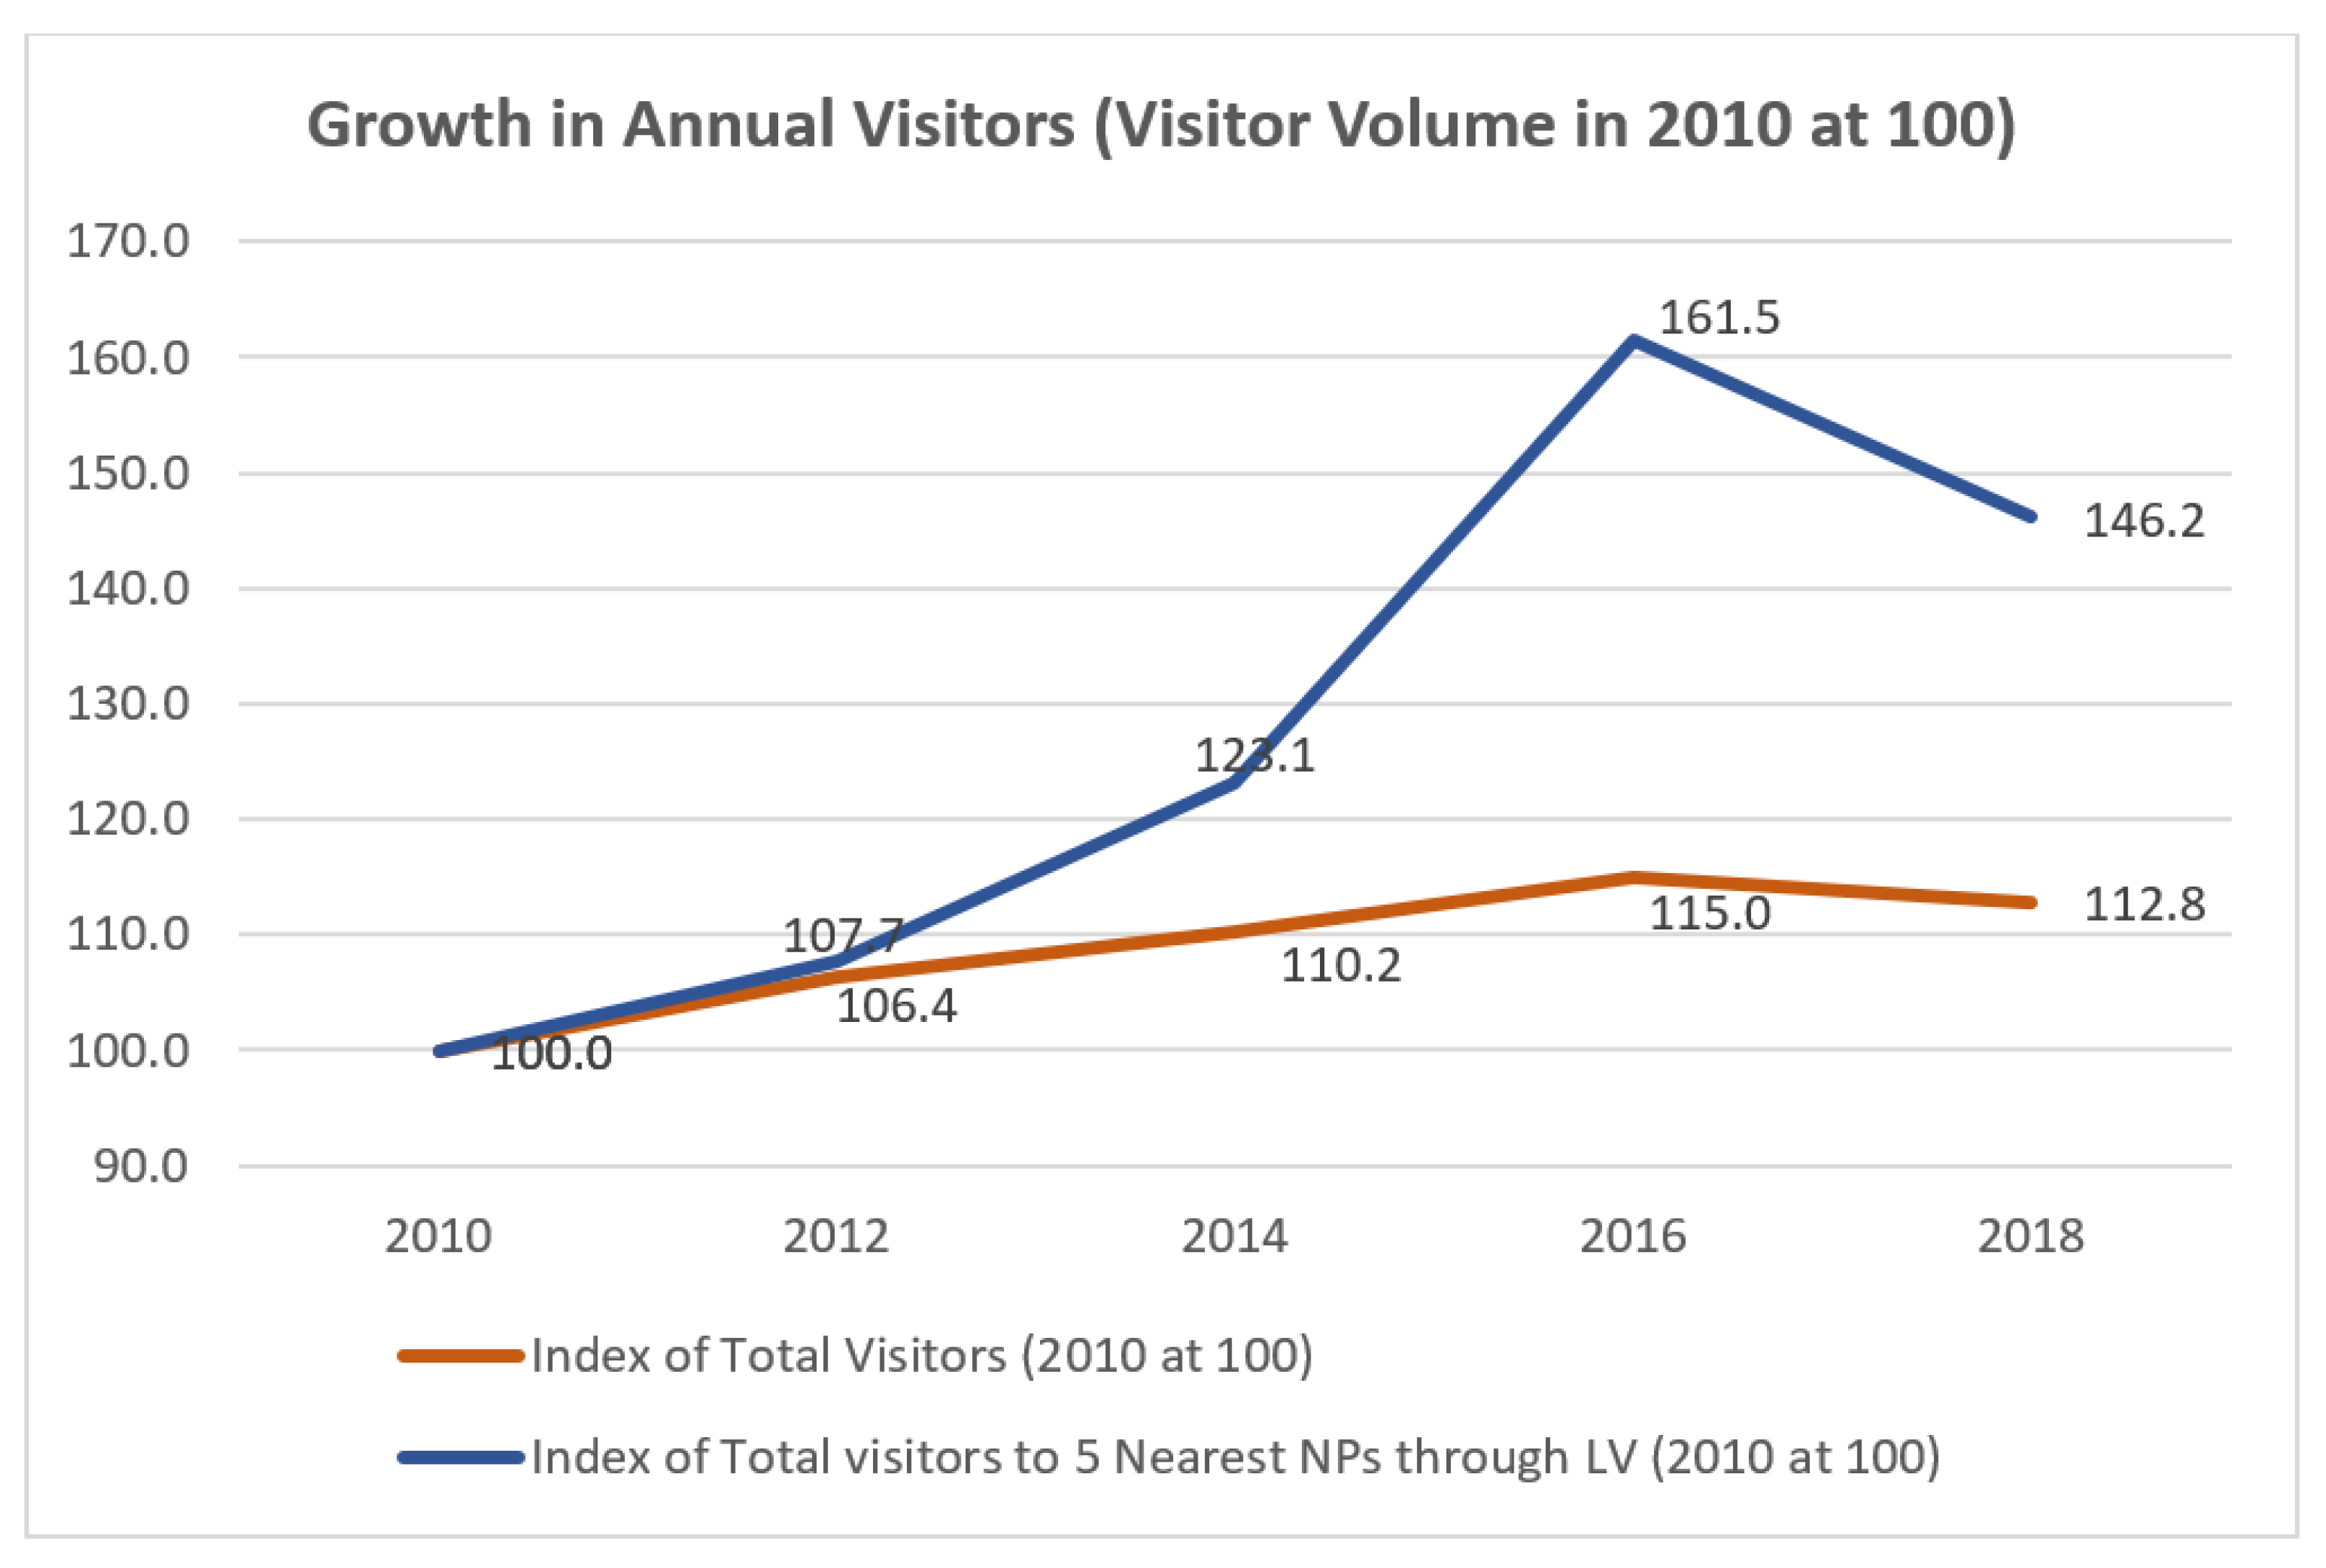
The share of national park visitors among the annual Las Vegas visitors appears to range from 21.3% in 2010 to 33.1% in 2018 (see
Figure 4). Furthermore, the average annual growth of the visitors to the five nearest national parks through Las Vegas between 2010 and 2018 grew at a faster rate of 18.3% compared to the annual growth of total visitors to Las Vegas at 14.1% (
Figure 5). This result demonstrates that a rising number of Las Vegas visitors tend to visit the nearby national parks over time; Las Vegas’ role as the center of our proposed Galaxy structure of a deconcentrated concentration in tourism has intensified over the same period.
5. Databases
We will now describe the empirical data shifts in tourists’ spatial choices in a hybrid (i.e., concentrated-deconcentrated) setting. The empirical experiment in this study estimates the monthly visitation to the eleven closest National Parks/Recreation Areas from Las Vegas Metropolitan Area. These national parks are managed by the NPS (National Park Services), a federal government agency established in 1916. These 11 national parks are located within approximately 7 h of driving distance from the Las Vegas Metro. The list of national parks/recreation areas is given in
Table 1.
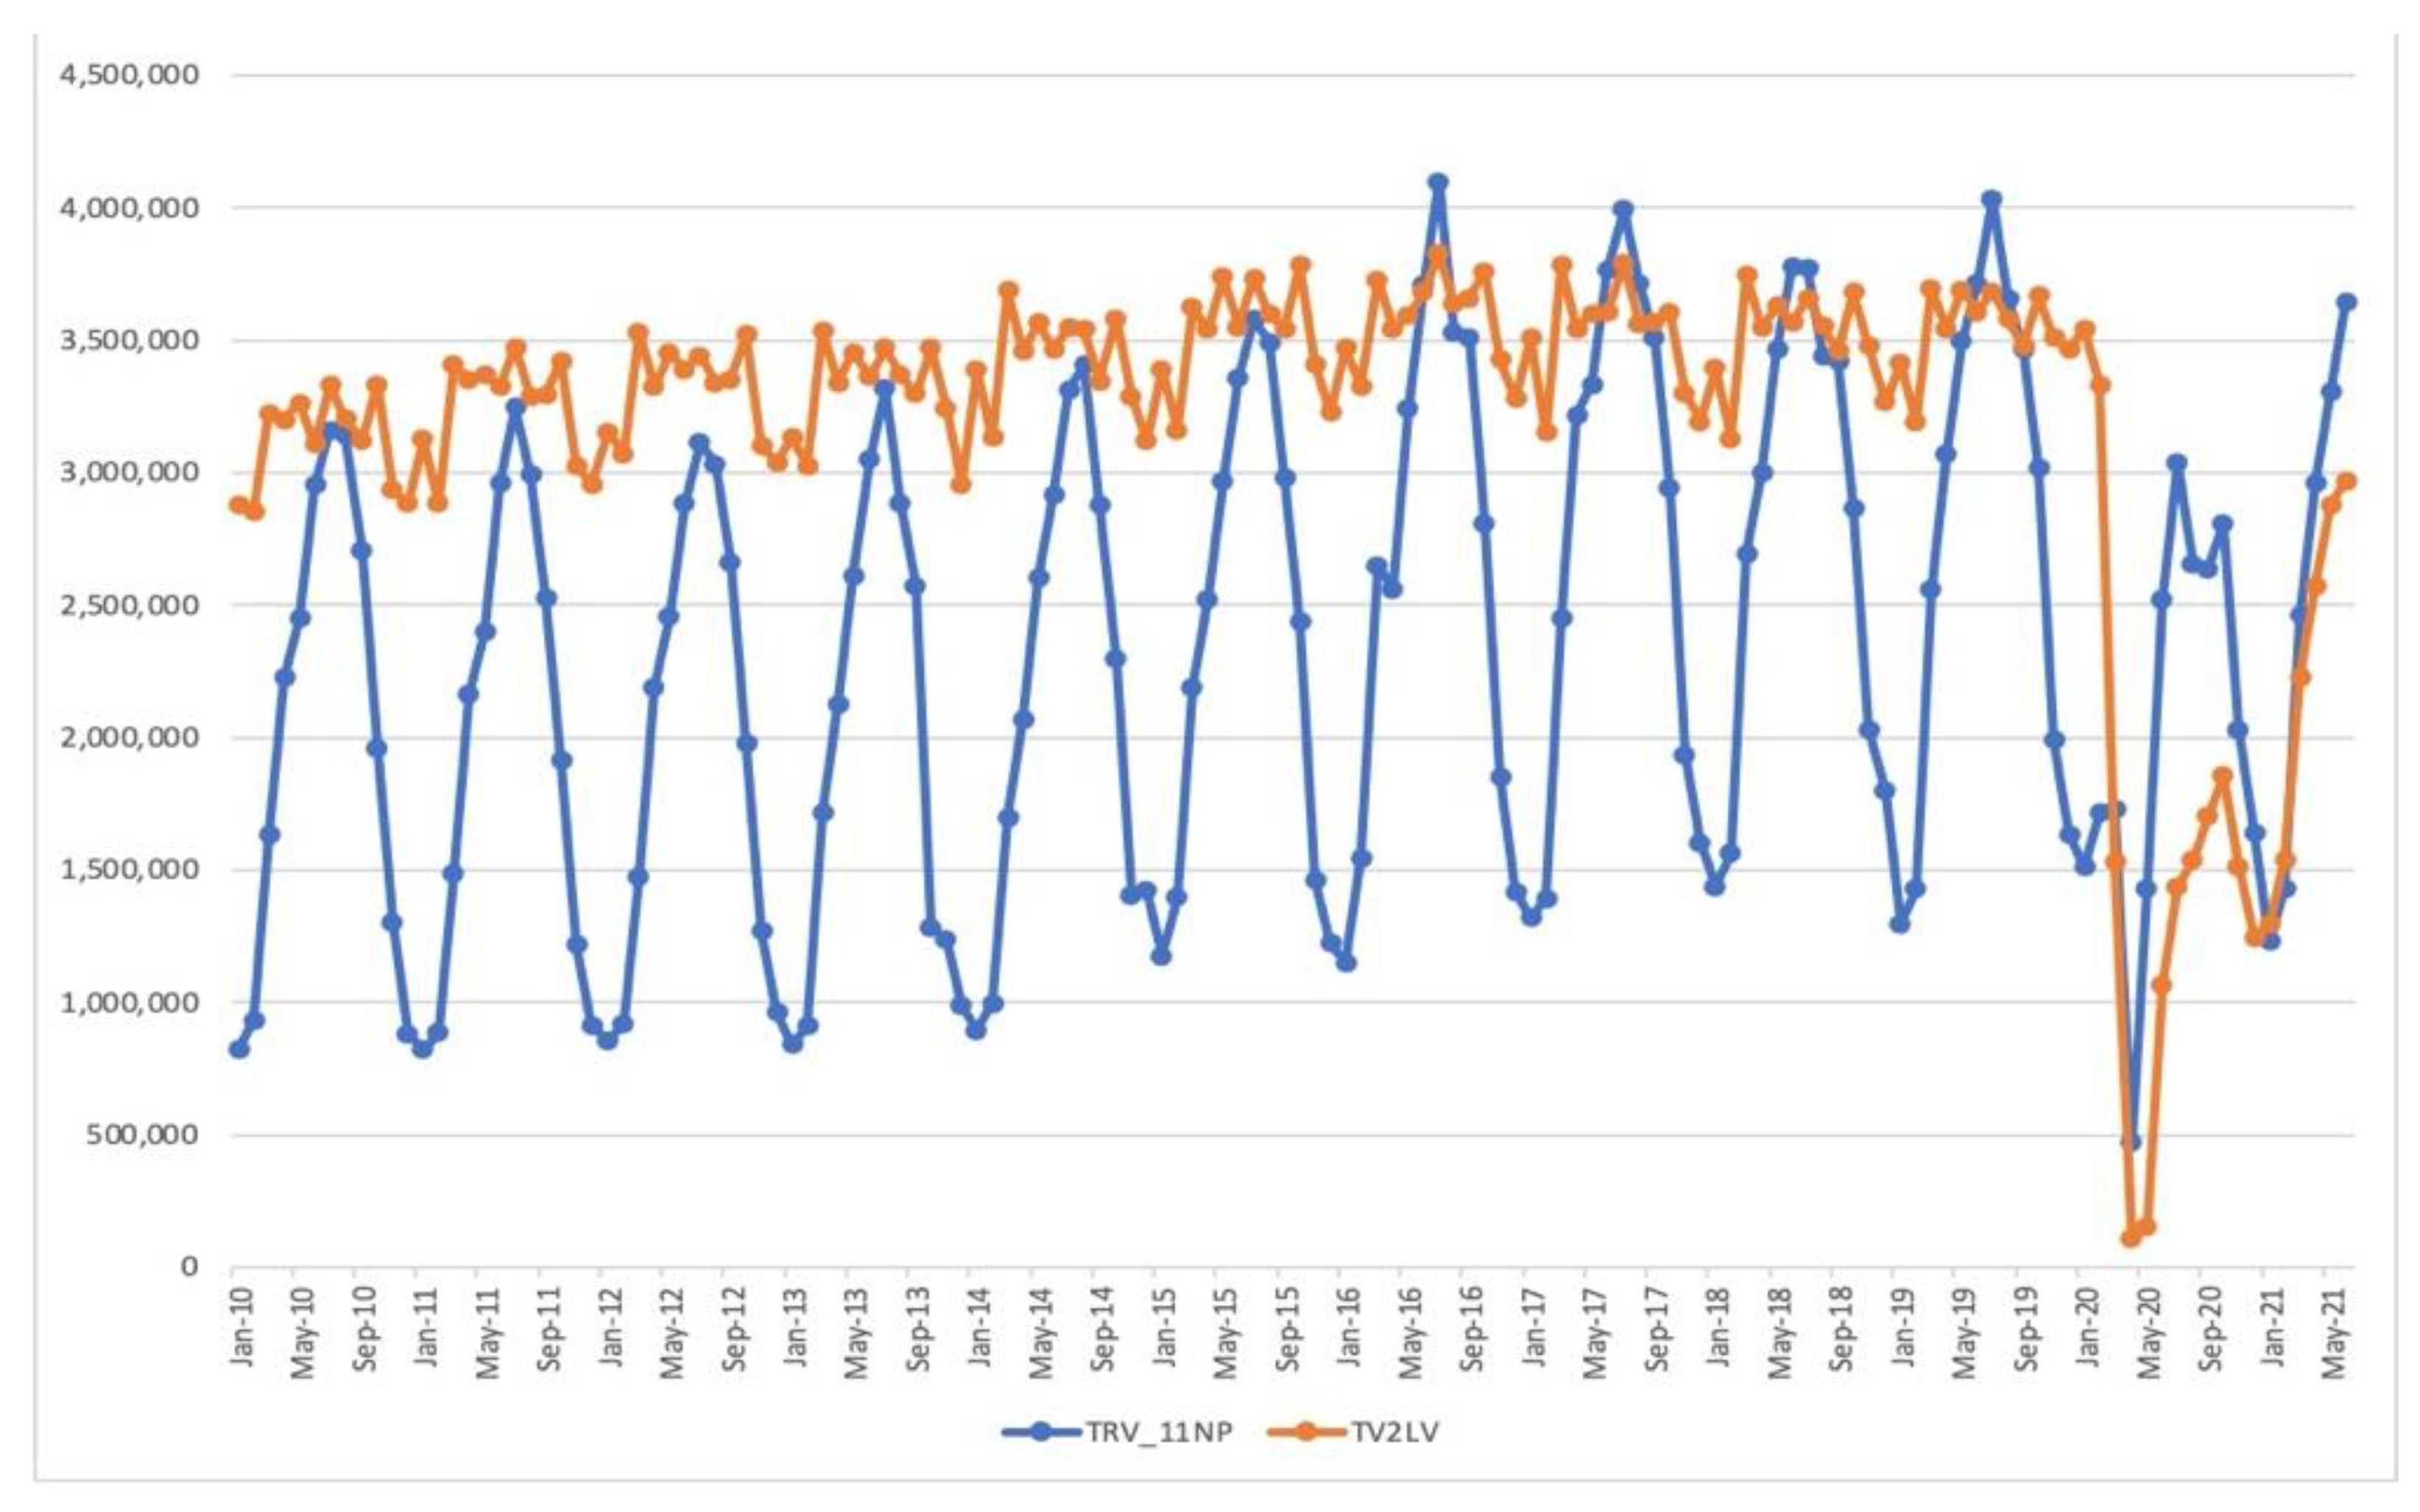
Prior to the COVID-19 pandemic, the total recreational (monthly) visitors to the 11 National Parks combined appeared to range from 820,000 in a low winter month to 4.1 million monthly visitors in a summer month with high demand for outdoor activities (see
Figure 6). The total volume of visitors in the pandemic dropped significantly to 470,000 monthly visitors in April 2020, but it rapidly returned to the comparable pre-pandemic visitation of over 3.6 million visitors in June 2021.
Two interesting findings in the comparison between visitors to Las Vegas and visitors to the 11 National Parks are (as shown in
Figure 1): (1) the fluctuation in the monthly visitors to the 11 national parks is more volatile compared to the fluctuation pattern in the monthly visitors to Las Vegas (which is much more stable over the months) and (2) the monthly visitor recovery in the second half of 2020 was much faster for the visitation to the 11 National Parks for outdoor activities than the visitation to Las Vegas itself.
As explained earlier, the primary analytical framework for this study considers four factors, including ‘COVID-19 Infections’, ‘Policy Responses in Pandemic’, ‘Vaccination’, and ‘Social Interaction.’ A key variable to study the outer-inner city complementary (or substitutes) is the ‘Gaming Revenue’ for Las Vegas hotels and resorts. Additionally, ‘Seasonality’ control variables are included for the empirical experiment in this study.
The temporal scale of the experiment is based on monthly data from January 2010 to June 2021. Among the 138 months, only the last 16 months are treated as a “pandemic” period (March 2020 through June 2021), whereas the remaining 122 months (January 2010 through February 2020) are treated as a “non-pandemic” period. The visitation data to national parks (and recreational areas) is available from NPS (National Park Service) Visitor Use Statistics (
https://irma.nps.gov/STATS/, accessed on 9 March 2022). Furthermore, this paper employs the historic monthly visitation data to Las Vegas and other variables, monthly gaming revenues for the Las Vegas gaming industry, and automobile traffic volume to Las Vegas on major highways (a proxy for ‘social interaction’ factor) published by LVCVA (Las Vegas Convention and Visitor Authority (
https://www.lvcva.com/research/, accessed on 9 March 2022)) for research purposes. The COVID-19 related data are available from COVID Data Tracker (
https://covid.cdc.gov/covid-data-tracker/#datatracker-home, accessed on 9 March 2022) from CDC (Center for Disease Control and Prevention), the national public health agency of the U.S. Federal government. The daily number of new cases and the number of tests are used to calculate the daily positivity rate in the U.S., while the vaccination rate variable in this study utilizes the share of the people who received at least one shot out of the total U.S. population. The variables listed in
Table 2 are developed for our empirical model specification using the raw data as explained above.
6. Modelling Experiments
In order to test our ‘deconcentrated tourism concentration’ hypothesis—based on the Galaxy structure in
Figure 1, this paper specified a linear regression model (OLS model) with 126 monthly visitors to the 11 nearest National Parks to Las Vegas within 460 miles (7.5 h of driving distance) as a dependent variable. The specified model tests the outer-inner city complementary (or substitutes) relation between “Outdoor Activities” in the 11 national parks and the “Gaming Industry” in Las Vegas, the gateway city to the 11 national parks for most visitors. Other variables include (1) COVID-19 infection (positivity rate) and vaccination (vaccination rate) variables; (2) policy response variable (Dummy for partial National Park closure); (3) social interaction variable (average daily traffic on major highways to/from Las Vegas Metro); (4) control variables for seasonality (AR (12), a Dummy for peak season, and a Dummy for winter).
where,
: monthly visitors to the 11 nearest National Parks to Las Vegas;
: constant term;
: coefficient vector (9 × 1 vector) to be estimated;
: iid error term;
: independent variable vector (9 × 1 vector), as listed in
Table 2.
Descriptive statistics are summarized in
Table 3. The average number of monthly visitors to the 11 National Parks (NPs) for the 126-month period (from January 2011 to June 2021) is 2,354,802 (2.355 million monthly visitors). In contrast, the average monthly visitors for the recent 42-month period (from January 2018 to June 2021) is 7.0% higher at 2,520,688 (2.521 million monthly visitors), even with the monthly average loss of 638,340 visitors during the COVID-19 pandemic (from March 2020 to June 2021) compared to the monthly visitation in 2019. The most significant net loss in the monthly visitation to the 11 NPs was found in April 2020, when nine NPs were either partially or fully closed, followed by May 2020 and June 2020 when the fully or partially closed NPs started to open again to the public. The average monthly gaming revenue in Las Vegas for the 126 months (from January 2011 to June 2021) is
$788,771,825 (
$788.8 million monthly revenue from gaming activities in Las Vegas). In contrast, the average monthly gaming revenue for the recent 42-month period (from January 2018 to June 2021) is 2.7% lower at
$767,209,929 (
$767.2 million monthly revenue from gaming activities in Las Vegas), with the monthly average loss of
$364.0 million gaming revenue for the 12 consecutive months during the COVID-19 pandemic (from March 2020 to February 2021) compared to the monthly revenues in 2019. The most significant net loss in the gaming revenue in Las Vegas was found in May 2020, when all casinos were fully closed by the Nevada Governor’s order, followed by April 2020 (another month with all casinos fully shutdown) and June 2020 when the casinos in Las Vegas started to open partially.
7. Empirical Results and Interpretation
The coefficient estimation result of the specified OLS model in
Table 4 reveals some interesting stories about the outer-inner city complementary (or substitute) relation between “Outdoor Activities” in the 11 national parks and “Gaming Industry” in Las Vegas. Furthermore, the estimation results show the effects of four other critical factors under consideration in this study: ‘COVID-19 Infections’, ‘Policy Responses to Pandemic’, ‘Vaccination Trajectories’, and ‘Social Interaction.’
The coefficient of the key variable for the outer-inner city complementary relation, i.e., “ln.Gaming_Rev_LV”, is 0.132 and statistically significant at 0.1%-level. A 1% increase of monthly gaming revenue in Las Vegas for the entire 126-month study period (roughly $7.887 million) increased the monthly visitation to the 11 NPs by 0.132% (roughly 3109 more visitors per month). This finding proves the presence of the outer-inner city complementary relation between “Outdoor Activities” in the 11 national parks and the “Gaming Industry” in Las Vegas for the entire 126-month study period. However, this complementarity relation was not found in the pandemic period for the 16-month period (from March 2020 to June 2021). The coefficient for “CV_D_ln.GRev” is negative (−0.01) and statistically significant only at 10%-level. This indicates the presence of substitution effects between the inner-city tourism resources in Las Vegas and the outer-city tourism resources among the 11 national parks. A possible explanation can be that, in contrast to the pre-pandemic period, the visitors to the inner-city (Las Vegas) had substituted the indoor gaming (gamble) activities for outdoor tourism resources (national parks for outdoor activities) in the outer-city. The visitors to the 11 national parks did not spend enough time indoor gaming activities in Las Vegas (inner-city); instead, they bypassed it for healthier outdoor activities with a low risk of exposure to COVID-19. As a result, the complementary relation for all time periods turned into a substitution relation trading the indoor gaming for the outdoor activities in national parks.
Among the COVID-19 pandemic factors, the coefficient for “Pos_Rate” appears to be positive, unlike the expectation, at 1.228 but not significant at a 5%-level. Though not significant, the coefficient may indicate that an increased positivity rate of COVID-19 tests in the U.S. may make people seek safer and healthier outdoor activities (e.g., visiting the 11 NPs). However, the positive (or encouraging) marginal effect (for the outdoor activities) of the increased risk from COVID-19 was not strong enough due to the uncertainty in the pandemic. How one recognizes the trade-off between benefit from outdoor activities in pandemic and cost of potential exposure to risks may vary significantly by individuals. On the other hand, the coefficient for “Vacc_1_Rate” is 0.507 and statistically significant at 10%-level. A 1% increase in vaccination rates (the % share of people who received at least one shot out of the total U.S. population) for the entire 126-month study period (roughly 3.3 million more people becoming vaccinated in the U.S.) increased the monthly visitation to the 11 NPs by 0.507% (roughly 11,939 more visitors per month). This shows the positive marginal effect of increased vaccination rates on the national park visitations. More people might have felt more comfortable and safer for open outdoor activities with the increasing vaccinations in the USA.
The policy variable against the COVID-19 pandemic in this study is a dummy for national park closures. If there have been any partial closures among these national parks, it will have a value of one for the dummy, otherwise zero. Unlike our expectation, the coefficient for “NP_P_Csd”, the dummy for partial park closures, is positive, at 0.159, but statistically not significant at a 5%-level. Only five national parks have been completely shut down, while four other national parks had partial closures that mainly limited the total number of visitors. However, out of 126 months in this study, the partial closures happened for only three months (March 2020 to May 2020). Consequently, policy measures that limit the visitation to national parks do not show the negative (or discouraging) marginal effect on the National Park visitations (Outdoor activities).
Increased social interaction proxied by the monthly traffic volume to Las Vegas through major highways strongly impacts national park visitations. The coefficient for “ln.AutoMH_AVG” is 1.477 and statistically significant at a 0.1%-level. A 1% increase of average daily traffic from/to Las Vegas via major highways (indicator for social interaction through traffic flows) for the 126-month study period (roughly 1100 more vehicles from/to Las Vegas via major highways) increased the monthly visitation to the 11 NPs by 1.477% (roughly 34,780 more visitors per month). This proves that Las Vegas serves as a gateway city (inner) to these national parks (outer areas for outdoor activities). The social interaction (or regional interaction) proxied by the traffic volume indicates the complementary (substitute) relation between the visitation to (or possibly through) the gateway city, Las Vegas, and the outer national parks.
Among the seasonality control variables, two variables, “Winter” and “AR_12”, are statistically significant with expected signs. The coefficient for “Winter” is −0.252 and statistically significant at a 0.1%-level, indicating that compared to the non-winter season, the monthly visitation to the 11 NPs is lower by 0.252%. That is, roughly 5934 fewer monthly visitors in the winter season (December through February) than in the non-winter nine months (March through November). Additionally, the coefficient for “AR_12” is 0.323 and statistically significant at a 0.1%-level. This is an autoregressive term to control positive serial autocorrelation. A 1% increase of monthly visitation in the same month a year ago increased the monthly visitation to the 11 NPs by 0.323% (roughly 7606 more visitors per month). This is evidence for the presence of strong and positive serial autocorrelation in the National Park visitations (Outdoor activities). Additionally, a dummy for peak months (May through September), “Peak_S”, shows the significant marginal effect with an expected positive sign.
The proposed model is parsimonious, and it performs relatively well with the adjusted R-square of 0.923, while the Durbin-Watson improved to 1.644 after controlling for the serial autocorrelation with the autoregressive term (
Table 5). The F-test in the ANOVA table is significant at 1%, implying the joint-significance of the specified model (
Table 6). As listed in the coefficient table, the Variance of Inflation Factor (VIF) values for all the independent variables are all less than 10, showing no serious multicollinearity issue in the specified model.
8. Conclusions
The present study aimed to test the newly proposed ‘deconcentrated tourism concentration’ hypothesis, described with the ‘Galaxy structure’ in
Figure 1. The empirical experiment for the outer-inner city complementarity (or substitution) relation between “Outdoor Activities” in the 11 national parks and “Gaming Industry” in Las Vegas confirms that pre-pandemic complementarity relations became weakened in the COVID-19 pandemic period and transformed into substitution relations. Findings in our study support this evolving tourism trend influenced by the real or perceived health risk during the COVID-19 pandemic. Therefore, our empirical model corroborates that the COVID-19 pandemic is substantially and structurally influencing tourism decisions with different forms of preferred tourism behaviors ranging from avoiding crowded urban agglomerations or mass tourism in crowded resorts to substituting shared accommodation facilities (e.g., hotels) for individualized accommodation types (e.g., individual apartments) or to more subtle forms of nature tourism.
For an urban (metro) tourism destination such as Las Vegas, this can be challenging, at least in the short run, due to centrifugal forces during its post-COVID recovery period. However, as the empirical model estimation results indicate, both centripetal and centrifugal forces do exist and have interacted, especially in the pre-pandemic period. The outer-inner city complementary relation between “Outdoor Activities” in the 11 national parks and the “Gaming Industry” in Las Vegas provides an opportunity for Las Vegas, an excellent example of a tourism destination with well-developed geographic connectivity (or accessibility) to surrounding extra-urban destinations. Moreover, the substitution effect found during the COVID-19 pandemic can provide critical guidelines about how the tourism industry should be restructured or reshaped to enhance resilience against unexpected and unprepared events. Facing another unexpected and unprepared event such as COVID-19, the tourism industry in a given urban (metro) destination should be ready to accommodate the shifting trend in tourism demand.
Our paper shows how tourism infrastructure in Las Vegas acts as an attraction force for visitors who wish to enjoy social capital and urban ambiance in the city. In the light of COVID-19, a dichotomy has arisen between dense tourism concentrations in the city and the need for a healthy relaxed environment. As a consequence, a mixed pattern of partly a tourism concentration and partly a tourism dispersion to natural parks has arisen. As a final result, Las Vegas has still kept its attraction force on a resilience trajectory, but in a different form compared to the pre-COVID times.
The evidence in this study supports that a new form of tourist behavior is gaining importance, viz. the emergence of the new ‘post-COVID reality’ mixed types of tourism in the form of a spatial spread of tourists around major accessible tourist destinations showing a galaxy structure. However, the findings in this study need further investigation since this newly emerging trend can last for a relatively short period as a temporary trend only in the middle of a crisis. On the contrary, the new trend can also become a permanent game-changer in the long run. The future direction of this study is in line with how the interaction between the centripetal and centrifugal forces evolves in post-COVID recovery times, within the framework of the proposed new trend of ‘deconcentrated tourism concentration’. Our research also confirms the relevance of health considerations in the context of sustainable development of cities and regions.


