
The Impact of Nomophobia, Stress, and Loneliness on Smartphone Addiction among Young Adults during and after the COVID-19 Pandemic: An Israeli Case Analysis


Abstract
:1. Introduction
2. Conceptual Framework—Literature Review
2.1. Psychological Influences
- Loneliness: Loneliness is defined as one of the most prevalent global problems for adults. It is considered a “pervasive and adverse psychological state with the feeling of emotional isolation state of being alone and separation from others” ([20], p. 1). Such feeling may lead to increased mortality and other health risks [21]. For example, loneliness is linked to clinical diseases such as stroke and cardiovascular illness, and it is also a predictor of psychological symptoms such as depression, stress, and anxiety [22]. People who feel lonely have been found to be more likely to use their smartphones in an extreme manner for social purposes, tending to use social media platforms in a way akin to an addictive behavior [23,24]. However, several studies (e. g., Skues et al. [25]) have found that loneliness is not a significant predictor of PSU. Therefore, such association requires further exploration.
- Stress: The first attempt to define stress occurred in 1859 by Claude Bernard [26]. Many years later in 1926, Walter Bradford Cannon [27] defined stress as a condition in which an organism reacts to threat in a way that impairs its homeostatic equilibrium [28]. According to DSM-5, stress is defined by two disorders: acute stress disorder and posttraumatic stress disorder. Acute stress, where a subject experiences trauma during or after an event, is associated with a sense of numbing and a reduction in awareness of surroundings, which often lead to impairment in social interactions. Already in 1984, Lazarus and Folkman [29] distinguished between two types of coping strategies that subjects typically used to manage stress: 1. Focus on the problem (e.g., seeking health-related information relevant to their stress) and 2. Emotionally focused coping (e.g., venting emotions to manage their mood and joining social support communities). Recently, another study, conducted by Zhao and Zhou [15], showed the same phenomenon: people who experienced stress during the COVID-19 pandemic tended to be more active on social media communities and were at high risk for technology addiction. Similarly, Gao et al. [30] showed that individuals who lose control of their emotional cognizance may express a weakened emotional adjustment that might result in them not being able to cope with difficult and stressful situations. This may not only exacerbate their negative emotions but also increase the likelihood of them developing a severe addiction to their mobile phones.
- Nomophobia: By 2013, nomophobia was already considered a modern disorder [31]. Yildirim and Correia [18] described it as a phenomenon whose dimensions include being anxious about losing communication with others, not being able to access to information through their phones, and not having the convenience of access to smartphone applications. Later, Bhattacharya et al. [32] defined nomophobia as a psychological condition where “people are afraid of being detached from mobile phone connectivity” ([32], p. 1297). This definition has been proposed for inclusion as a psychological disorder in the fifth edition of the American Diagnostic and Statistical Manual of Mental Disorders (DSM-5) [33].
2.2. Behavioral Influences
- Desire to belong to a social community: social media plays a useful role in interpersonal communication. The need to make social media accessible to more people and enhance their user experience influenced the design of such applications, especially on mobile phones, such that due to instant rewards (likes and re-tweets), these social platforms become more addictive [34].
- Lack of a sufficient number of sleep hours: The need for a sufficient number of sleep hours has already been shown to be of great importance to optimal health and wellbeing [35]. Not getting enough sleep hours may lead to changes in behavior [36] and is associated with attention problems, poor academic performance, daytime fatigue, depression, and obesity [37]. The literature includes many studies that explore the different aspects related to the quality of sleep hours and its connection to technology usage. Hasanzade [38], for example, found that pathological, excessive use of the Internet is correlated with an insufficient number of sleep hours.The combination of the described psychological and behavioral manifestations has been found to be related to PSU and to take the form of the following addictive behaviors:
- 3.
- PSU and smartphone addiction: Smart mobile phones, also known as smartphones, have quickly become a staple of daily life for many people, especially among younger people, who were found to be more dependent on them. This dependency has led to a new phenomenon: smartphone addiction. This addiction, in general, refers to a situation of uncontrolled and excessive use of a smartphone. For example, Tateno et al. [39] found that in Japan, young people have their smartphones within reach almost all day, and the frequency of using them for Internet browsing and connecting to others is continuously increasing. This is also the case globally and is expected to continue. While other studies [40,41,42] have found differences between genders when it comes to problematic Internet and smartphone use, both men and women who suffer from low self-esteem, loneliness, depression, interpersonal anxiety, and tend not to belong to social groups exhibit a high level of dependency on their smartphones [43]. Another study conducted by Arpaci [44], which aimed to examine the relationship between social anxiety, smartphone use, a tendency toward trust, and problematic smartphone use showed that smartphone users who tend to rely on others exhibit a high level of problematic smartphone use.
3. Materials and Methods
3.1. Subjects and Sample
3.2. Instruments and Measures
3.3. Procedure and Data Analysis
4. Results
4.1. Correlation Analysis
4.2. T-Test Analysis
4.3. Multiple Hierarchical Regression
4.4. Mediation Effect Analysis
5. Discussion
6. Conclusions
7. Limitations and Further Research
Funding
Institutional Review Board Statement
Informed Consent Statement
Data Availability Statement
Conflicts of Interest
Appendix A

| Variables | Cronbach Alpha | Mean | s.d. | 1 | 2 | 3 | 4 | 5 | 6 |
|---|---|---|---|---|---|---|---|---|---|
| 1. Loneliness | 0.84 | 4.24 | 0.68 | 1 | |||||
| 2. Social Affiliation | 0.71 | 2.27 | 0.73 | 0.075 | 1 | ||||
| 3. PSU | 0.75 | 3.03 | 0.72 | 0.103 | 0.488 ** | 1 | |||
| 4. Stress | 0.78 | 2.83 | 0.53 | −2.39 ** | 0.213 ** | 0.257 ** | 1 | ||
| 5. Sleep Hours | 0.68 | 2.51 | 0.82 | −0.163 * | 0.427 ** | 0.210 ** | 0.375 ** | 1 | |
| 6. Nomophobia | 0.72 | 2.91 | 0.73 | 0.048 | 0.462 ** | 0.605 ** | 0.223 ** | 0.277 ** | 1 |
| Variables | Cronbach Alpha | Mean | s.d. | 1 | 2 | 3 | 4 | 5 | 6 |
|---|---|---|---|---|---|---|---|---|---|
| 1. Loneliness | 0.83 | 4.16 | 0.67 | 1 | |||||
| 2. Social Affiliation | 0.81 | 2.21 | 0.79 | −0.048 | 1 | ||||
| 3. PSU | 0.74 | 2.85 | 0.76 | 0.021 | 0.595 ** | 1 | |||
| 4. Stress | 0.77 | 2.64 | 0.73 | −0.233 ** | 0.187 ** | 0.198 ** | 1 | ||
| 5. Sleep Hours | 0.74 | 2.74 | 0.56 | −0.292 ** | 0.478 ** | 0.369 ** | 0.374 ** | 1 | |
| 6. Nomophobia | 0.78 | 2.96 | 0.76 | 0.041 | 0.442 ** | 0.652 ** | 0.222 ** | 0.296 ** | 1 |
| Variable Name | T1 | T2 |
|---|---|---|
| Loneliness | −0.060 | 0.019 |
| Stress | 0.099 ** | 0.021 |
| Sleep Hours | −0.738 | 0.057 |
| Nomophobia | 0.482 ** | 0.484 ** |
| Social Affiliation | 0.265 ** | 0.381 ** |
| R2 | 0.421 | 0.537 |
| F | 18.431 | 49.457 |
| Std, E | 0.665 | 0.625 |
References
- Menon, D.; Korkut, S.; Inglese, T.; Dornberger, R. Using Mobile Sensing on Smartphones for the Management of daily Life Tasks. In New Trends in Business Information Systems and Technology; Dornberger, R., Ed.; Springer: Berlin/Heidelberg, Germany, 2021; pp. 63–79. [Google Scholar]
- Khan, N.A.; Khan, A.N.; Moin, M.F. Self-regulation and social media addiction: A multi-wave data analysis in China. Technol. Soc. 2021, 64, 101527. [Google Scholar] [CrossRef]
- Katz, J.E.; Aakhus, M. (Eds.) Perpetual Contact: Mobile Communication, Private Talk, Public Performance; Cambridge University Press: Cambridge, UK, 2002. [Google Scholar]
- Katz, J.E. 32 Mainstreamed mobiles in daily life: Perspectives and prospects. In Handbook of Mobile Communication Studies; The MIT Press: Cambridge, MA, USA, 2008; pp. 433–445. [Google Scholar] [CrossRef]
- Dalvi-Esfahani, M.; Niknafs, A.; Alaedini, Z.; Ahmadabadi, H.B.; Kuss, D.J.; Ramayah, T. Social media addiction and empathy: Moderating impact of personality traits among high school students. Telemat. Inform. 2021, 57, 101516. [Google Scholar] [CrossRef]
- Dhaliwal, R.K.; Joshi, V. Mobile phones-boon to rural social system. Lit. Inf. Comput. Educ. J. 2010, 1, 261–265. [Google Scholar] [CrossRef]
- Ramjan, L.M.; Salamonson, Y.; Batt, S.; Kong, A.; McGrath, B.; Richards, G.; Crawford, R. The negative impact of smartphone usage on nursing students: An integrative literature review. Nurse Educ. Today 2021, 102, 104909. [Google Scholar] [CrossRef]
- Sumuer, E. The effect of mobile phone usage policy on college students’ learning. J. Comput. High. Educ. 2021, 33, 281–295. [Google Scholar] [CrossRef]
- Chiang, K.F.; Wang, H.H.; Hsieh, H.F. Factors influencing the mobile instant messaging application usage behaviours among home healthcare providers. J. Clin. Nurs. 2021, 30, 3577–3589. [Google Scholar] [CrossRef]
- Grīnberga, S.; Fazal, A.S. Negative Effects of Cell Phones on Human Health. 2021. Available online: https://dspace.rsu.lv/jspui/handle/123456789/4394 (accessed on 26 January 2022).
- Seo, M.; Kim, J.H.; David, P. Always connected or always distracted? ADHD symptoms and social assurance explain problematic use of mobile phone and multicommunicating. J. Comput.-Mediat. Commun. 2015, 20, 667–681. [Google Scholar] [CrossRef] [Green Version]
- Panova, T.; Carbonell, X. Is smartphone addiction really an addiction? J. Behav. Addict. 2018, 7, 252–259. [Google Scholar] [CrossRef]
- Bounie, D.; Camara, Y.; Galbraith, J.W. Consumers’ Mobility, Expenditure and Online-Offline Substitution Response to COVID-19: Evidence from French Transaction Data. SSRN. 2020. Available online: https://ssrn.com/abstract=3588373 (accessed on 27 January 2021).
- Carvalho, V.M.; Hansen, S.; Ortiz, A.; Garcia, J.R.; Rodrigo, T.; Mora, S.R.; de Aguirre, P.R. Tracking the COVID-19 Crisis with High-Resolution Transaction Data; No 14642, CEPR Discussion Papers; The Royal Society: London, UK, 2020. [Google Scholar]
- Zhao, N.; Zhou, G. COVID-19 stress and addictive social media use (SMU): Mediating role of active use and social media flow. Front. Psychiatry 2021, 12, 85. [Google Scholar] [CrossRef]
- Kumar, V.A.; Chandrasekaran, V.; Brahadeeswari, H. Prevalence of smartphone addiction and its effects on sleep quality: A cross-sectional study among medical students. Ind. Psychiatry J. 2019, 28, 82. [Google Scholar]
- Zhang, M.X.; Wu, A.M. Effects of smartphone addiction on sleep quality among Chinese university students: The mediating role of self-regulation and bedtime procrastination. Addict. Behav. 2020, 111, 106552. [Google Scholar] [CrossRef] [PubMed]
- Yildirim, C.; Correia, A.P. Exploring the dimensions of nomophobia: Development and validation of a self-reported questionnaire. Comput. Hum. Behav. 2015, 49, 130–137. [Google Scholar] [CrossRef]
- Jin, L.; Hao, Z.; Huang, J.; Akram, H.R.; Saeed, M.F.; Ma, H. Depression and anxiety symptoms are associated with problematic smartphone use under the COVID-19 epidemic: The mediation models. Child. Youth Serv. Rev. 2021, 121, 105875. [Google Scholar] [CrossRef]
- Cao, Q.; An, J.; Yang, Y.; Peng, P.; Xu, S.; Xu, X.; Xiang, H. Correlation among psychological resilience, loneliness, and internet addiction among left-behind children in China: A cross-sectional study. Curr. Psychol. 2020, 1–8. [Google Scholar] [CrossRef]
- Eslinger, P.J.; Anders, S.; Ballarini, T.; Boutros, S.; Krach, S.; Mayer, A.V.; Zahn, R. The neuroscience of social feelings: Mechanisms of adaptive social functioning. Neurosci. Biobehav. Rev. 2021, 128, 592–620. [Google Scholar] [CrossRef]
- Yanguas, J.; Pinazo-Henandis, S.; Tarazona-Santabalbina, F.J. The complexity of loneliness. Acta Bio Med. Atenei Parm. 2018, 89, 302. [Google Scholar]
- Enez Darcin, A.; Kose, S.; Noyan, C.O.; Nurmedov, S.; Yılmaz, O.; Dilbaz, N. Smartphone addiction and its relationship with social anxiety and loneliness. Behav. Inf. Technol. 2016, 35, 520–525. [Google Scholar] [CrossRef]
- Kim, J.; LaRose, R.; Peng, W. Loneliness as the cause and the effect of problematic Internet use: The relationship between Internet use and psychological well-being. Cyberpsychol. Behav. 2009, 12, 451–455. [Google Scholar] [CrossRef] [Green Version]
- Skues, J.; Williams, B.; Oldmeadow, J.; Wise, L. The effects of boredom, loneliness, and distress tolerance on problem internet use among university students. Int. J. Ment. Health Addict. 2016, 14, 167–180. [Google Scholar] [CrossRef]
- Fink, G. Stress: Definition and history. Stress Sci. Neuroendocrinol. 2010, 3, 3–9. [Google Scholar] [CrossRef]
- Cannon, W.B.; Pettit, A. Physiological regulation of normal states: Some tentative postulates concerning biological homeostatics. In À Charles Richet, ses Amis, ses Colleègues, ses Èleèves [to Charles Richet and His Friends, Colleagues, and Scholars]; Les Editions Mèdicales: Paris, France, 1926; pp. 91–93. [Google Scholar]
- Fink, G. (Ed.) Stress: Concepts, Cognition, Emotion, and Behavior: Handbook of Stress Series; Academic Press: Cambridge, MA, USA, 2016; Volume 1. [Google Scholar]
- Lazarus, R.S.; Folkman, S. Stress, Appraisal, and Coping; Springer: Berlin/Heidelberg, Germany, 1984. [Google Scholar]
- Gao, T.; Li, J.; Zhang, H.; Gao, J.; Kong, Y.; Hu, Y.; Mei, S. The influence of alexithymia on mobile phone addiction: The role of depression, anxiety and stress. J. Affect. Disord. 2018, 225, 761–766. [Google Scholar] [CrossRef] [PubMed]
- King, A.L.S.; Valenca, A.M.; Silva, A.C.O.; Baczynski, T.; Carvalho, M.R.; Nardi, A.E. Nomophobia: Dependency on virtual environments or social phobia? Comput. Hum. Behav. 2013, 29, 140–144. [Google Scholar] [CrossRef]
- Bhattacharya, S.; Bashar, M.A.; Srivastava, A.; Singh, A. Nomophobia: No mobile phone phobia. J. Fam. Med. Prim. Care 2019, 8, 1297. [Google Scholar] [CrossRef] [PubMed]
- Bragazzi, N.L.; Del Puente, G. A proposal for including nomophobia in the new DSM-V. Psychol. Res. Behav. Manag. 2014, 7, 155. [Google Scholar] [CrossRef] [Green Version]
- Wiederhold, B.K. Using social media to our advantage: Alleviating anxiety during a pandemic. Cyberpsychol. Behav. Soc. Netw. 2020, 23, 197–198. [Google Scholar] [CrossRef] [Green Version]
- Mosavi, F.; Golestan, B.; Matini, E. Studying the prevalence of sleep disorders and its related factors in student of Tehran Azad University. Med. Sci. Azad. Univ. 2010, 20, 278–285. [Google Scholar]
- Aghajanloo, A.; Haririan, H.; Ghafourifard, M.; Bagheri, H.; Ebrahimi, S.M. Sleep quality of students during final exams in Zanjan University of Medical Sciences. Mod. Care J. 2011, 8, 230–237. [Google Scholar]
- van den Eijnden, R.J.; Geurts, S.M.; Ter Bogt, T.F.; van der Rijst, V.G.; Koning, M. Social media use and adolescents’ sleep: A longitudinal study on the protective role of parental rules regarding internet use before sleep. Int. J. Environ. Res. Public Health 2021, 18, 1346. [Google Scholar] [CrossRef]
- Hasanzade, R. Internet addiction in students, a threat to psychological health. Well-Being Syst. 2009, 1, 1–8. [Google Scholar]
- Tateno, M.; Kim, D.-J.; Teo, A.; Skokauskas, N.; Guerrero, A.P.S.; Kato, T.A. Smartphone Addiction in Japanese College Students: Usefulness of the Japanese Version of the Smartphone Addiction Scale as a Screening Tool for a New Form of Internet Addiction. Psychiatry Investig. 2019, 16, 115–120. [Google Scholar] [CrossRef] [Green Version]
- Lachmann, B.; Sariyska, R.; Kannen, C.; Cooper, A.; Montag, C. Life satisfaction and problematic Internet use: Evidence for gender specific effects. Psychiatry Res. 2016, 238, 363–367. [Google Scholar] [CrossRef] [PubMed]
- Elhai, J.D.; Contractor, A.A. Examining latent classes of smartphone users: Relations with psychopathology and problematic smartphone use. Comput. Hum. Behav. 2018, 82, 159–166. [Google Scholar] [CrossRef]
- Wolniewicz, C.A.; Tiamiyu, M.F.; Weeks, J.W.; Elhai, J.D. Problematic smartphone use and relations with negative affect, fear of missing out, and fear of negative and positive evaluation. Psychiatry Res. 2018, 262, 618–623. [Google Scholar] [CrossRef]
- Kim, E.; Koh, E. Avoidant attachment and smartphone addiction in college students: The mediating effects of anxiety and self-esteem. Comput. Hum. Behav. 2018, 84, 264–271. [Google Scholar] [CrossRef]
- Arpaci, I. Gender differences in the relationship between problematic internet use and nomophobia. Curr. Psychol. 2020, 1–10. [Google Scholar] [CrossRef]
- Csibi, S.; Griffiths, M.D.; Demetrovics, Z.; Szabo, A. Analysis of Problematic Smartphone Use Across Different Age Groups within the ‘Components Model of Addiction’. Int. J. Ment. Health Addict. 2021, 19, 616–631. [Google Scholar] [CrossRef] [Green Version]
- Al-Saggaf, Y.; O’Donnell, S.B. Phubbing: Perceptions, reasons behind, predictors, and impacts. Hum. Behav. Emerg. Technol. 2019, 1, 132–140. [Google Scholar] [CrossRef] [Green Version]
- Niu, G.; Yao, L.; Wu, L.; Tian, Y.; Xu, L.; Sun, X. Parental phubbing and adolescent problematic mobile phone use: The role of parent-child relationship and self-control. Child. Youth Serv. Rev. 2020, 116, 105247. [Google Scholar] [CrossRef]
- Russell, D.; Peplau, L.A.; Cutrona, C.E. The revised UCLA Loneliness Scale: Concurrent and discriminant validity evidence. J. Personal. Soc. Psychol. 1980, 39, 472. [Google Scholar] [CrossRef]
- Dufner, M.; Arslan, R.C.; Hagemeyer, B.; Schönbrodt, F.D.; Denissen, J.J.A. Affective contingencies in the affiliative domain: Physiological assessment, associations with the affiliation motive, and prediction of behavior. J. Personal. Soc. Psychol. 2015, 109, 662–676. [Google Scholar] [CrossRef] [Green Version]
- Cohen, S.; Kamarck, T.; Mermelstein, R. A global measure of perceived stress. J. Health Soc. Behav. 1983, 24, 385–396. [Google Scholar] [CrossRef] [PubMed]
- Tremblay, M.S.; Carson, V.; Chaput, J.-P.; Gorber, S.C.; Dinh, T.; Duggan, M.; Faulkner, G.; Gray, C.E.; Gruber, R.; Janson, K.; et al. Canadian 24-Hour Movement Guidelines for Children and Youth: An Integration of Physical Activity, Sedentary Behaviour, and Sleep. Appl. Physiol. Nutr. Metab. 2016, 41, S311–S327. [Google Scholar] [CrossRef] [PubMed]
- Hong, F.-Y.; Chiu, S.-I.; Huang, D.-H. A model of the relationship between psychological characteristics, mobile phone addiction and use of mobile phones by Taiwanese university female students. Comput. Hum. Behav. 2012, 28, 2152–2159. [Google Scholar] [CrossRef]
- Hayes, A.F. PROCESS: A Versatile Computational Tool for Observed Variable Mediation, Moderation, and Conditional Process Modeling (White Paper). 2012. Available online: http://www.afhayes.com (accessed on 26 January 2022).
- Hayes, A.F. Introduction to Mediation, Moderation, and Conditional Process Analysis: A Regression-Based Approach; Guilford Publications: New York, NY, USA, 2017. [Google Scholar]
- Rockwood, N.J.; Hayes, A.F. MLmed: An SPSS macro for multilevel mediation and conditional process analysis. In Proceedings of the Annual Meeting of the Association of Psychological Science (APS), Boston, MA, USA, 25–28 May 2017. [Google Scholar]
- Shrout, P.E.; Bolger, N. Mediation in experimental and nonexperimental studies: New procedures and recommendations. Psychol. Methods 2002, 7, 422. [Google Scholar] [CrossRef]
- Lützén, K.; Cronqvist, A.; Magnusson, A.; Andersson, L. Moral Stress: Synthesis of a concept. Nurs. Ethics 2003, 10, 312–322. [Google Scholar] [CrossRef] [PubMed]
- Jameton, A. Dilemmas of moral distress: Moral responsibility and nursing practice. AWHONN’s Clin. Issues Pèrinat. Women’s Health Nurs. 1993, 4, 542–551. [Google Scholar]
- Ozdemir, B.; Cakir, O.; Hussain, I. Prevalence of Nomophobia among University Students: A Comparative Study of Pakistani and Turkish Undergraduate Students. Eurasia J. Math. Sci. Technol. Educ. 2018, 14, 1519–1532. [Google Scholar] [CrossRef]
- Carbonell, X.; Chamarro, A.; Oberst, U.; Rodrigo, B.; Prades, M. Problematic Use of the Internet and Smartphones in University Students: 2006–2017. Int. J. Environ. Res. Public Health 2018, 15, 475. [Google Scholar] [CrossRef] [Green Version]
- Lee, J.Y.; Ko, D.W.; Lee, H. Loneliness, regulatory focus, inter-personal competence, and online game addiction: A moderated mediation model. Internet Res. 2019, 29, 381–394. [Google Scholar] [CrossRef]
- Russell, D.; Cutrona, C.E.; Rose, J.; Yurko, K. Social and emotional loneliness: An examination of Weiss’s typology of loneliness. J. Personal. Soc. Psychol. 1984, 46, 1313. [Google Scholar] [CrossRef]
- Di Tommaso, E.; Spinner, B. Social and emotional loneliness: A re-examination of Weiss’ typology of loneliness. Personal. Individ. Differ. 1997, 22, 417–427. [Google Scholar] [CrossRef]
- Weis, R.S. The Experience of Emotional and Social Isolation; The MIT Press: Cambridge, MA, USA, 1973. [Google Scholar]
- Oulasvirta, A.; Rattenbury, T.; Ma, L.; Raita, E. Habits make smartphone use more pervasive. Pers. Ubiquitous Comput. 2012, 16, 105–114. [Google Scholar] [CrossRef]
- LaRose, R.; Eastin, M.S. A Social Cognitive Theory of Internet Uses and Gratifications: Toward a New Model of Media Attendance. J. Broadcast. Electron. Media 2004, 48, 358–377. [Google Scholar] [CrossRef]
- Wu, A.M.S.; Cheung, V.I.; Ku, L.; Hung, E.P.W. Psychological risk factors of addiction to social networking sites among Chinese smartphone users. J. Behav. Addict. 2013, 2, 160–166. [Google Scholar] [CrossRef] [PubMed]
- Takao, M.; Takahashi, S.; Kitamura, M. Addictive Personality and Problematic Mobile Phone Use. CyberPsychol. Behav. 2009, 12, 501–507. [Google Scholar] [CrossRef] [PubMed]
- Sohn, S.; Rees, P.; Wildridge, B.; Kalk, N.; Carter, B. Prevalence of problematic smartphone usage and associated mental health outcomes amongst children and young people: A systematic review, meta-analysis and GRADE of the evidence. BMC Psychiatry 2019, 19, 1–10. [Google Scholar]
- Buchanan, T.W.; McMullin, S.D.; Baxley, C.; Weinstock, J. Stress and gambling. Curr. Opin. Behav. Sci. 2020, 31, 8–12. [Google Scholar] [CrossRef]

| Variable Name | T1; T2: Mean | T1; T2: SD |
|---|---|---|
| Loneliness | 4.24; 4.16 | 0.687; 0.675 |
| Stress | 2.83; 2.64 | 0.526; 0.728 |
| Sleep Hours | 2.51; 2.96 | 0.825; 0.763 |
| Nomophobia | 2.91; 2.96 | 0.727; 0.763 |
| Social Affiliation | 2.27; 2.21 | 0.727; 0.799 |
| PSU | 3.03; 2.85 | 0.725; 0.762 |
| Variable Name | T1; T2: Mean | T1; T2: SD |
|---|---|---|
| Loneliness | 4.03; 3.91 | 0.718; 0.815 |
| Stress | 2.72; 2.91 | 0.611; 0.672 |
| Sleep Hours | 2.76; 2.57 | 0.863; 0.612 |
| Nomophobia | 2.99; 3.08 | 0.821; 0.848 |
| Social Affiliation | 2.57; 2.56 | 0.826; 0.887 |
| PSU | 3.15; 3.16 | 0.769; 0.860 |
| Variables | Mean | S.D. | 1 | 2 | 3 | 4 | 5 | 6 |
|---|---|---|---|---|---|---|---|---|
| 1. Loneliness | 3.73 | 0.51 | 1 | |||||
| 2. Social Affiliation | 2.50 | 0.91 | 0.09 | 1 | ||||
| 3. PSU | 3.38 | 0.88 | 0.10 | 0.491 ** | 1 | |||
| 4. Stress | 2.80 | 0.65 | −0.131 * | 0.218 ** | 0.235 ** | 1 | ||
| 5. Sleep Hours | 2.70 | 0.89 | −0.011 | 0.356 ** | 0.355 ** | 0.385 ** | 1 | |
| 6. Nomophobia | 3.04 | 0.94 | −0.106 | 0.493 ** | 0.627 ** | 0.273 ** | 0.317 ** | 1 |
| Variables | Mean | S.D. | 1 | 2 | 3 | 4 | 5 | 6 |
|---|---|---|---|---|---|---|---|---|
| 1. Loneliness | 3.96 | 0.84 | 1 | |||||
| 2. Social Affiliation | 2.45 | 0.98 | −0.147 * | 1 | ||||
| 3. PSU | 3.33 | 0.95 | −0.076 | 0.539 ** | 1 | |||
| 4. Stress | 2.98 | 0.74 | −0.333 ** | 0.121 | 0.181 ** | 1 | ||
| 5. Sleep Hours | 2.75 | 0.93 | −0.200 ** | 0.421 ** | 0.410 ** | 0.286 ** | 1 | |
| 6. Nomophobia | 3.18 | 1.00 | −0.194 ** | 0.488 * | 0.696 ** | 0.274 ** | 0.363 ** | 1 |
| Variable Name | T1 | T2 |
|---|---|---|
| Loneliness | 0.153 * | 0.092 * |
| Sleep Hours | 0.126 * | 0.131 ** |
| Nomophobia | 0.507 ** | 0.556 ** |
| Social Affiliation | 0.194 ** | 0.226 ** |
| R2 | 0.473 | 0.556 |
| F | 6.192 | 4.31 |
| Std, E | 0.644 | 0.64 |
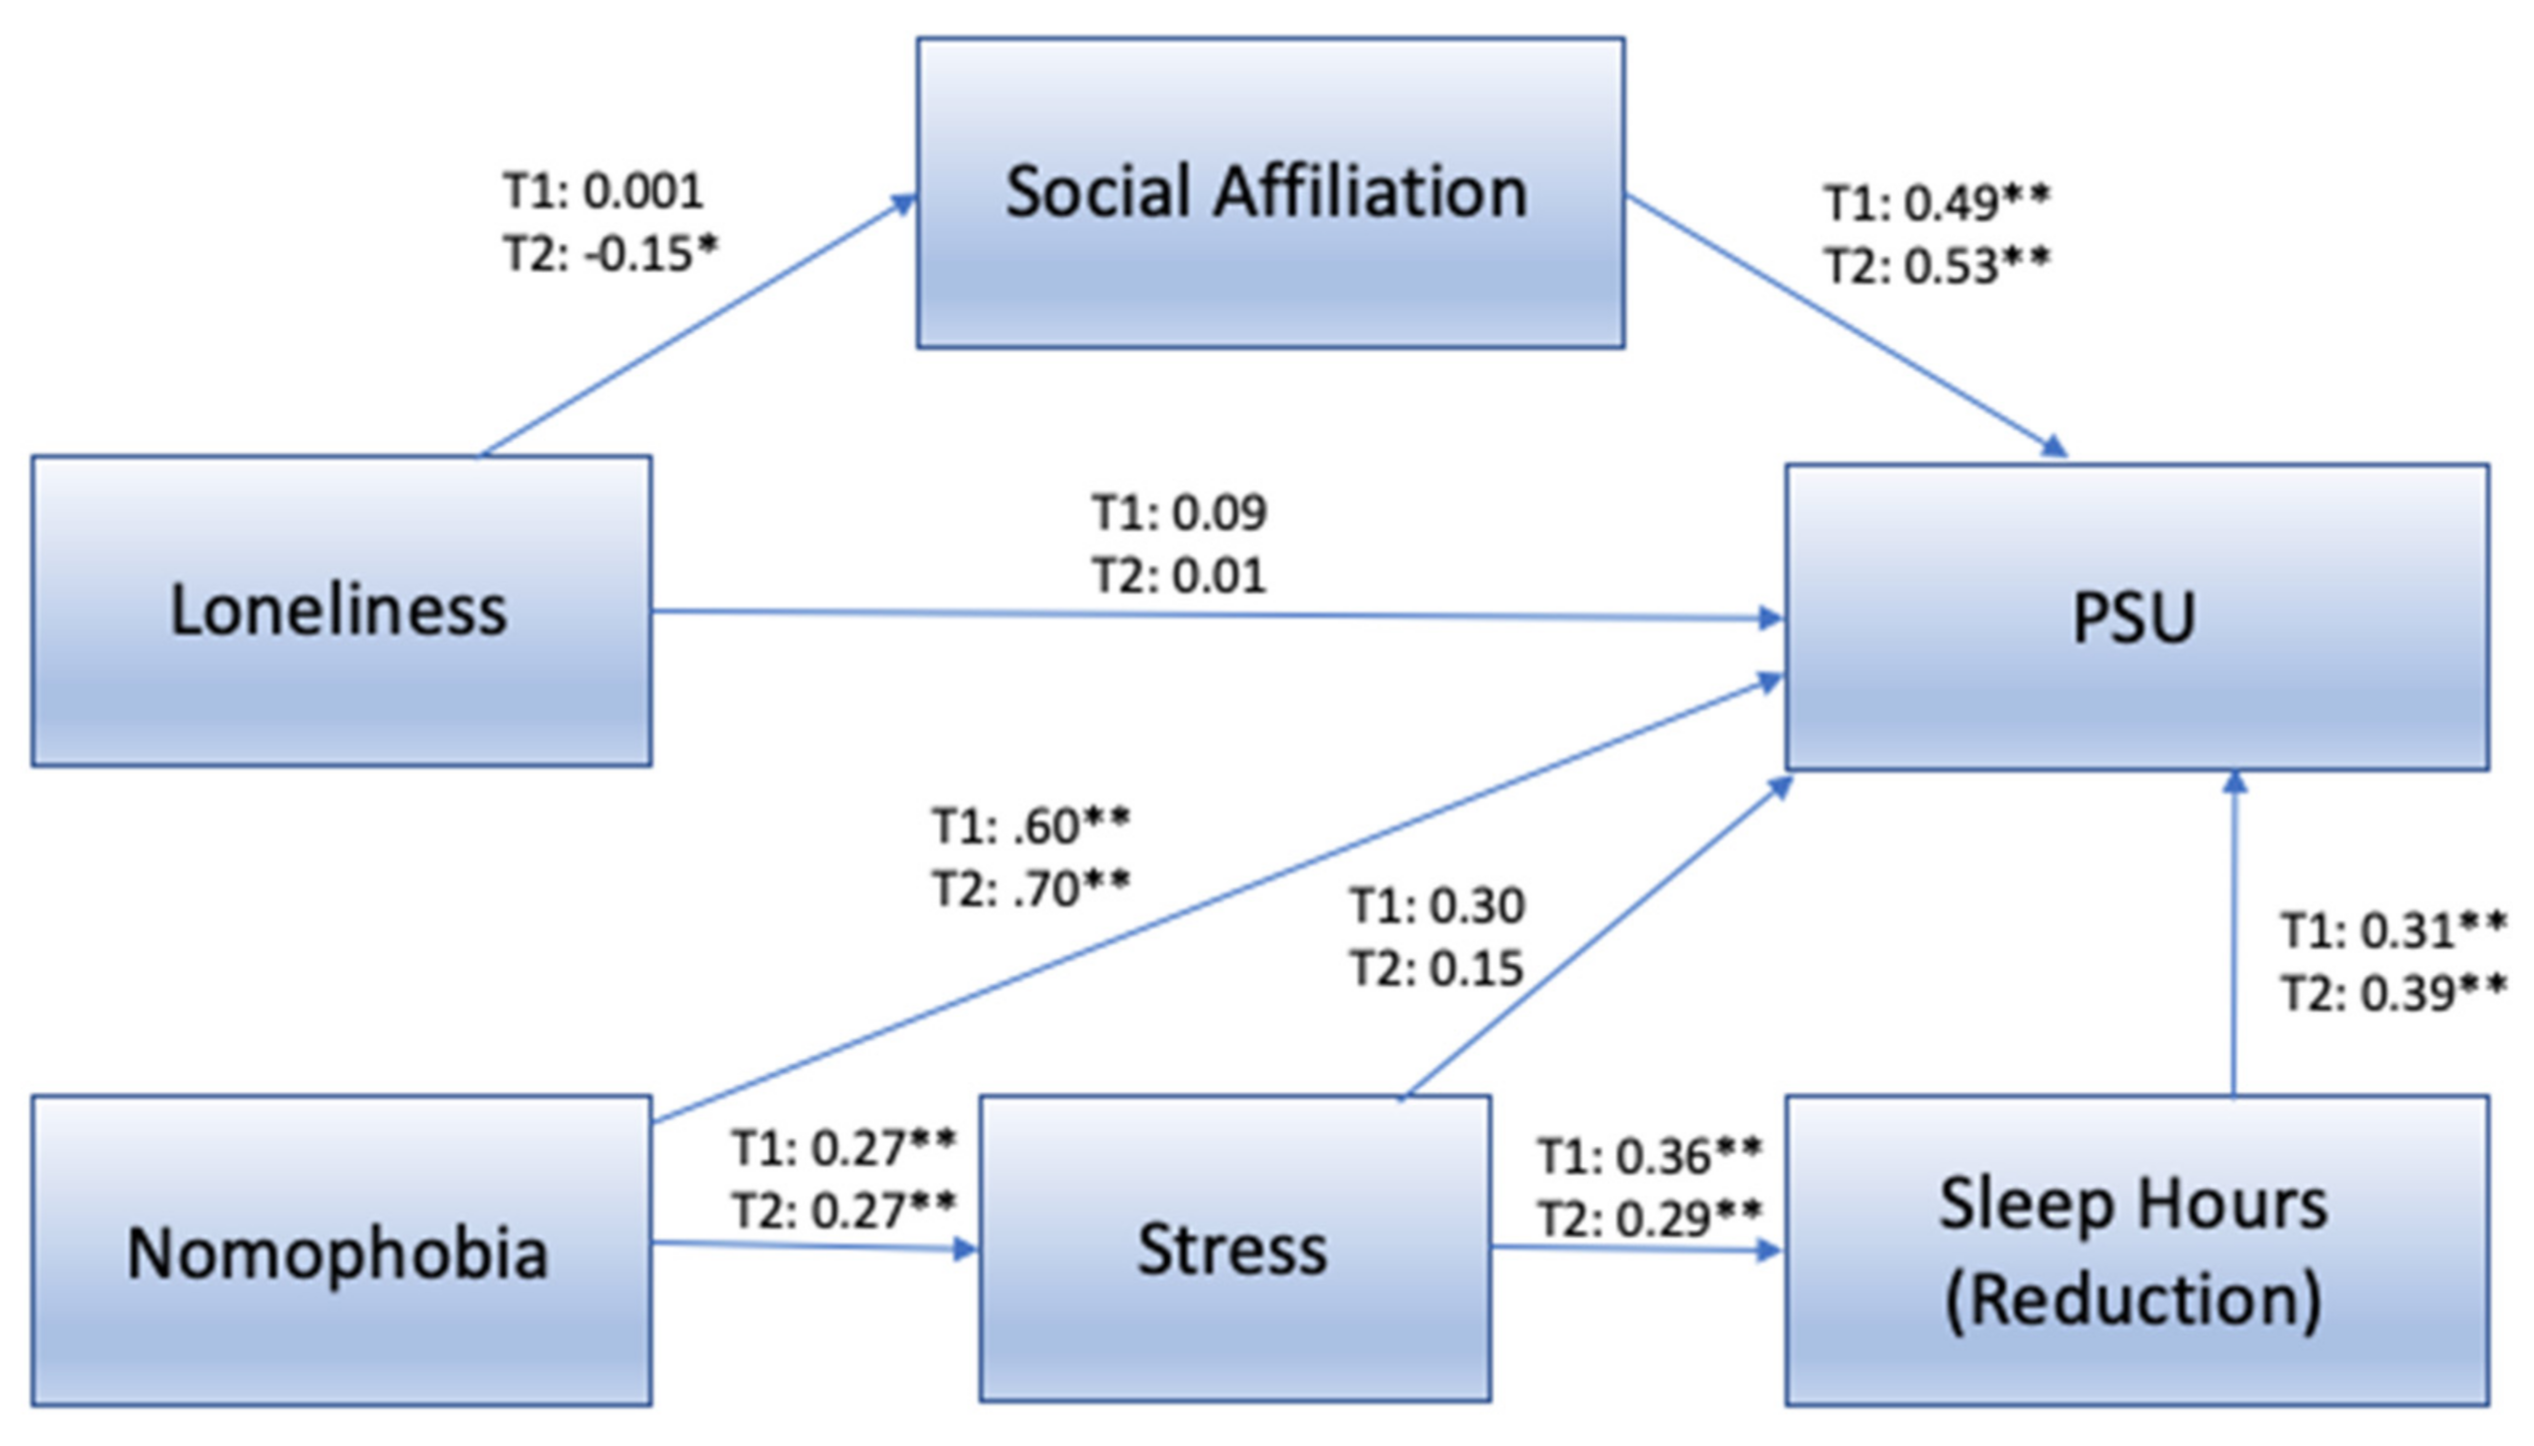
| Variable/Effect | T1: Coeff | T1: t | T1: p | T2: Coeff | T2: t | T2: p |
|---|---|---|---|---|---|---|
| Stress 🡪 PSU | 0.11 | 1.80 | 0.075 | 0.07 | 1.13 | 0.257 |
| Stress 🡪 Sleep Hours | 0.36 ** | 6.52 | 0.000 | 0.29 ** | 4.66 | 0.000 |
| Sleep Hours 🡪 PSU | 0.31 ** | 4.80 | 0.000 | 0.39 ** | 6.40 | 0.000 |
| Loneliness 🡪 PSU | 0.09 | 1.71 | 0.119 | 0.01 | 0.07 | 0.941 |
| Loneliness 🡪 Social Affiliation | 0.001 | 0.147 | 0.147 | −0.15 * | −2.33 | 0.021 |
| Social Affiliation 🡪 PSU | 0.49 ** | 8.81 | 0.000 | 0.53 ** | 9.88 | 0.000 |
| Nomophobia 🡪 Stress | 0.27 ** | 4.43 | 0.000 | 0.27 ** | 4.44 | 0.000 |
| Nomophobia 🡪 PSU | 0.60 ** | 12.56 | 0.000 | 0.70 ** | 14.61 | 0.000 |
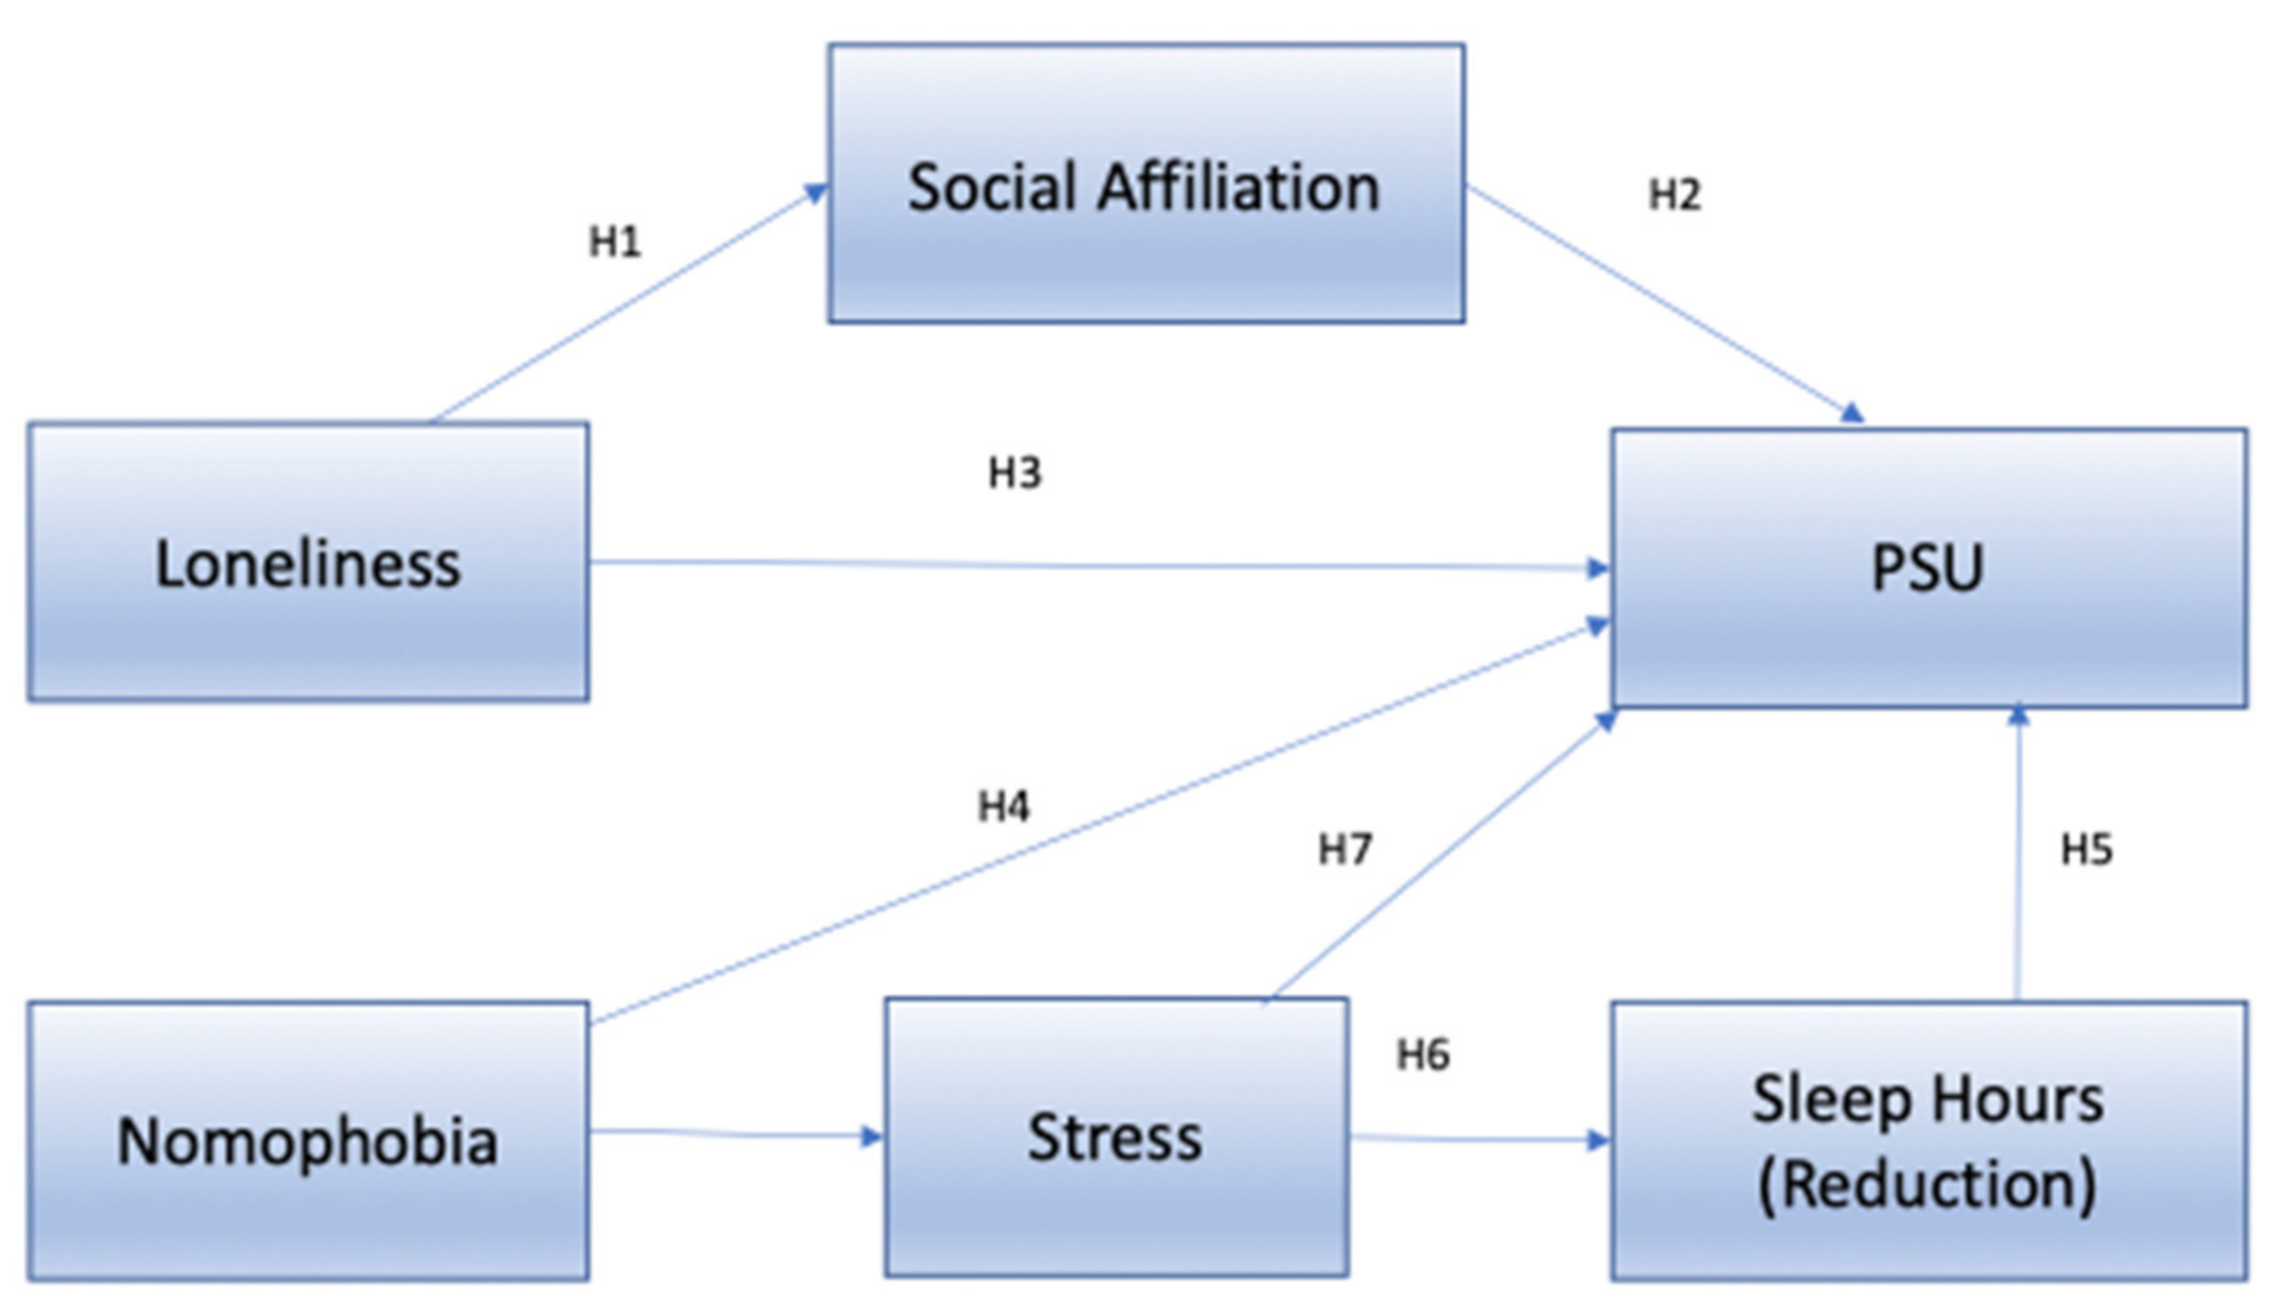
| Hypothesis Number | Hypothesis | T1 | T2 |
|---|---|---|---|
| H1 | Loneliness is positively associated with social affiliation | Not Supported | Not Supported |
| H2 | Desire for greater social affiliation is positively associated with PSU | Supported | Supported |
| H3 | Social affiliation will serve as a mediator between loneliness and PSU | Not Supported | Supported |
| H4 | Nomophobia is positively associated with PSU | Supported | Supported |
| H5 | Mobile users with fewer sleep hours will exhibit a higher level of PSU | Supported | Supported |
| H6 | Stress level will positively correlate with number of sleep hours | Supported | Supported |
| H7 | Sleep hours will serve as a mediator between stress and PSU | Supported | Supported |
| Multiple Hierarchical Regression Analysis | |||
| Variable Name | T1 | T2 | |
| Loneliness | 0.153 * | 0.092 * | |
| Sleep Hours | 0.126 * | 0.131 ** | |
| Nomophobia | 0.507 ** | 0.556 ** | |
| Social Affiliation | 0.194 ** | 0.226 ** | |
| Mediation Effect Analysis | |||
| Variable/Effect | T1: Coeff | T2: Coeff | |
| Stress 🡪 Sleep Hours | β = 0.36 (T1) p < 0.01 | β = 0.29 (T2) p < 0.01 | |
| Sleep Hours 🡪 PSU | β = 0.31 (T1) p < 0.01 | β = 0.39 (T2) p < 0.01 | |
| Social Affiliation 🡪 PSU | β = 0.49 (T1) p < 0.01 | β = 0.53 (T2) p < 0.01 | |
| Nomophobia 🡪 PSU | β = 0.60 (T1) p < 0.01 | β = 0.70 (T2) p < 0.01 | |
| Loneliness 🡪 Social Affiliation | β = 0.001 (T1) p > 0.05 | β = −0.15 (T2) p < 0.05 | |
Publisher’s Note: MDPI stays neutral with regard to jurisdictional claims in published maps and institutional affiliations. |
© 2022 by the author. Licensee MDPI, Basel, Switzerland. This article is an open access article distributed under the terms and conditions of the Creative Commons Attribution (CC BY) license (https://creativecommons.org/licenses/by/4.0/).
Share and Cite
Zwilling, M. The Impact of Nomophobia, Stress, and Loneliness on Smartphone Addiction among Young Adults during and after the COVID-19 Pandemic: An Israeli Case Analysis. Sustainability 2022, 14, 3229. https://doi.org/10.3390/su14063229
Zwilling M. The Impact of Nomophobia, Stress, and Loneliness on Smartphone Addiction among Young Adults during and after the COVID-19 Pandemic: An Israeli Case Analysis. Sustainability. 2022; 14(6):3229. https://doi.org/10.3390/su14063229
Chicago/Turabian StyleZwilling, Moti. 2022. "The Impact of Nomophobia, Stress, and Loneliness on Smartphone Addiction among Young Adults during and after the COVID-19 Pandemic: An Israeli Case Analysis" Sustainability 14, no. 6: 3229. https://doi.org/10.3390/su14063229
APA StyleZwilling, M. (2022). The Impact of Nomophobia, Stress, and Loneliness on Smartphone Addiction among Young Adults during and after the COVID-19 Pandemic: An Israeli Case Analysis. Sustainability, 14(6), 3229. https://doi.org/10.3390/su14063229