Article

Prediction of Penetration Resistance of a Spherical Penetrometer in Clay Using Multivariate Adaptive Regression Splines Model

by
Sayan Sirimontree
1,
Thira Jearsiripongkul
2,
Van Qui Lai
3,4,
Alireza Eskandarinejad
5,
Jintara Lawongkerd
1,
Sorawit Seehavong
1,
Chanachai Thongchom
1,
Peem Nuaklong
1 and
Suraparb Keawsawasvong
1,*
1
Department of Civil Engineering, Faculty of Engineering, Thammasat School of Engineering, Thammasat University, Pathumthani 12120, Thailand
2
Department of Mechanical Engineering, Faculty of Engineering, Thammasat School of Engineering, Thammasat University, Pathumthani 12120, Thailand
3
Faculty of Civil Engineering, Ho Chi Minh City University of Technology (HCMUT), Ho Chi Minh City 700000, Vietnam
4
Faculty of Civil Engineering, Vietnam National University Ho Chi Minh City (VNUHCM), Ho Chi Minh City 700000, Vietnam
5
Department of Civil Engineering, Faculty of Engineering, Golestan University, Gorgan P.O. Box 155, Iran
*
Author to whom correspondence should be addressed.
Sustainability 2022, 14(6), 3222; https://doi.org/10.3390/su14063222
Submission received: 10 February 2022 / Revised: 6 March 2022 / Accepted: 8 March 2022 / Published: 9 March 2022

Abstract

:
This paper presents the technique for solving the penetration resistance factor of a spherical penetrometer in clay under axisymmetric conditions by taking the adhesion factor, the embedded ratio, the normalized unit weight, and the undrained shear strength into account. The finite element limit analysis (FELA) is used to provide the upper bound (UB) or lower bound (LB) solutions, then the multivariate adaptive regression splines (MARS) model is used to train the optimal data between input and output database. The accuracy of MARS equations is confirmed by comparison with the finite element method and the validity of the present solutions was established through comparison to existing results. All numerical results of the penetration resistance factor have significance with three main parameters (i.e., the adhesion factor, the embedded ratio, the normalized unit weight, and the undrained shear strength). The failure mechanisms of spherical penetrometers in clay are also investigated, the contour profiles that occur around the spherical penetrometers also depend on the three parameters. In addition, the proposed technique can be used to estimate the problems that are related or more complicated in soft offshore soils.

1. Introduction

To accurately measure the shear strength of soft sediments in deep-water sites for the design and construction of foundations or anchoring systems in offshore facilities, in situ testing such as the vane shear test or penetrometer testing has become more popular to obtain high-quality results of soil strengths. A cylindrical T-bar probe is one of the penetrometer testing methods that was implemented in two site investigations [1,2]. Using the T-bar to penetrate the soil, this device allows the soil to flow surrounding the probe which can approximately measure the bearing resistance of soils. The closed-form solutions of the full-flow mechanism of the T-bar under plane strain conditions were presented by Randolph Houlsby [3] using the upper and lower bound limit analysis techniques. Later, Martin and Randolph [4] improved the velocity field of the full-flow mechanism of the T-bar in the upper bound method in order to obtain a more accurate bearing capacity factor. Similar solutions for the other shapes (e.g., rectangular or I-shaped) were also proposed by Keawsawasvong and Ukritchon [5,6] and Ukritchon and Keawsawasvong [7] by using numerical techniques of the finite element limit analysis (FELA) under plane strain conditions.
In 1982, Vallejo [8] introduced the use of a spherical penetrometer to predict the undrained shear strength of muds. The shape of this spherical penetrometer is analogous with a ball penetrating into a soil mass as shown in Figure 1. A similar device was also employed to perform strength profiling in soft offshore soils by Watson et al. [9] and Newson et al. [10]. Plastic solutions of the limiting capacity acting on a spherical penetrometer moving vertically through the cohesive soil were presented by Randolph et al. [11] using the kinematic mechanism and stress characteristic field under axisymmetric conditions. However, the results by Randolph et al. [11] did not consider the effects of soil unit weight, adhesion factor at the soil-ball interface, and embedded depth.
This paper demonstrates the use of a machine learning technique, namely the multivariate adaptive regression splines (MARS) model, to propose an empirical equation for predicting the penetration resistance factor of spherical penetrometers in clays. The penetration resistance factors of this problem are computed by employing the lower bound (LB) and upper bound (UB) finite element limit analysis (FELA) and then are used as a set of training data in MARS analysis. In recent days, the LB and UB FELA have become a favorite and efficient method to solving the stability solutions of many geotechnical problems (e.g., [12,13,14,15,16,17,18,19,20,21,22]). This FELA approach combines the theorem of classical plasticity, the technique of numerical discretization using finite element method, and mathematical optimization, which can accurately provide the bracketed solutions from LB and UB solutions of various stability problems in geotechnical engineering [23].
The final outcomes of the current study are presented using design charts. Moreover, the influences of soil overburden, adhesion factor, and embedded depth on these factors are comprehensively taken into account. Due to the complex effect of each parameter on the penetration resistance factor, the MARS model is employed to examine the sensitivity of each parameter using the output results, as well as to build a correlation equation between the multi-input parameters and output results. A brief description of the MARS model can be found in Zhang [24]. The tools provided in this paper will contribute to practical investigations of the undrained shear strength of clays using a spherical penetrometer. It should be noted that the study is the first work to consider the problem of the penetration resistance factor of spherical penetrometers in clays by considering the effects of adhesion factor, embedded ratio, normalized unit weight, and undrained shear strength. Moreover, the application of MARS for this problem is one of the new findings in this study.

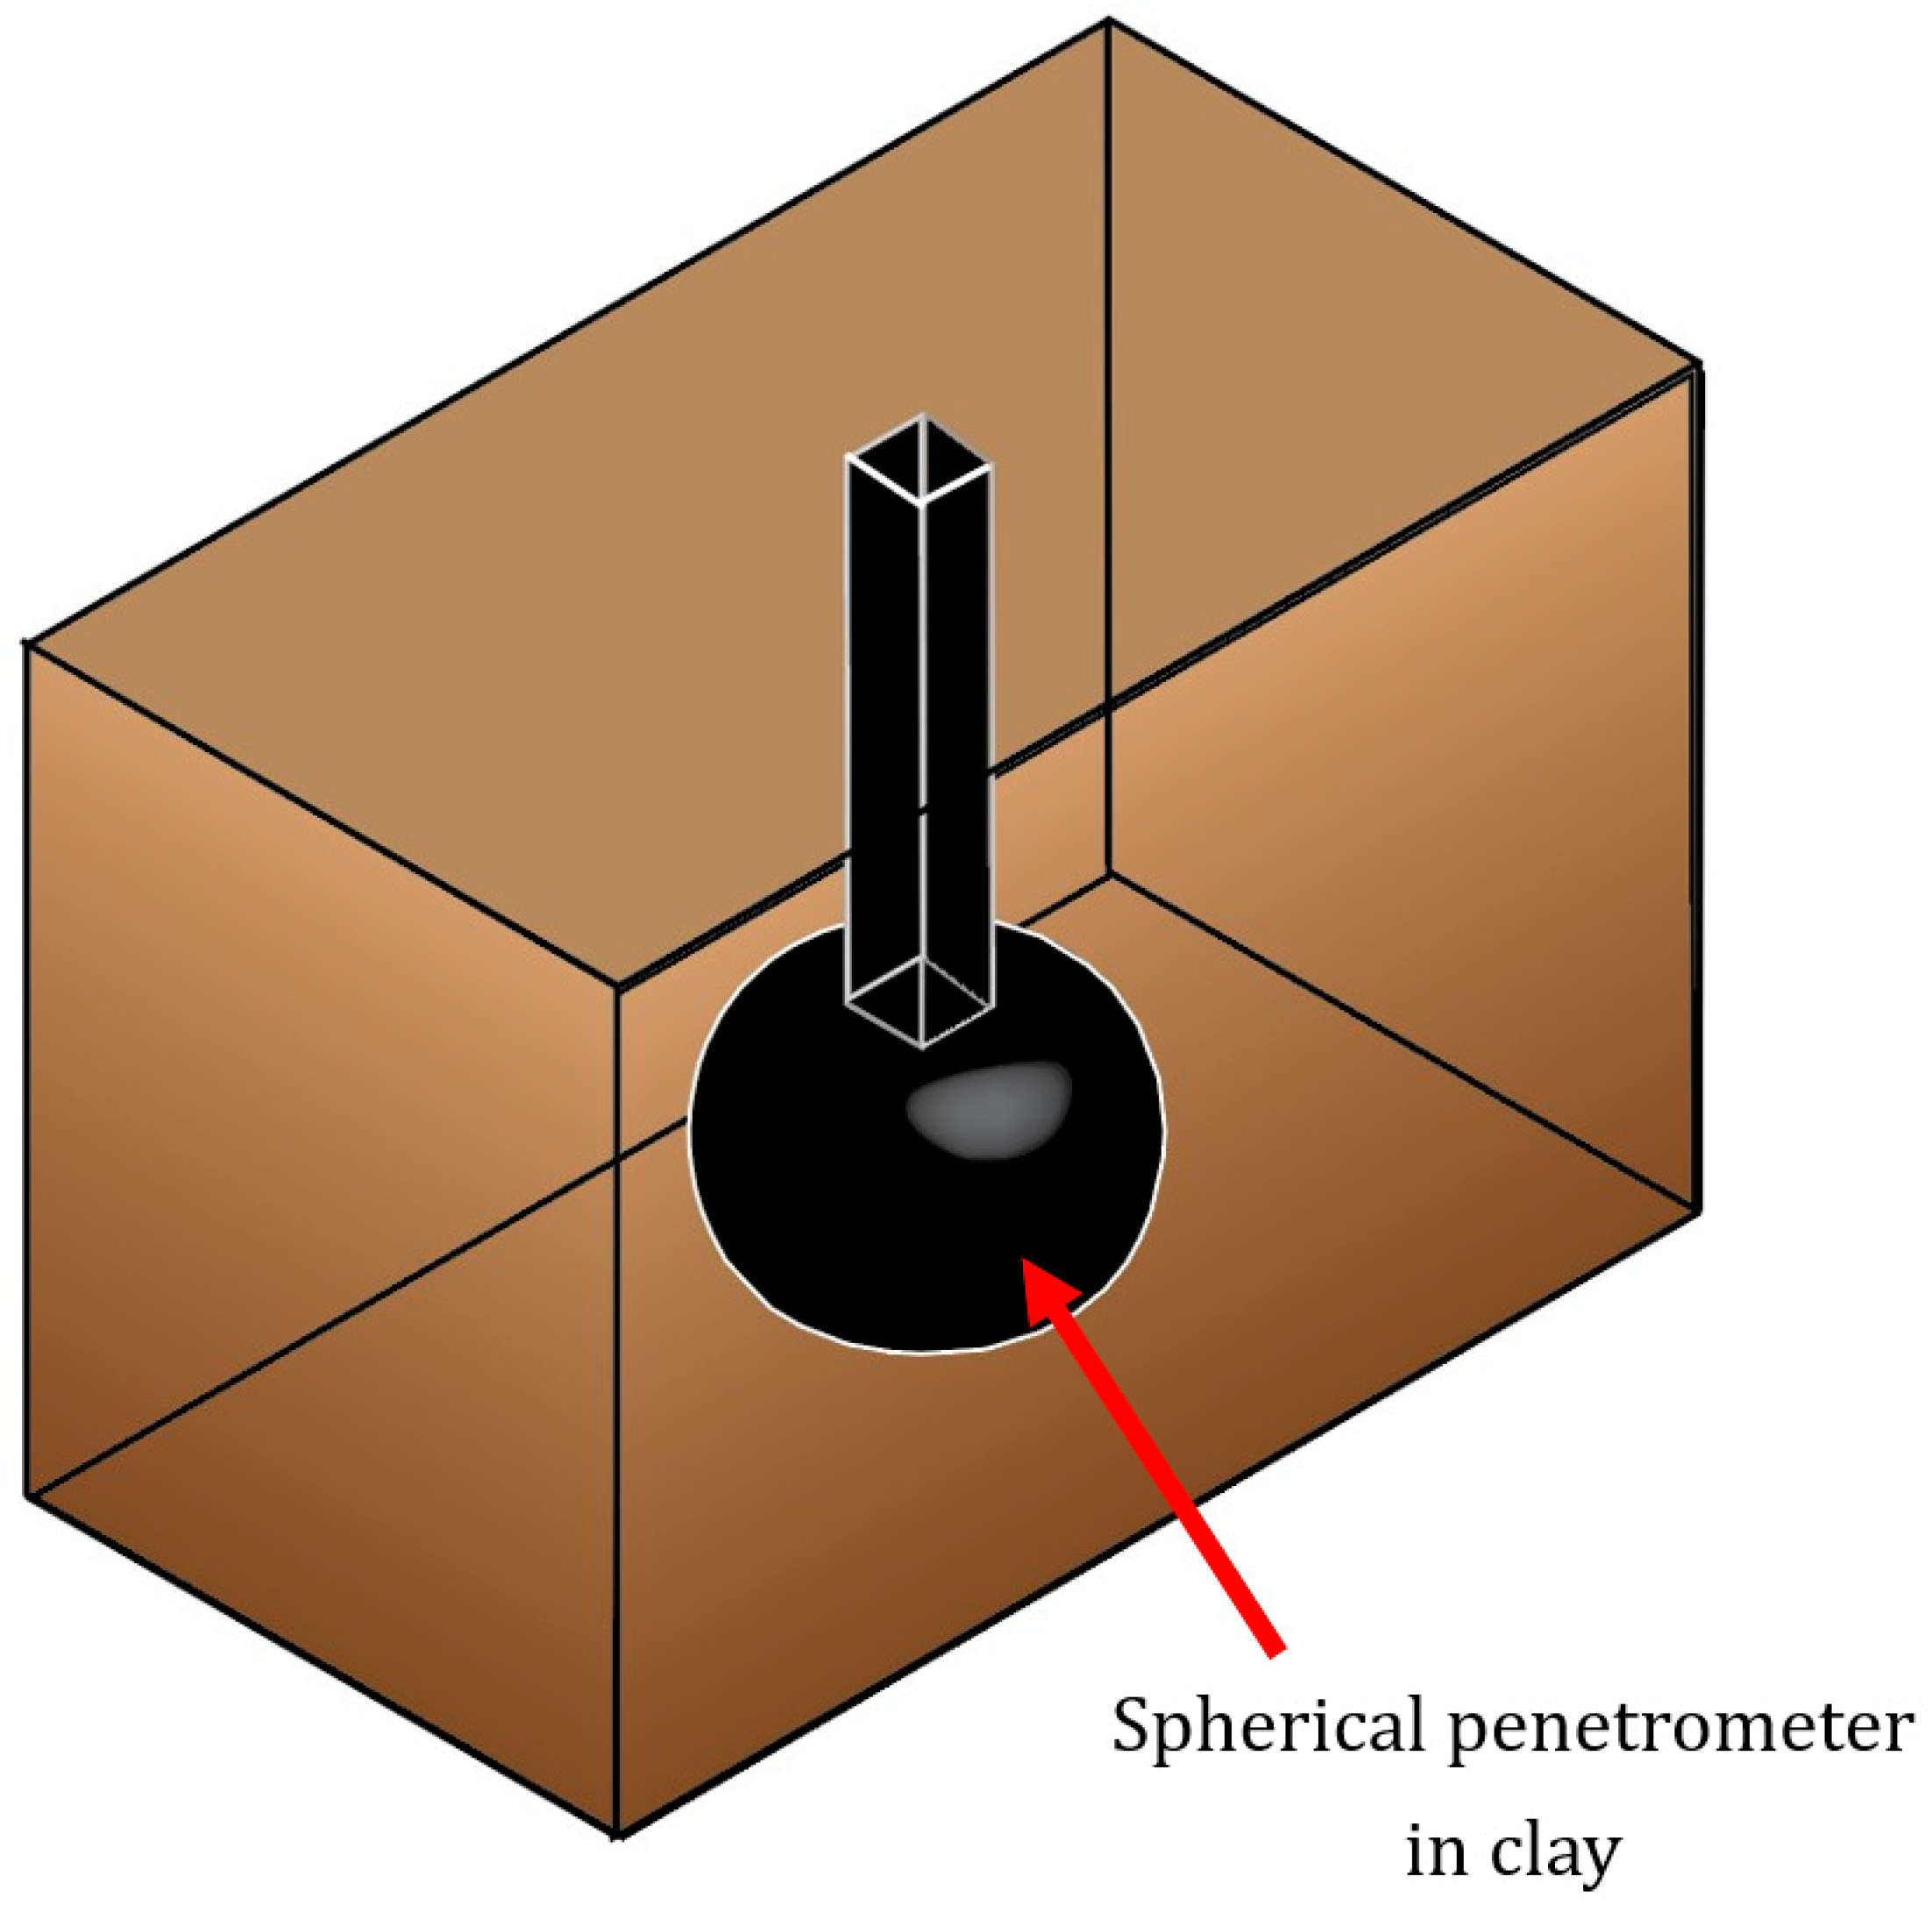
2. Problem Definition
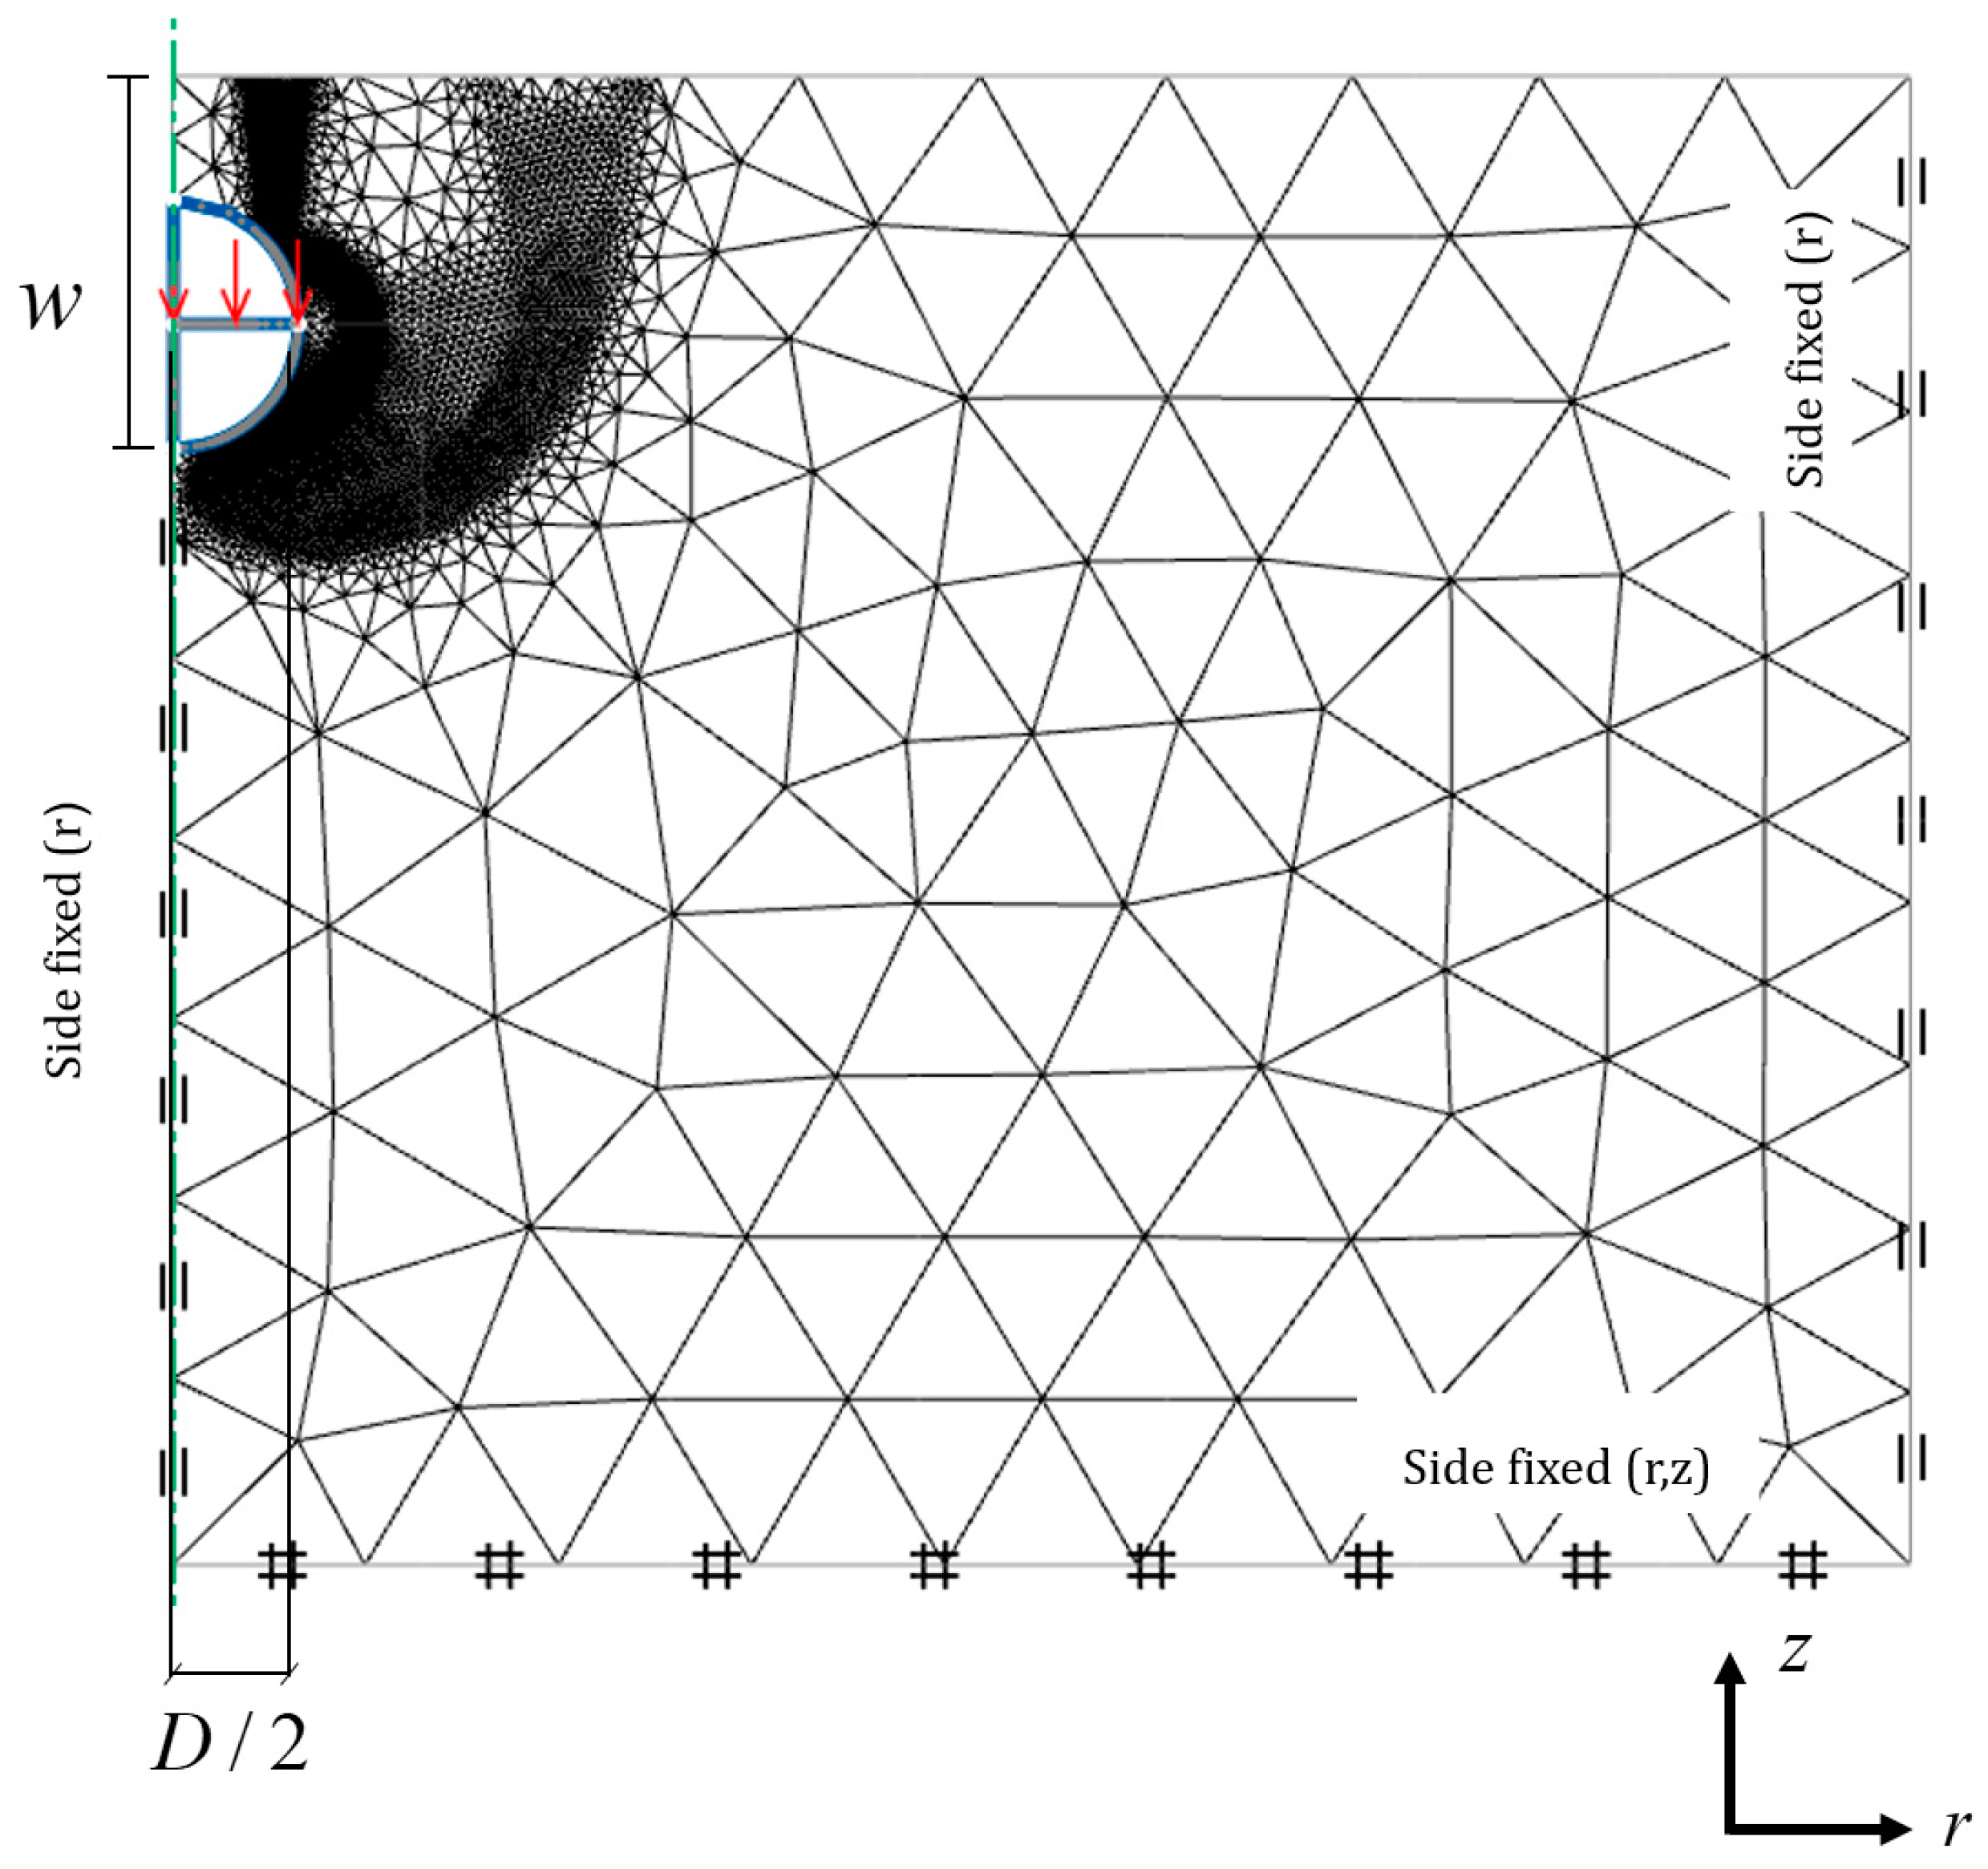
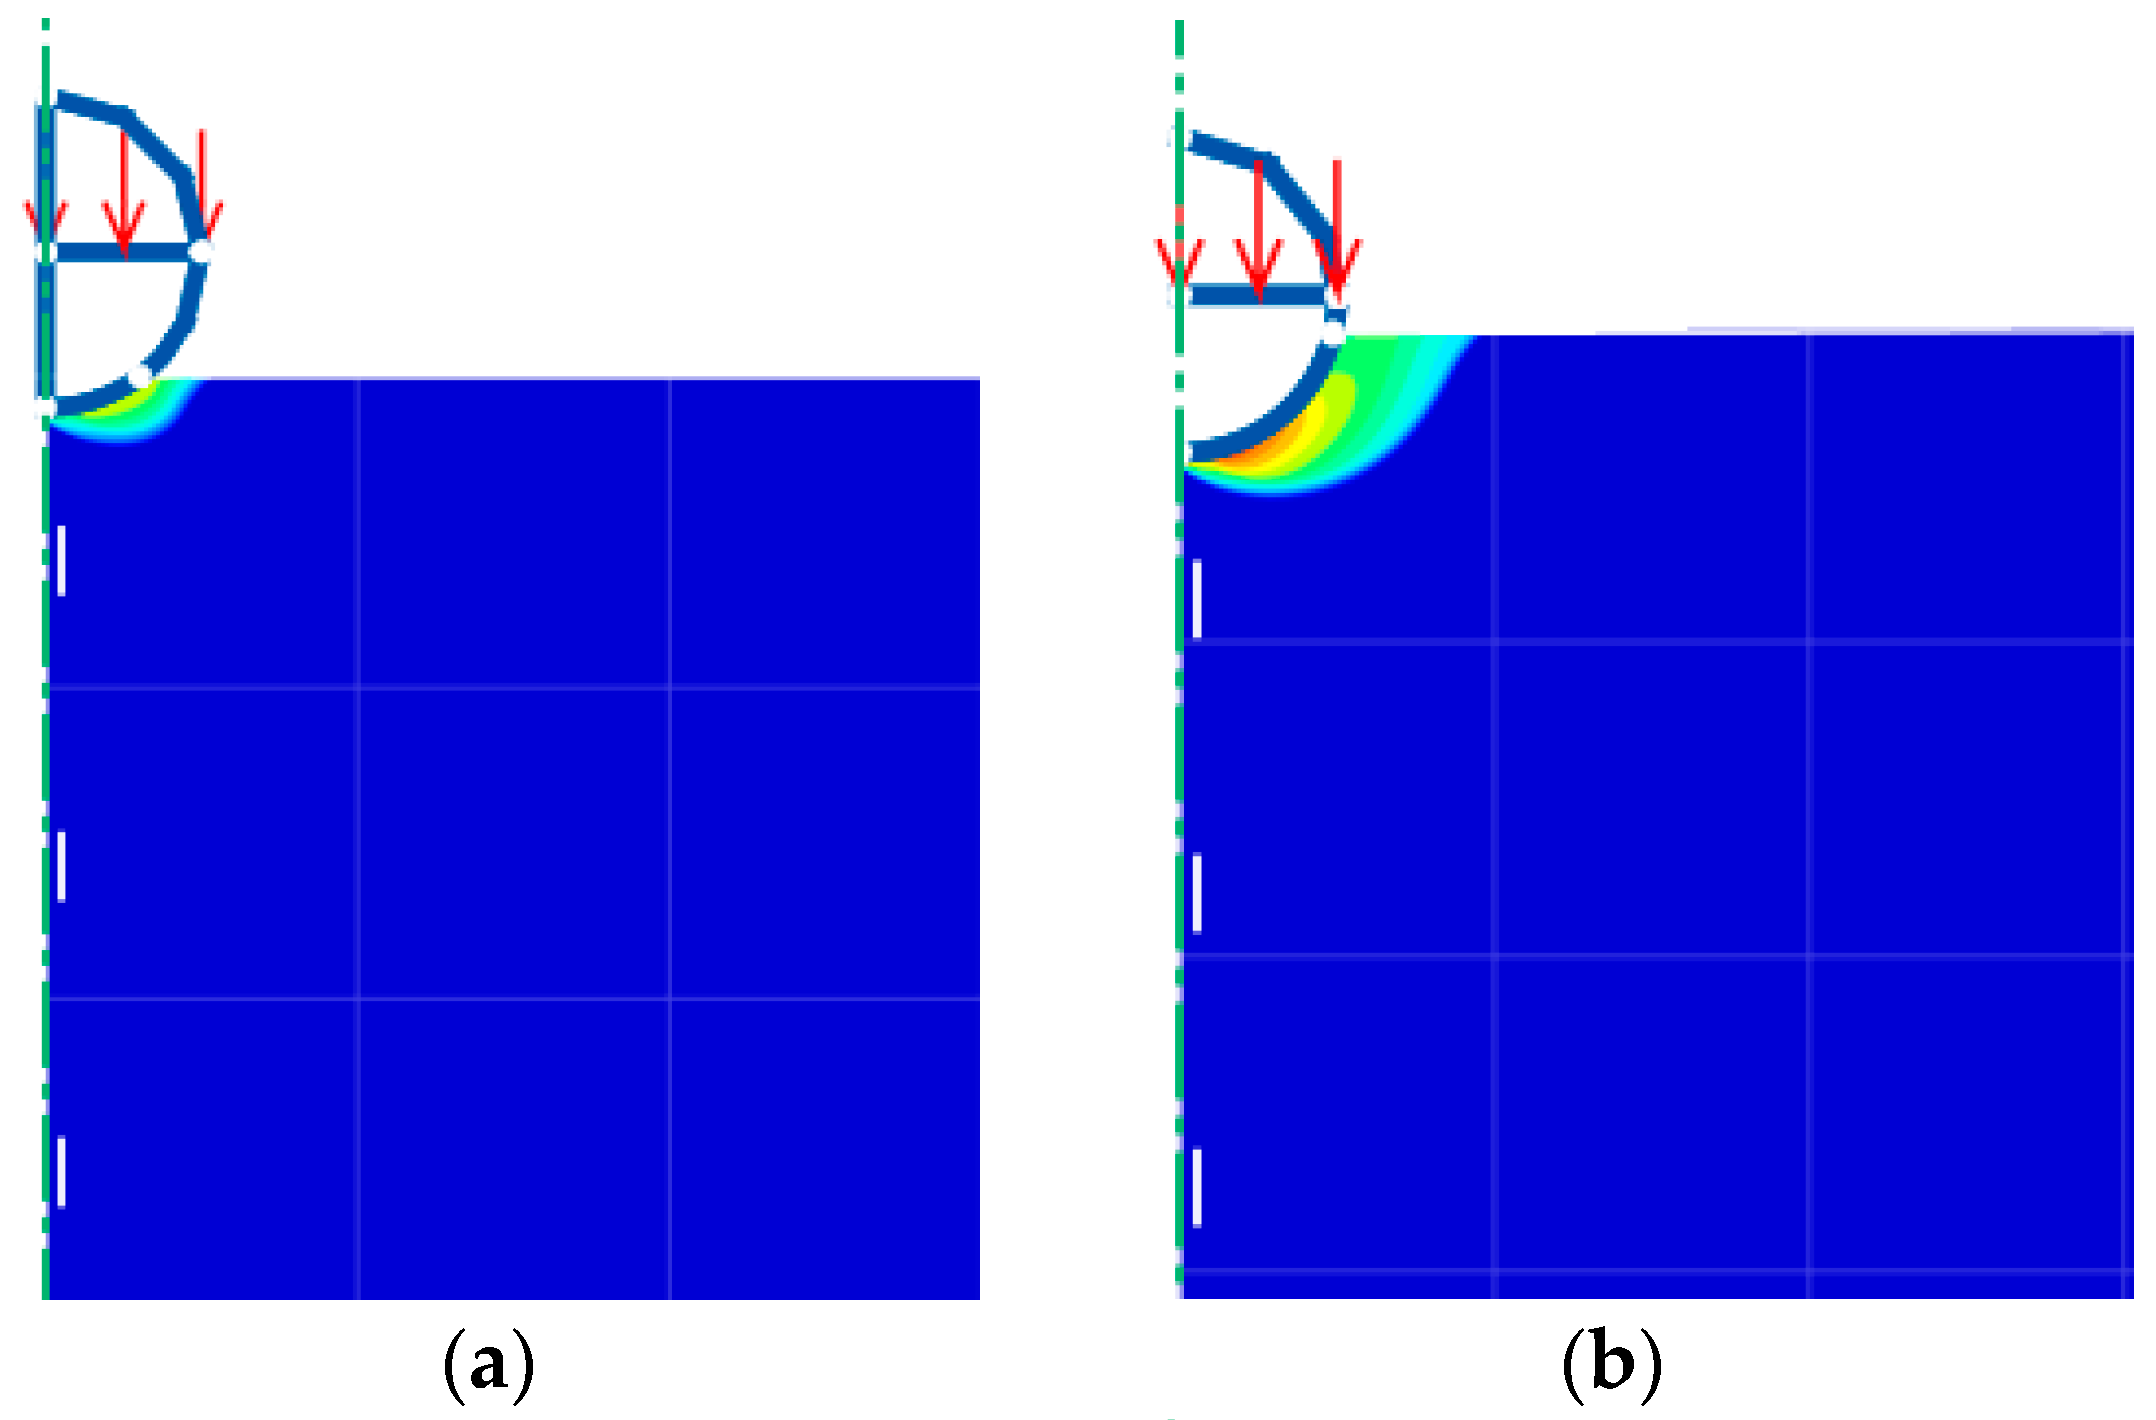
The problem definition of a spherical penetrometer in clay under axisymmetric conditions is shown in Figure 2. The spherical penetrometer has a diameter of D and is located at an embedment depth of w. The clay has an undrained shear strength Su and a unit weight γ. Since these problems are axisymmetric, only half of the domain is used in the numerical simulation as shown in Figure 2, where the left-hand side of the domain represents the axis of symmetry. The penetrometer is subjected to the vertical penetration force P.
The roughness at the soil-ball interface is also considered in this study as one of the essential parameters having a significant effect on the penetration resistance of the spherical penetrometer. The parameter accounting for the interface roughness is called the adhesion factor α, where the effect of it was exanimated by several previous articles such as by Keawsawasvong and Lai [25], Ukritchon and Keawsawasvong [26,27], and Ukritchon et al. [28]. The range of α basically varies from 0 (fully smooth interface) to 1 (fully rough interface). The definition of the adhesion is the ratio between the undrained shear strength at the soil-ball interface and that of the surrounding soil as expressed in Equation (1).
α = S u i S u
where Sui is the undrained shear strength at the soil-ball interface;
Su is the undrained shear strength of the surrounding soil.
In this study, the penetration resistance factor (N) is described as a uniform pressure that is normalized by the cross-section area (A) of the spherical penetrometer. The penetration resistance factor (N) can be written as a function of three dimensionless input parameters as shown in Equation (2).
N = P A S u f ( w D , γ D S u , α )
A = π D 2 4
where w/D is the embedded ratio;
α is the adhesion factor;
γD/Su is the normalized unit weight and undrained shear strength.
Hereafter, the impacts of w/D, α, and γD/Su on the penetration resistance factor (N) are comprehensively investigated in the paper.

3. FELA

Employing the finite element limit analysis (FELA), the plastic solutions of the penetration resistance factor of spherical penetrometers in clays with the consideration of the adhesion factor, the embedded ratio, and the normalized unit weight and undrained shear strength are numerically derived. Note that the FELA can provide the upper bound (UB) or lower bound (LB) solutions by utilizing the optimization techniques and the finite element discretization techniques. The formulations of UB and LB FELA are based on the plastic bound theorems cooperating with governing kinematic or equilibrium equations, respectively [23]. The true solutions of the penetration resistance factor of spherical penetrometers in clays can be accurately acquired by bracketing from UB and LB solutions.
The numerical model of a spherical penetrometer in clay under the penetration force in axisymmetric conditions is simulated by using the FELA software, namely OptumG2 [29], as shown in Figure 2. The details of FELA are described next. The soils are discretized into a number of triangular elements distributed over the domain of this problem in both LB and UB FELA. The collapse loading is maximized in the LB analysis by using the loading multiplier technique by satisfying all equilibrium conditions based on the LB FELA scheme which are constructed within the entire domain of the problem. The collapse loading is minimized in the UB analysis by also using the loading multiplier technique, where the rate of the total work is done by the external pressure with the total internal power dissipation. Only half of the model domain is carried out in the simulation due to its axial symmetry at the left of the domain. For the boundary conditions of the problem, vertical movements are allowed at the left and right boundaries of the domain whereas horizontal movements are fixed to be zero. There are no movements in both horizontal and vertical directions at the bottom boundary of the domain. Both horizontal and vertical movements are permitted to take place (freely moved) at the top boundary of the domain. The spherical penetrometer is modeled by using rigid plate elements and subjected to vertical force. The clay has a constant unit weight and a constant undrained shear strength and is modeled by volume elements of soils obeying the Tresca failure criterion with an associated flow rule. The interface between the clay and the penetrometer is set to be varied in the range of α = 0 (fully smooth interface) to 1 (fully rough interface). The size of the domain is selected to be large enough for all numerical models in order to avoid the insufficient boundary effect or the intersection of the plastic shear zone at the right and bottom boundaries. Note that the assumptions of this study are that the ball should be in a spherical shape and the clay should be homogeneous and isotropic. The limitations of this study are that the proposed solutions cannot be applied for the cases of sands or cohesive-frictional soils as well as the other shapes of a penetrometer.
To acquire more rigorous UB and LB solutions, the automatic mesh adaptivity procedure [30] is activated, where the number of elements will increase in the sensitive areas having high plastic shearing strain. Note that, from the first step to the final step of mesh adaptivity iterations, the number of elements will automatically increase in the sensitive areas, which leads to more precise UB and LB solutions. The difference between the UB and LB solutions in all presented numerical results is set to be smaller than 1% so that the setting of five adaptive steps is applied to all numerical simulations. In addition, the number of elements is about 5000 elements at the first adaptivity iteration and increases to approximately 10,000 elements at the fifth adaptivity iteration or the final step. An example of the final adaptive meshes of this problem is shown in Figure 2. It can be seen in Figure 2 that the number of elements is dramatically increased in the zones with high plastic shearing strain revealing the collapse mechanisms of the problem.

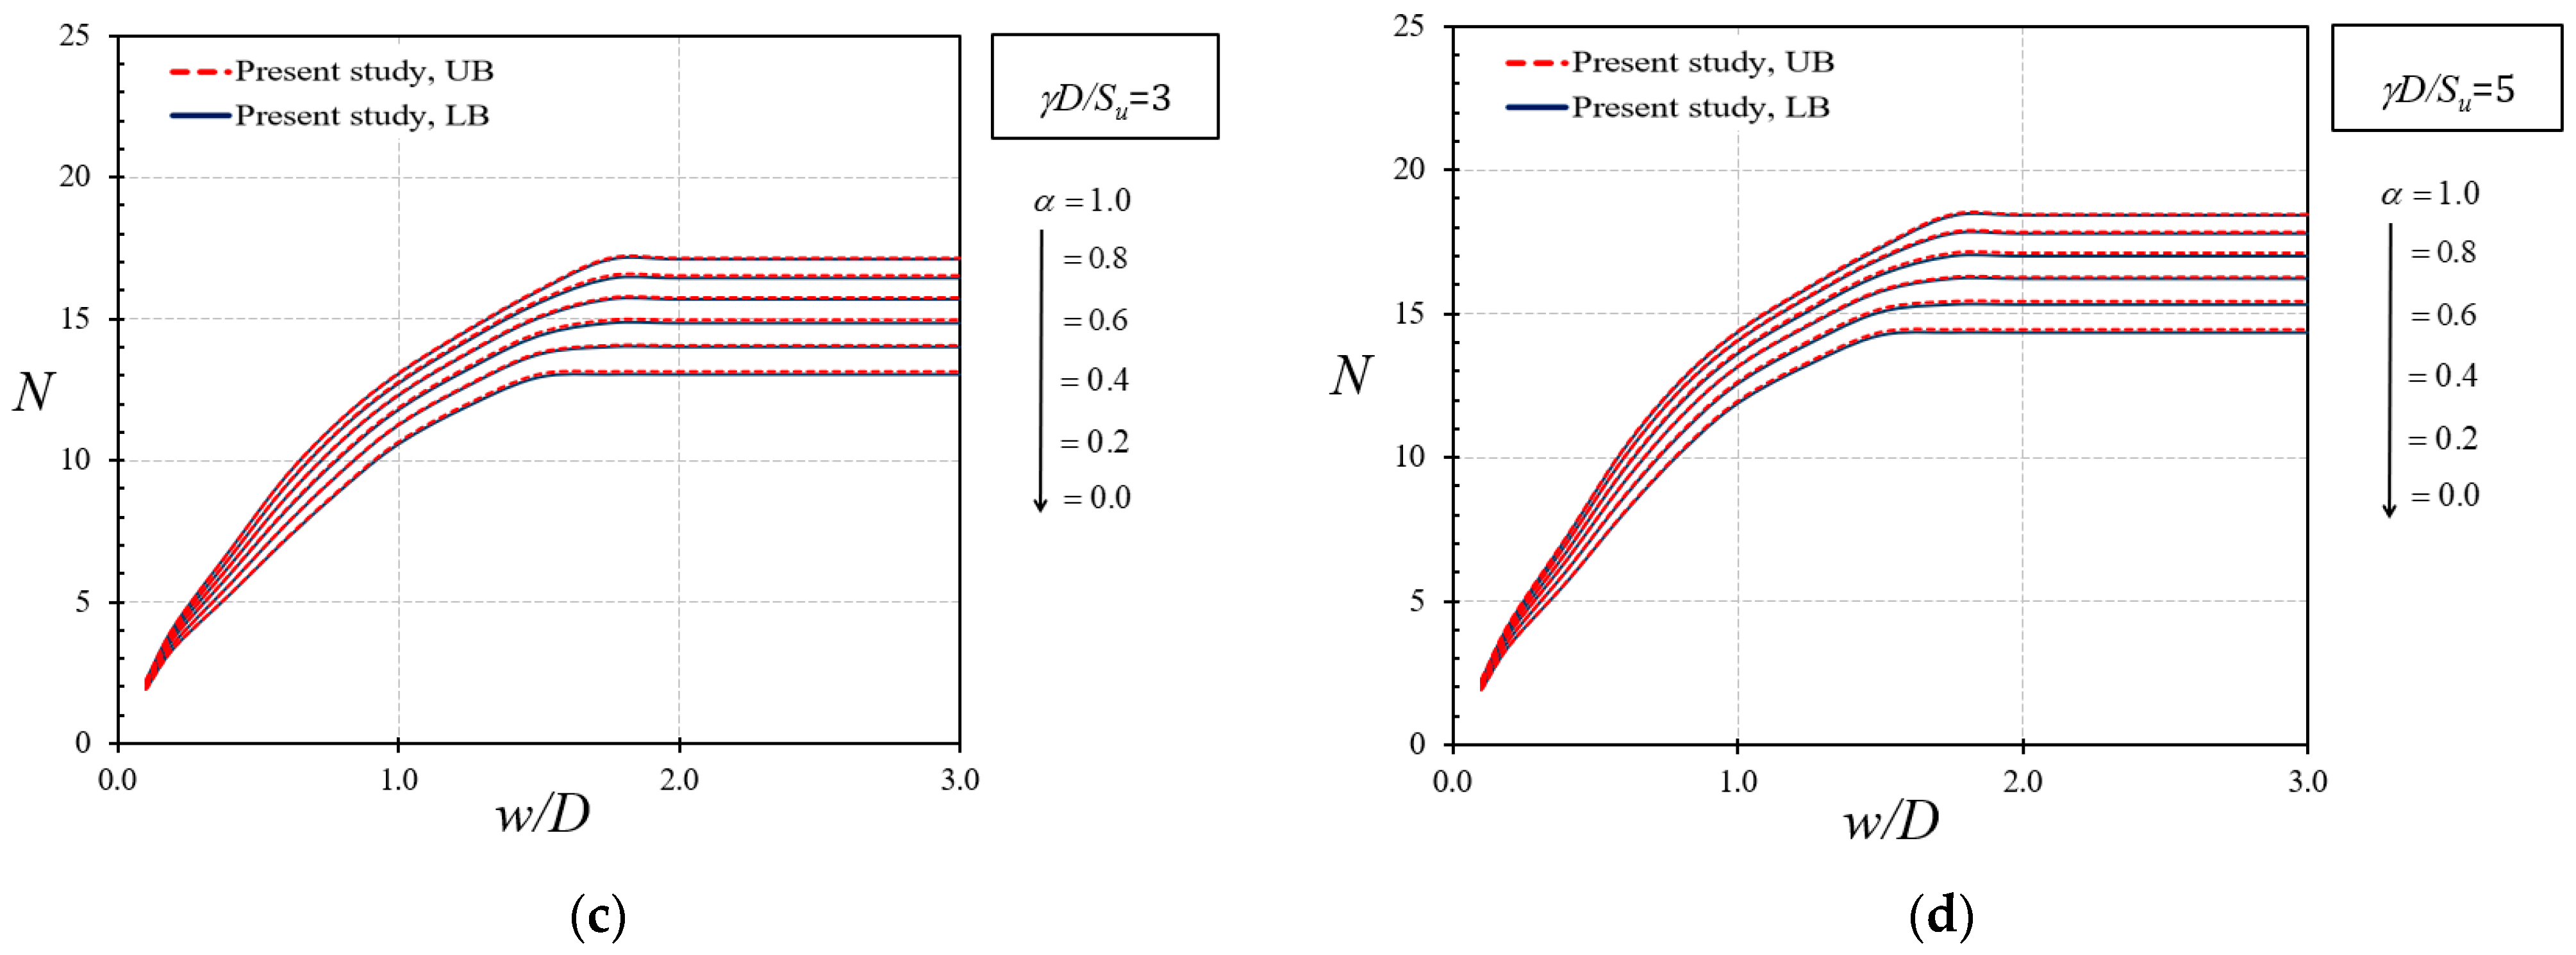
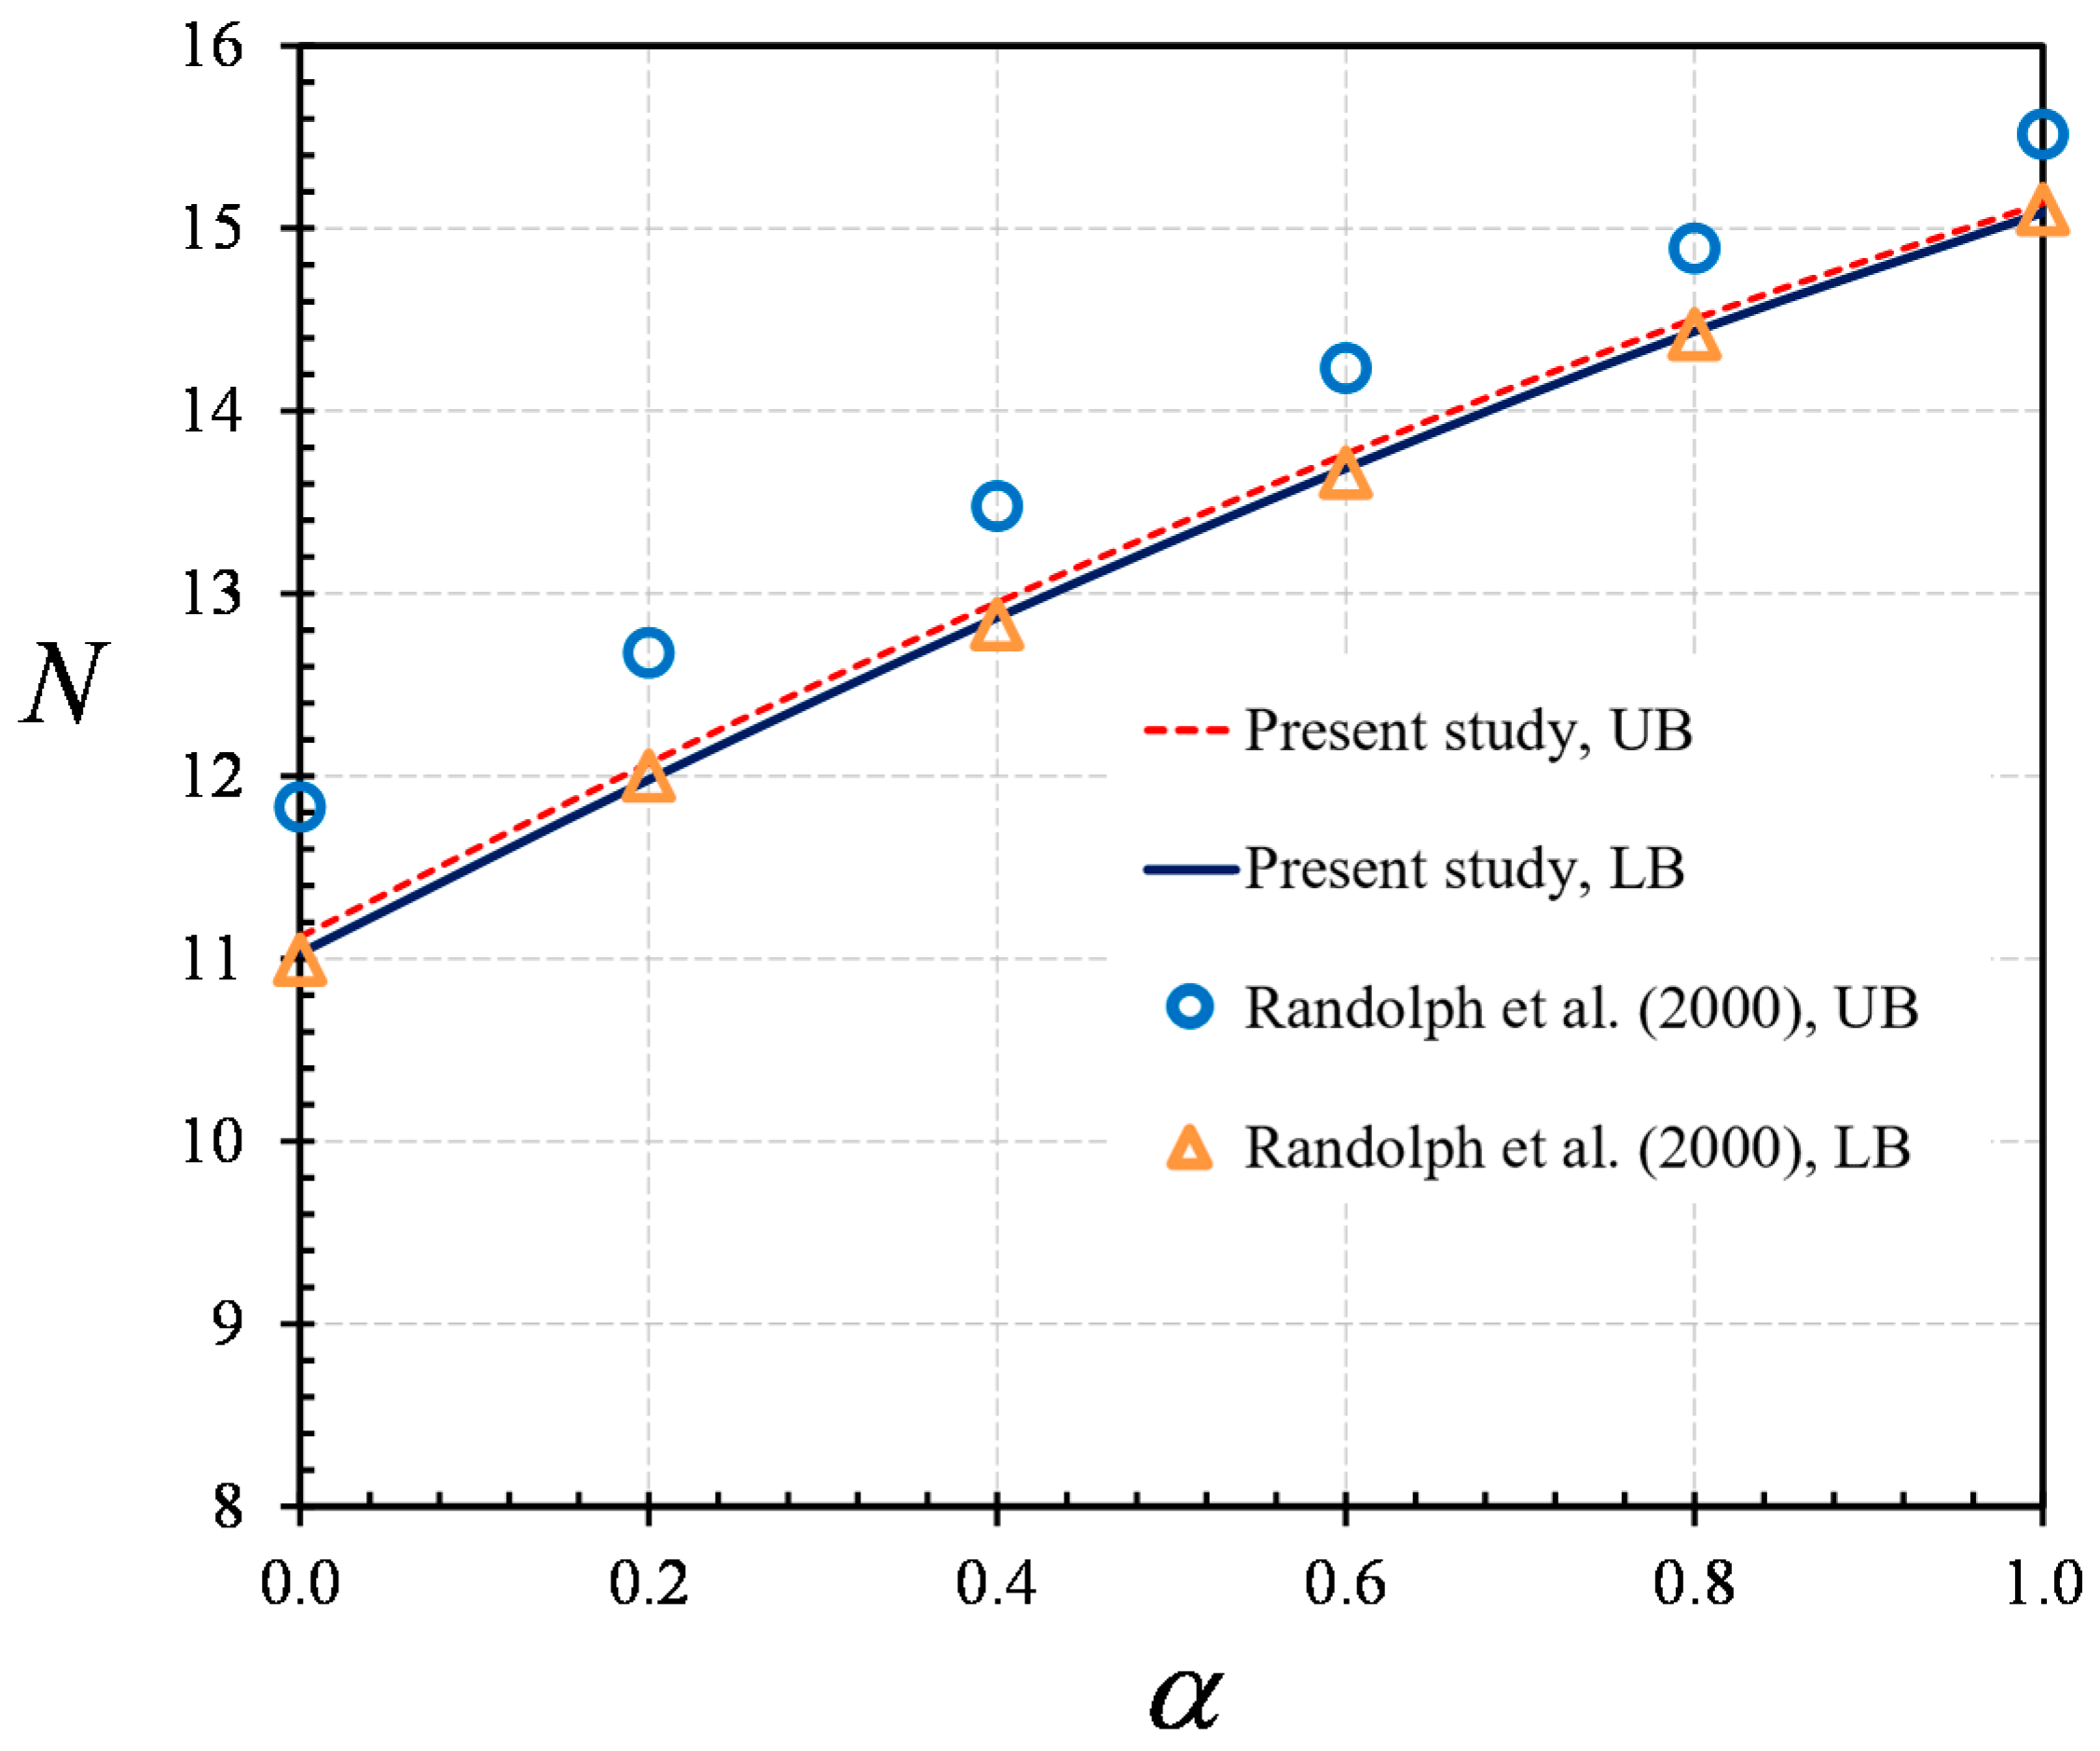
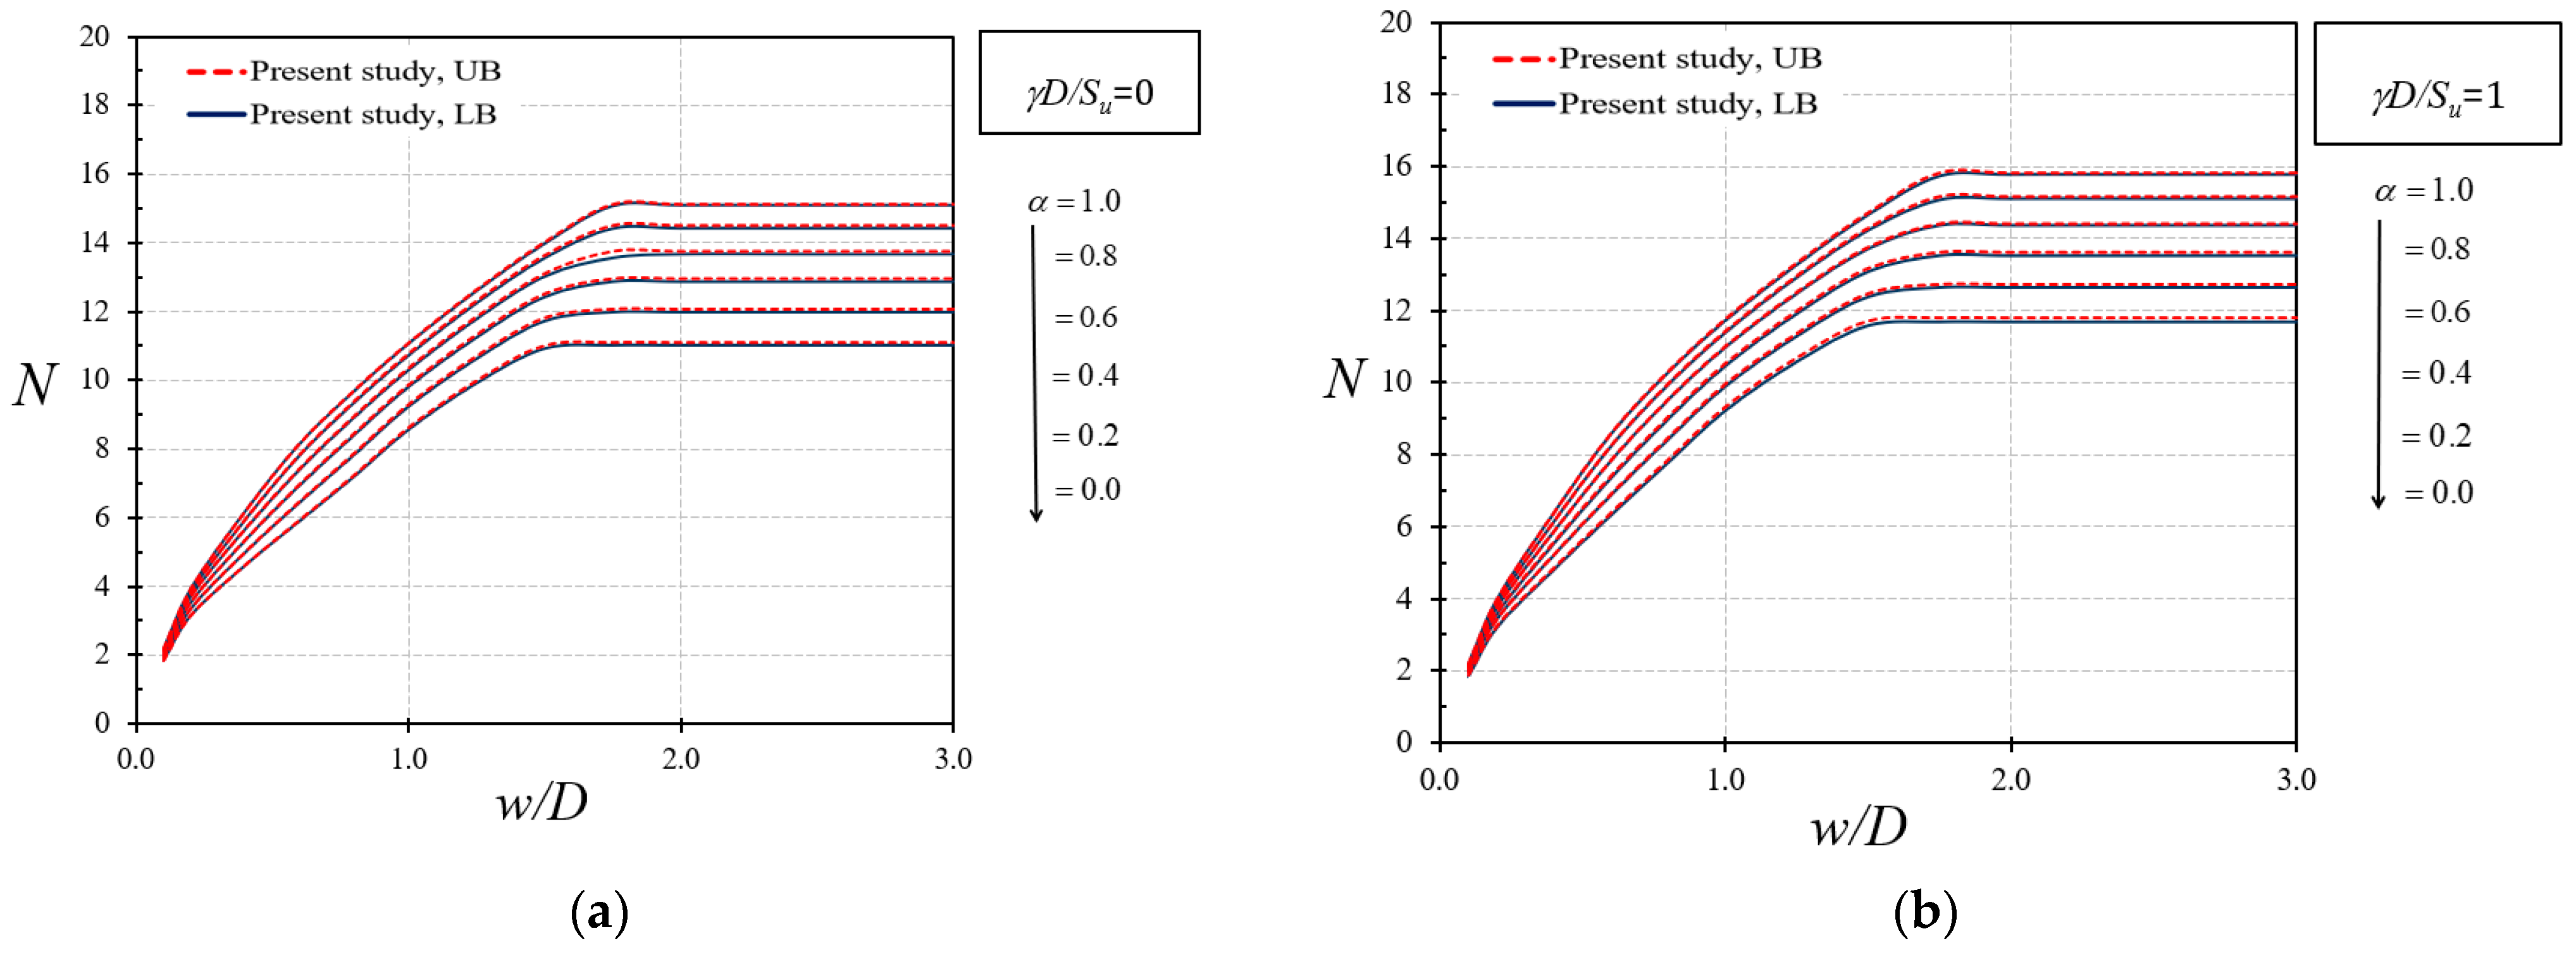
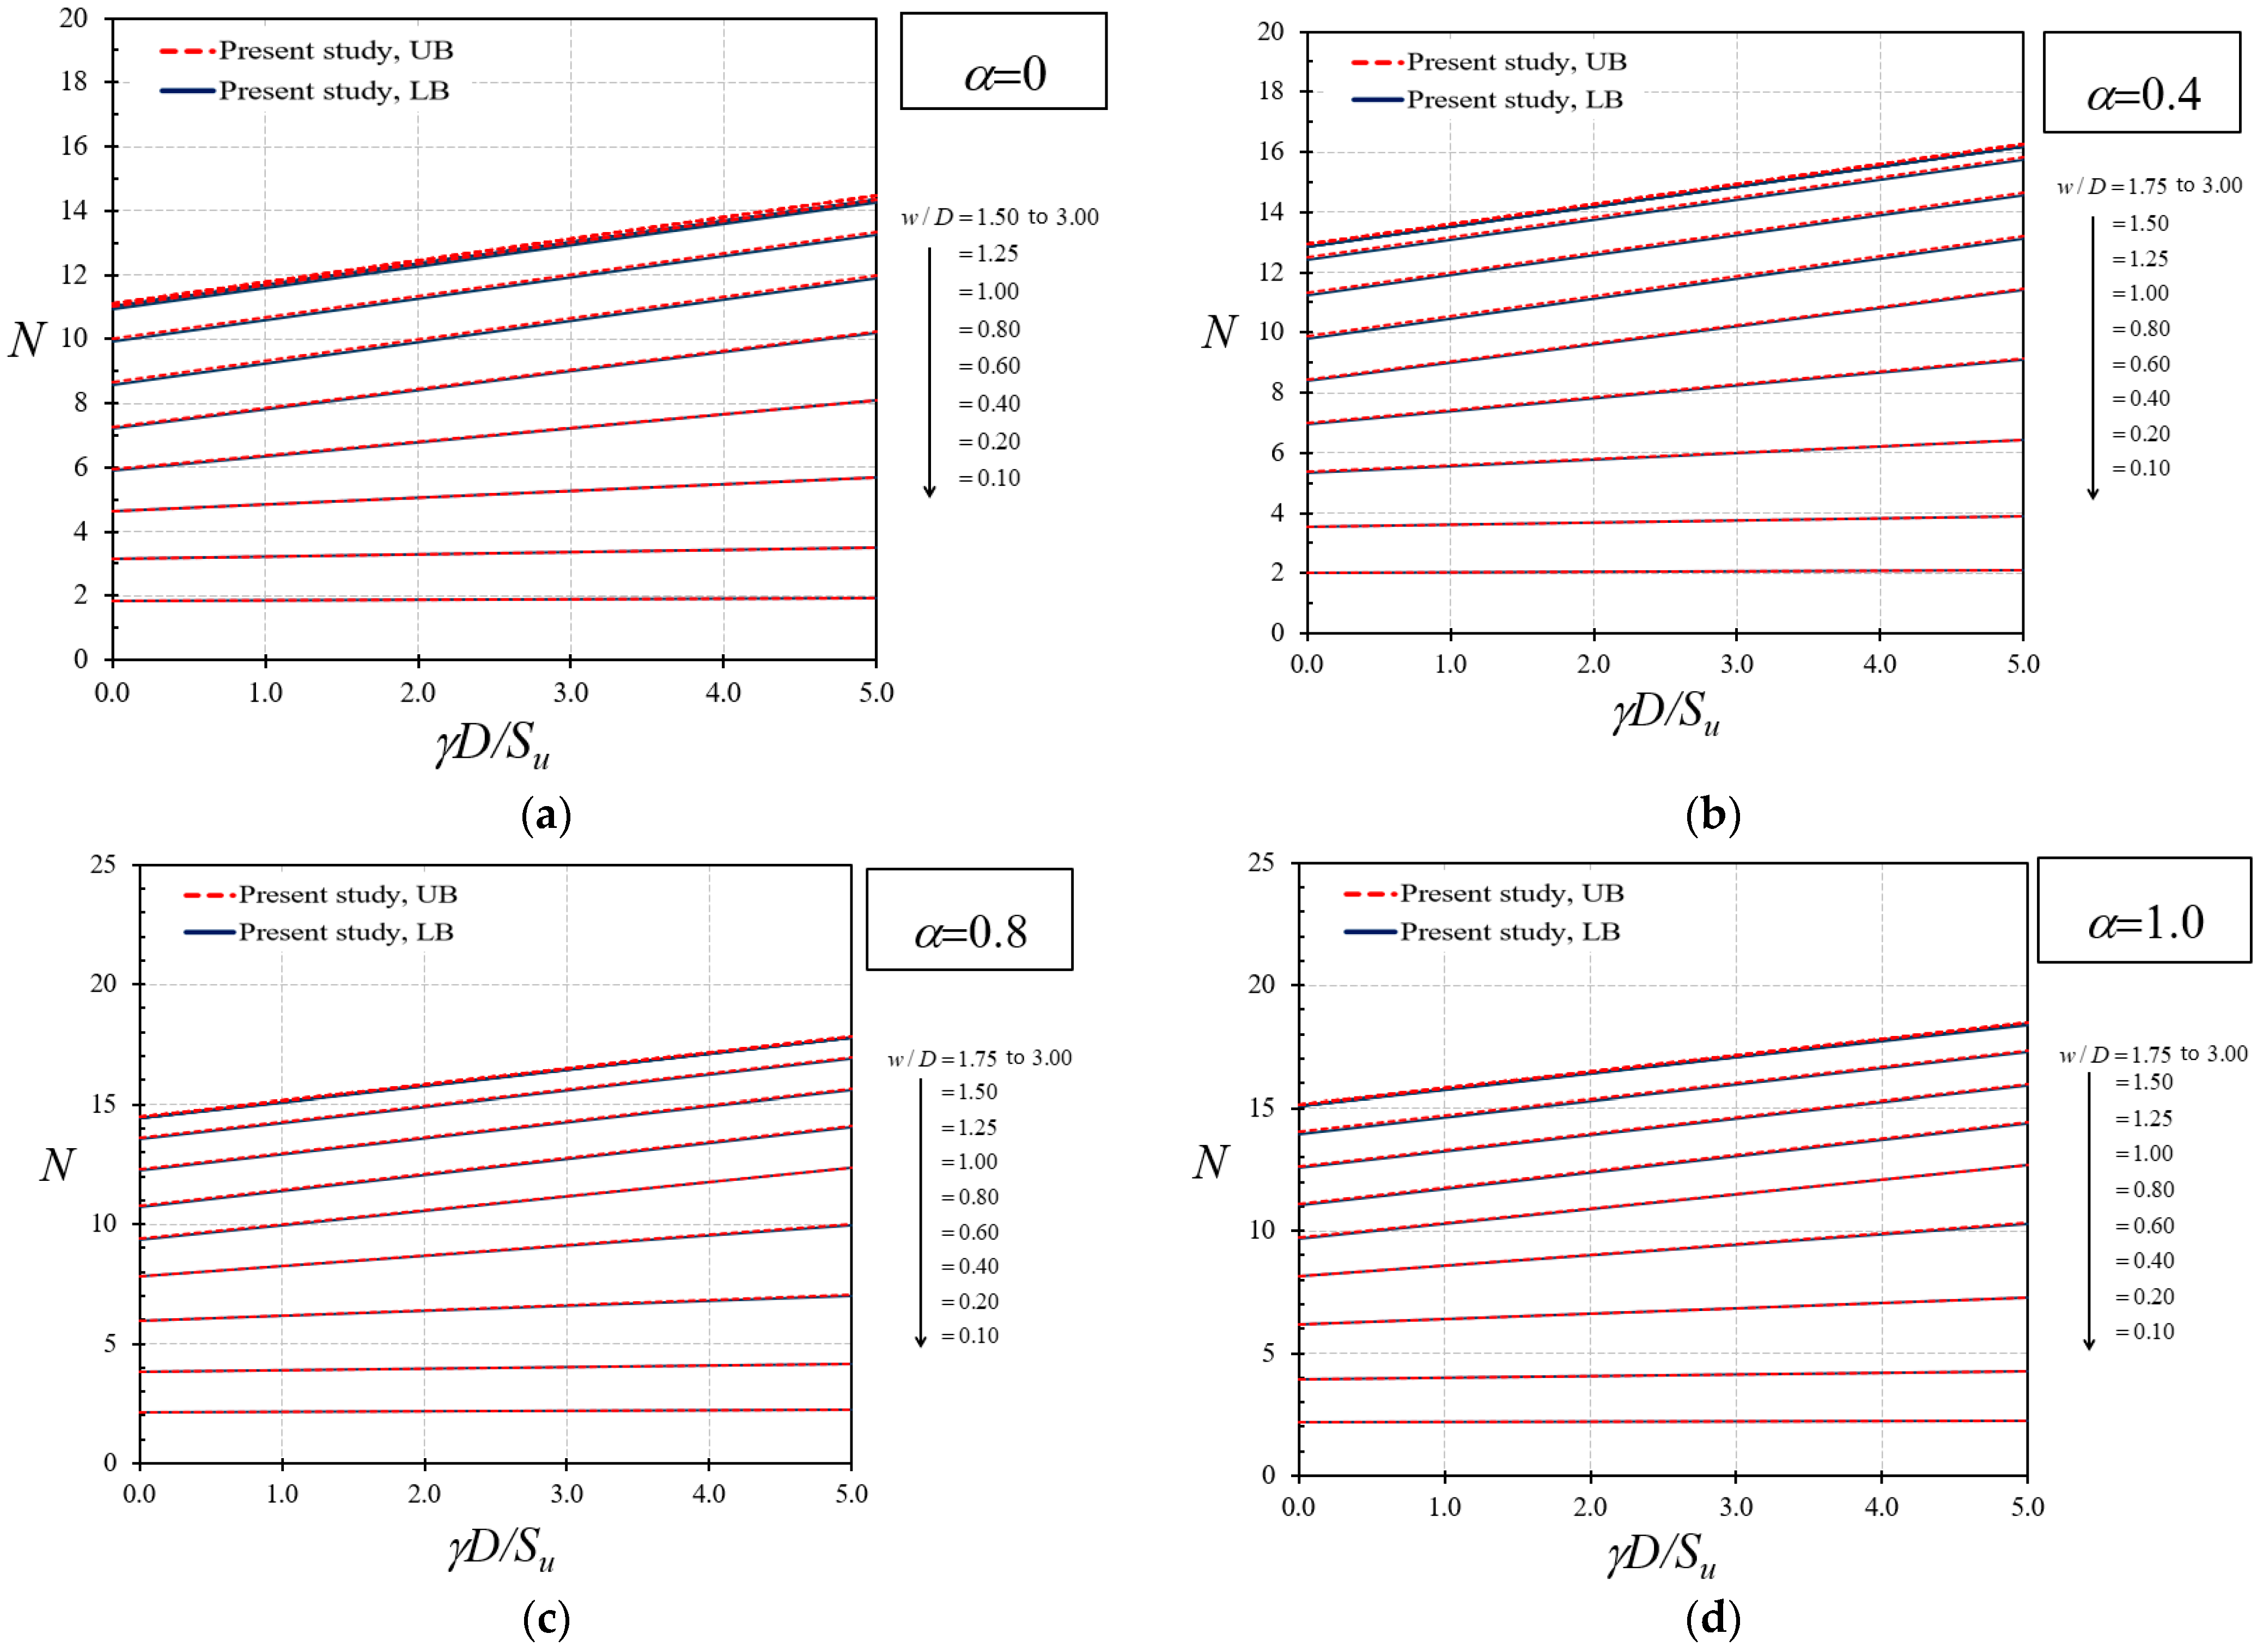
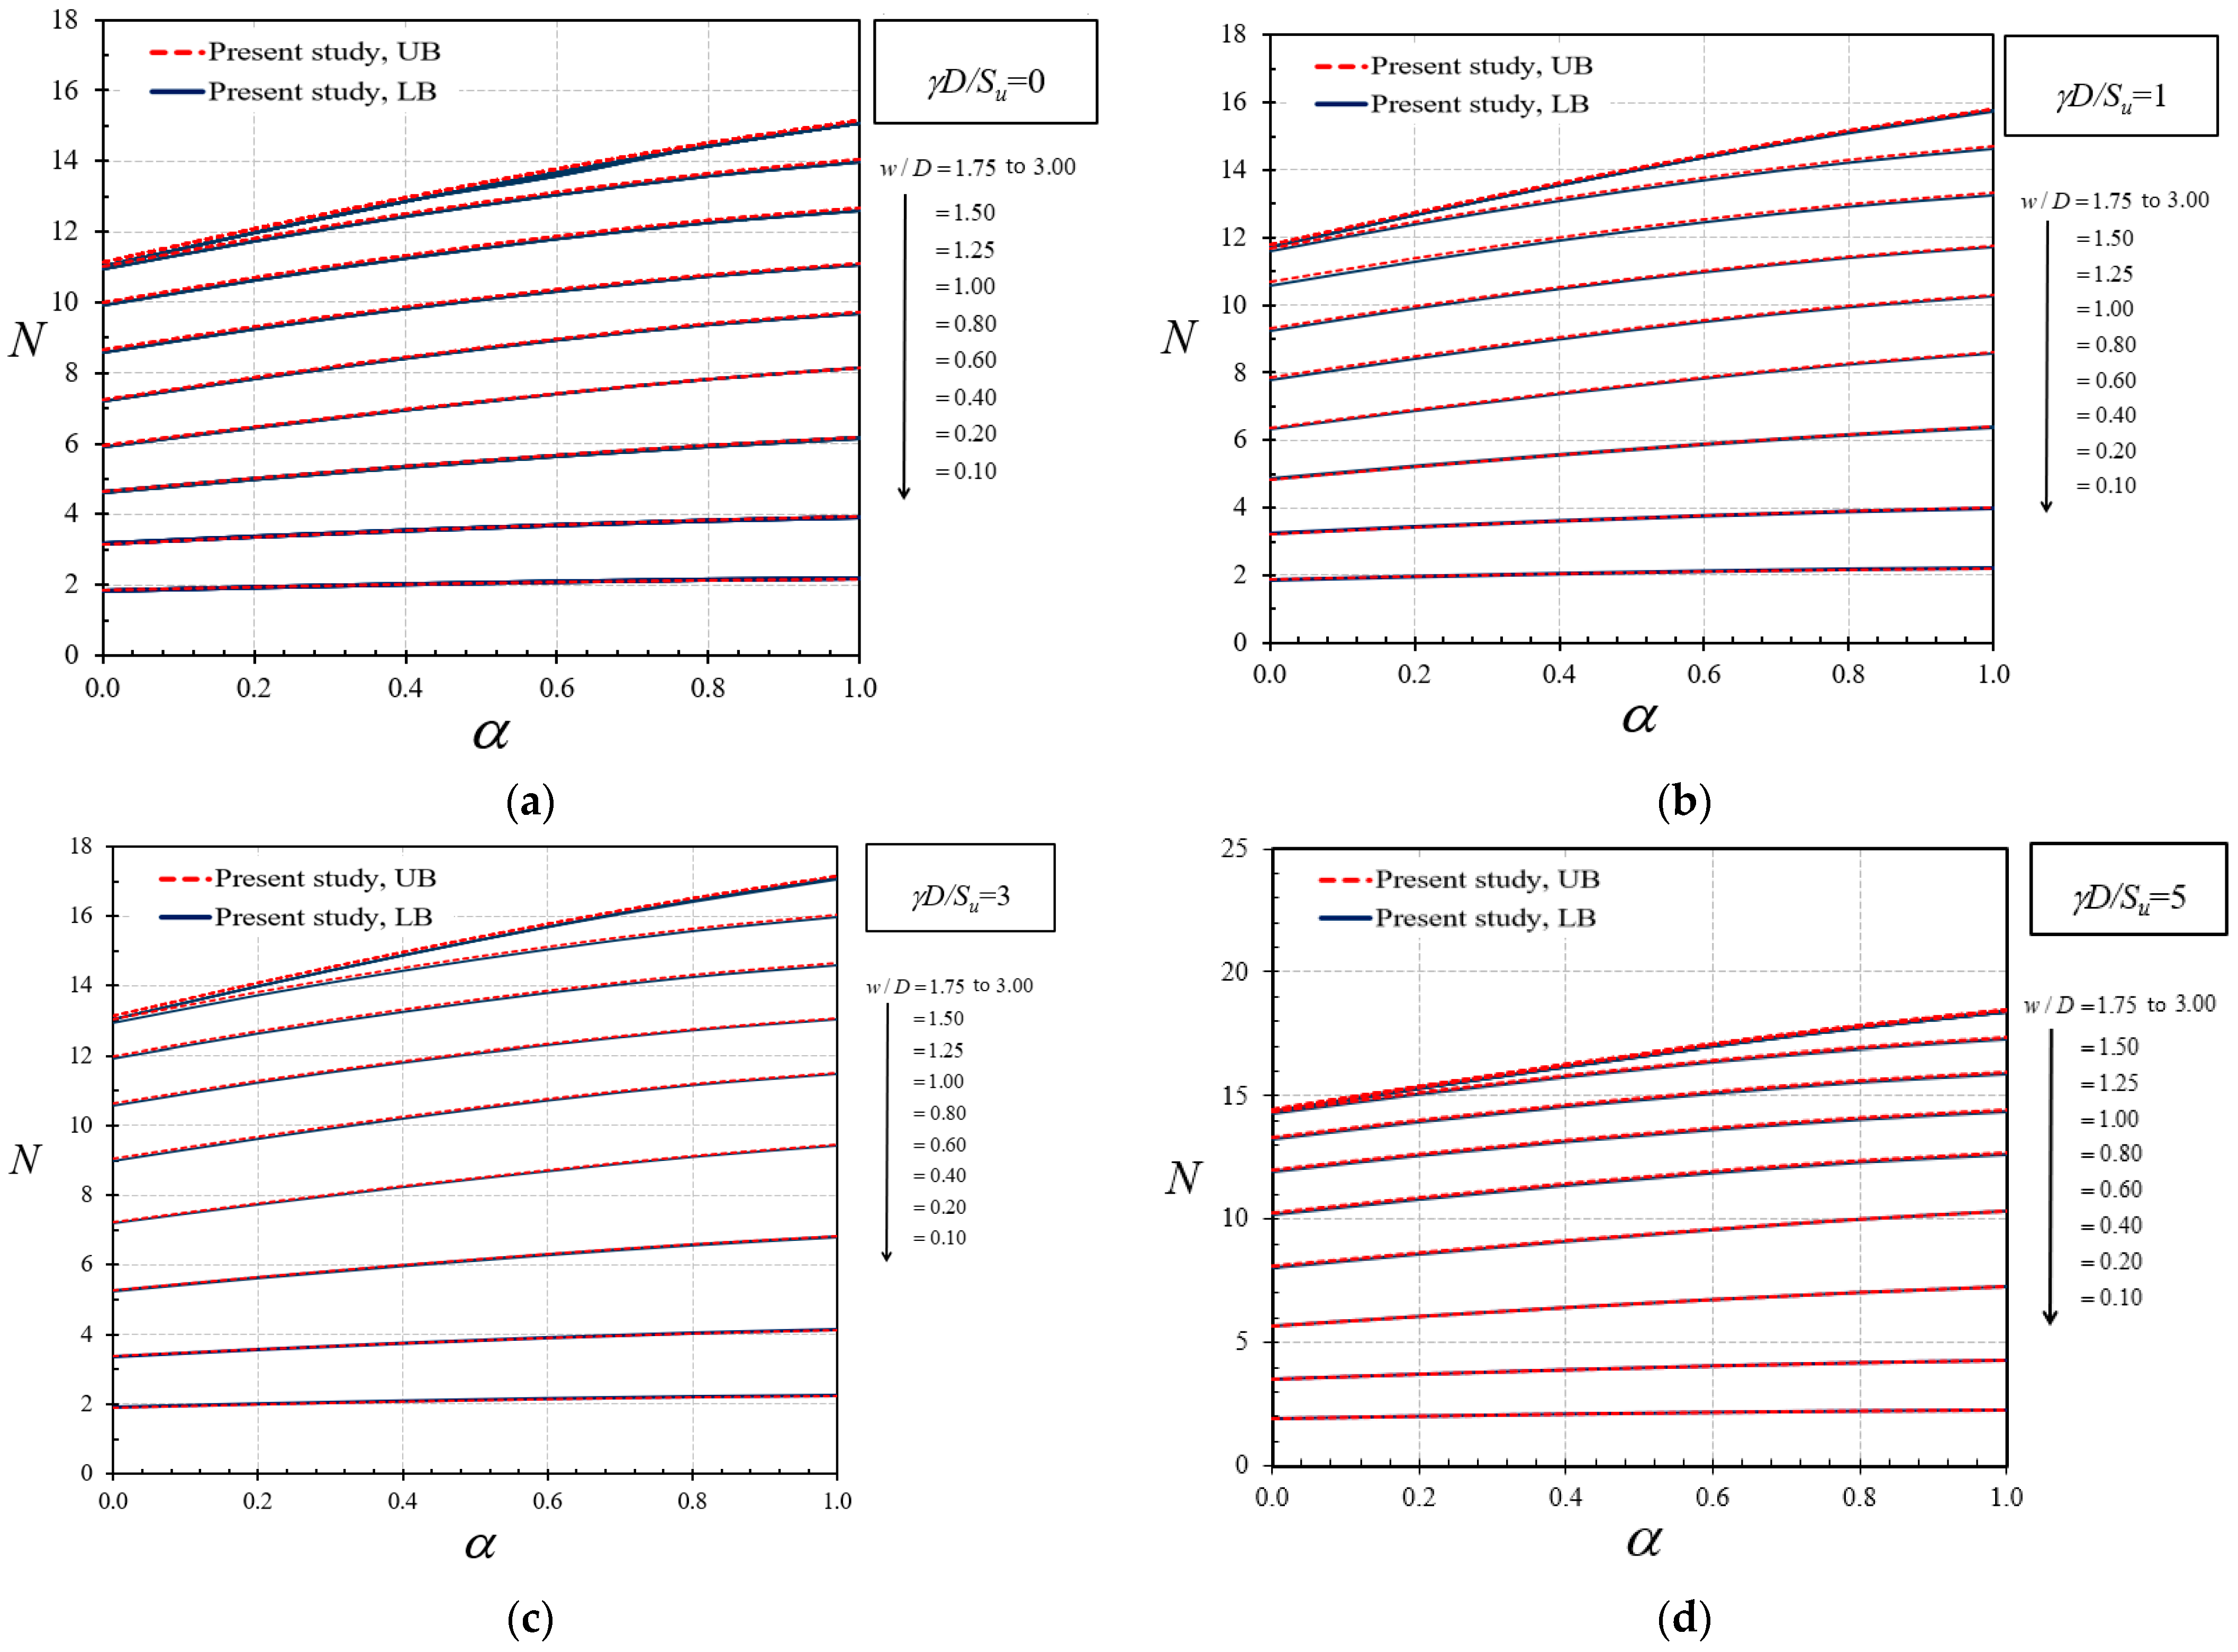
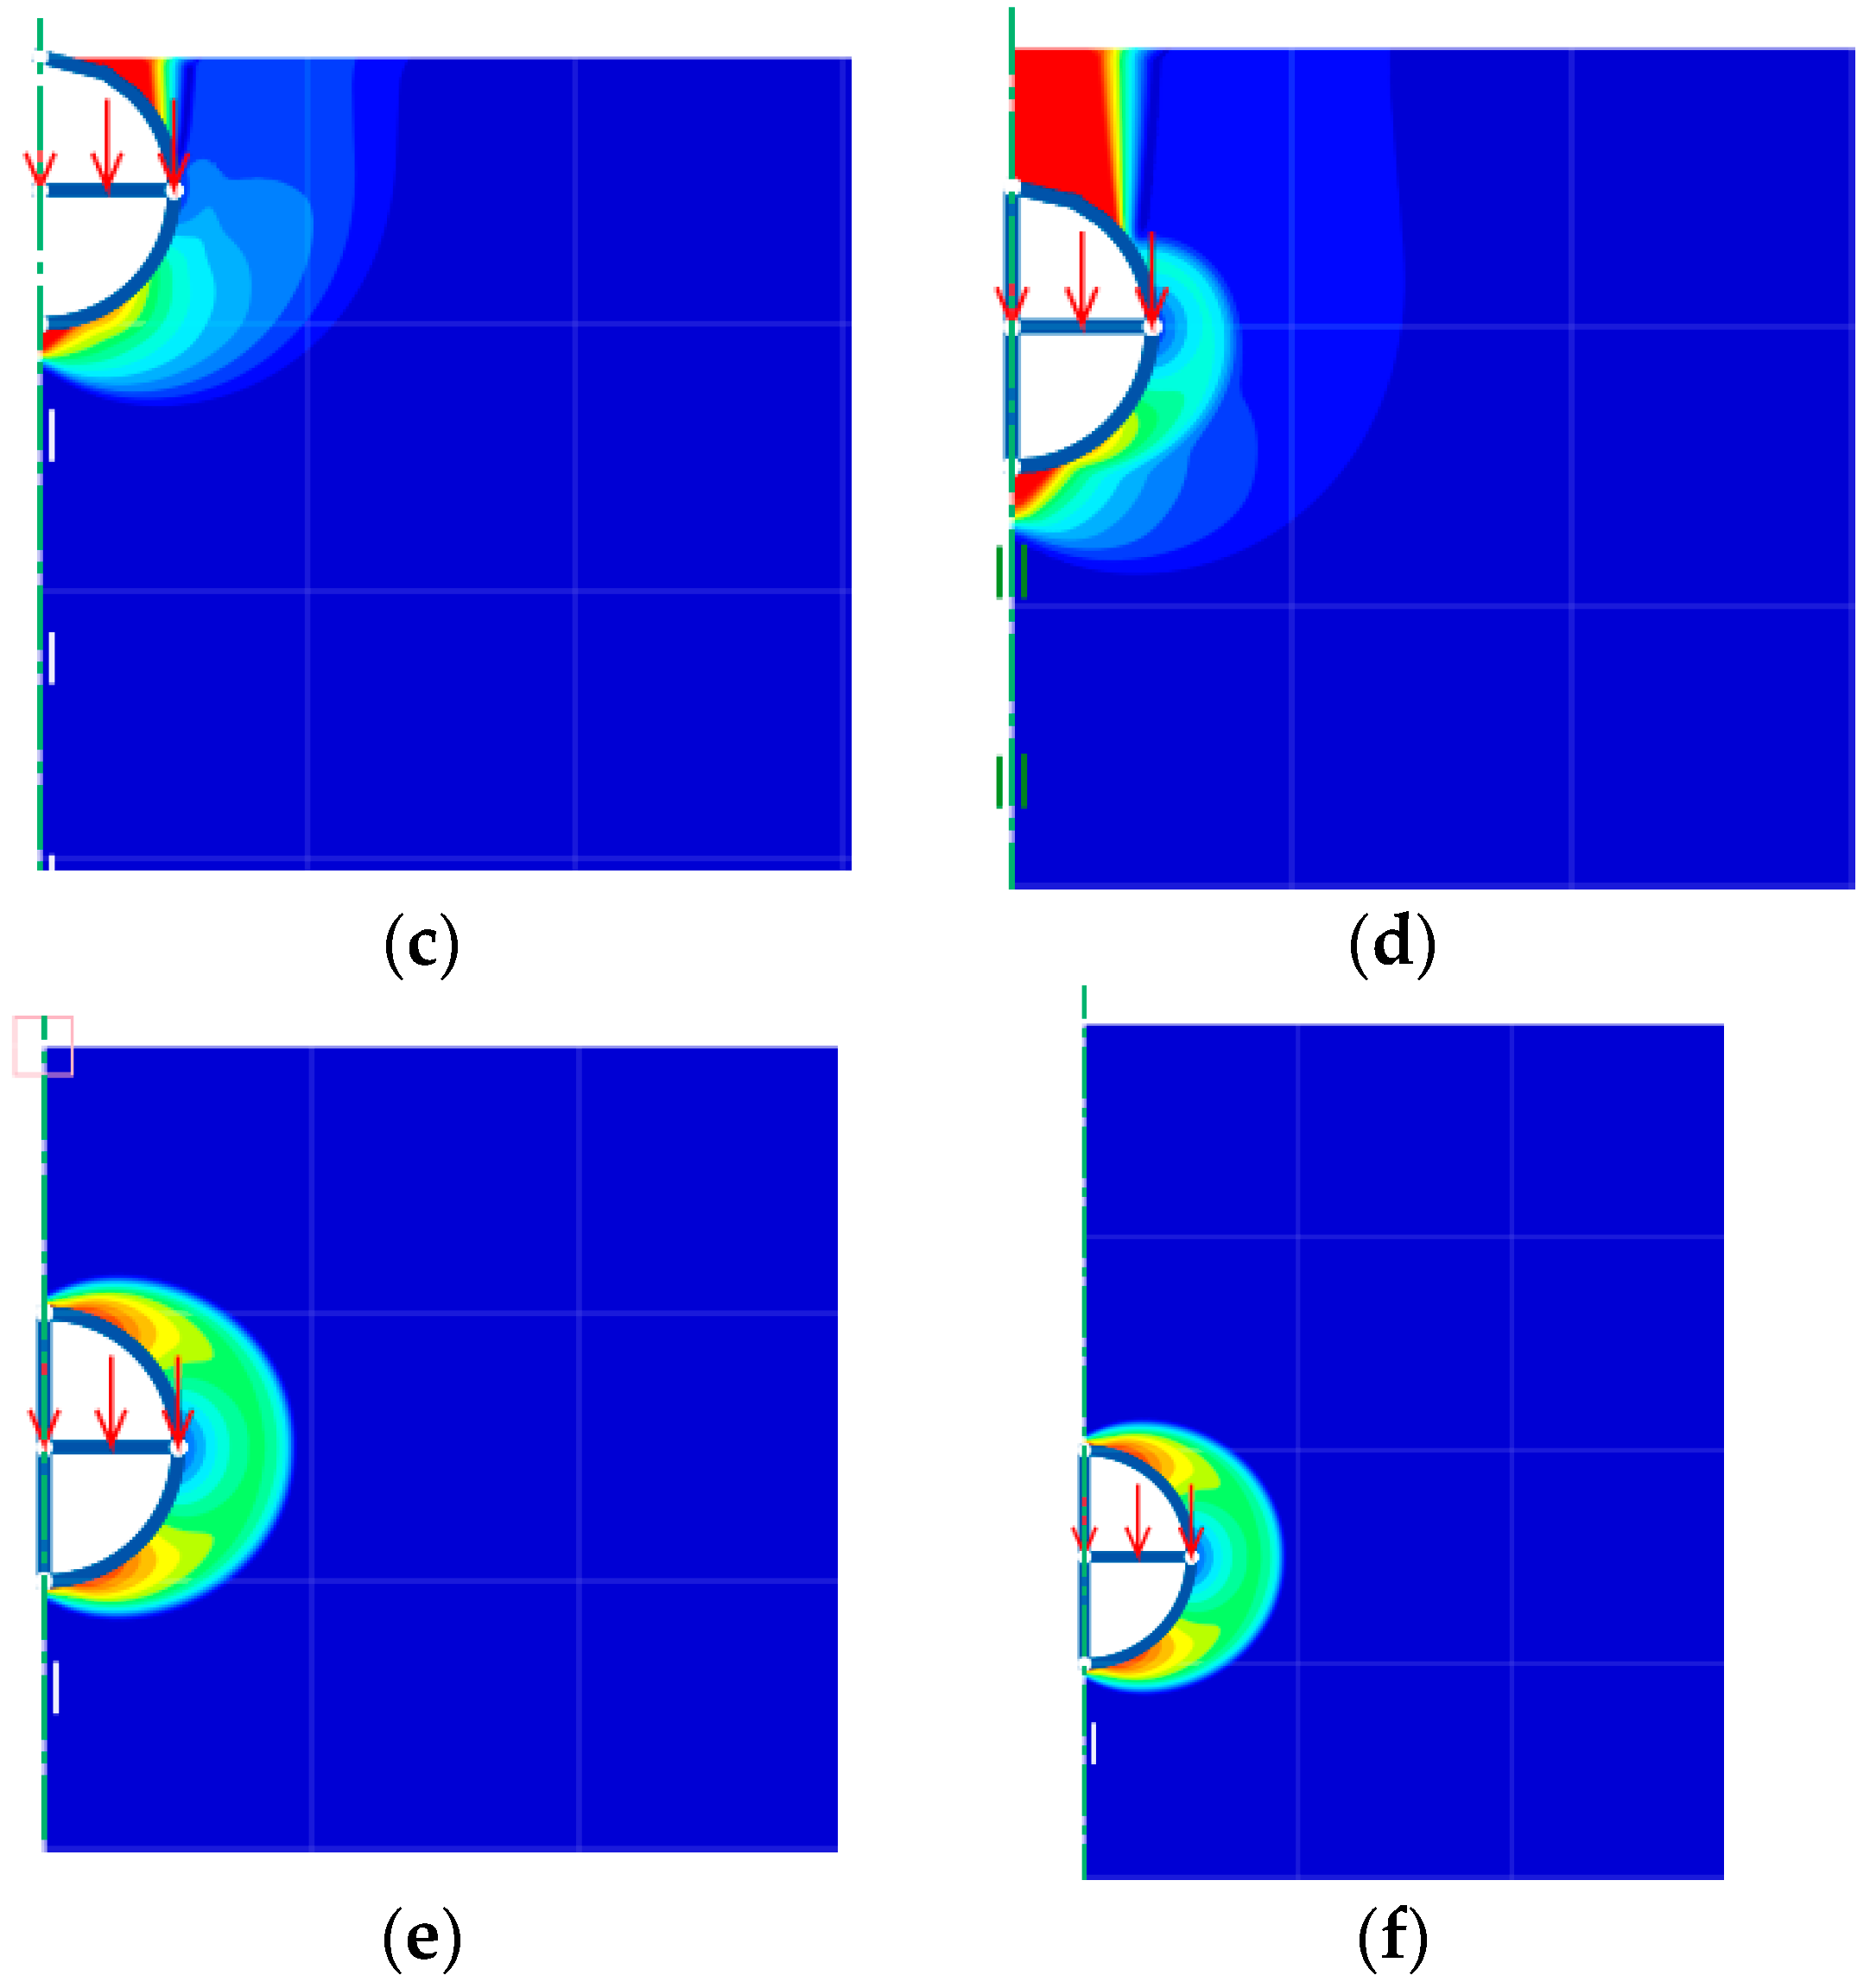
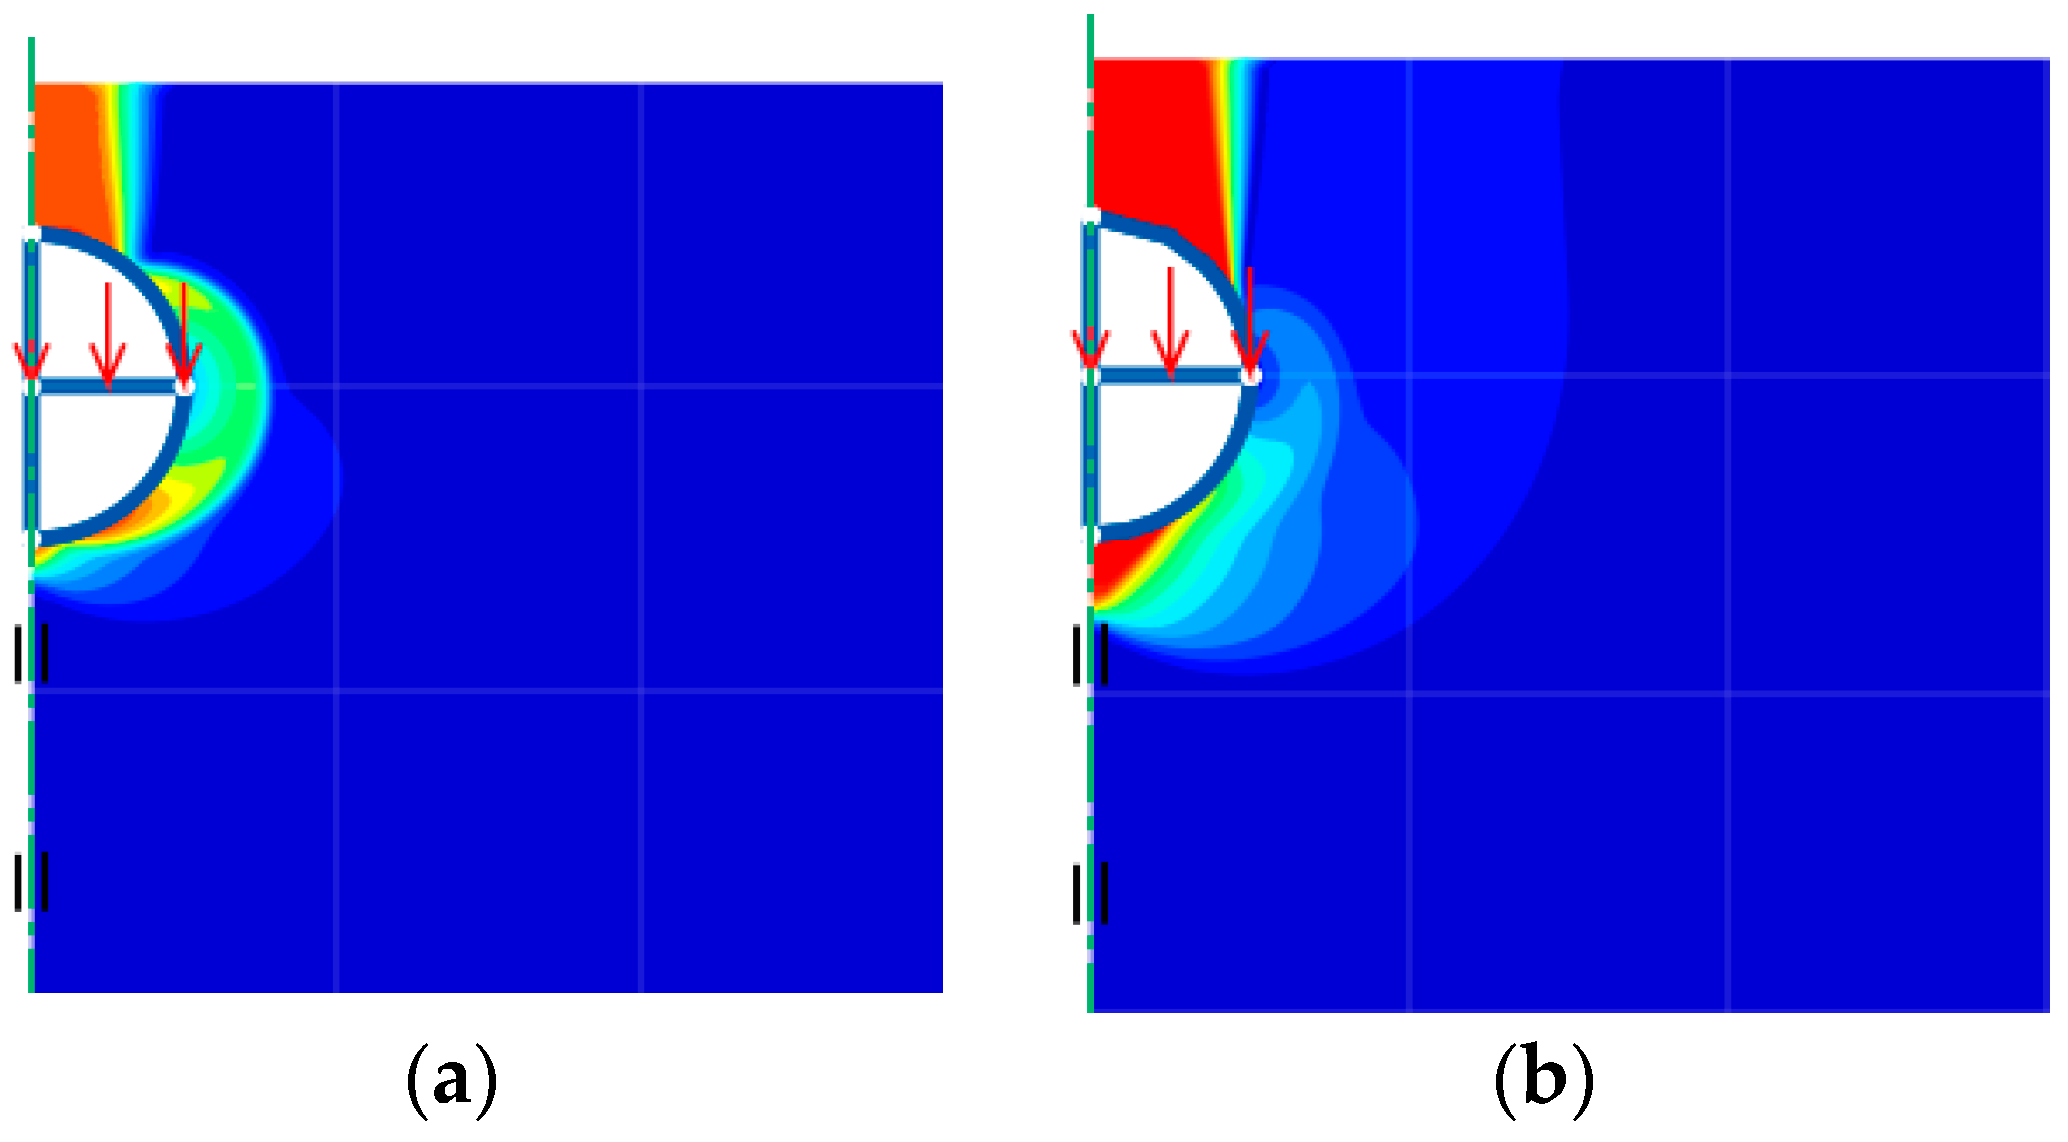
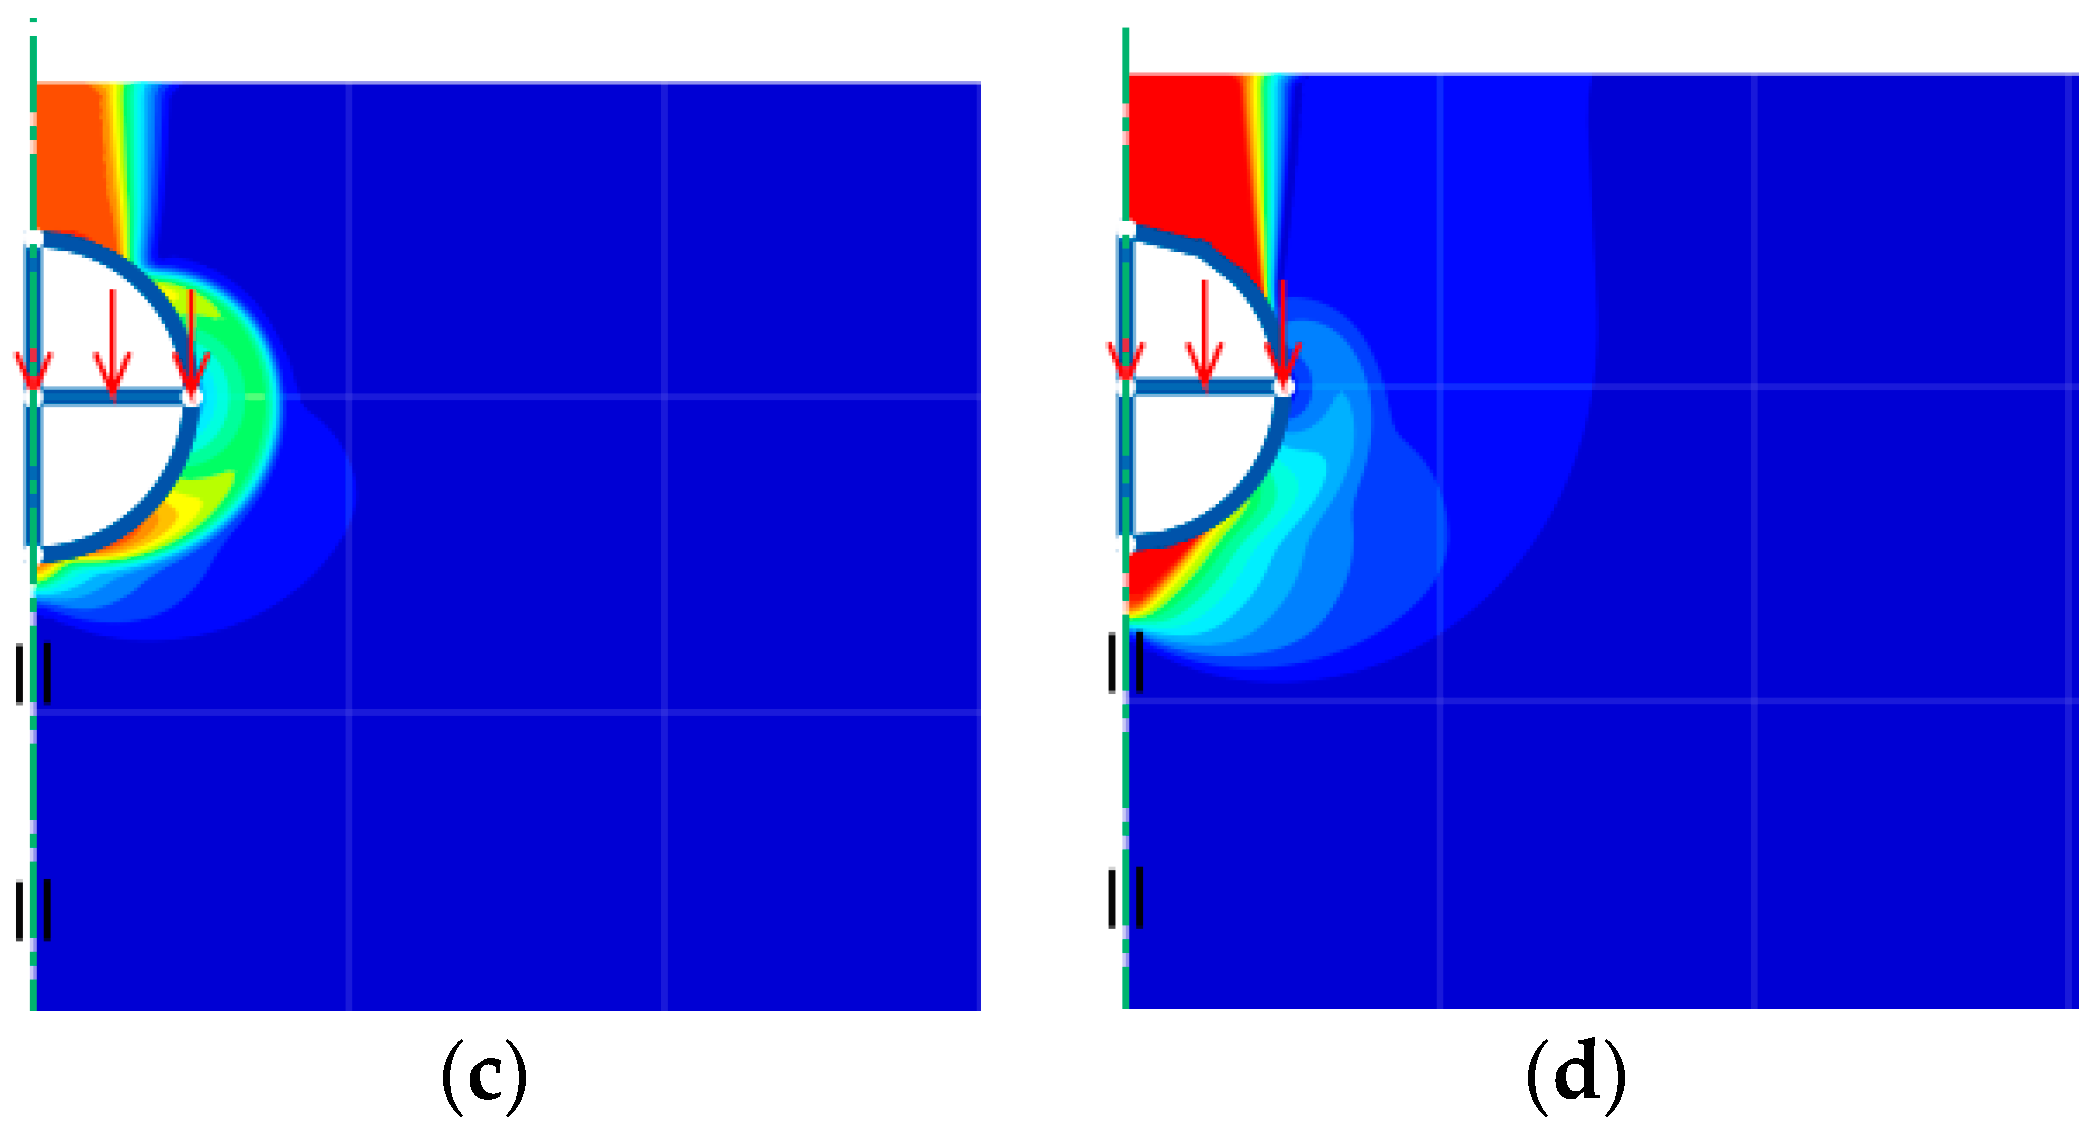
4. Numerical Results and Discussion
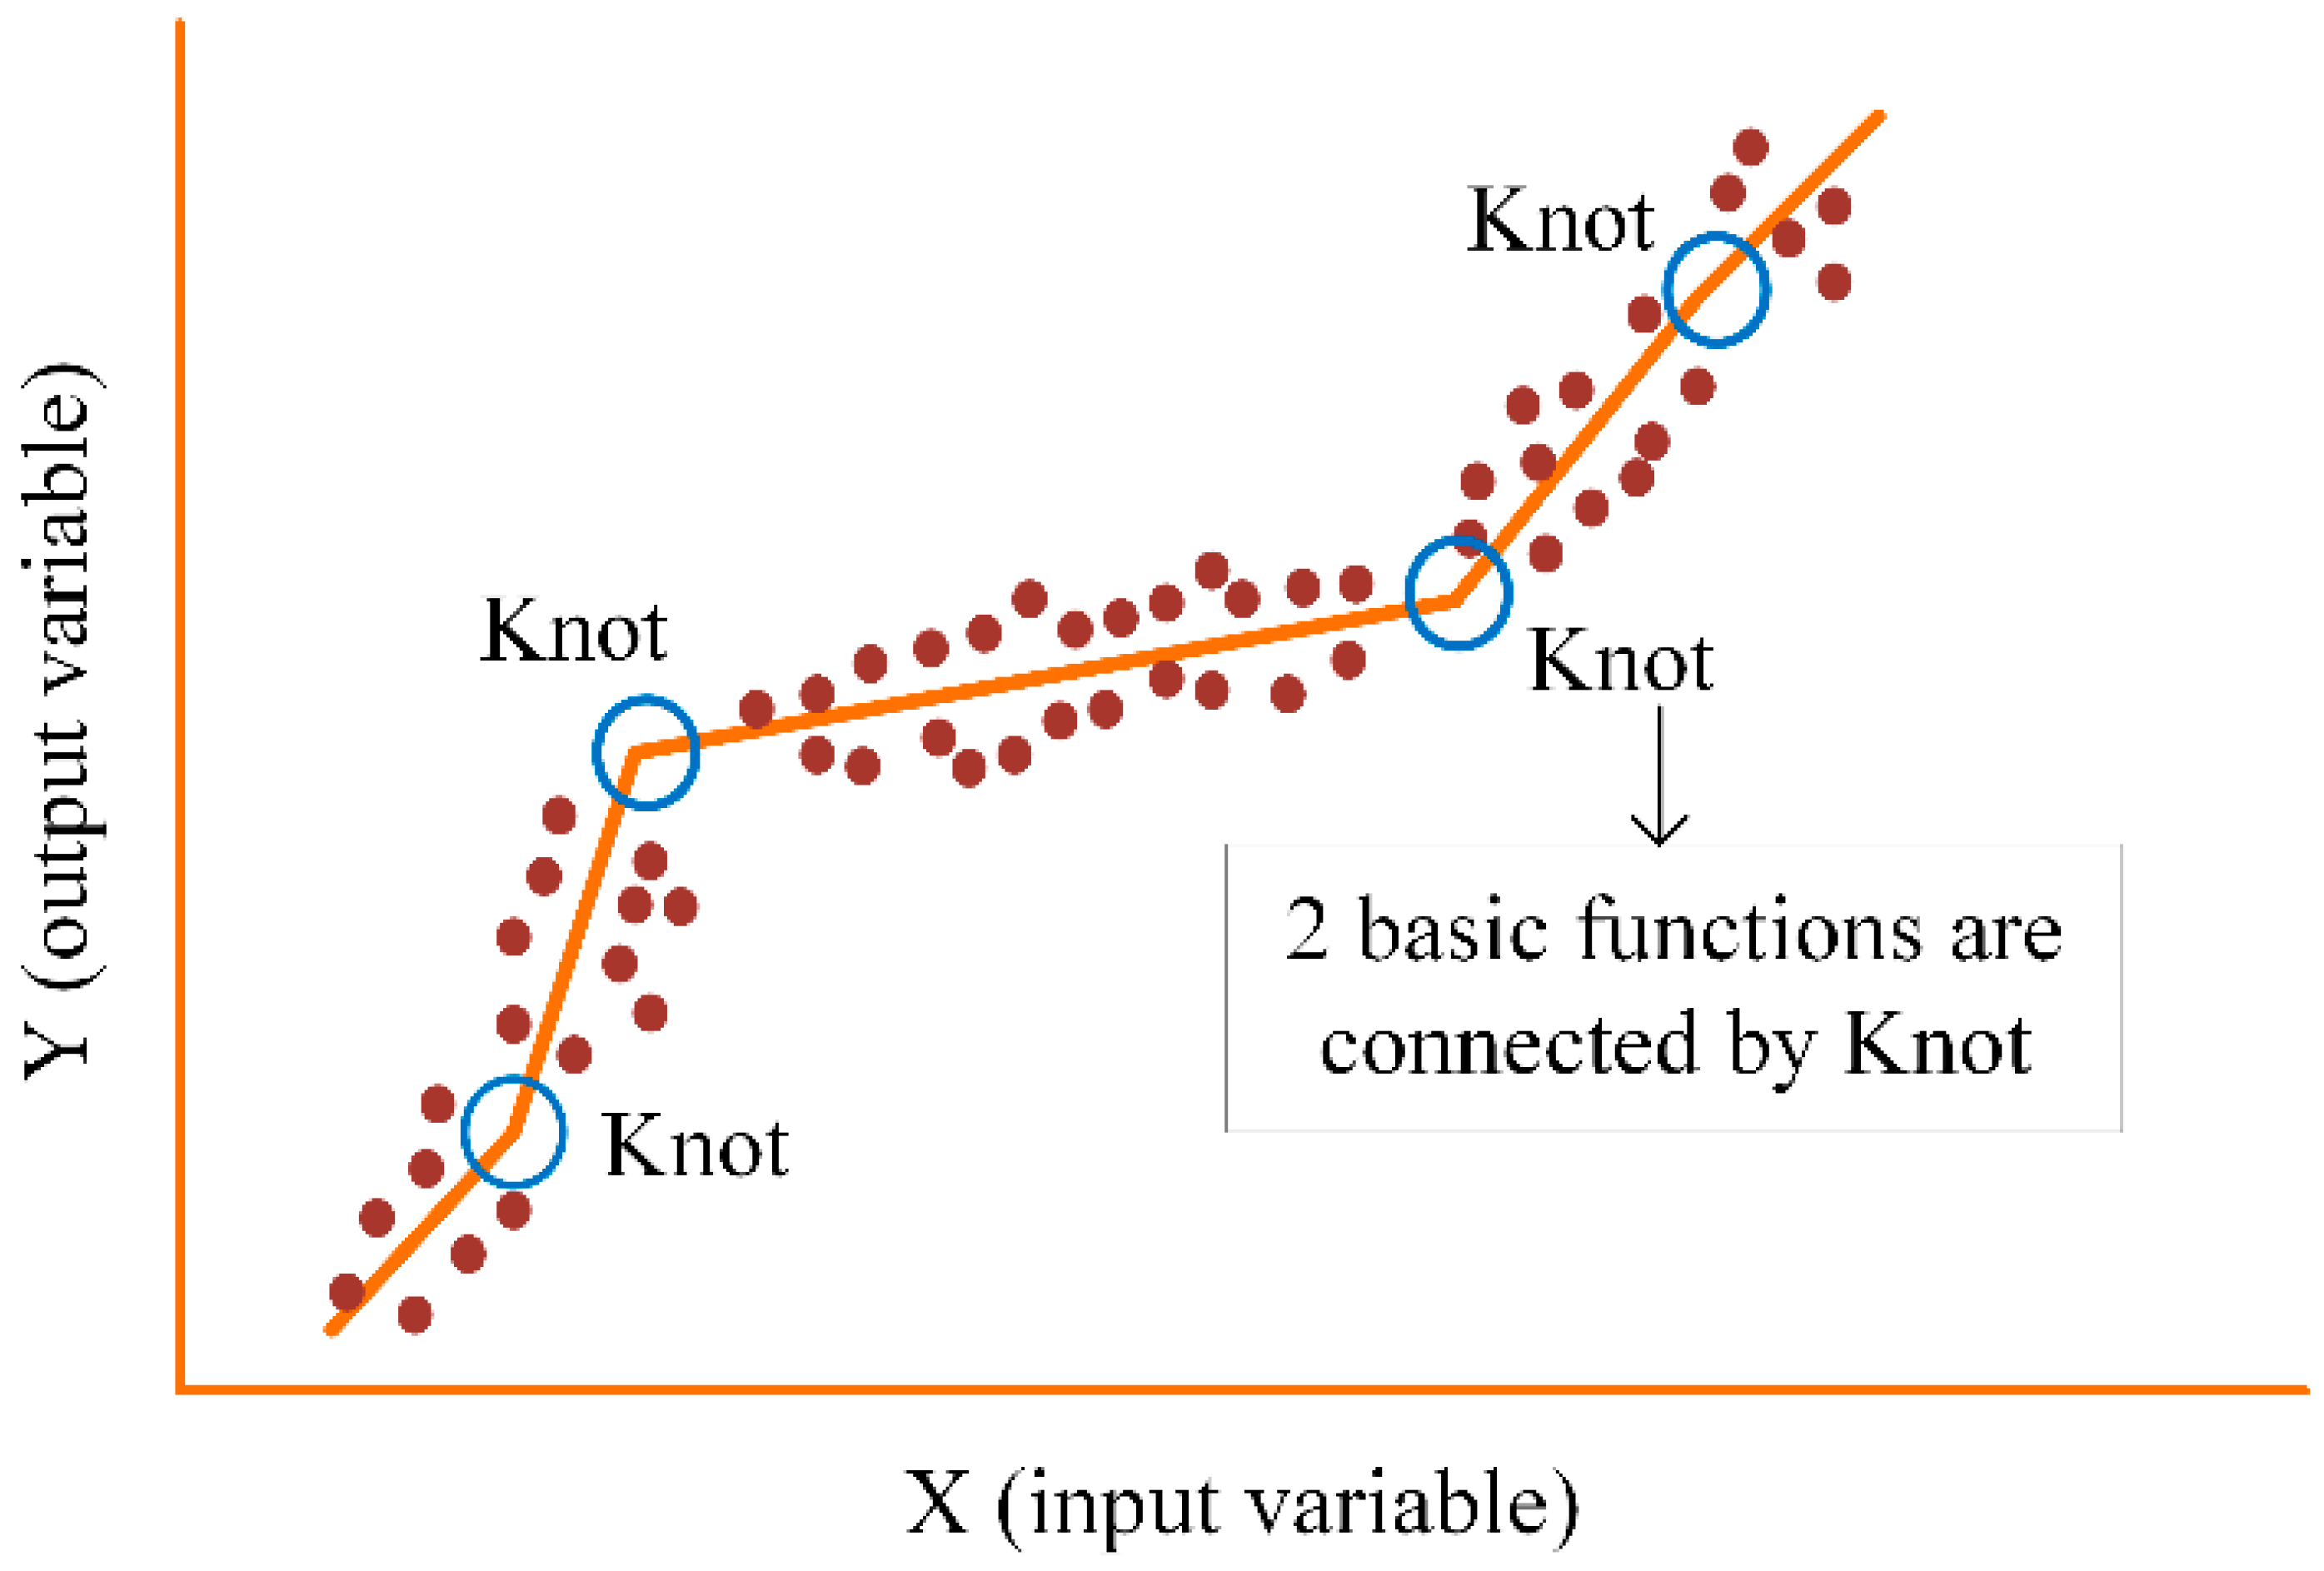
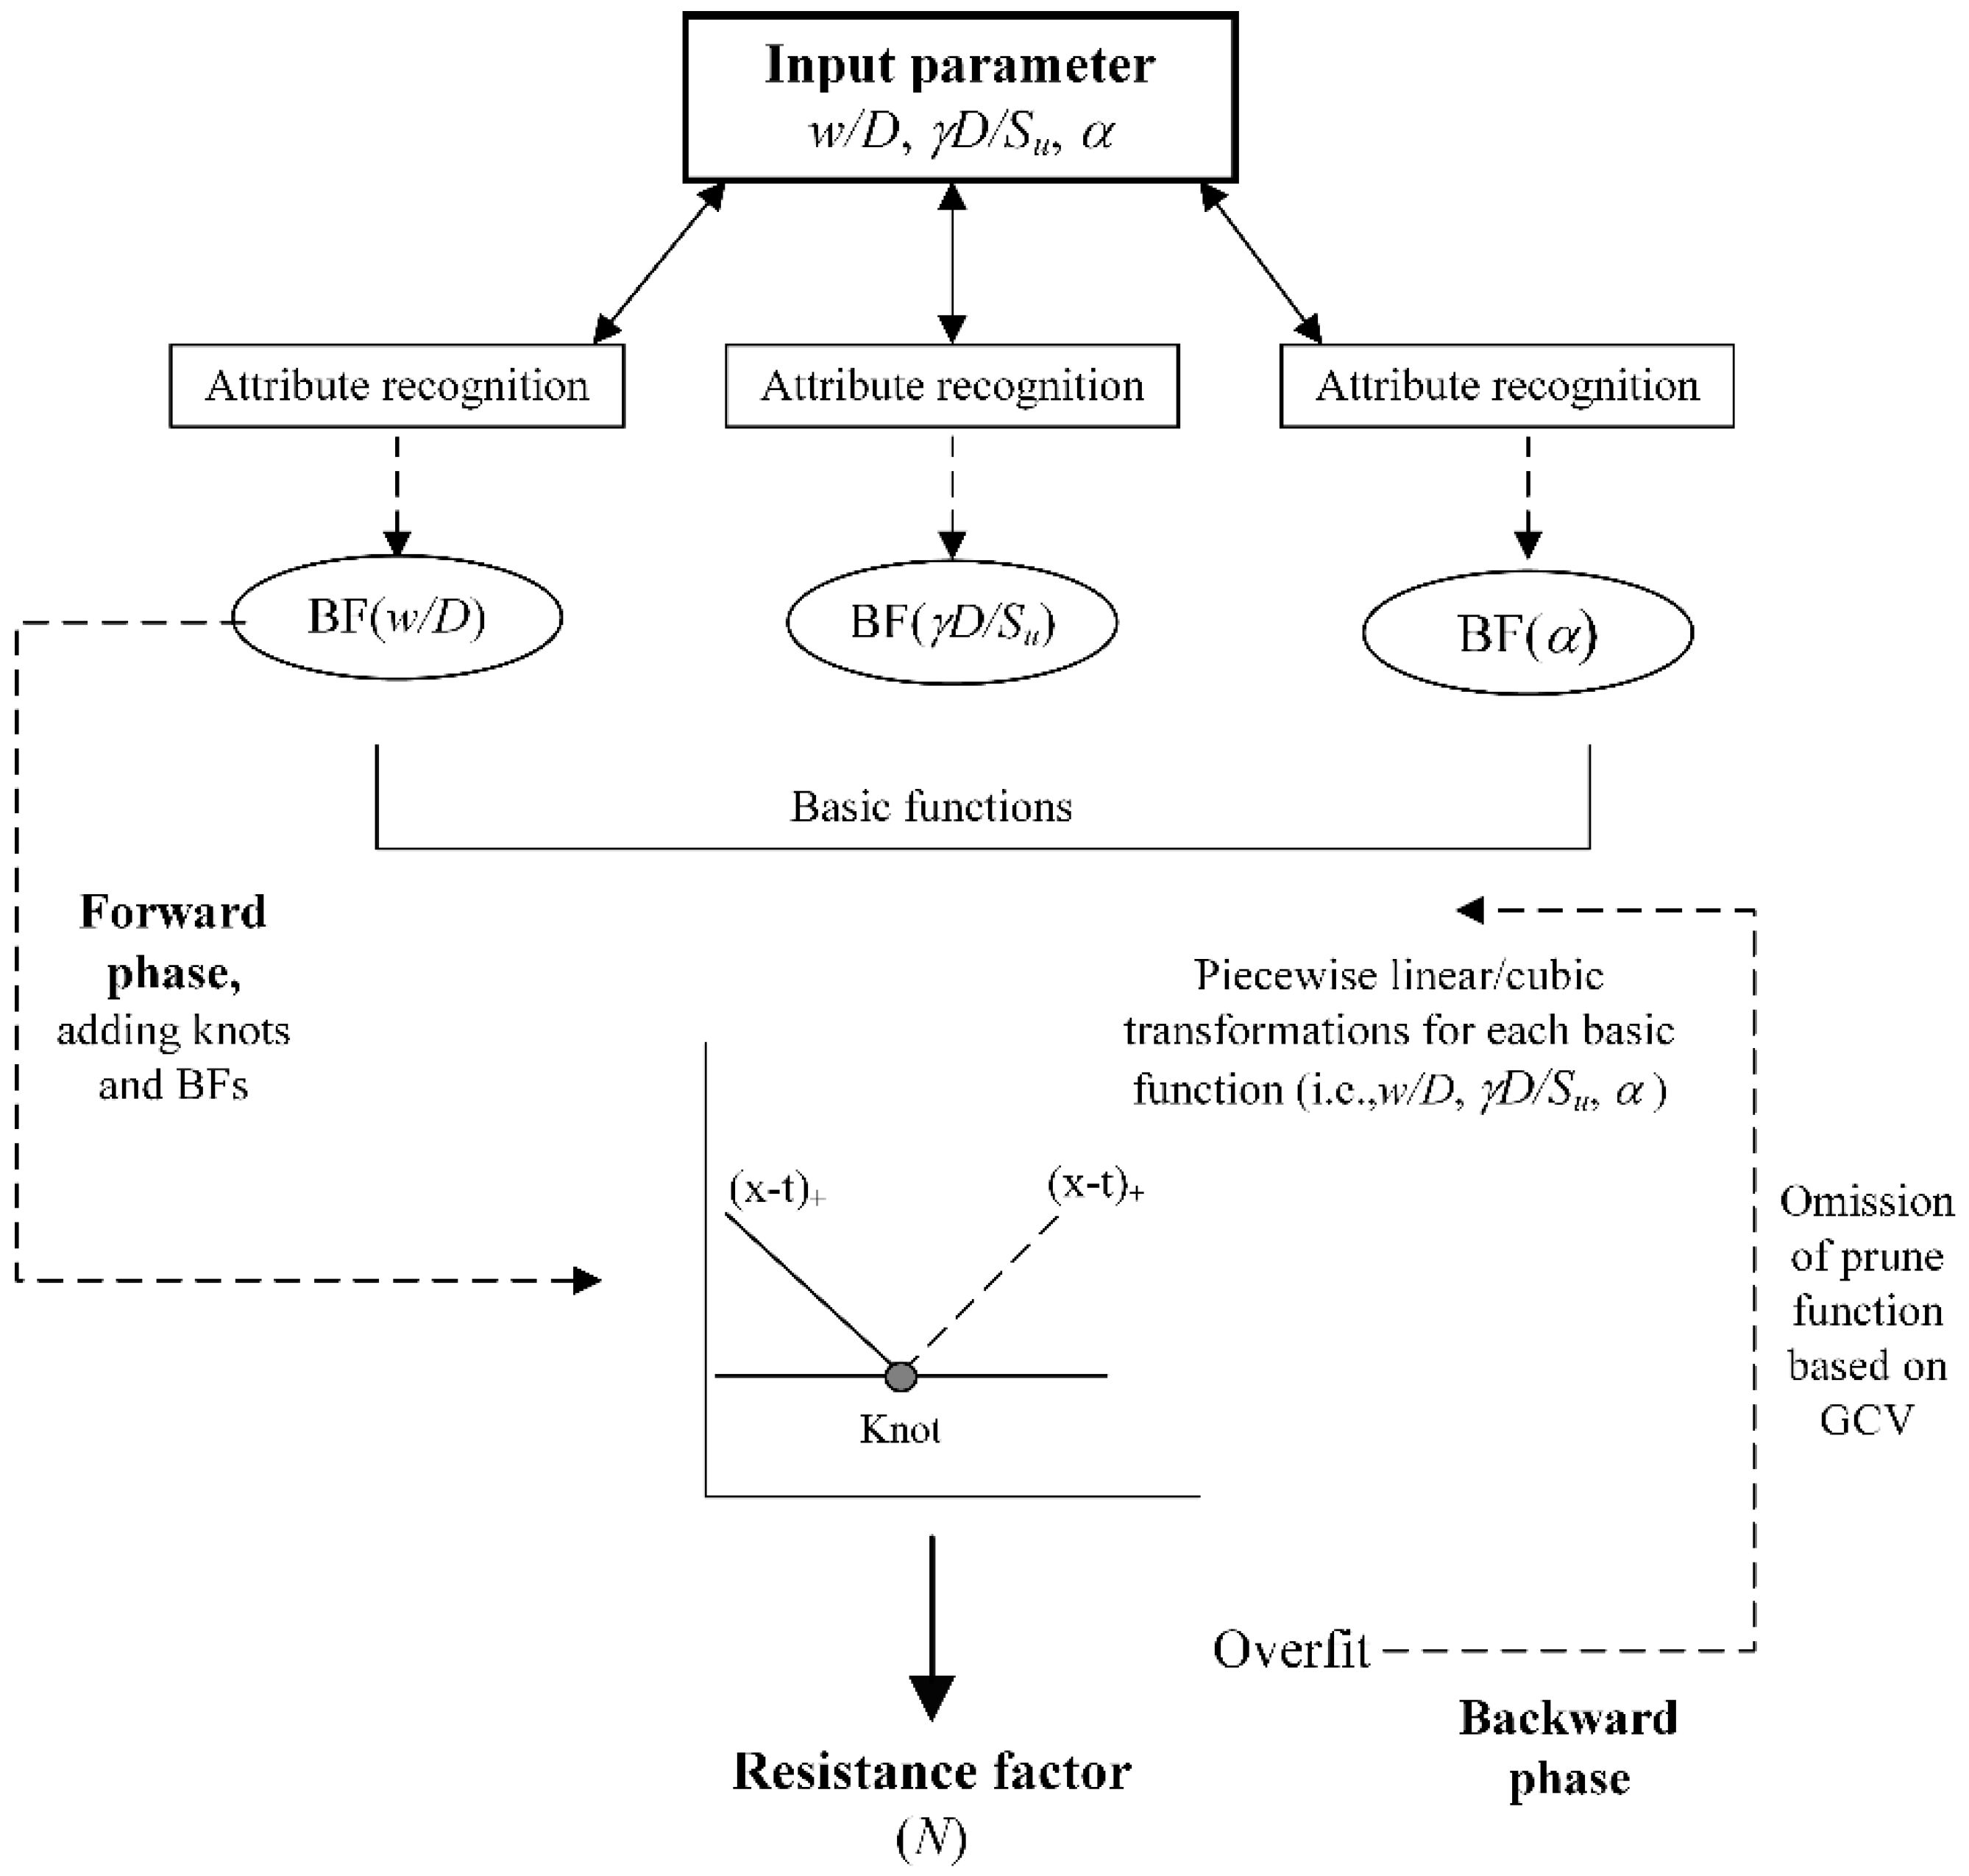
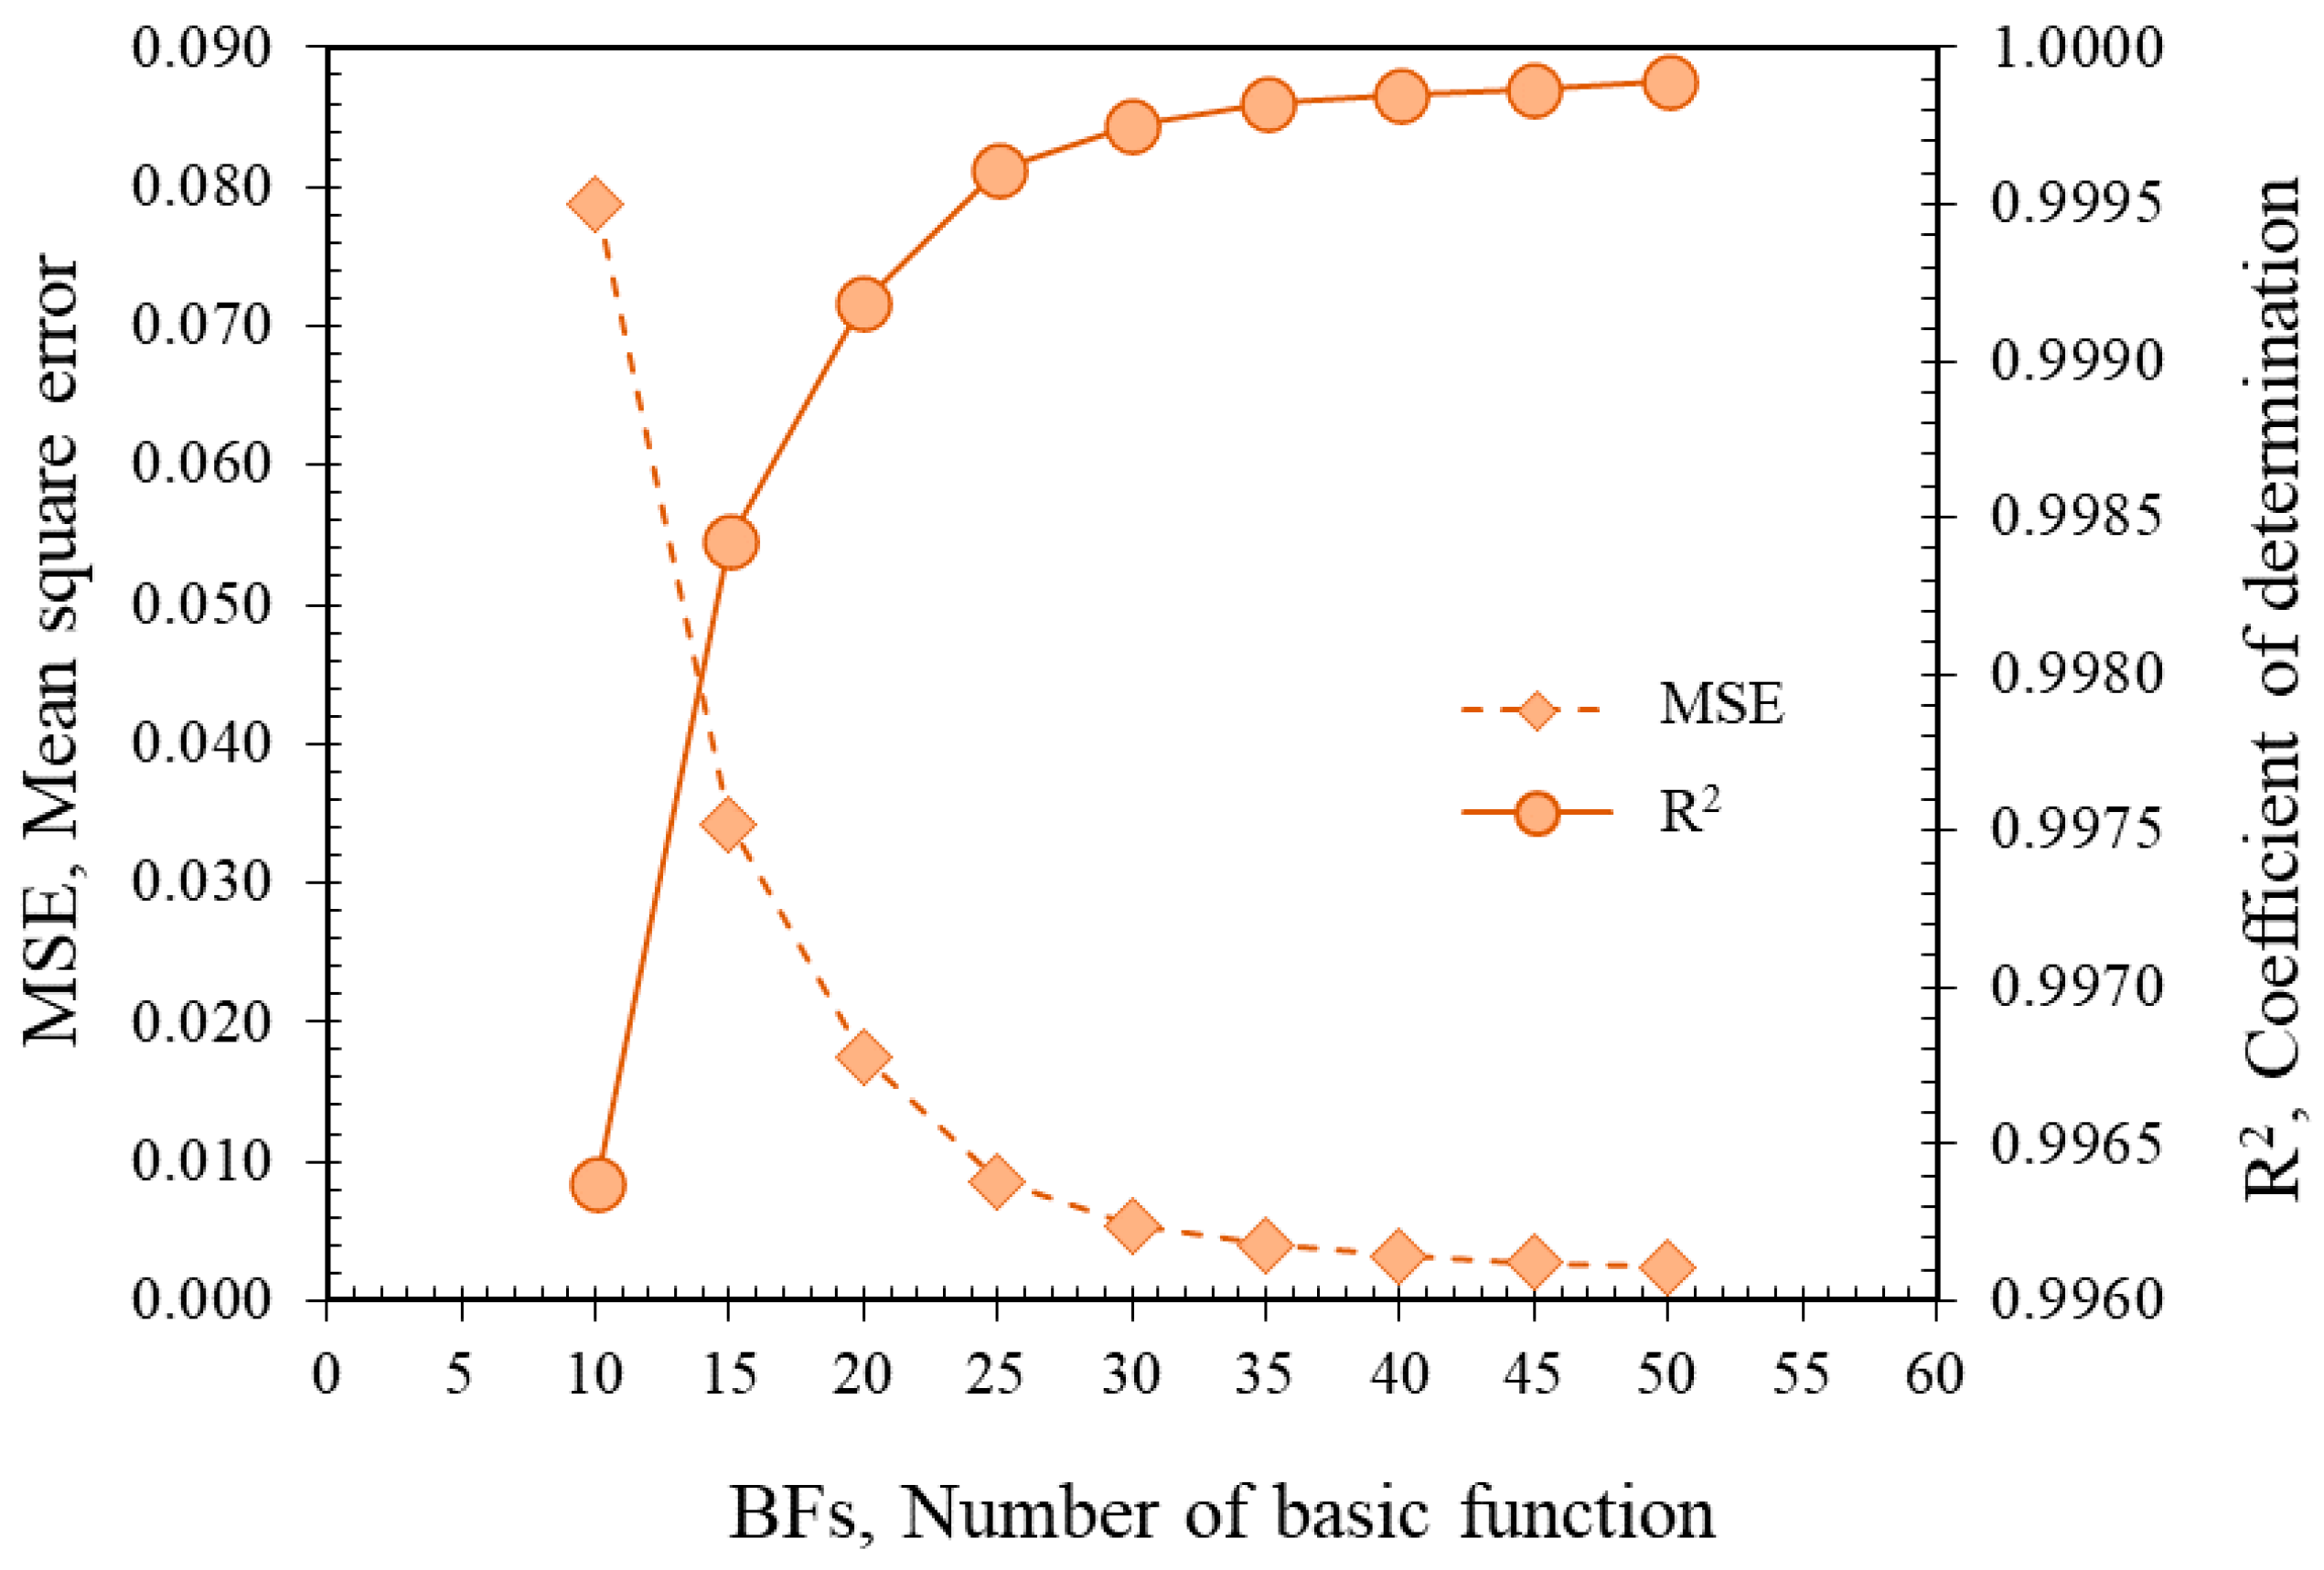
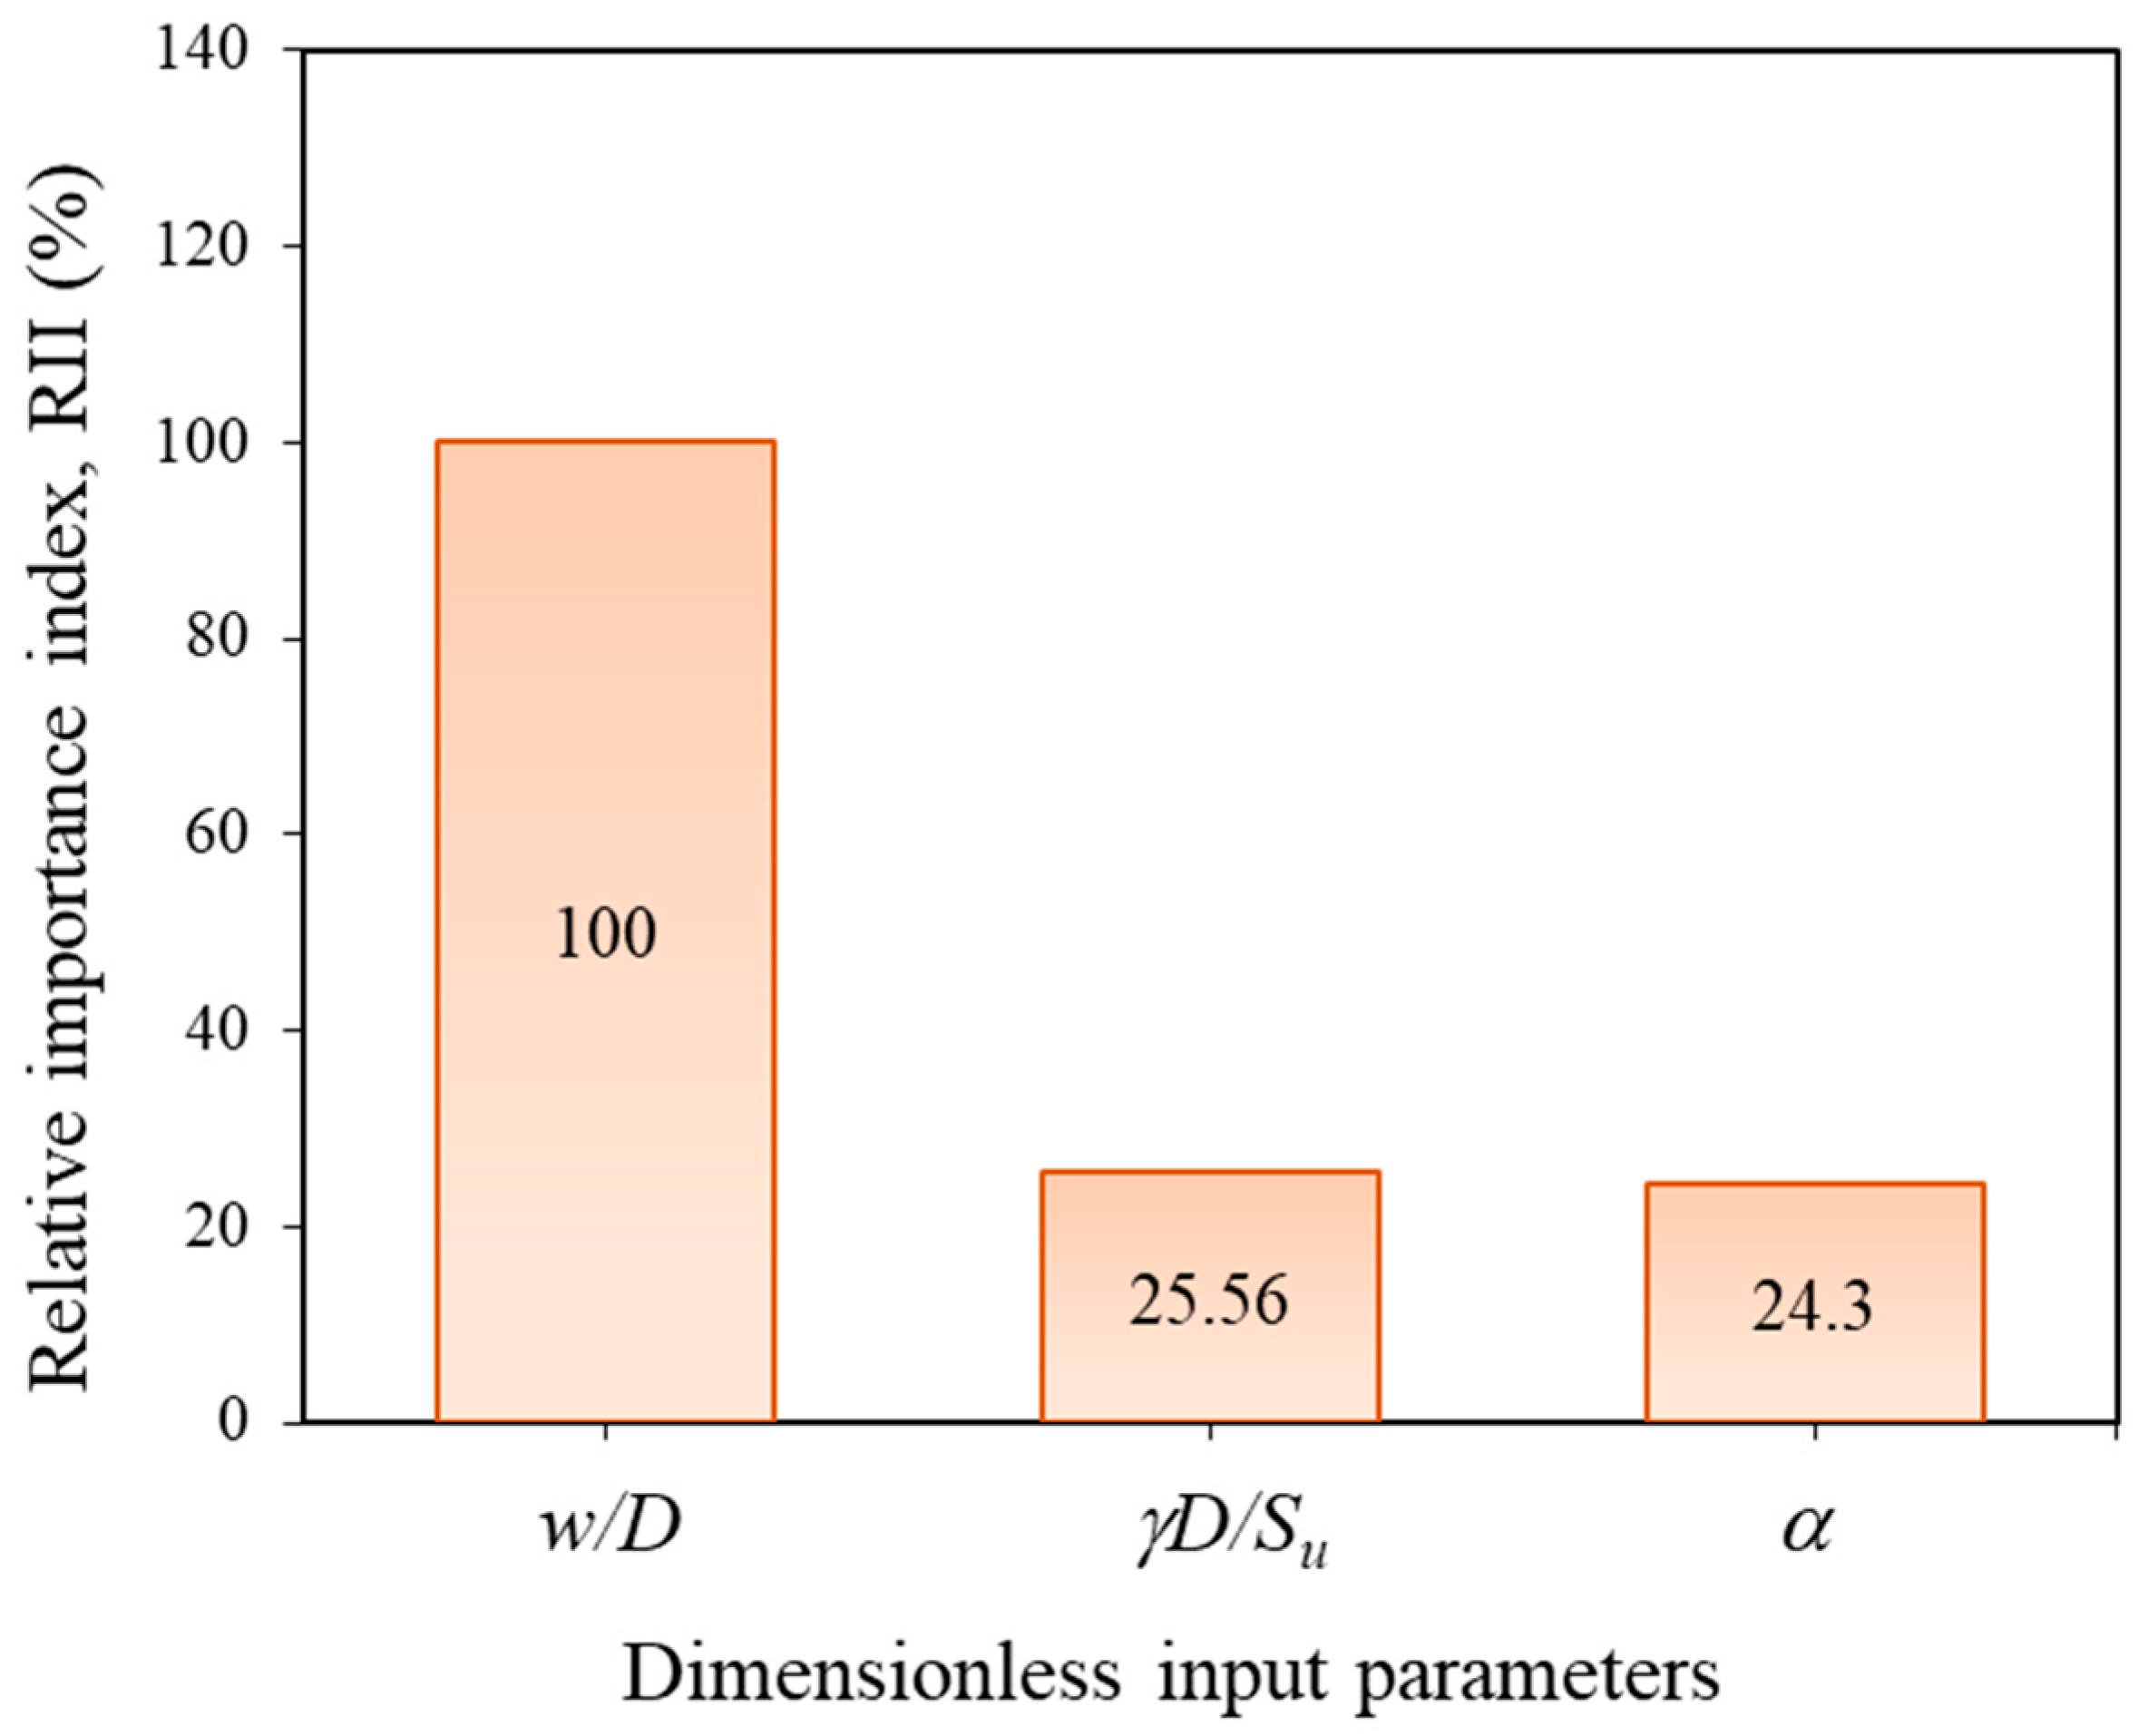
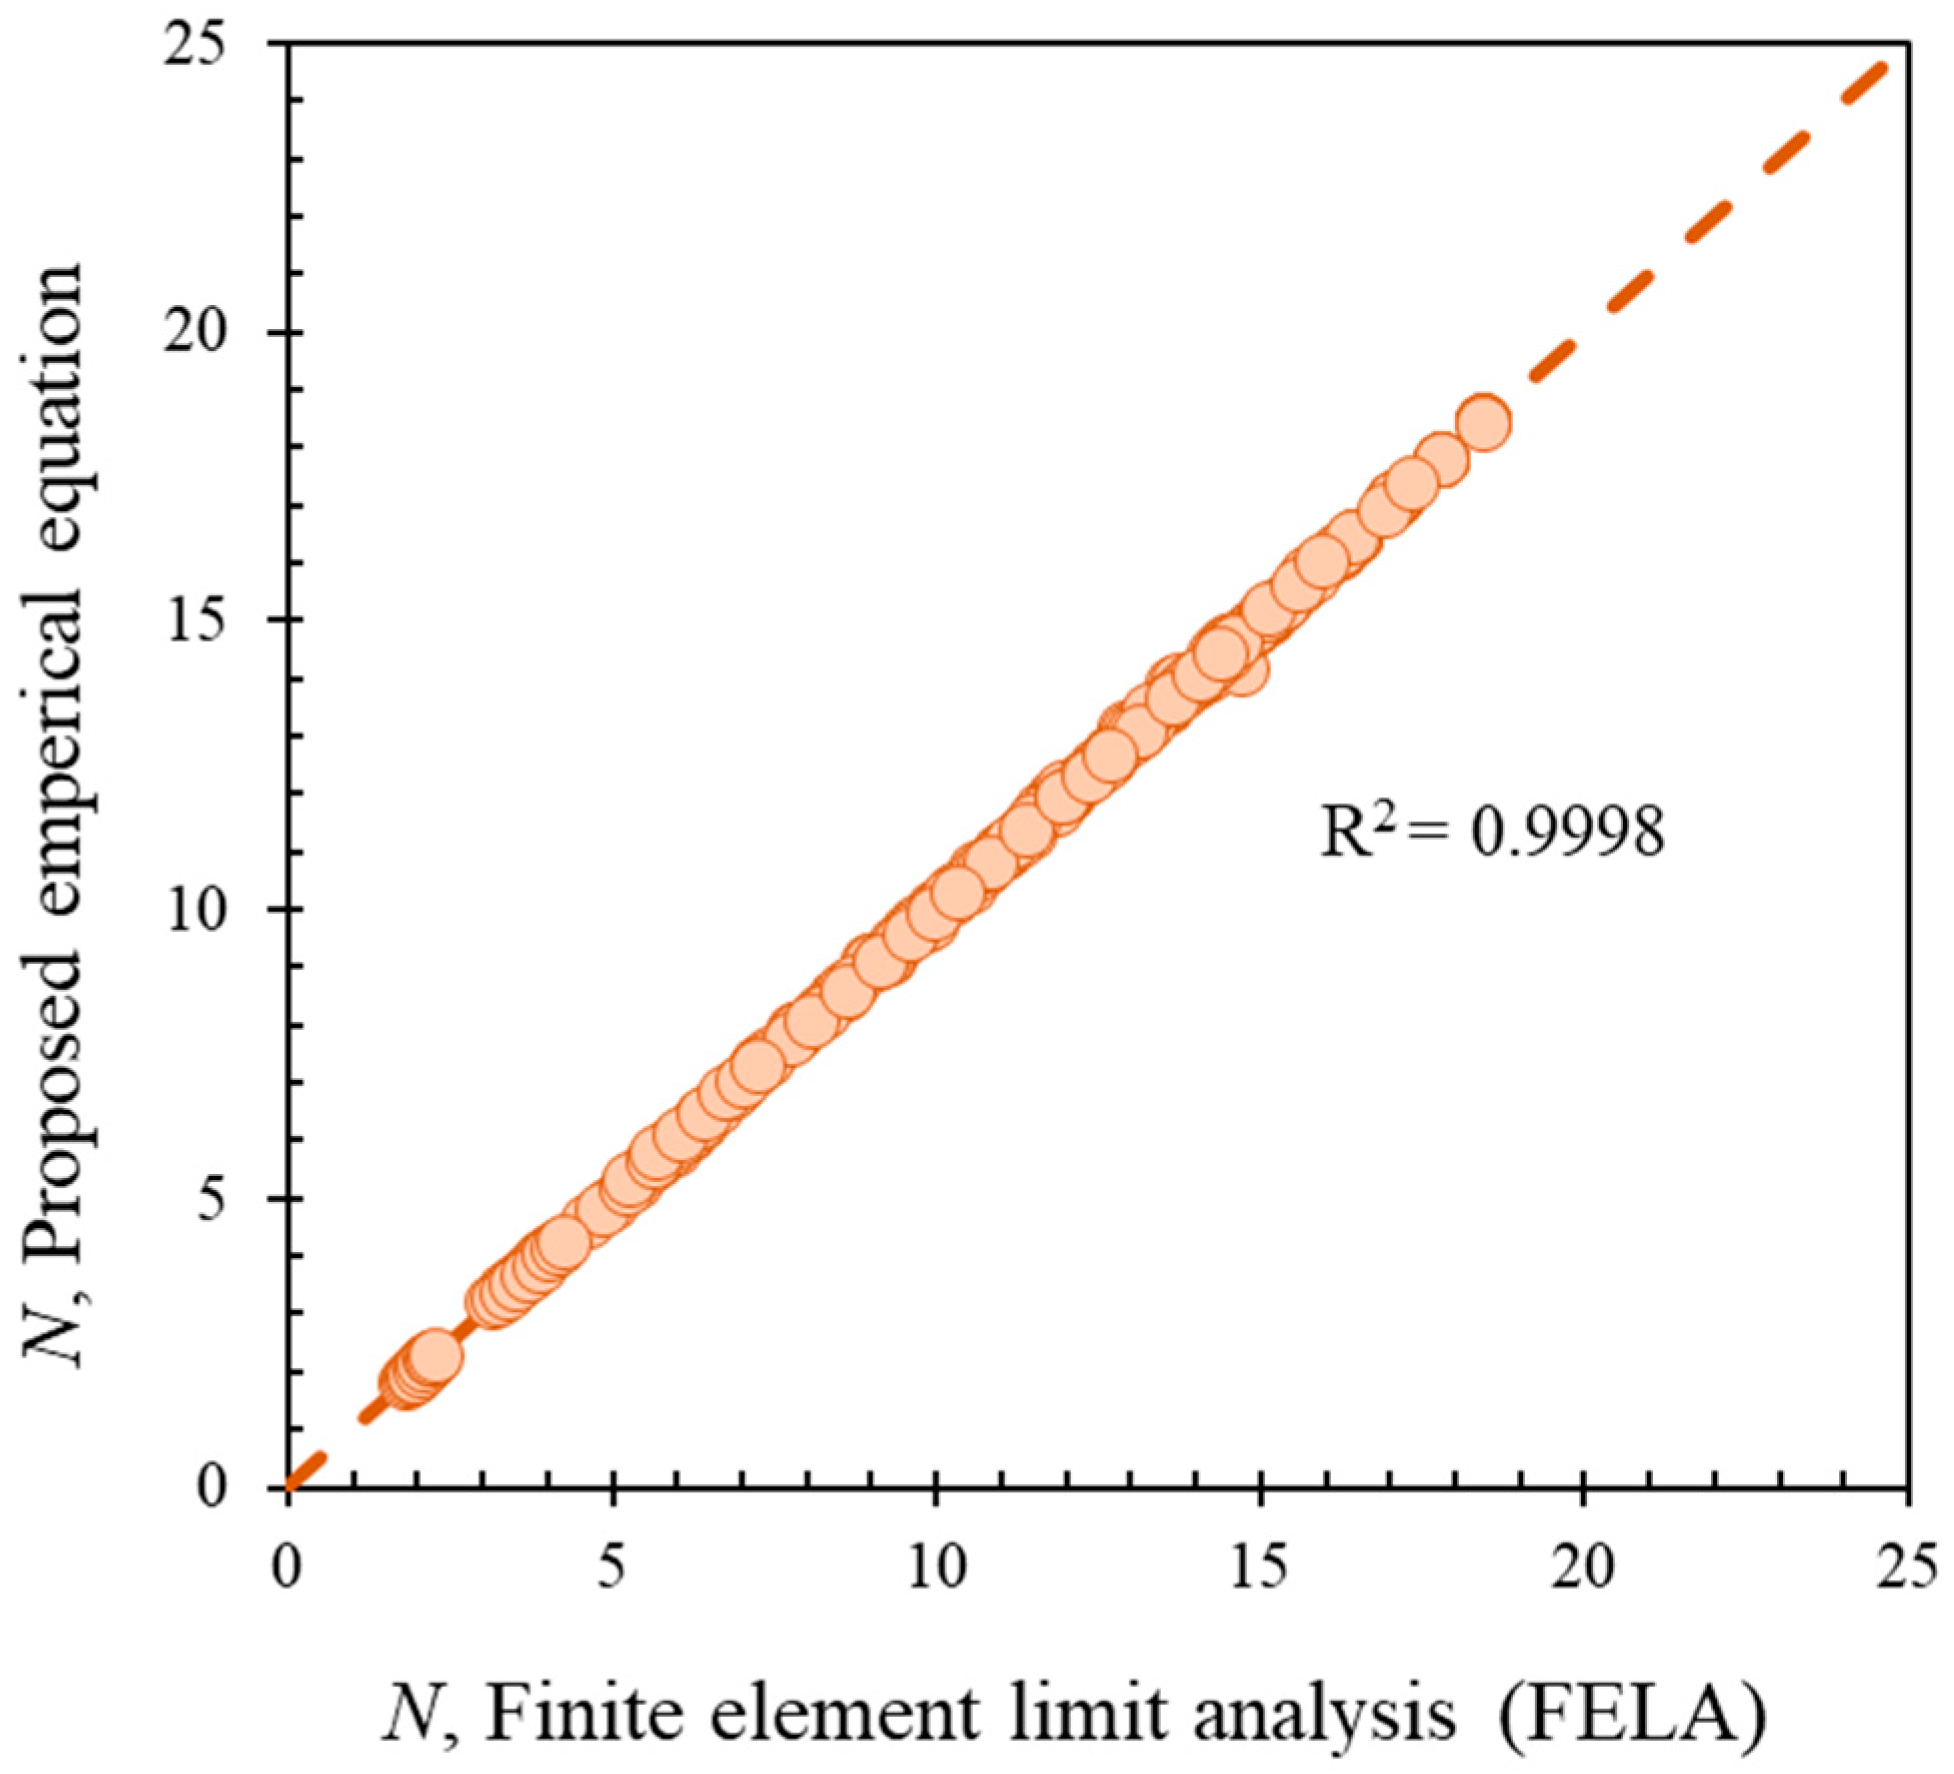
The comparison between the present UB and LB solutions and the existing UB and LB solutions from Randolph et al. [11] is presented in Figure 3 for the cases of weightless soils (γD/Su = 0) and deep embedment (w/D = 3). The range of α in Figure 3 varies from 0 (smooth) to 1 (rough). Note that, as mentioned before, the differences between the present UB and LB solutions are within 1% for all cases. The LB and UB solutions are so close due to the use of mesh adaptivity technique in OptumG2 with the setting of five adaptive steps (i.e., 5000 elements at the first step and 10,000 elements at the final step). The existing solutions by Randolph et al. [11] were obtained from the velocity field of the full-flow mechanism of the spherical penetrometers under axisymmetric conditions. It can be found in Figure 3 that the present solutions lay in between Randolph et al.’s UB and LB solutions. It means that all the present solutions agree very well with those of Randolph et al. [11] and have more accuracy since all lines in Figure 3 are in the same tendency and in between previous UB and LB solutions.
The penetration resistance factor of spherical penetrometers in clay (N) is presented as a function of the embedded ratio (w/D), the adhesion factor (α), and the normalized unit weight and undrained shear strength (γD/Su) as shown in Figure 4, Figure 5 and Figure 6, respectively. The variations of penetration resistance factor of spherical penetrometers in clay (N) with w/D for both cases of the present UB and LB solutions and four values of the normalized unit weight and undrained shear strength γD/Su ∈ {0, 1, 3, 5} with the different values of α = 0 to 1 are reported in Figure 4a–d. Clearly, the numerical results for all cases of γD/Su as well as for all values of the adhesion factor increase rapidly, reaching their peak as w/D increases, and stabilize when w/D > 2. It is apparent from this set of results that the value of the penetration resistance factor and the peak point differ according to α, where the rough interface (α = 1) gives a higher value, and the minimum one occurs at the condition of the smooth interface (α = 0). Figure 5a–d shows the penetration resistance factor of spherical penetrometers in clay (N) for four values of the adhesion factor α ∈ {0, 0.4, 0.8, 1.0} and the various values of w/D = 0.10–3.0. The numerical results of two solutions for all cases of the adhesion factor and all values of w/D reach the minimum value at γD/Su = 0 and tend to be constant for the case of small w/D and stiffer for large w/D when γD/Su increases, but in the case of w/D > 1.75, the value of N is constant. In particular, the values of the penetration resistance factor are higher when α is larger (see Figure 5c) and decrease as α decreases. To better understand the trends observed in the results, the penetration resistance factor of spherical penetrometers in clay (N) for two UB and LB FELA solutions are shown in Figure 6a–d, respectively, for different values of w/D = 0.10–3.0 and four values of the normalized unit weight and undrained shear strength γD/Su ∈ {0, 1, 3, 5}. As in the previous case, the numerical results of the penetration resistance factor (N) between the adhesion factor (α) show the minimum value at α = 0 and tend to be stiff when α increases, especially at the large value of w/D. Likewise, a larger value of γD/Su yields a higher value of N. It can also be concluded from this set of results that the penetration resistance factor of spherical penetrometers in clay (N) significantly depends on those three main factors noted before (e.g., α, γD/Su and w/D). Increment of these three main factors tends to stiffen the penetration resistance factor instead.
To further examine the failure mechanisms of spherical penetrometers in clay, results are obtained for various values of the embedded ratio (w/D) while maintaining the normalized unit weight and undrained shear strength Γd/Su = 1 and the adhesion factor α = 0.6, as shown in Figure 7. Furthermore, the effects of the normalized unit weight and undrained shear strength (γD/Su) and the adhesion factor (α) with the effect of the embedded ratio w/D = 1.5 are reported in Figure 8. As can be clearly seen from Figure 7, the contour plots of the failure mechanisms of spherical penetrometers in clay indicate that when the ratio of w/D is small (e.g., w/D = 0.1 and w/D = 0.4), the failure zone appears immediately beneath and next to the spherical penetrometer (see Figure 7a,b). While at the medium ratio of w/D (e.g., w/D = 1.0 and w/D = 1.5), the maximum failure zone occurs at the upper and lower zones of the spherical penetrometer and also spread slightly laterally in which the upper failure zone increases as w/D increases (see Figure 7c,d). Likewise, when the value of w/D is large enough (e.g., w/D = 2.0 and w/D = 3.0), the failure zone occurs circumferentially at the edges of the spherical penetrometer (see Figure 7e,f). As shown in Figure 8, the critical failure zone predicted by all cases of γD/Su and α for w/D = 1.5 is immediately above and below the spherical penetrometer and tended to expand to the sides of the corners, especially, when the penetrometer is the fully rough interface (α = 1).

5. MARS Model

Machine learning approaches such as neural network methods (e.g., ANN, DNN), and fuzzy logic have been used for big data investigation, implicit modeling, nonlinear regression, and human-like decision-making [31,32]. These approaches have played an important role in the growth of all social and technical fields. As an illustration, the multivariate adaptive regression splines (MARS) model first presented by Friedman [33], is also an innovative nonlinear regression tool used in machine learning. Using several piecewise linear segments (splines) with differing gradients, MARS can robotically explore nonlinearities and interactions between input and output variables in multi-dimensions without any assumptions [33,34,35,36]. Thus, MARS is also named as a curve-based machine learning model [37] which is based on a non-parametric statistical method. MARS algorithm also has similarities to other machine learning models such as tree-based models because it uses a similar iterative approach. Furthermore, MARS is so efficient in determining and neglecting the unnecessary and less essential variables in analysis progress. Compared to other machine learning methods (i.e., extreme learning machines, support vector regression, Gaussian process regression, and stochastic gradient boosting trees), MARS is more efficient [37,38]. On another side, the MARS model has been successfully applied in the geotechnical field such as excavation issues [39]; tunnel problems [40]; embankment stability [41]; foundation settlement [42]. Below a short outline of the MARS model is given. More details can be found in Zhang [24].
The concept of the MARS model is changing a nonlinear regression to multiple linear regression estimates across a range of databases, as shown in Figure 9. In the beginning, MARS divides the training data into several sections that are suitable for linear regression to the data within each section [33]. The boundaries of each section are called knots which are automatically determined using the adaptive regression algorithm. In each data section, MARS generates a regression function to represent the data that are called basic function (BF) as shown in Equation (4) [43].
BF = max   ( 0 ,   x t ) = { x t       if   x   t 0                     otherwise
where x is an input variable, and t is a threshold value.
Later, MARS uses a pruning algorithm to delete the least effective terms according to generalized cross validation (GCV) [33] which can generate an optimal model used for exploring the relationship between input and output variables. To establish the correlation function between the input parameters and output results, the MARS model combines all linear basic functions (BFs) which are presented in Equation (5), where a0 is a constant, N is the number of BFs, gn is the nth BF, an is the nth coefficient of gn. Note that, by increasing the number of data sections, in other words, the number of basic functions, can increase the accuracy of the MARS model.
f ( x ) = a 0 + n = 1 N a n g n ( X )
In the present paper, the MARS model is adopted to establish the correlation function between the investigated input dimensionless parameters and the penetration resistance factor, and identify the importance of each parameter on the penetration resistance factor. The penetration resistance factors corresponding to 288 sets of input dimensionless parameters of w/D, α, and γD/Su are used as the training data for the MARS model. The schematic view of MARS commonly employed for response prediction in multiparameter problems [37] is adopted in this study and shown in Figure 10.
For analysis purposes, the number of BFs is automatically selected in order to obtain the best MARS model with the best knots by adopting GCV [44,45,46,47,48,49]. The performance of MARS is checked through two criteria of statistical analyses namely the coefficient of determination (R2 value) and mean squared error (MSE). The results are shown in Figure 11, when the number of basic functions increases from 10 to 30, the value of R2 increases quickly to 1, and the MSE value strongly decreases. However, the R2 value approaches 1, and MSE values are stable when the number of basic functions is larger than 35. Thus, the MARS model with 35 BFs is selected as the optimal model for the next analysis.
The importance of each parameter on the penetration resistance factor is identified by relative importance index RII and shown in Figure 12. Note that, input parameters with RII of 100% mean that those parameters are the most important ones. As can be seen in Figure 11, the embedded ratio (w/D) is the most important parameter, while the normalized unit weight and undrained shear strength (γD/Su) and the adhesion factor (α) contribute to predicting the penetration resistance factor as the lower-ranked predictors with RII of 25.56% and 24.3%, respectively.
The basic functions and correlation function between the investigated input dimensionless parameters and the penetration resistance factor are also determined and shown in Table 1. They can be represented as Equation (6)
N = 18.1381 + 10.1002 × BF1 − 12.0408 × BF2 + 0.209064 × BF3 + 8.54367 × BF4 + 0.259794 × BF5 − 0.380723
× BF6 + 3.85193 × BF7 − 8.16031 × BF8 − 1.52479 × BF11 − 0.511563 × BF15 + 1.08646 × BF18 − 2.25835 ×
BF19 + 2.71541 × BF21 − 2.92672 × BF22 − 6.38501 × BF23 − 2.68077 × BF25 − 1.31827 × BF27 + 0.533877 ×
BF29 − 0.429556 × BF30 − 0.309733 × BF31 − 0.225152 × BF32 − 0.2951 × BF33 + 1.11913 × BF35
The verification of the proposed Equation (6) is made through the comparison between the penetration resistance factor N from the proposed equation and FLEA results which is shown in Figure 13. It can be seen that there is a close fit between predicted N and FELA results with a high value of R2 = 99.99%. Thus, the proposed Equation (6) obtained from the MARS model can be useful to estimate the penetration resistance factor of a spherical penetrometer in clay.

6. Conclusions

In the paper, the behavior of a spherical penetrometer in clay under the penetration force in axisymmetric conditions has been fully investigated by using the upper bound (UB) or lower bound (LB) finite element limit analysis (FELA) solutions. The multivariate adaptive regression splines (MARS) model was used to train the optimal data of the penetration resistance factor after mathematical results were obtained using the UB and LB FELA formulations. The numerical approximation result of the penetration resistance factor of spherical penetrometers in clay depends on three parameters: A function of the embedded ratio w/D; the adhesion factor α; and the normalized unit weight and undrained shear strength γD/Su. The validity of the present LB and UB solutions was confirmed via comparison with existing solutions from Randolph et al. [11], which means the present LB and UB solutions showed the same tendency and good agreement with benchmark results. Results of the numerical study indicate that the three parameters as a function of the embedded ratio, the adhesion factor, the normalized unit weight, and undrained shear strength play the most significant role in the penetration resistance factor of spherical penetrometers in clay. In particular, the significant effects of the penetration resistance factor increase when three parameters increase, but when w/D > 2, the penetration resistance factor is insignificant. Likewise, the failure mechanisms of spherical penetrometers in clay also depend on all three factors, which give a consistent effect that only occurs around the spherical penetrometers. The concept of the MARS model has been used to determine the optimum between input and output data. The results from the proposed equation give good results in comparison with the finite element method. It can be useful to use this technique to estimate the penetration resistance factor of a spherical penetrometer in clay. In addition, the current study could be expanded to address related or more complicated issues, such as 3D problems or other different indenters.

Author Contributions

Conceptualization, S.S. (Sayan Sirimontree), T.J. and S.K.; methodology, S.S. (Sayan Sirimontree), T.J., V.Q.L., S.S. (Sorawit Seehavong) and S.K.; software, V.Q.L., S.S. (Sorawit Seehavong), A.E., J.L., C.T., P.N. and S.K.; validation, V.Q.L., S.S. (Sorawit Seehavong), A.E., J.L., C.T., P.N. and S.K.; formal analysis, V.Q.L., S.S. (Sorawit Seehavong), A.E., J.L., C.T., P.N. and S.K.; investigation, V.Q.L., S.S. (Sorawit Seehavong), A.E., J.L., C.T., P.N. and S.K.; resources, S.S. (Sayan Sirimontree), T.J. and S.K.; data curation, V.Q.L., S.S. (Sorawit Seehavong), A.E., J.L., C.T., P.N. and S.K.; writing—original draft preparation, V.Q.L., A.E., J.L. and S.K.; writing—review and editing, S.S. (Sayan Sirimontree), T.J., C.T., P.N. and S.K.; visualization, S.S. (Sayan Sirimontree), T.J. and S.K.; supervision, S.S. (Sayan Sirimontree), T.J. and S.K.; project administration, S.S. (Sayan Sirimontree), T.J. and S.K.; funding acquisition, S.S. (Sayan Sirimontree), T.J. and S.K. All authors have read and agreed to the published version of the manuscript.

Funding

This work was supported by Thammasat University Research Unit in Structural and Foundation Engineering.

Institutional Review Board Statement

Not applicable.

Informed Consent Statement

Not applicable.

Data Availability Statement

The data and materials in this paper are available.

Acknowledgments

We would like to thank Ho Chi Minh City University of Technology (HCMUT), VNUHCM for the support of time and facilities for this study.

Conflicts of Interest

The authors declare no conflict of interest.

References

  1. Randolph, M.F.; Hefer, P.A.; Geise, J.; Watson, P.G. Improved seabed strength profiling using T-bar penetrometer. In Proceedings of the Offshore Site Investigation and Foundation Behaviour: New Frontiers—Proceedings of an International Conference, London, UK, 22–24 September 1998; OnePetro: Richardson, TX, USA, 1998; pp. 221–235. [Google Scholar]
  2. Hefer, P.A.; Neubecker, S.R. A recent development in offshore site investigation tools: The T-bar. In Proceedings of the Australian Oil and Gas Conference, Perth, Australia, 18–22 April 1999. [Google Scholar]
  3. Randolph, M.F.; Houlsby, G.T. The Limiting Pressure on a Circular Pile Loaded Laterally in Cohesive Soil. Geotechnique 1984, 34, 613–623. [Google Scholar] [CrossRef]
  4. Martin, C.M.; Randolph, M.F. Upper bound analysis of lateral pile capacity in cohesive soil. Geotechnique 2006, 56, 141–145. [Google Scholar] [CrossRef]
  5. Keawsawasvong, S.; Ukritchon, B. Ultimate lateral capacity of two dimensional plane strain rectangular pile in clay. Geomech. Eng. 2016, 11, 235–251. [Google Scholar] [CrossRef]
  6. Keawsawasvong, S.; Ukritchon, B. Undrained lateral capacity of I-shaped concrete piles. Songklanakarin J. Sci. Technol. 2017, 39, 751–758. [Google Scholar]
  7. Ukritchon, B.; Keawsawasvong, S. Undrained lateral capacity of rectangular piles under a general loading direction and full flow mechanism. KSCE J. Civil. Eng. 2018, 22, 2256–2265. [Google Scholar] [CrossRef]
  8. Vallejo, L.E. Evaluation of test methods designed to obtain the undrained shear strength of muds. In Proceedings of the Offshore Technology Conference, Houston, TX, USA, 3–6 May 1982; OnePetro: Richardson, TX, USA, 1982. [Google Scholar]
  9. Watson, P.G.; Newson, T.A.; Randolph, M.F. Strength Profiling in Soft Offshore Soils; CRC Press/Balkema: Boca Raton, FL, USA, 1998; pp. 1389–1394. [Google Scholar]
  10. Newson, T.A.; Watson, P.G.; Bransby, M.F. Undrained shear strength profiling using a spherical penetrometer. Submitt. Publ. 1999. [Google Scholar]
  11. Randolph, M.F.; Martin, C.M.; Hu, Y. Limiting resistance of a spherical penetrometer in cohesive material. Geotechnique 2000, 50, 573–582. [Google Scholar] [CrossRef]
  12. Keawsawasvong, S.; Ukritchon, B. Undrained basal stability of braced circular excavations in non-homogeneous clays with linear increase of strength with depth. Comput. Geotech. 2019, 115, 103180. [Google Scholar] [CrossRef]
  13. Keawsawasvong, S. Bearing capacity of conical footings on clays considering combined effects of anisotropy and non-homogeneity. Ships Offshore Struct. 2021, 1–12. [Google Scholar] [CrossRef]
  14. Keawsawasvong, S.; Ukritchon, B. Finite element analysis of undrained stability of cantilever flood walls. Int. J. Geotech. Eng. 2017, 11, 355–367. [Google Scholar] [CrossRef]
  15. Keawsawasvong, S.; Ukritchon, B. Undrained stability of plane strain active trapdoors in anisotropic and non-homogeneous clays. Tunn. Undergr. Space Technol. 2021, 107, 103628. [Google Scholar] [CrossRef]
  16. Keawsawasvong, S.; Shiau, J.; Ngamkhanong, C.; Lai, V.Q.; Thongchom, C. Undrained stability of ring foundations: Axisymmetry, anisotropy, and non-homogeneity. Int. J. Geomech. 2022, 22, 04021253. [Google Scholar] [CrossRef]
  17. Keawsawasvong, S.; Ukritchon, B. Design equation for stability of shallow unlined circular tunnels in Hoek-Brown rock masses. Bull. Eng. Geol. Environ. 2020, 79, 4167–4190. [Google Scholar] [CrossRef]
  18. Yodsomjai, W.; Keawsawasvong, S.; Senjuntichai, T. Undrained stability of unsupported conical slopes in anisotropic clays based on Anisotropic Undrained Shear failure criterion. Transp. Infrastruct. Geotechnol. 2021, 8, 557–568. [Google Scholar] [CrossRef]
  19. Ukritchon, B.; Keawsawasvong, S. Error in Ito and Matsui’s limit equilibrium solution of lateral force on a row of stabilizing piles. J. Geotech. Geoenviron. Eng. 2017, 143, 02817004. [Google Scholar] [CrossRef]
  20. Ukritchon, B.; Keawsawasvong, S. Undrained lower bound solutions for end bearing capacity of shallow circular piles in non-homogeneous and anisotropic clays. Int. J. Numer. Anal. Methods Geomech. 2020, 44, 596–632. [Google Scholar] [CrossRef]
  21. Ukritchon, B.; Yoang, S.; Keawsawasvong, S. Three-dimensional stability analysis of the collapse pressure on flexible pavements over rectangular trapdoors. Transp. Geotech. 2019, 21, 100277. [Google Scholar] [CrossRef]
  22. Ukritchon, B.; Yoang, S.; Keawsawasvong, S. Undrained stability of unsupported rectangular excavations in non-homogeneous clays. Comput. Geotech. 2020, 117, 103281. [Google Scholar] [CrossRef]
  23. Sloan, S.W. Geotechnical stability analysis. Géotechnique 2013, 63, 531–572. [Google Scholar] [CrossRef] [Green Version]
  24. Zhang, W. MARS Applications in Geotechnical Engineering Systems; Springer Nature Customer Service Center LLC: New York, NY, USA, 2020. [Google Scholar]
  25. Keawsawasvong, S.; Lai, V.Q. End bearing capacity factor for annular foundations embedded in clay considering the effect of the adhesion factor. Int. J. Geosynth. Ground Eng. 2021, 7, 15. [Google Scholar] [CrossRef]
  26. Ukritchon, B.; Keawsawasvong, S. Unsafe error in conventional shape factor for shallow circular foundations in normally consolidated clays. J. Geotech. Geoenviron. Eng. 2017, 143, 02817001. [Google Scholar] [CrossRef]
  27. Ukritchon, B.; Keawsawasvong, S. Design equations of uplift capacity of circular piles in sands. Appl. Ocean Res. 2019, 90, 101844. [Google Scholar] [CrossRef]
  28. Ukritchon, B.; Wongtoythong, P.; Keawsawasvong, S. New design equation for undrained pullout capacity of suction caissons considering combined effects of caisson aspect ratio, adhesion factor at interface, and linearly increasing strength. Appl. Ocean Res. 2018, 75, 1–14. [Google Scholar] [CrossRef]
  29. Krabbenhoft, K.; Lyamin, A.; Krabbenhoft, J. Optum Computational Engineering (OptumG2). 2015. Available online: www.optumce.com (accessed on 20 January 2021).
  30. Ciria, H.; Peraire, J.; Bonet, J. Mesh adaptive computation of upper and lower bounds in limit analysis. Int. J. Numer. Methods Eng. 2008, 75, 899–944. [Google Scholar] [CrossRef]
  31. Khajehzadeh, M.; Keawsawasvong, S.; Nehdi, M.L. Effective hybrid soft computing approach for optimum design of shallow foundations. Sustainability 2022, 14, 1847. [Google Scholar] [CrossRef]
  32. Khajehzadeh, M.; Taha, M.R.; Keawsawasvong, S.; Mirzaei, H.; Jebeli, M. An effective artificial intelligence approach for slope stability evaluation. IEEE Access 2022, 10, 5660–5671. [Google Scholar] [CrossRef]
  33. Friedman, J.H. Multivariate adaptive regression splines. Ann. Stat. 1991, 19, 1–67. [Google Scholar] [CrossRef]
  34. Gocheva-Ilieva, S.; Ivanov, A.; Stoimenova-minova, M. Prediction of Daily Mean PM10 Concentrations Using Random Forest, CART Ensemble and Bagging Stacked by MARS. Sustainability 2022, 14, 798. [Google Scholar] [CrossRef]
  35. Kim, S.; Alizamir, M.; Kim, N.W.; Kisi, O. Bayesian Model Averaging: A Unique Model Enhancing Forecasting Accuracy for Daily Streamflow Based on Different Antecedent Time Series. Sustainability 2022, 12, 9720. [Google Scholar] [CrossRef]
  36. Halecki, W.; Kowalik, T.; Bogdał, A. Multiannual Assessment of the Risk of Surface Water Erosion and Metal Accumulation Indices in the Flysch Stream Using the MARS Model in the Polish Outer Western Carpathians. Sustainability 2019, 11, 7189. [Google Scholar] [CrossRef] [Green Version]
  37. Wu, L.; Fan, J. Comparison of neuron-based, kernel-based, tree-based and curve-based machine learning models for predicting daily reference evapotranspiration. PLoS ONE 2019, 14, e0217520. [Google Scholar] [CrossRef] [PubMed] [Green Version]
  38. Raja, M.N.A.; Shukla, S.K. Multivariate adaptive regression splines model for reinforced soil foundations. Geosynth. Int. 2021, 28, 368–390. [Google Scholar] [CrossRef]
  39. Zhang, W.; Zhang, R.; Goh, A.T.C. MARS inverse analysis of 954 soil and wall properties for braced excavations in clays. Geomech. Eng. 2018, 16, 577–588. [Google Scholar]
  40. Zheng, G.; Yang, P.; Zhou, H.; Zeng, C.; Yang, X.; He, X.; Yu, X. Evaluation of the earthquake induced uplift displacement of tunnels using multivariate adaptive regression splines. Comput. Geotech. 2019, 113, 103099. [Google Scholar] [CrossRef]
  41. Zhou, H.; Xu, H.; Yu, X.; Guo, Z.; Zheng, G.; Yang, X.; Tian, Y. Evaluation of the bending failure of columns under an embankment loading. Int. J. Geomech. 2021, 21, 04021112. [Google Scholar] [CrossRef]
  42. Lai, F.; Zhang, N.; Liu, S.; Sun, Y.; Li, Y. Ground movements induced by installation of twin large diameter deeply-buried caissons: 3D numerical modeling. Acta Geotech. 2021, 16, 2933–2961. [Google Scholar] [CrossRef]
  43. Zhang, W.; Zhang, R.; Wang, W.; Zhang, F.; Goh, A.T.C. A multivariate adaptive regression splines model for determining horizontal wall deflection envelope for braced excavations in clays. Tunn. Undergr. Space Technol. 2019, 84, 461–471. [Google Scholar] [CrossRef]
  44. Caraka, R.E.; Chen, R.C.; Bakar, S.A.; Tahmid, M.; Toharudin, T.; Pardamean, B. Employing Best Input SVR Robust Lost Function with Nature-Inspired Metaheuristics in Wind Speed Energy Forecasting. IAENG Int. J. Comput. Sci. 2020, 47, 572–584. [Google Scholar]
  45. Stoklosa, J.; Warton, D.I. A Generalized Estimating Equation Approach to Multivariate Adaptive Regression Splines. J. Comput. Graph. Stat. 2018, 27, 245–253. [Google Scholar] [CrossRef]
  46. Deo, R.C.; Kisi, O.; Singh, V.P. Drought forecasting in eastern Australia using multivariate adaptive regression spline, least square support vector machine and M5Tree model. Atmos. Res. 2017, 184, 149–175. [Google Scholar] [CrossRef] [Green Version]
  47. De Boor, C. Spline basics. In Handbook of Computer Aided Geometric Design; Chapter 6; Academic Press: Cambridge, MA, USA, 2002; ISBN 978-0-444-51104-1. [Google Scholar]
  48. Ruppert, D.; Wand, M.P.; Carroll, R.J. Semiparametric regression during 2003–2007. Electron. J. Stat. 2009, 3, 1193–1256. [Google Scholar] [CrossRef] [PubMed] [Green Version]
  49. Barry, D.; Hardle, W. Applied Nonparametric Regression. J. R. Stat. Soc. Ser. A 1993, 156, 128. [Google Scholar] [CrossRef]
Figure 1. A spherical penetrometer in clay.
Sustainability 14 03222 g001
Figure 2. Problem definition of a spherical penetrometer in clay under axisymmetric conditions.
Sustainability 14 03222 g002
Figure 3. Comparison of the penetration resistance factor of spherical penetrometers in clay between the present study and the existing solutions.
Sustainability 14 03222 g003
Figure 4. Penetration resistance factor of spherical penetrometers in clay: (a) γD/Su = 0; (b) γD/Su = 1; (c) γD/Su = 3; and (d) γD/Su = 5.
Sustainability 14 03222 g004aSustainability 14 03222 g004b
Figure 5. Penetration resistance factor of spherical penetrometers in clay: (a) α = 0; (b) α = 0.4; (c) α = 0.8; and (d) α = 1.
Sustainability 14 03222 g005
Figure 6. Penetration resistance factor of spherical penetrometers in clay: (a) γD/Su = 0; (b) γD/Su = 1; (c) γD/Su = 3; and (d) γD/Su = 5.
Sustainability 14 03222 g006
Figure 7. Effect of w/D on the failure mechanisms of spherical penetrometers in clay with γD/Su = 1 and α = 0.6. (a) w/D = 0.1; (b) w/D = 0.4; (c) w/D = 1; (d) w/D = 1.5; (e) w/D = 2; (f) w/D = 3.
Sustainability 14 03222 g007aSustainability 14 03222 g007b
Figure 8. Effect of γD/Su and α on the failure mechanisms of spherical penetrometers in clay with w/D = 1.5. (a) γD/Su = 0 and α = 0; (b) γD/Su = 0 and α = 1; (c) γD/Su = 5 and α = 0; (d) γD/Su = 5 and α = 1.
Sustainability 14 03222 g008aSustainability 14 03222 g008b
Figure 9. The concept of MARS model.
Sustainability 14 03222 g009
Figure 10. Architecture of MARS implemented in this study [37].
Sustainability 14 03222 g010
Figure 11. Effect of number basic functions on mean square error (MSE) and R2.
Sustainability 14 03222 g011
Figure 12. RII of dimensionless input parameters.
Sustainability 14 03222 g012
Figure 13. Comparison of results—the finite element and the proposed equation.
Sustainability 14 03222 g013
Table 1. Basic functions and the proposed equation for the determination of the penetration resistance factor N.
BFEquationBFEquation
BF1max (0, (w/D − 1.25))BF20max (0, (1.5 − w/D))
BF2max (0, (1.25 − w/D))BF21max (0, (α − 0.6)) × BF20
BF3max (0, (γD/Su − 0))BF22max (0, (0.6 − α)) × BF20
BF4max (0, (α + 5.96046 × 10⁻⁸))BF23max (0, (w/D − 0.2))
BF5max (0, (w/D − 0.6)) × BF3BF25max (0, (w/D − 0.6)) × BF4
BF6max (0, (0.6 − w/D)) × BF3BF27max (0, (α − 0.6)) × BF23
BF7max (0, (w/D − 1.75)) × BF4BF29max (0, (γD/Su − 1)) × BF23
BF8max (0, (1.75 − w/D)) × BF4BF30max (0, (1 − γD/Su)) × BF23
BF11max (0, (w/D − 0.8))BF31max (0, (α − 0.6)) × BF30
BF15max (0, (w/D − 1)) × BF3BF32max (0, (0.6 − α)) × BF30
BF18max (0, (0.6 − α)) × BF11BF33max (0, (w/D − 0.8)) × BF3
BF19max (0, (w/D − 1.5))BF35max (0, (α + 5.96046 × 10⁻⁸))
N = 18.1381 + 10.1002 × BF1 − 12.0408 × BF2 + 0.209064 × BF3 + 8.54367 × BF4 + 0.259794 × BF5 − 0.380723 × BF6 + 3.85193 × BF7 − 8.16031 × BF8 − 1.52479 × BF11 − 0.511563 × BF15 + 1.08646 × BF18 − 2.25835 × BF19 + 2.71541 × BF21 − 2.92672 × BF22 − 6.38501 × BF23 − 2.68077 × BF25 − 1.31827 × BF27 + 0.533877 × BF29 − 0.429556 × BF30 − 0.309733 × BF31 − 0.225152 × BF32 − 0.2951 × BF33 + 1.11913 × BF35
Publisher’s Note: MDPI stays neutral with regard to jurisdictional claims in published maps and institutional affiliations.

