
Distribution Pattern and Enrichment Mechanism of Selenium in Topsoil in Handan Se-Enriched Belt, North China


 ,
, 
Abstract
:1. Introduction
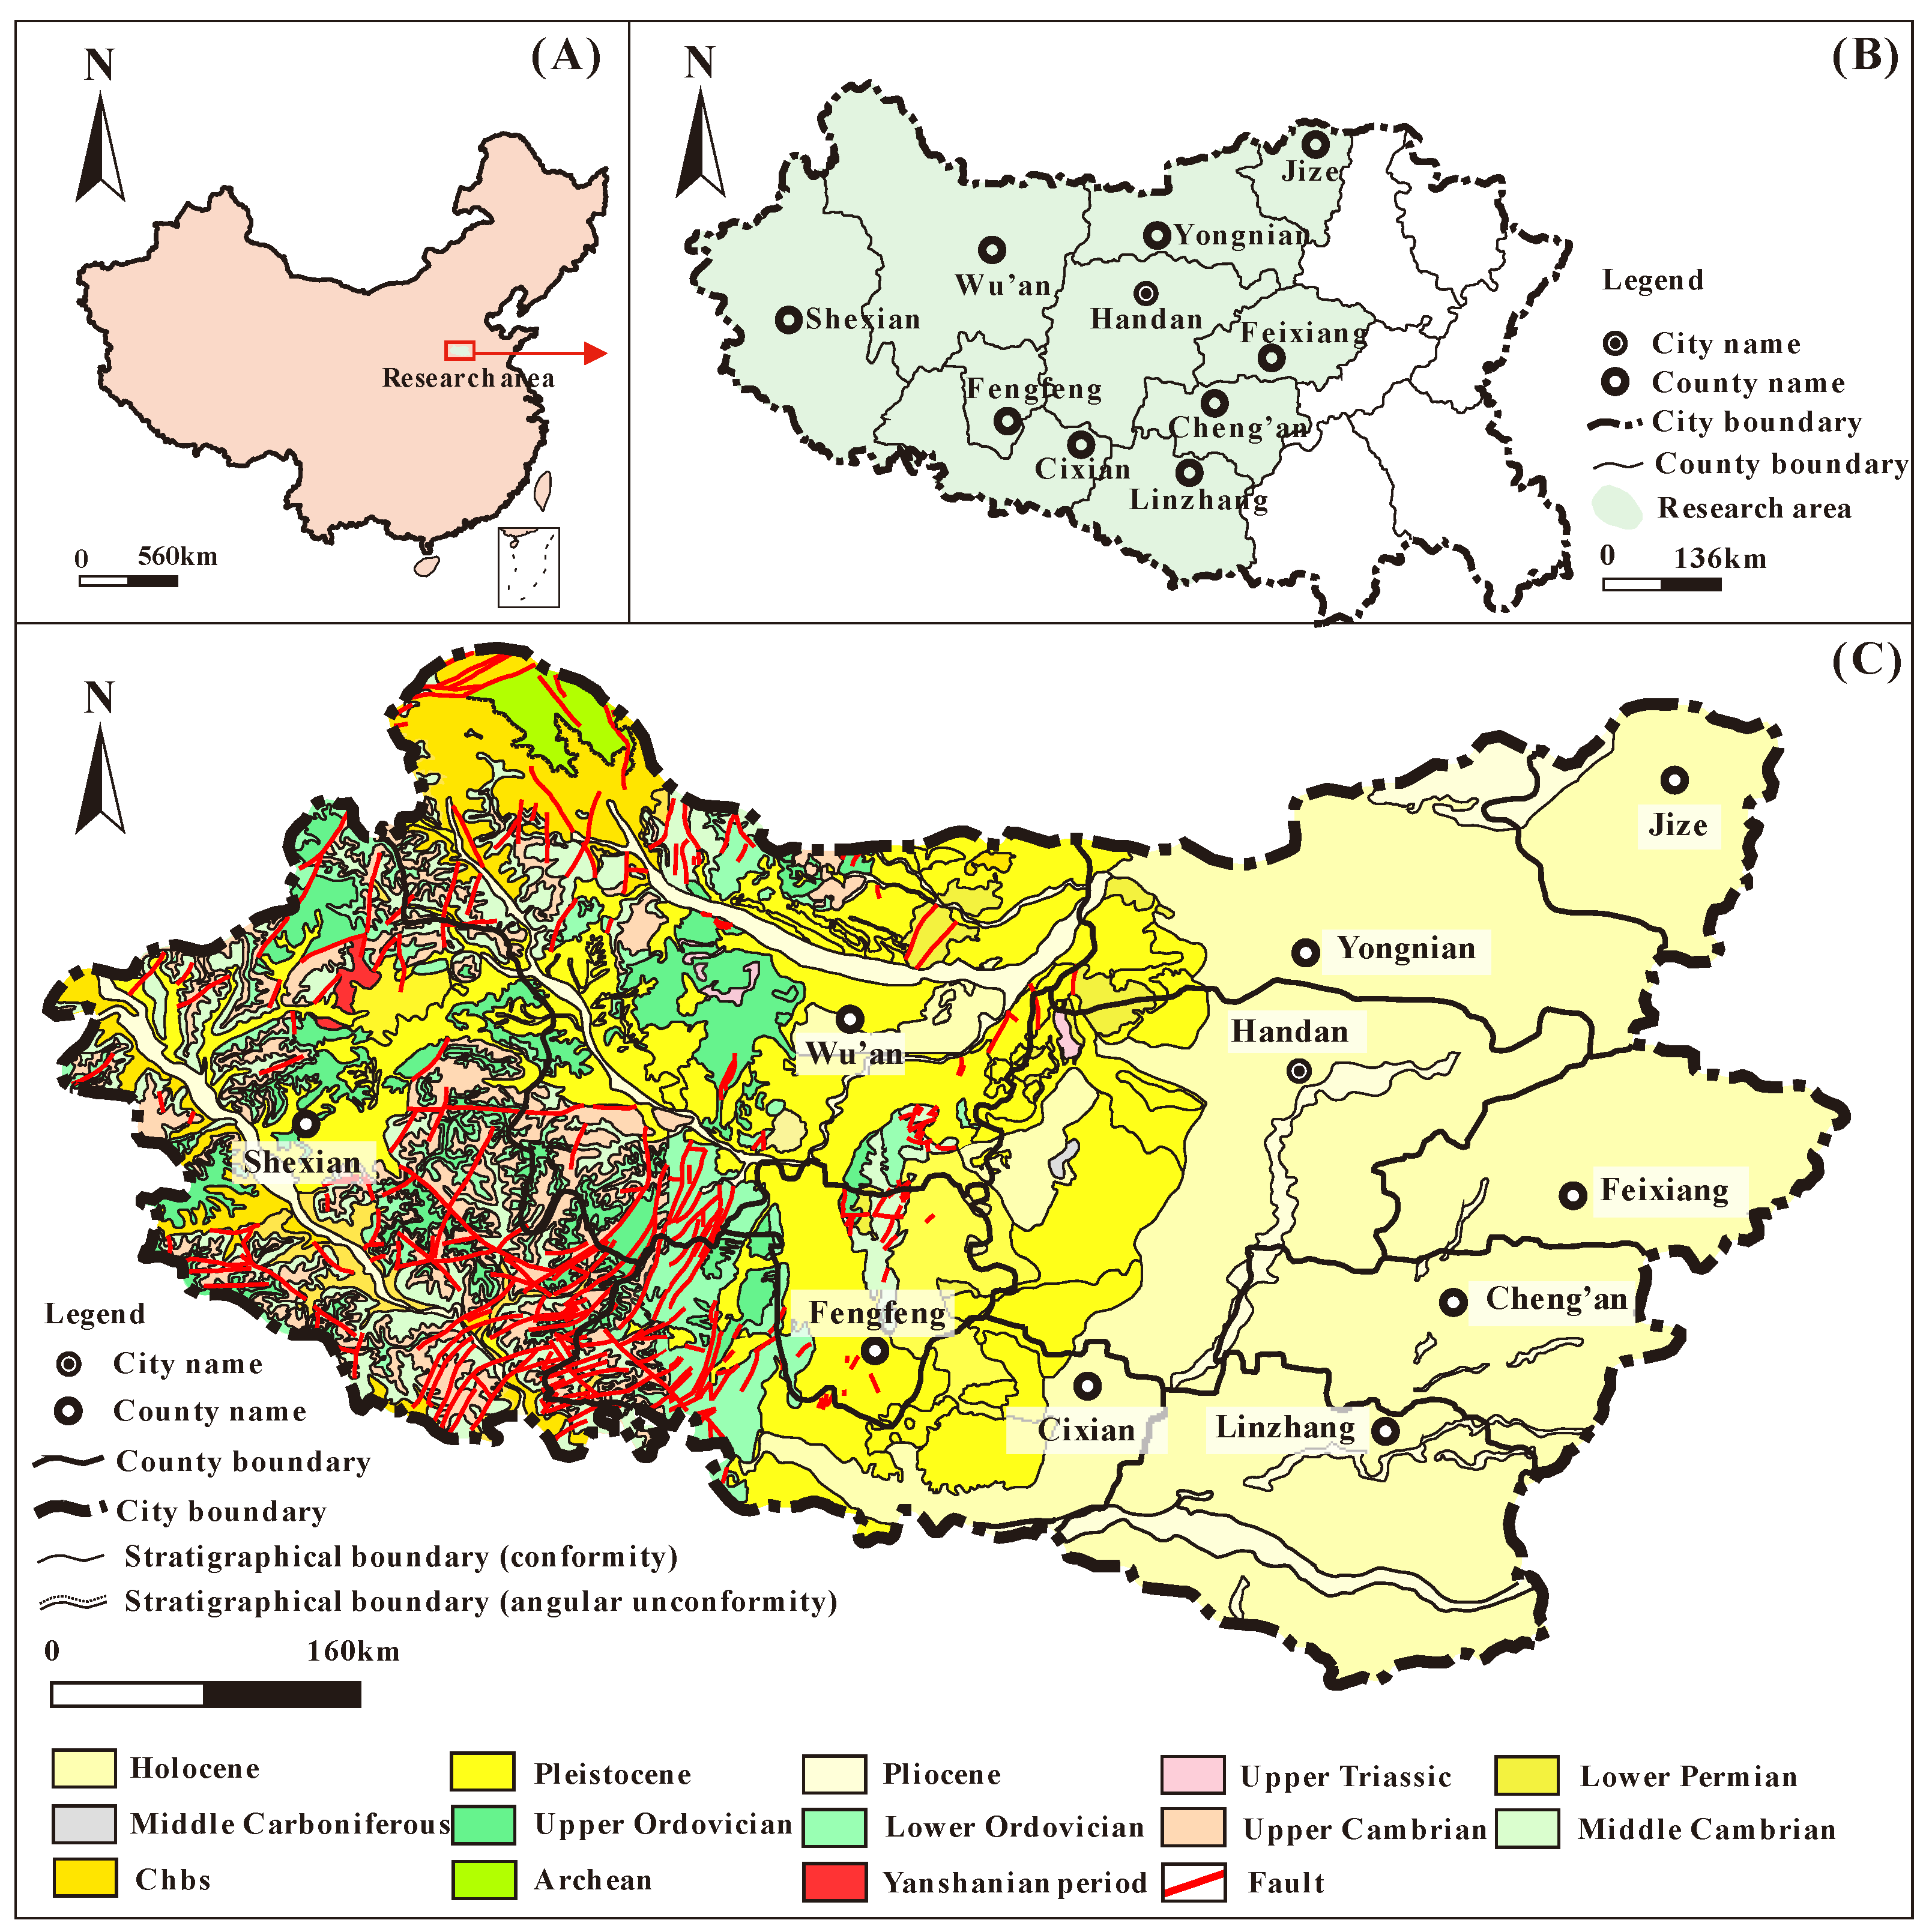
2. Geological Setting
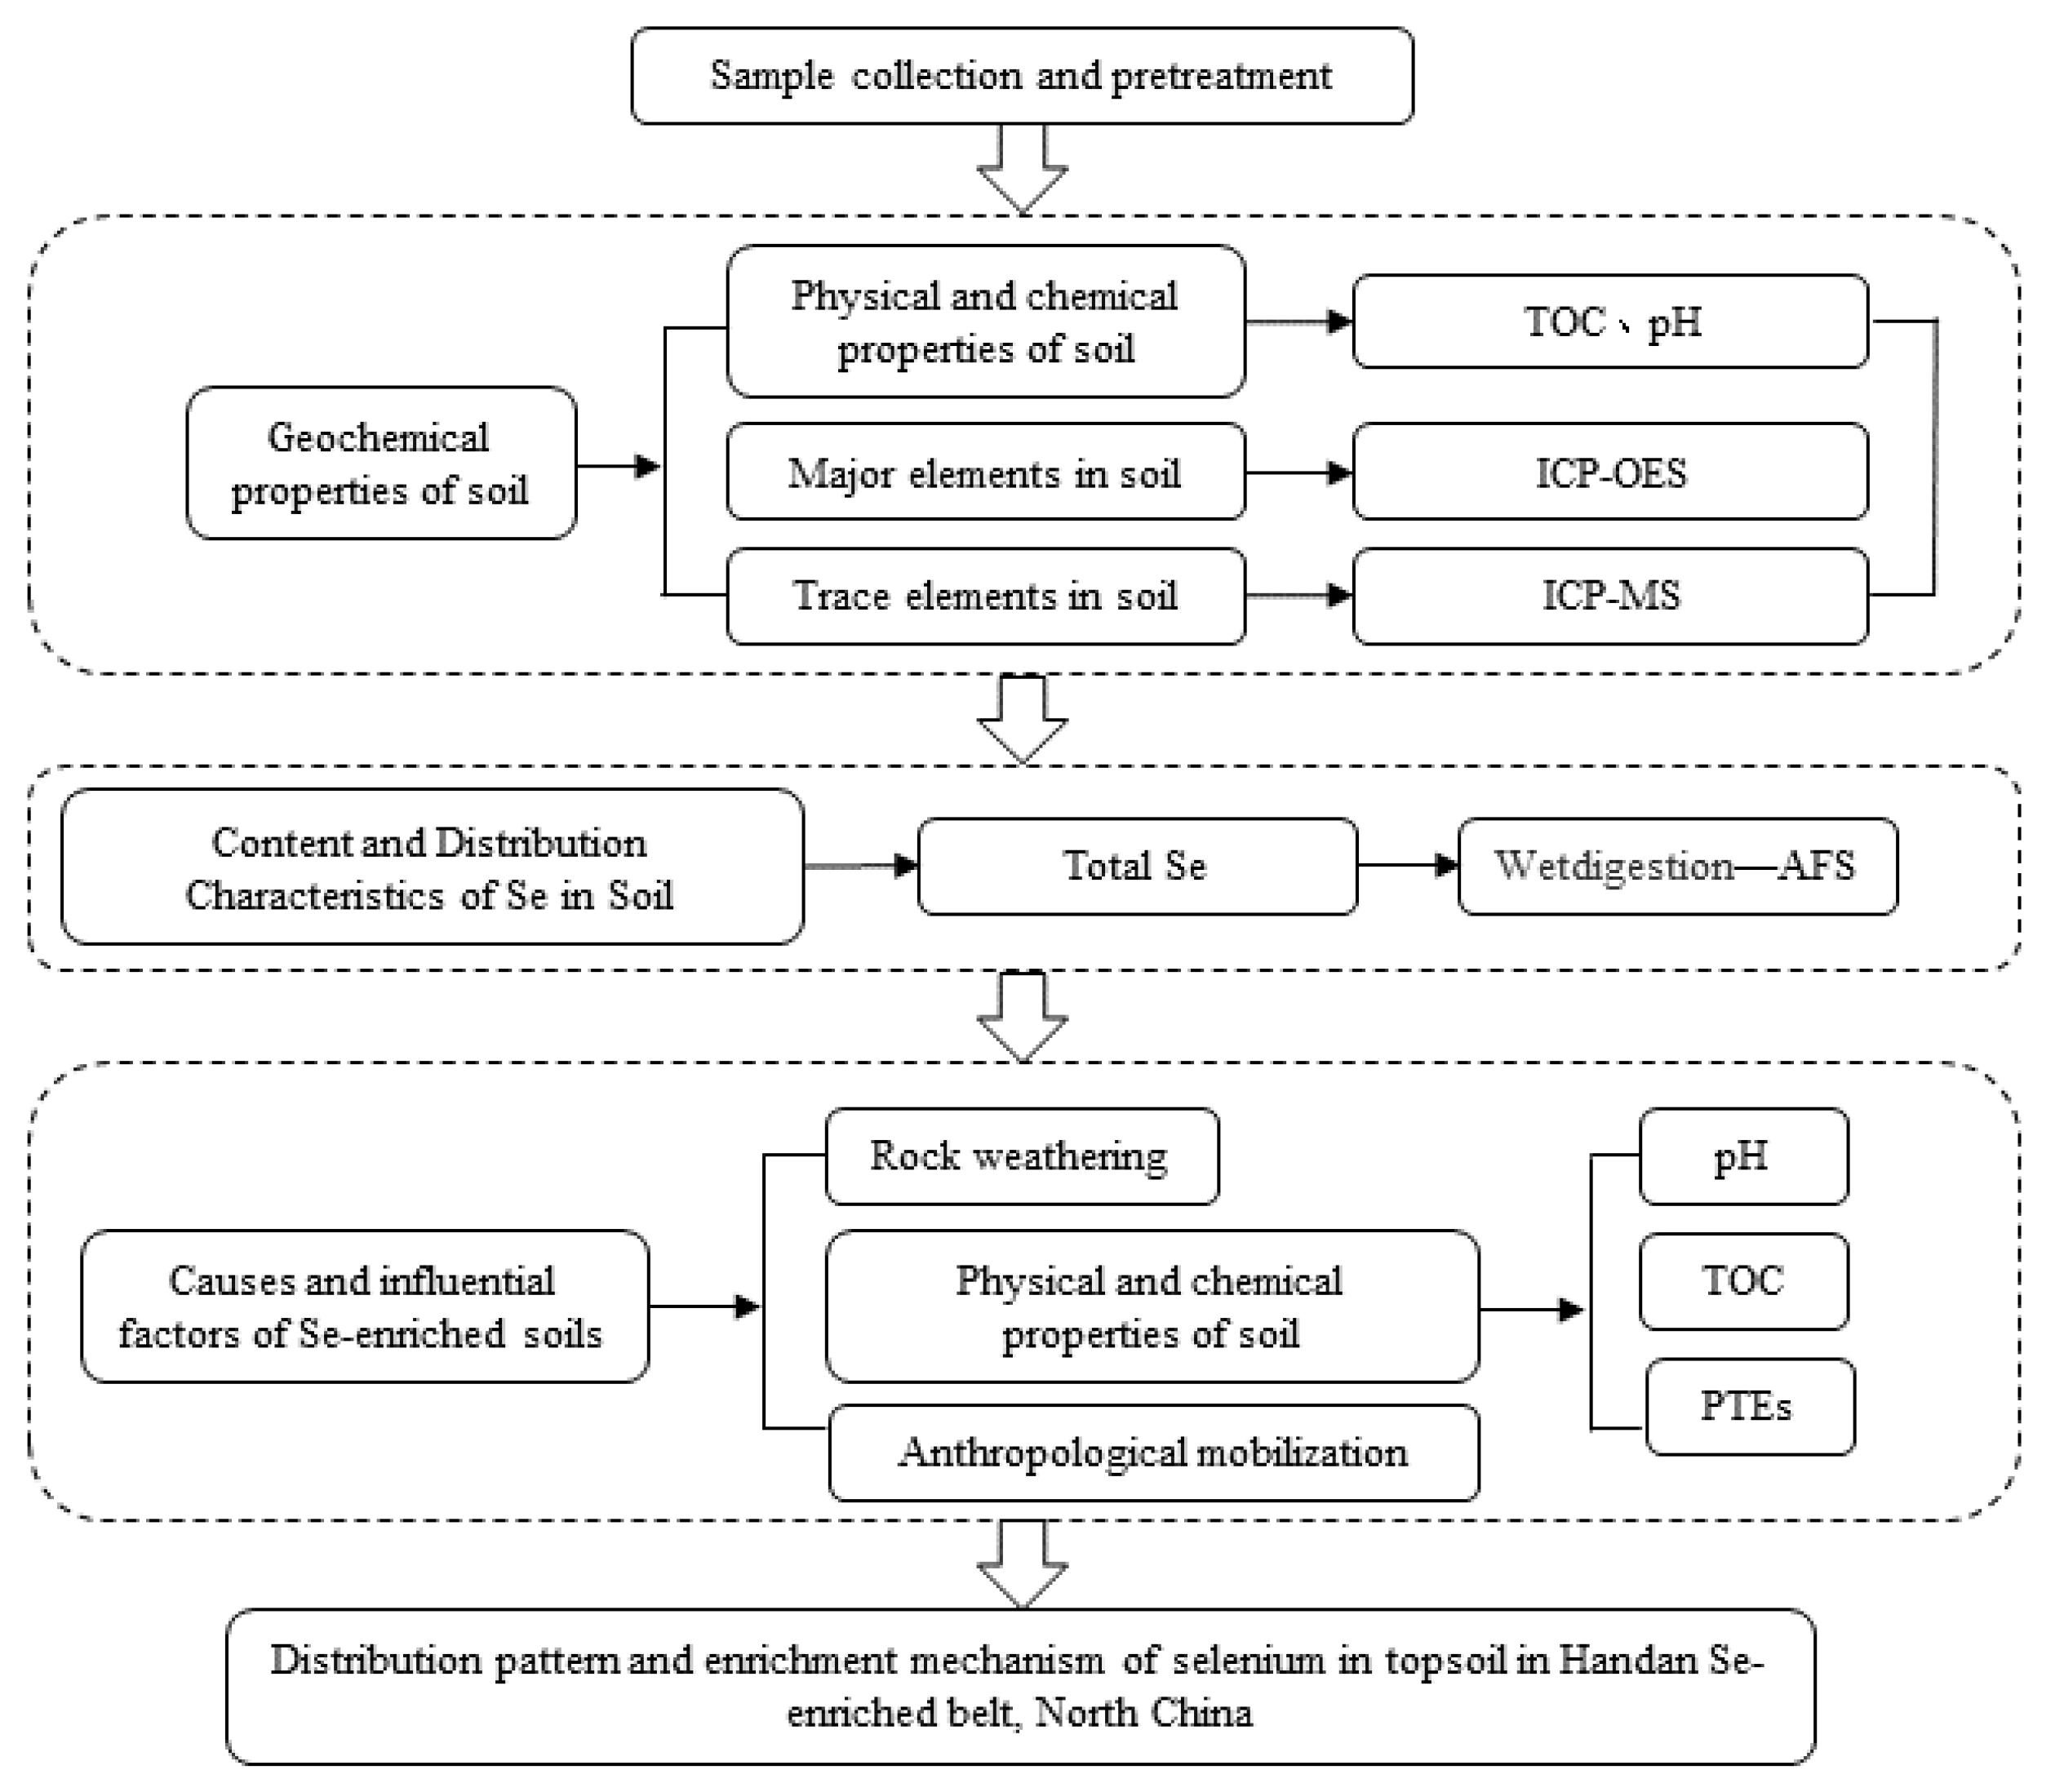
3. Materials and Methods
3.1. Sample Collection
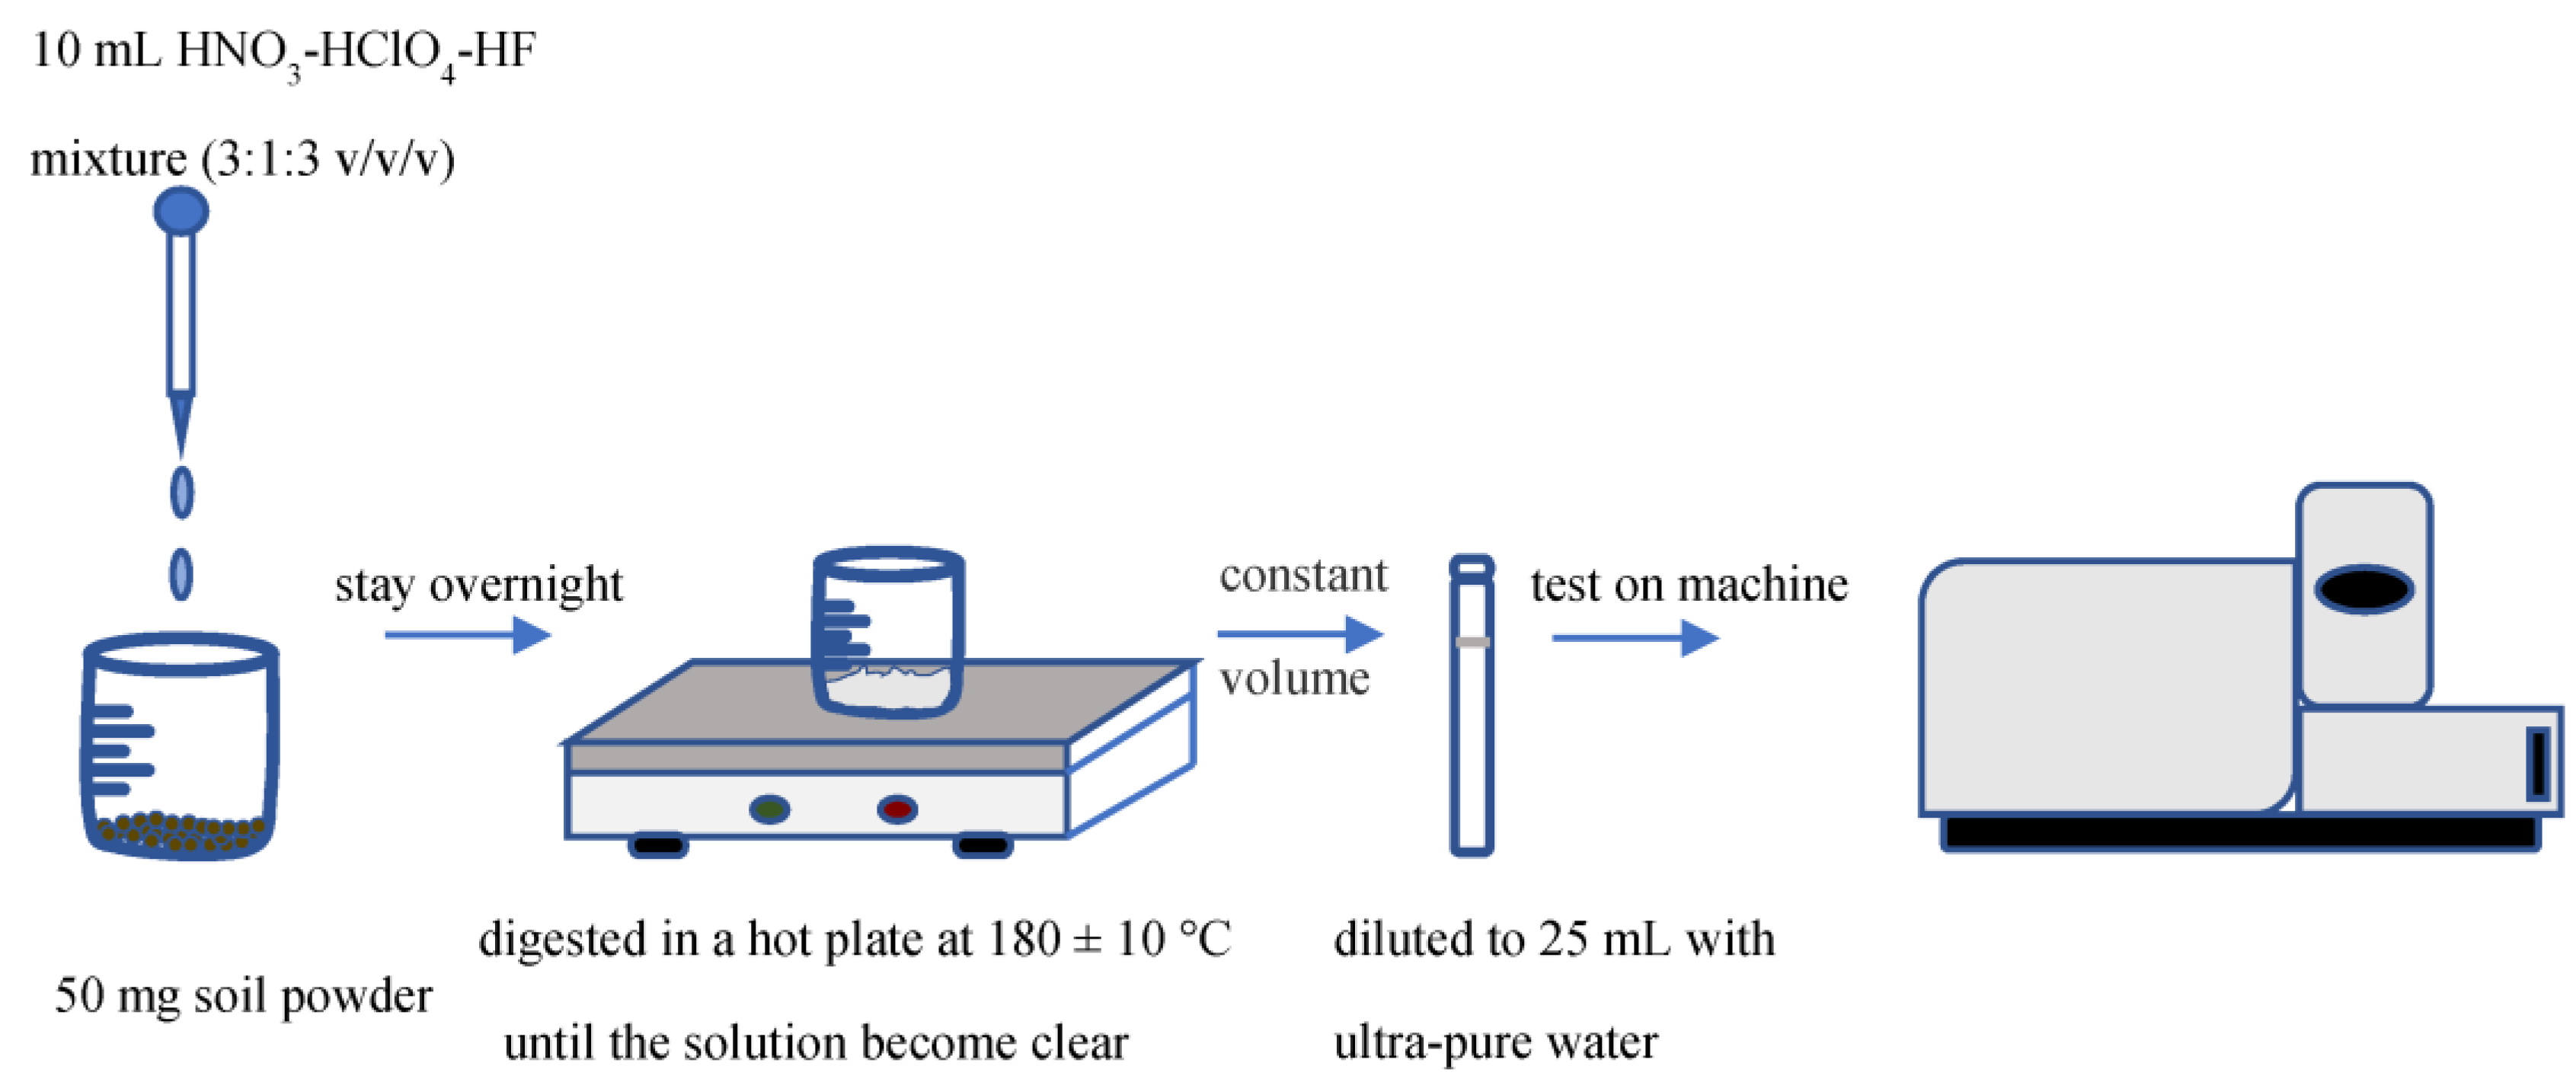
3.2. Measurement Procedure
3.3. Calculation of Pollution Indices
3.4. Statistical and Analytical Analysis
4. Results and Discussions
4.1. Geochemical Characteristics of Soil Samples
4.1.1. Major and Trace Elements Concentrations
4.1.2. Total Se Concentrations
4.1.3. Distribution Pattern of Se in Soils
4.2. Enrichment Factors of Se in Soils
4.3. Physicochemical Properties of Soils
4.3.1. pH, TOC, and BA
4.3.2. Potentially Toxic Trace Elements
4.3.3. Driving Factors of Se Concentration
4.4. Source Apportionment for Se in Soils
4.5. Assessment of PTEs Contamination in Soil
4.5.1. Analysis of Pollution Characteristics of PTEs in Soil
4.5.2. Spatial Distribution Characteristics of PTEs in Soil
4.5.3. Source Analysis of Potential Toxic Pollution
5. Conclusions
- (1)
- Oxides higher than the reference values of China and ECP soils are CaO, Fe2O3, MgO, and P2O5, and elements with significantly higher background values are S, Se, and Ge, while elements that are significantly lower than the reference value such as As, Nb, Sn, and Hf. The analyzed results of total Se concentrations in soils of Handan area ranged from 0.00 to 1.95 μg/g with an average value of 0.45 μg/g, which exceeds the standard of Se-enrichment (0.4 μg/g) classified by Tan (1989) and is significantly higher than the average value of Se in China soil (0.29 μg/g) and Hebei Plain (0.21 μg/g).
- (2)
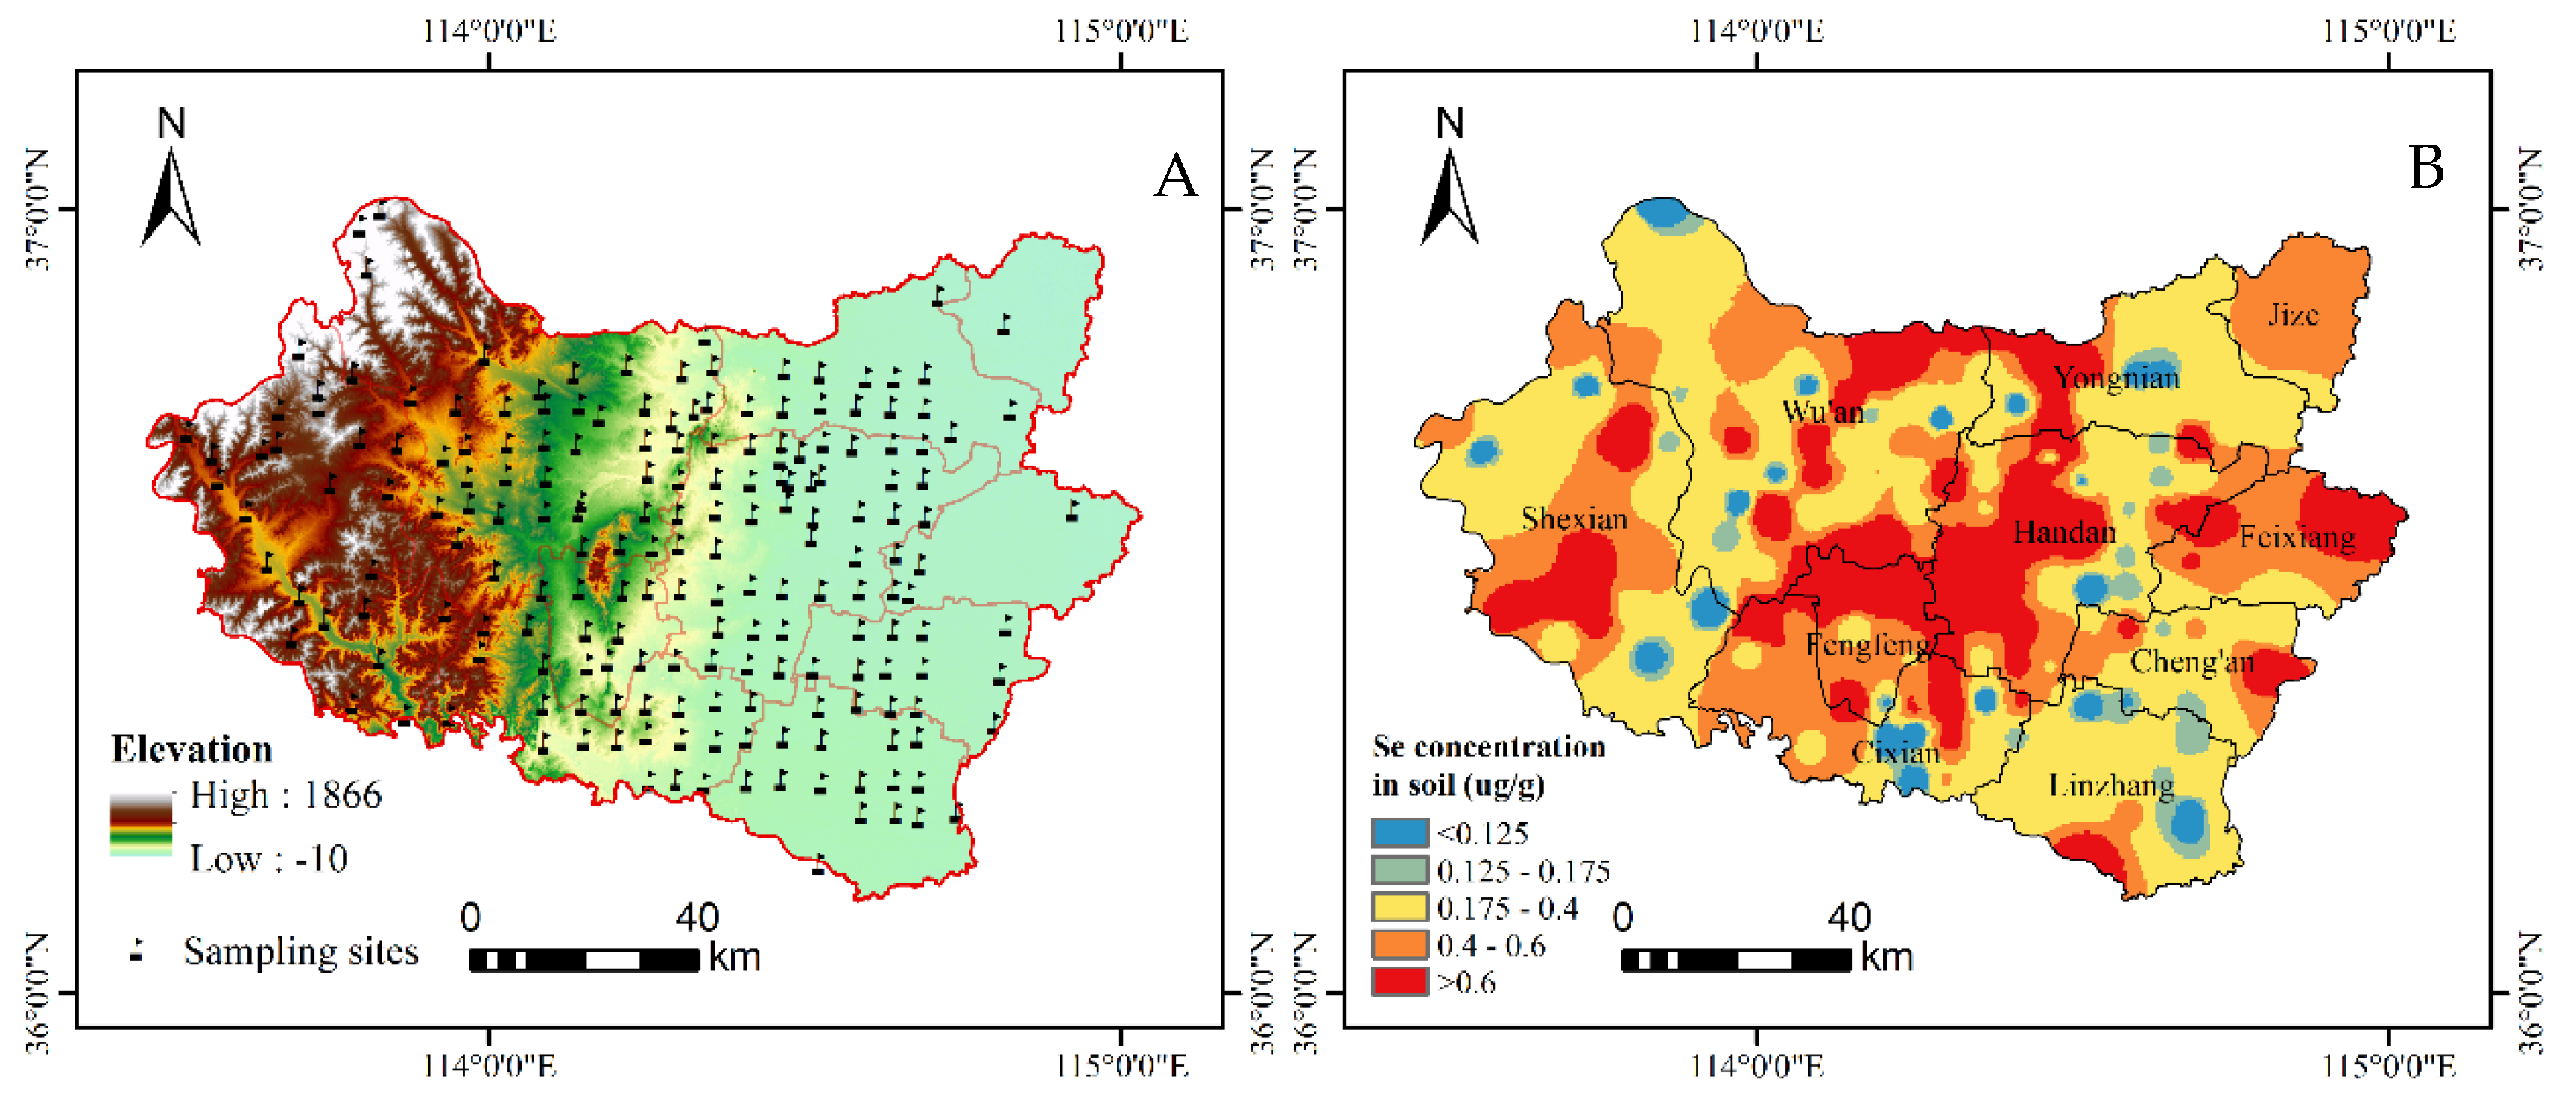
- The concentration of Se in the central regions of the target area is noticeably higher than in the surrounding region. A continuous and irregular ring-like high Se-enrichment area is formed in Handan City, Yongnian District, Wu’an City, and Fengfeng Mining District, which is defined as a positive abnormal Se zone. Selenium positive anomaly zone in the study area is located in the hilly area in the west of Handan City and east of Taihang Mountains, and the plains near Handan City.
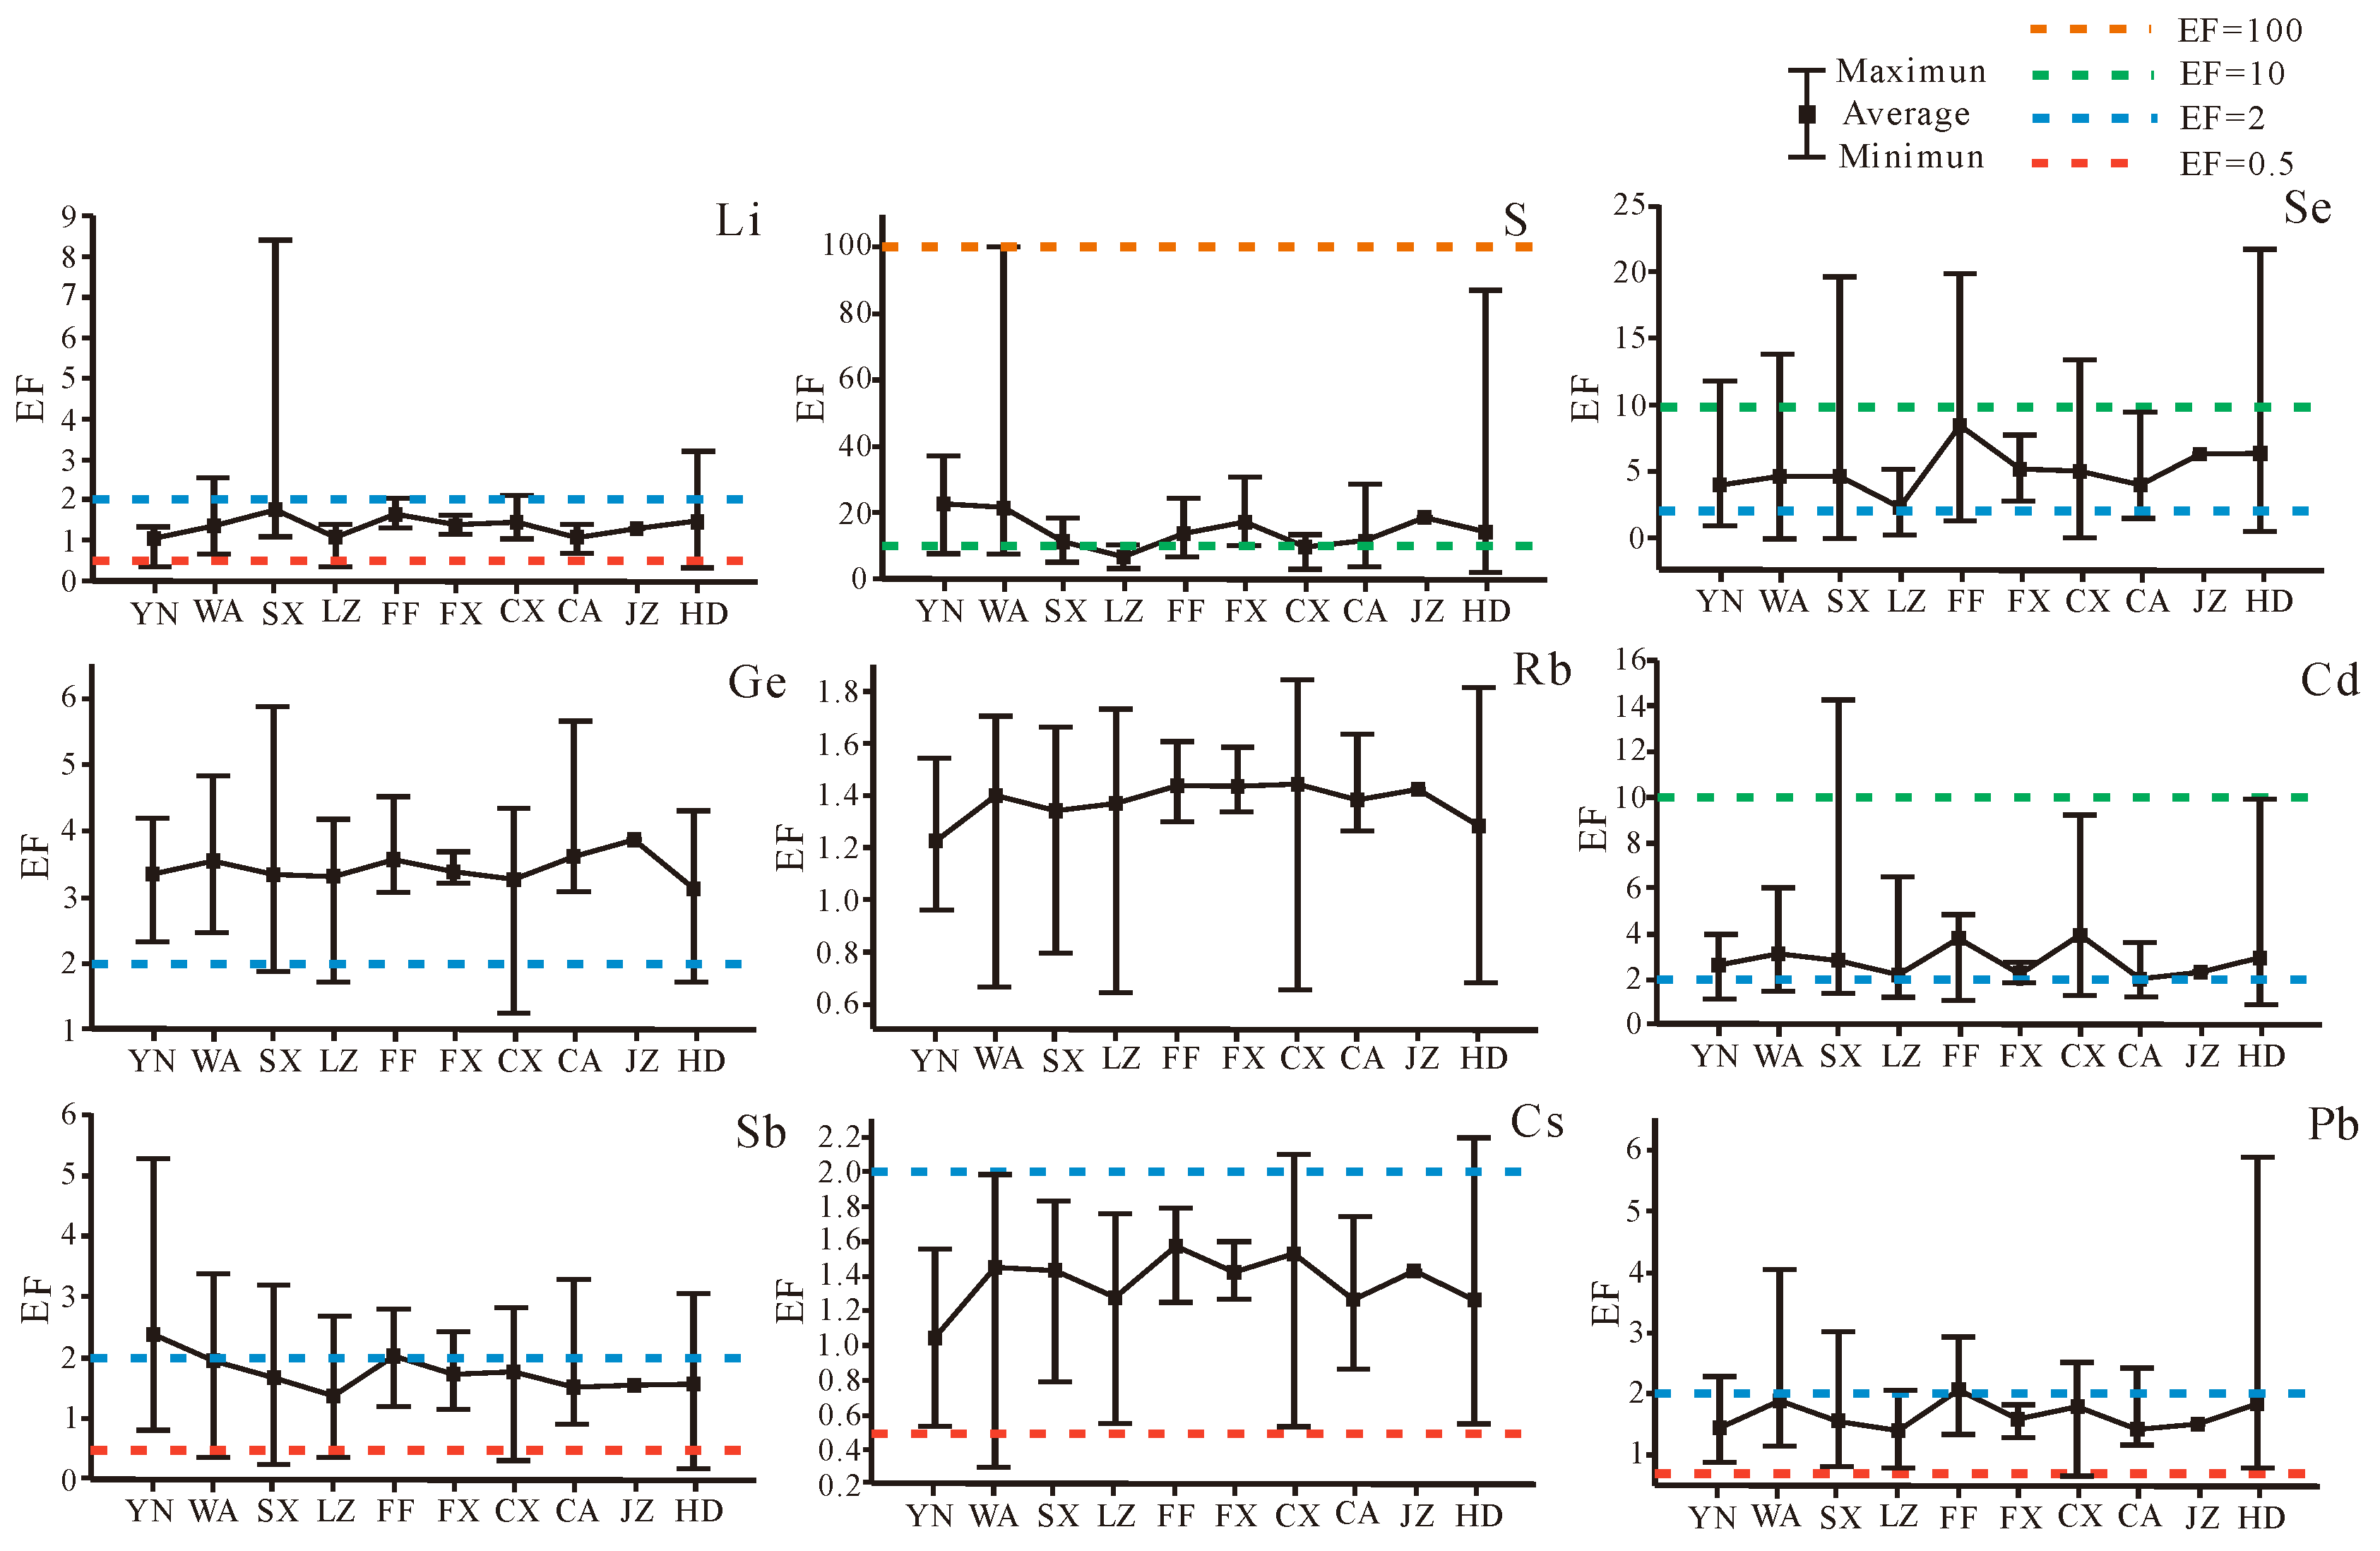
- (3)
- EF values of Se vary greatly from 0.01 to 21.66, with an average of 5.06. The mean value of Se enrichment degree in each county is slight enrichment, the maximum EF of Se is in Fengfeng, while the minimum value is in Linzhang. The top nine EF mean values of trace elements are: S (14.87) > Se (4.97) > Ge (3.37) > Cd (2.99) > Sb (1.77) > Pb (1.71) > Li (1.38) > Cs (1.36) > Rb (1.36).
- (4)
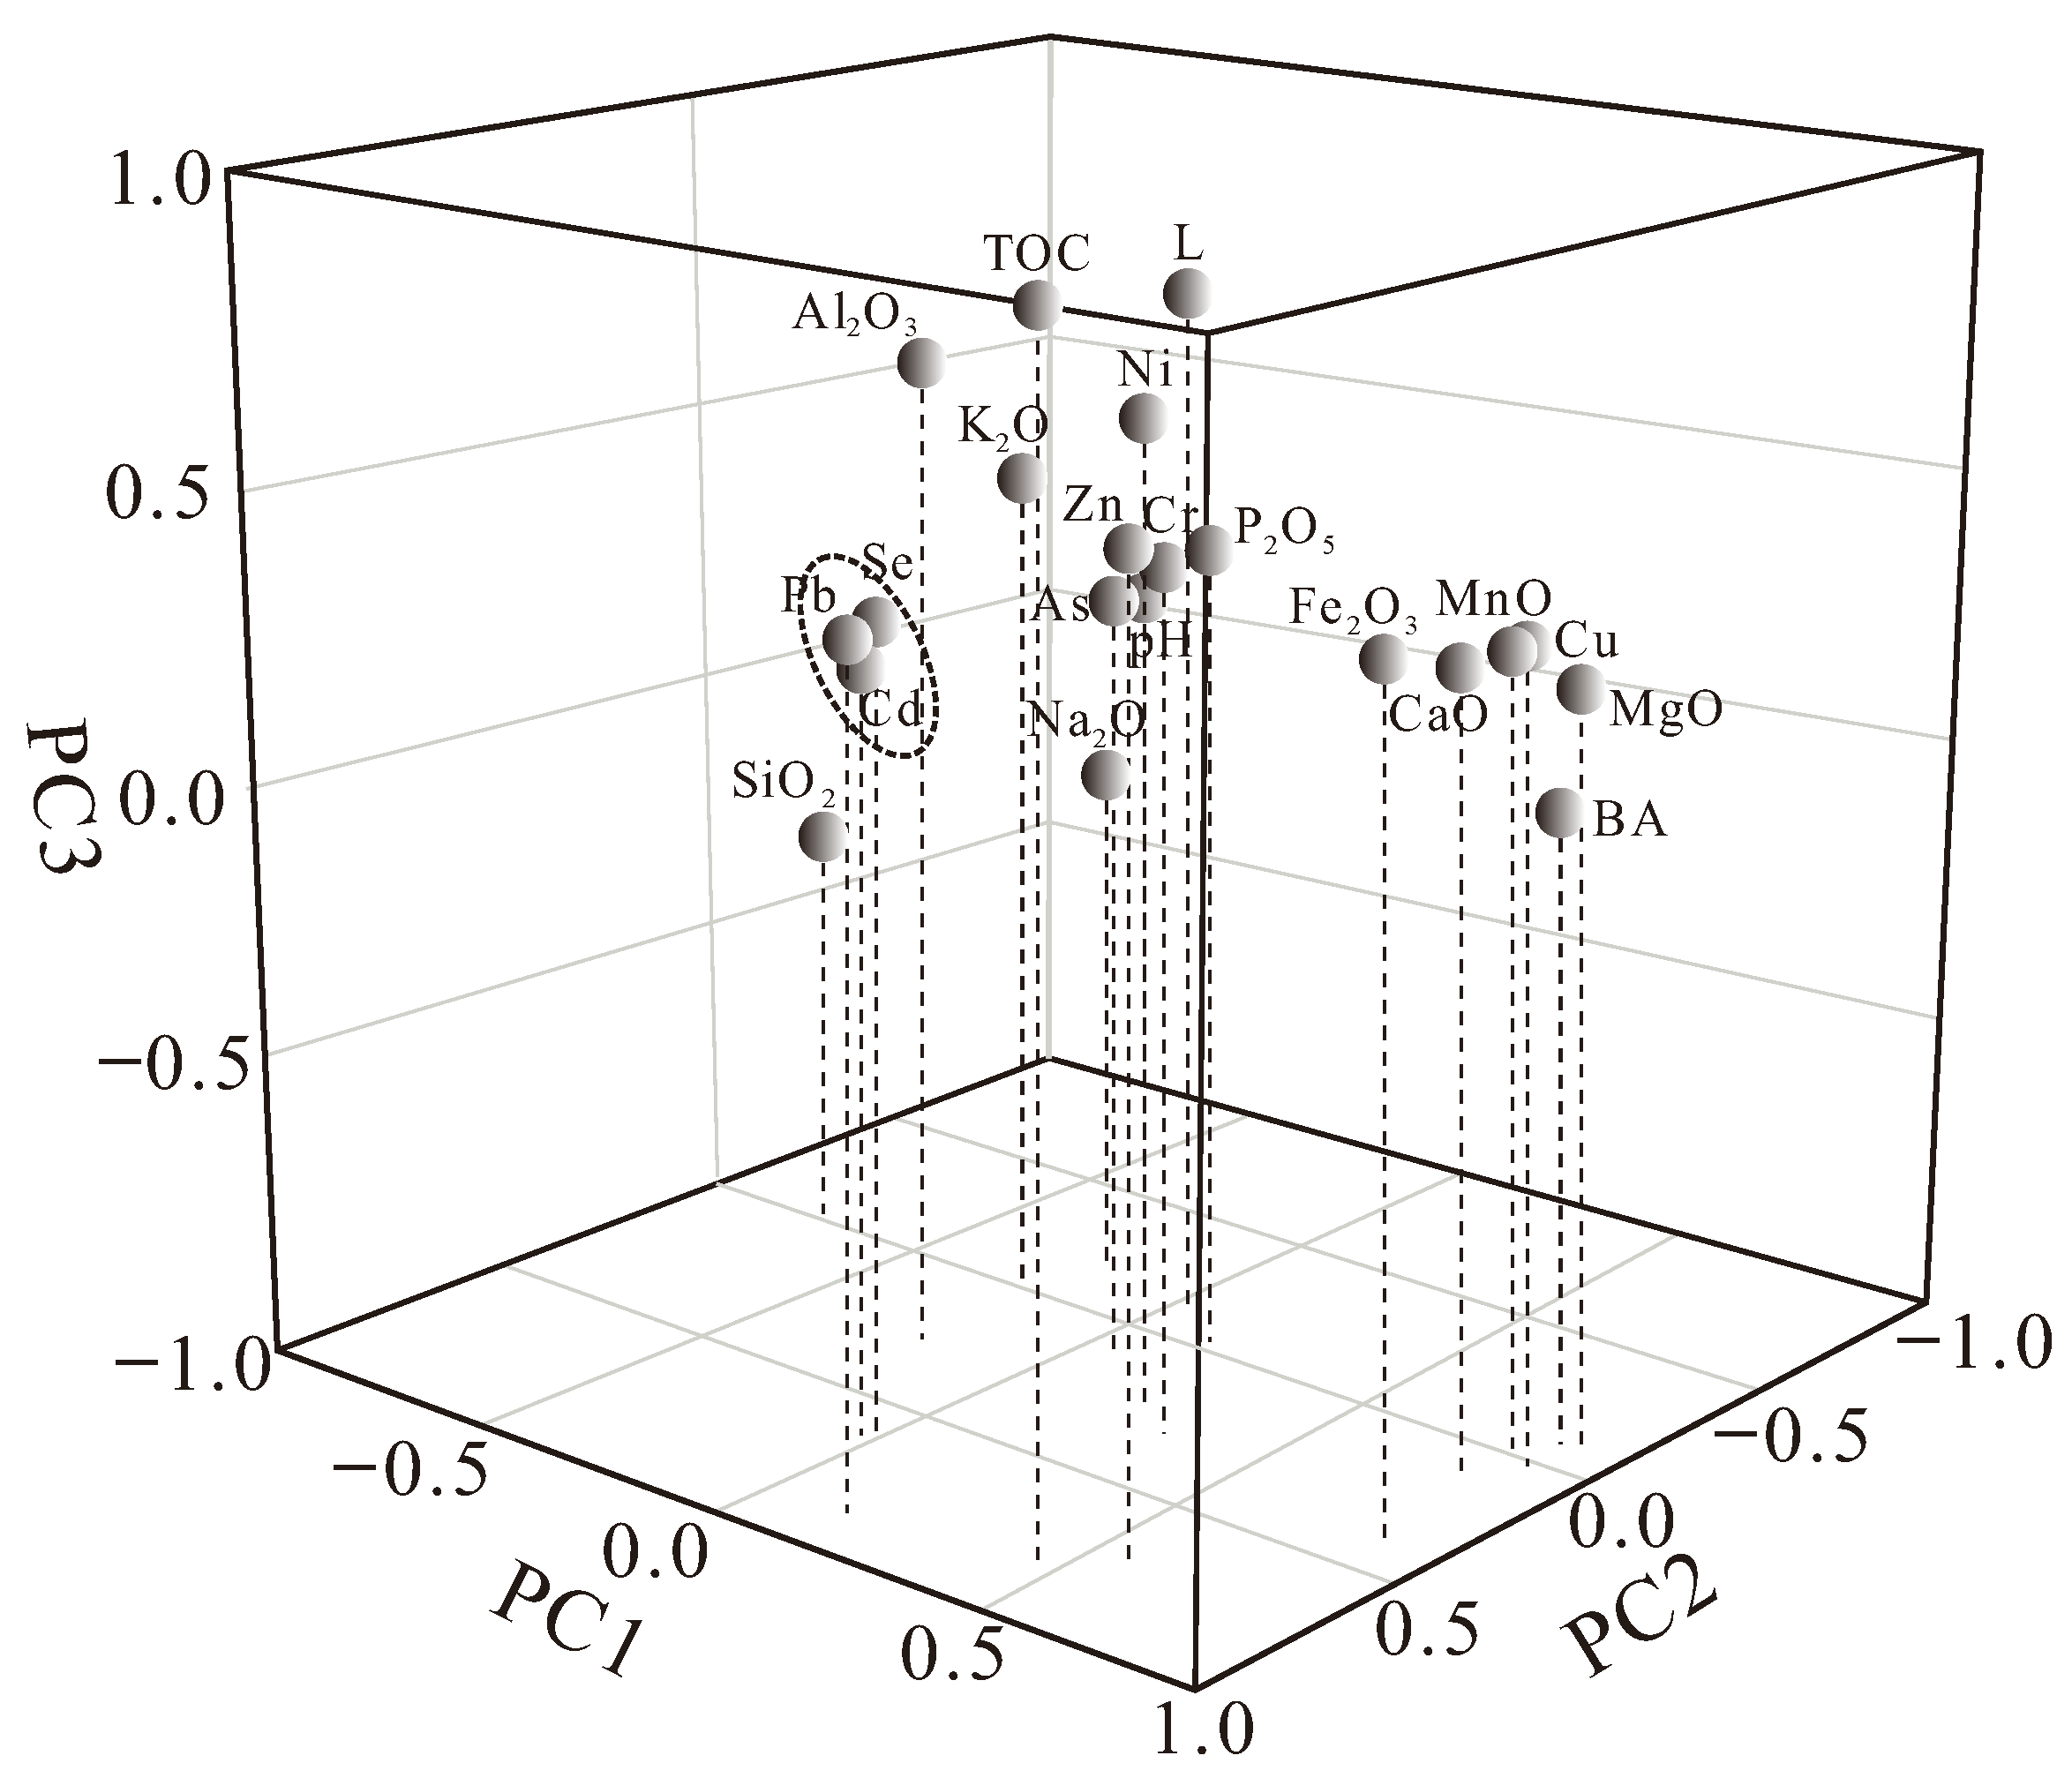
- The correlation coefficient between Se concentration and pH values suggests that pH is not the primary determinant of Se concentration distribution in the study area. Additionally, there is a significantly positive correlation between TOC and Se concentration; Cd, Pb, and Zn show a significantly positive correlation with Se. The result of PCA shows that Se concentration in the topsoil of Handan is affected synthetically by siderophile and chalcophile Cd, Pb, Fe2O3, and As.
- (5)
- Comprehensively, PCA results and Source apportionment suggest that Se enrichment in soils is principally affected by weathering and leaching of parent material, mining activities, and coal combustion.
- (6)
- As far as SFPI is concerned, most of the study areas are in the safety domain and slightly polluted domain and are at low ecological risk. The spatial distribution of NIPI is similar to that of SFPI of Cd, owing to highlights the heavy metal pollution with the most serious pollution degree. According to NIPI, the moderately and seriously polluted domain are distributed in Handan City, Fengfeng Mining District, and other central areas. The source apportionment of PTEs in the soil falls into two groups: (1) Cr, Ni, Cu, Zn, and As; (2) and Cd, and Pb. The first group is a component of a mixed source of both natural and anthropogenic. The second group originates from anthropogenic sources such as agricultural activities and industrial pollution.
Supplementary Materials
Author Contributions
Funding
Institutional Review Board Statement
Informed Consent Statement
Data Availability Statement
Acknowledgments
Conflicts of Interest
References
- Fordyce, F.M. Selenium Deficiency and Toxicity in the Environment. In Essentials of Medical Geology; Selinus, O., Ed.; Springer: Dordrecht, The Netherlands, 2013; pp. 375–416. [Google Scholar] [CrossRef]
- Mao, J.; Pop, V.J.; Bath, S.C.; Vader, H.L.; Redman, C.W.G.; Rayman, M.P. Effect of low-dose selenium on thyroid autoimmunity and thyroid function in UK pregnant women with mild-to-moderate iodine deficiency. Eur. J. Nutr. 2016, 55, 55–61. [Google Scholar] [CrossRef] [PubMed] [Green Version]
- Izquierdo, A.; Casas, C.; Herrero, E. Selenite-induced cell death in Saccharomyces cerevisiae: Protective role of glutaredoxins. Microbiology 2010, 156, 2608–2620. [Google Scholar] [CrossRef] [PubMed] [Green Version]
- Papp, L.V.; Lu, J.; Holmgren, A.; Khanna, K.K. From selenium to selenoproteins: Synthesis, identity, and their role in human health. Antioxid. Redox Signal. 2007, 9, 775–806. [Google Scholar] [CrossRef]
- Parker, D.R.; Feist, L.J.; Varvel, T.W.; Thomason, D.N.; Zhang, Y. Selenium phytoremediation potential of Stanleya pinnata. Plant Soil 2003, 249, 157–165. [Google Scholar] [CrossRef]
- Shi, Z.; Pan, P.; Feng, Y.; Kan, Z.; Li, Z.; Wei, F. Environmental water chemistry and possible correlation with Kaschin-Beck Disease (KBD) in northwestern Sichuan, China. Environ. Int. 2017, 99, 282–292. [Google Scholar] [CrossRef]
- Bajaj, M.; Eiche, E.; Neumann, T.; Winter, J.; Gallert, C. Hazardous concentrations of selenium in soil and groundwater in North-West India. J. Hazard. Mater. 2011, 189, 640–646. [Google Scholar] [CrossRef] [PubMed]
- WHO. Guidelines for Drinking-Water Quality; WHO: Geneva, Switzerland, 2011. [Google Scholar]
- Mcneal, J.M.; Balistrieri, L.S. Geochemistry and occurrence of selenium: An overview. Selenium Agric. Environ. 1989, 23, 1–13. [Google Scholar] [CrossRef]
- Dinh, Q.T.; Cui, Z.; Huang, J.; Tran, T.A.T.; Wang, D.; Yang, W.; Zhou, F.; Wang, M.; Yu, D.; Liang, D. Selenium distribution in the Chinese environment and its relationship with human health: A review. Environ. Int. 2018, 112, 294–309. [Google Scholar] [CrossRef]
- Wang, R.; Yu, T.; Zeng, Q.; Yang, Z. Distribution characteristics, origin and influencing factors of soil selenium concentration of main farming areas in China. Curr. Biotechnol. 2017, 7, 359–366, (In Chinese with English Abstract). [Google Scholar] [CrossRef]
- Li, Z. The Study on Source Tracking of Se Anomaly and Ecological Appraisal in Plain Terrain of Hebei. Ph.D. Thesis, Shijiazhuang University of Economics, Shijiazhuang, China, 2010. (In Chinese with English Abstract). [Google Scholar]
- Zhang, X.; Ma, Z.; Guo, H.; Wang, S.M.; Li, J.; Li, H.; Gao, H. Investigation report on multi-target regional geochemistry in Hebei plain area. Hebei Provincial Geological Survey Institute. 2009, 7, 2, (In Chinese with English Abstract). [Google Scholar]
- Zhang, X.; Ma, Z.; Wang, Y.; Wang, Z. The origin and ecological effects of selenium abnormity in soil im Hebei Plain. Earth Environ. 2012, 40, 541–547, (In Chinese with English Abstract). [Google Scholar] [CrossRef]
- Rawlins, B.G.; McGrath, S.P.; Scheib, A.J.; Breward, N.; Cave, M.; Lister, T.R.; Ingham, M.; Gowing, C.; Carter, S. The Advanced Soil Geochemical Atlas of England and Wales; British Geological Survey: Nottingham, UK, 2012; 227p. [Google Scholar]
- Ni, R.; Luo, K.; Tian, X.; Yan, S.; Zhong, J.; Liu, M. Distribution and geological sources of selenium in environmental materials in Taoyuan County, Hunan Province, China. Environ. Geochem. Health. 2016, 38, 927–938. [Google Scholar] [CrossRef] [PubMed] [Green Version]
- Long, J.; Luo, K. Trace element distribution and enrichment patterns of Ediacaran-early Cambrian, Ziyang selenosis area, Central China: Constraints for the origin of Selenium. J. Geochem. Explor. 2017, 172, 211–230. [Google Scholar] [CrossRef] [Green Version]
- Feng, C.; Liu, S.; Coulson, I.M. Lithological and Si–O–S isotope geochemistry: Constraints on the origin and genetic environment of the selenium (Se)-rich siliceous rocks in Enshi, Hubei Province, China. Acta Geochim. 2021, 40, 89–105. [Google Scholar] [CrossRef]
- Tan, J. The Atlas of Endemic Diseases and their Environments in the People’s Republic of China; Science Press: Beijing, China, 1989. (In Chinese) [Google Scholar]
- Wang, H.; Mo, X. An outline of the tectonic evolution of China. Episodes J. Int. Geosci. 1995, 18, 6–16. [Google Scholar] [CrossRef] [Green Version]
- Yan, C. Landform and structure of Handan area. J. Hebei Inst. Archit. Sci. Technol. 2000, 17, 63–65, (In Chinese with English Abstract). [Google Scholar]
- BGMRHB (Bureau of Geology and Mineral Resources of Hebei Province). Regional Geology of Beijing, Tianjin and Hebei Province; Geological Publishing House: Beijing, China, 1989. [Google Scholar]
- Zheng, J.; Mao, J.; Chen, M.; Li, G.; Ban, C. Geological characteristics and metallogenic model of skarn iron deposits in the Handan-Xingtai area, southern Hebei, China. Geol. Bull. China. 2007, 26, 150–154, (In Chinese with English Abstract). [Google Scholar]
- Luo, K. Arsenic and fluorine contents and distribution patterns of early Paleozoic stonelike coal in the Daba Fold Zone and Yangtze Plate, China. Energy Fuels 2011, 25, 4479–4487. [Google Scholar] [CrossRef]
- Tian, X.; Luo, K. Selenium, arsenic and molybdenum variation and bio-radiation in the Ediacaran-Cambrian interval. Precambrian Res. 2017, 292, 378–385. [Google Scholar] [CrossRef]
- Niu, C.; Luo, K. Relationship of selenium, arsenic and sulfur in soil and plants in Enshi County, China. J. Food Agric. Environ. 2011, 9, 646–651. [Google Scholar]
- Xing, Y.; Liu, Y.; Liang, P.; Liao, Q.; Pan, L.; Chen, J.; Huang, T.; Jiang, Z. Effects of phosphorus on selenium uptake of pakchoi and soil selenium morphology in Se-rich latosolic red soil and red soil. Soils 2018, 50, 1170–1175, (In Chinese with English Abstract). [Google Scholar] [CrossRef]
- Zhu, L.; Ma, M.; Wang, Z. Soil eco-geochemical baseline in alluvial plains of eastern China. Geol. China 2006, 33, 1400–1405. [Google Scholar]
- Nemerow, N.L. Scientific Stream Pollution Analysis; Scripta Book, Co.: Hagerstown, MD, USA, 1974. [Google Scholar]
- Cheng, J.; Zhou, S.; Zhu, Y. Assessment and mapping of environmental quality in agricultural soils of Zhejiang Province, China. J. Environ. Sci. 2007, 19, 50–54. [Google Scholar] [CrossRef]
- Gong, G.; Mattevada, S.; O’bryant, S.E. Comparison of the accuracy of kriging and IDW interpolations in estimating groundwater arsenic concentrations in Texas. Environ. Res. 2014, 130, 59–69. [Google Scholar] [CrossRef]
- Yan, M.; Gu, T.; Chi, Q.; Wang, C. Abundance of chemical elements of soils in China and supergenesis geochemistry characteristics. Geophys. Geochem. Explor. 1997, 21, 161–167, (In Chinese with English Abstract). [Google Scholar]
- Liu, Z. Soil trace elements in China. Adv. Earth Sci. 1998, 13, 589. (In Chinese) [Google Scholar]
- Zhang, H.; Luo, Y.; Wu, L.; Zhang, G.; Zhao, Q.; Huang, M. Hong Kong soil researches II. distribution and content of Selenium in soil. Acta Pedol. Sin. 2005, 42, 404–410, (In Chinese with English Abstract). [Google Scholar]
- Zhang, X.; Wen, H.; Cai, L.; Luo, J.; Mu, G.; Wang, Q.; Jiang, H.; Wang, S. Distribution of Selenium and Its Influencing Factors in Soils of Jiedong Area, Guangdong Province. Environ. Sci. Technol. 2019, 42, 189–196. [Google Scholar] [CrossRef]
- Liu, Y.; Tian, X.; Liu, R.; Liu, S.; Zuza, A.V. Key driving factors of selenium-enriched soil in the low-se geological belt: A case study in red beds of sichuan basin, China. Catena 2021, 196, 104926. [Google Scholar] [CrossRef]
- Zhu, J.; Wang, N.; Li, S.; Li, L.; Su, H.; Liu, C. Distribution and transport of selenium in Yutangba, China: Impact of human activities. Sci. Total Environ. 2008, 392, 252–261. [Google Scholar] [CrossRef]
- Rudnick, R.L.; Gao, S.; Holland, H.D. Composition of the continental crust. Crust 2003, 3, 1–64. [Google Scholar]
- Alfthan, G.; Eurola, M.; Ekholm, P.; Venäläinen, E.; Root, T.; Korkalainen, K.; Hartikainen, H.; Salminen, P.; Hietaniemi, V.; Aspila, P.; et al. Effects of nationwide addition of selenium to fertilizers on foods, and animal and human health in Finland: From deficiency to optimal selenium status of the population. J. Trace Elem. Med. Biol. 2015, 31, 142–147. [Google Scholar] [CrossRef] [PubMed]
- Cartes, P.; Gianfreda, L.; Mora, M. Uptake of selenium and its antioxidant activity in ryegrass when applied as selenate and selenite forms. Plant Soil 2005, 276, 359–367. [Google Scholar] [CrossRef] [Green Version]
- Xiao, K.; Tang, J.; Chen, H.; Li, D.; Liu, Y. Impact of land use/land cover change on the topsoil selenium concentration and its potential bioavailability in a karst area of southwest China. Sci. Total Environ. 2020, 708, 135201. [Google Scholar] [CrossRef] [PubMed]
- Ngigi, P.B.; Laing, D.G.; Masinde, P.W.; Lachat, C. Selenium deficiency risk in central Kenya highlands: An assessment from the soil to the body. Environ. Geochem. Health 2020, 42, 2233–2250. [Google Scholar] [CrossRef]
- Matos, R.P.; Lima, V.M.; Windmöller, C.C.; Nascentes, C.C. Correlation between the natural levels of selenium and soil physicochemical characteristics from the Jequitinhonha Valley (MG), Brazil. J. Geochem. Explor. 2017, 172, 195–202. [Google Scholar] [CrossRef]
- Nakamaru, Y.M.; Altansuvd, J. Speciation and bioavailability of selenium and antimony in non-flooded and wetland soils: A review. Chemosphere 2014, 111, 366–371. [Google Scholar] [CrossRef]
- Li, J.; Peng, Q.; Liang, D.L.; Liang, S.J.; Chen, J.; Sun, H.; Li, S.Q.; Lei, P.H. Effects of aging on the fraction distribution and bioavailability of selenium in three different soils. Chemosphere 2016, 144, 2351–2359. [Google Scholar] [CrossRef]
- Wang, C.; Ji, J.; Zhu, F. Characterizing Se transfer in the soil-crop systems under field condition. Plant Soil 2017, 415, 535–548. [Google Scholar] [CrossRef]
- Wang, H.; Luo, J.; Cai, L.; Mu, G.; Wang, Q.; Jiang, H.; Wang, S.; He, M. Distribution of selenium and its influencing factors in soils of Huilai county, Guangdong Province. Chin. J. Agric. Resour. Reg. Plan. 2020, 41, 262–269, (In Chinese with English Abstract). [Google Scholar]
- Hao, L.; Zhang, J.; Zhang, S.; Ma, S.; Li, B.; Long, J.; Fan, J.; Luo, K. Distribution characteristics and main influencing factors of selenium in surface soil of natural selenium-rich area: A case study in Langao County, China. Environ. Geochem. Health 2021, 43, 333–346. [Google Scholar] [CrossRef] [PubMed]
- Yuan, B.; Feng, Y.; Li, S.; Lu, G.; You, J.; Xiao, F. Analysis on the Causes and Influencing Factors of Selenium-Rich Soil in Sinan County. China Resour. Compr. Util. 2021, 39, 63–68, (In Chinese with English Abstract). [Google Scholar]
- Xu, Y.; Li, Y.; Li, H.; Wang, L.; Liao, X.; Wang, J.; Kong, C. Effects of topography and soil properties on soil selenium distribution and bioavailability (phosphate extraction): A case study in Yongjia County, China. Sci. Total Environ. 2018, 633, 240–248. [Google Scholar] [CrossRef] [PubMed]
- Tan, J.; Zhu, W.; Wang, W.; Li, R.; Hou, S.; Wang, D.; Yang, L. Selenium in soil and endemic diseases in China. Sci. Total Environ. 2002, 284, 227–235. [Google Scholar] [CrossRef]
- Fakour, H.; Lin, T.; Lo, S. Equilibrium modeling of arsenic adsorption in a ternary arsenic–iron oxide–natural organic matter system. Clean Soil Air Water 2016, 44, 1287–1295. [Google Scholar] [CrossRef]
- Li, X.; Gao, N.; Zhao, W.; Liu, Z. Distribution characteristics of selenium in cultivated soil and its influencing factors in Qingtongxia City of Ningxia. J. Agric. Resour. Environ. 2018, 35, 422–429, (In Chinese with English Abstract). [Google Scholar] [CrossRef]
- Chen, R.; Zhang, L.; Wu, Y.; Qiu, L. Soil Profi le Weathering Feature of Eroded Weathering Granite Slope at Different Sections. Acta Pedol. Sin. 2016, 53, 1380–1388, (In Chinese with English Abstract). [Google Scholar]
- Yu, T.; Yang, Z.; Lv, Y.; Hou, Q.; Xia, X.; Feng, H.; Zhang, M.; Jin, L.; Kan, Z. The origin and geochemical cycle of soil selenium in a Se-rich area of China. J. Geochem. Explor. 2014, 139, 97–108. [Google Scholar] [CrossRef]
- Xia, F.; Zhang, X.; Yang, Y.; Chen, P.; Liu, B. Geochemical characteristics and influencing factors of selenium in soils and agricultural products in Ningguo City, Anhui Province. Soils 2021, 53, 585–593, (In Chinese with English Abstract). [Google Scholar] [CrossRef]
- Nakamura, K.; Kuwatani, T.; Kawabe, Y.; Komai, K. Extraction of heavy metals characteristics of the 2011 Tohoku tsunami deposits using multiple classification analysis. Chemosphere 2016, 144, 1241–1248. [Google Scholar] [CrossRef] [Green Version]
- Fang, X.; Peng, B.; Wang, X.; Song, Z.; Zhou, D.; Wang, Q.; Qin, Z.; Tan, C. Distribution, contamination and source identification of heavy metals in bed sediments from the lower reaches of the Xiangjiang River in Hunan province, China. Sci. Total Environ. 2019, 689, 557–570. [Google Scholar] [CrossRef] [PubMed]
- Tribovillard, N.; Algeo, T.J.; Lyons, T.; Riboulleau, A. Trace metals as paleoredox and paleoproductivity proxies: An update. Chem. Geol. 2006, 232, 12–32. [Google Scholar] [CrossRef]
- Brügmann, G.; Naldrett, A.; Asif, M.; Lightfoot, P.C.; Gorbachev, N.S.; Fedorenko, V.A. Siderophile and chalcophile metals as tracers of the evolution of the Siberian Trap in the Noril’sk region, Russia. Geochim. Cosmochim. Acta 1993, 57, 2001–2018. [Google Scholar] [CrossRef]
- Rosenfeld, I.; Beath, O.A. Selenium: Geobotany, Biochemistry, Toxicity, and Nutrition; Academic Press: Cambridge, MA, USA, 2013. [Google Scholar]
- Wang, Z.; Gao, Y. Biogeochemical cycling of selenium in Chinese environments. Appl. Geochem. 2001, 16, 1345–1351. [Google Scholar] [CrossRef]
- Zhang, M.; Sun, Y. Source of selenium in Handan geochemical anomaly belt: Evidences from petrology and geochemistry of Upper Paleozoic in western Handan, China. J. Geochem. Explor. 2021, 226, 106770. [Google Scholar] [CrossRef]
- Long, J.; Zhang, S.; Luo, K. Selenium in Chinese coal gangue: Distribution, availability, and recommendations. Resour. Conserv. Recycl. 2019, 149, 140–150. [Google Scholar] [CrossRef]
- Bullock, L.A.; Parnell, J.; Perez, M.; Armstrong, J.G.; Feldmann, J.; Boyce, A.J. High selenium in the carboniferous coal measures of Northumberland, North East England. Int. J. Coal Geol. 2018, 195, 61–74. [Google Scholar] [CrossRef]
- Zhao, Y. Study on the Genesis and Utilization of Selenium Rich Soil in Handan and Xingtai Area. Master’s Thesis, Hebei GEO University, Shijiazhuang, China, 2020. (In Chinese with English Abstract). [Google Scholar] [CrossRef]
- Rzymski, P.; Klimaszyk, P.; Marszelewski, W.; Borowiak, D.; Mleczek, M.; Nowiński, K.; Pius, B.; Niedzielski, P.; Poniedziałek, B. The chemistry and toxicity of discharge waters from copper mine tailing impoundment in the valley of the Apuseni Mountains in Romania. Environ. Sci. Pollut. Res. 2017, 24, 21445–21458. [Google Scholar] [CrossRef] [Green Version]
- Hussain, R.; Wei, C.; Luo, K. Hydrogeochemical characteristics, source identification and health risks of surface water and groundwater in mining and non-mining areas of Handan, China. Environ. Earth Sci. 2019, 78, 402. [Google Scholar] [CrossRef]
- Wen, H.; Carignan, J. Reviews on atmospheric selenium: Emissions, speciation and fate. Atmos. Environ. 2007, 41, 7151–7165. [Google Scholar] [CrossRef]
- Bañuelos, G.; Roche, J.D.; Robinson, J. Developing selenium-enriched animal feed and biofuel from canola planted for managing Se-laden drainage waters in the Westside of Central California. Int. J. Phytoremediation 2010, 12, 243–254. [Google Scholar] [CrossRef] [PubMed]
- Song, T.; Cui, G.; Su, X.; He, J.; Tong, S.; Liu, Y. The origin of soil selenium in a typical agricultural area in Hamatong River Basin, Sanjiang Plain, China. Catena 2020, 185, 104355. [Google Scholar] [CrossRef]
- The Group of Environmental and Endemic Diseases. The relation of Keshan disease to the natural environment and the background of selenium nutrition. Acta Nutr. Sin. 1982, 4, 175–182, (In Chinese with English Abstract). [Google Scholar]
- Alloway, B.J. Sources of Heavy Metals and Metalloids in Soils. In Heavy Metals in Soils; Springer: Dordrecht, The Netherlands, 2013; pp. 11–50. [Google Scholar]
- Siddiqui, A.U.; Jain, M.K.; Masto, R.E. Pollution evaluation, spatial distribution, and source apportionment of trace metals around coal mines soil: The case study of eastern India. Environ. Sci. Pollut. Res. 2020, 27, 10822–10834. [Google Scholar] [CrossRef]
- Zhou, M.; Liao, B.; Shu, W.; Yang, B.; Lan, C. Pollution assessment and potential sources of heavy metals in agricultural soils around four Pb/Zn mines of Shaoguan city, China. Soil Sediment Contam. Int. J. 2015, 24, 76–89. [Google Scholar] [CrossRef]
- Masto, R.E.; Ram, L.C.; George, J.; Selvi, V.A.; Sinha, A.K.; Verma, S.K. Status of some soil trace elements and their potential human health risks around a coal beneficiation plant. Int. J. Coal Prep. Util. 2011, 31, 61–77. [Google Scholar] [CrossRef]
- Wei, P.; Shao, T.; Wang, R.; Chen, Z.; Zhang, Z.; Xu, Z.; Zhu, Y.; Li, D.; Fu, L.; Wang, F. A study on heavy metals in the surface soil of the region around the Qinghai Lake in Tibet Plateau: Pollution risk evaluation and pollution source analysis. Water 2020, 12, 3277. [Google Scholar] [CrossRef]
- Wang, G.; Zeng, C.; Zhang, F.; Zhang, Y.; Scott, C.A.; Yan, X. Traffic-related trace elements in soils along six highway segments on the Tibetan Plateau: Influence factors and spatial variation. Sci. Total Environ. 2017, 581, 811–821. [Google Scholar] [CrossRef]
- Wang, S.; Cai, L.; Wen, H.; Luo, J.; Wang, Q.; Liu, X. Spatial distribution and source apportionment of heavy metals in soil from a typical county-level city of Guangdong Province, China. Sci. Total Environ. 2019, 655, 92–101. [Google Scholar] [CrossRef]


| Degree | SFPI | NIPI | ||
|---|---|---|---|---|
| Pi | Pollution Level | Pollution Level | ||
| I | Pi ≤ 1 | Safety domain | Pn ≤ 0.7 | Safety domain |
| II | 1 < Pi ≤ 2 | Slightly polluted domain | 0.7 < Pn ≤ 1 | Precaution domain |
| III | 2 < Pi ≤ 3 | Moderately polluted domain | 1 < Pn ≤ 2 | Slightly polluted domain |
| IV | 3 < Pi | Seriously polluted domain | 2 < Pn ≤ 3 | Moderately polluted domain |
| V | - | - | 3 < Pn | Seriously polluted domain |
| Avg | Range | China [32] | ECP [28] | Avg | Range | China [32] | ECP [28] | ||
|---|---|---|---|---|---|---|---|---|---|
| Li | 33.19 | 8.10–201.57 | 30 | 36 | Mo | 1.30 | 0.06–3.63 | 0.80 | 0.57 |
| Be | 2.74 | 1.18–6.69 | 1.80 | 2.30 | Cd | 0.27 | 0.08–1.29 | 0.09 | 0.12 |
| Na2O | 1.52 | 0.81–2.12 | 1.60 | 1.63 | In | 0.07 | 0.02–0.22 | 0.06 | 0.05 |
| MgO | 1.91 | 0.82–11.27 | 1.80 | 1.57 | Sn | 0.82 | 0.02–11.08 | 2.50 | 3.10 |
| Al2O3 | 10.85 | 4.55–18.94 | 12.60 | 13.51 | Sb | 0.71 | 0.07–2.10 | 0.80 | 0.79 |
| SiO2 | 65.16 | 41.50–80.98 | 65 | 66 | Cs | 6.66 | 1.50–10.78 | 7 | 7.50 |
| P2O5 | 0.18 | 0.01–0.53 | 0.12 | 0.10 | Ba | 417.16 | 193.05–814.93 | 500 | 565 |
| S | 921.82 | 129.86–6205.69 | 150 | 159 | La | 40.79 | 11.97–97.31 | 38 | 37 |
| K2O | 2.32 | 0.90–3.24 | 2.50 | 2.47 | Ce | 80.67 | 25.09–200.60 | 72 | 58 |
| CaO | 4.09 | 0.84–16.87 | 3.20 | 2.91 | Pr | 9.24 | 2.66–22.49 | 8.20 | 7 |
| Sc | 11.21 | 3.32–16.23 | 11 | 11 | Nd | 33.66 | 9.86–80.37 | 32 | 27 |
| TiO2 | 0.58 | 0.04–1.00 | 0.72 | 0.72 | Sm | 6.10 | 1.92–13.54 | 5.80 | 5.20 |
| V | 78.04 | 8.46–165.26 | 82 | 87 | Eu | 1.31 | 0.41–1.96 | 1.20 | 1.12 |
| Cr | 60.63 | 25.32–129.57 | 65 | 65 | Gd | 5.60 | 1.79–11.90 | 5.10 | 4.50 |
| MnO | 0.07 | 0.03–0.26 | 0.08 | 0.09 | Tb | 0.77 | 0.25–1.46 | 0.80 | 0.73 |
| Fe2O3 | 4.20 | 1.58–11.31 | 3.40 | 3.89 | Dy | 3.90 | 1.27–6.55 | 4.70 | 3.90 |
| Co | 16.08 | 5.60–105.11 | 13 | 13 | Ho | 0.75 | 0.25–1.20 | 1 | 0.92 |
| Ni | 34.86 | 13.23–278.15 | 26 | 30 | Er | 2.24 | 0.74–3.56 | 2.80 | 2.40 |
| Cu | 29.40 | 7.36–360.96 | 24 | 23 | Tm | 0.31 | 0.10–0.49 | 0.42 | 0.42 |
| Zn | 85.42 | 23.30–253.72 | 68 | 64 | Lu | 0.31 | 0.10–0.48 | 0.40 | 0.39 |
| Ga | 18.40 | 6.64–38.73 | 17 | 15.70 | Hf | 0.36 | 0.01–2.34 | 7.40 | 8.50 |
| Ge | 4.72 | 1.78–8.21 | 1.30 | 1.42 | Ta | 0.11 | 0.00–0.78 | 1.10 | 1.17 |
| As | 3.89 | 0.95–8.49 | 10 | 10 | W | 0.65 | 0.02–3.78 | 1.80 | 1.70 |
| Se | 0.45 | 0.00–1.95 | 0.20 | 0.10 | Tl | 0.55 | 0.18–0.78 | 0.60 | 0.66 |
| Rb | 113.89 | 54.06–154.77 | 100 | 107 | Pb | 29.03 | 11.01–99.83 | 23 | 23 |
| Sr | 170.47 | 89.63–433.65 | 170 | 173 | Bi | 0.20 | 0.00–1.23 | 0.30 | 0.31 |
| Y | 22.02 | 6.70–35.91 | 23 | 26 | Th | 10.38 | 0.97–30.74 | 12.50 | 12 |
| Zr | 19.27 | 0.07–121.62 | 250 | 251 | U | 2.32 | 0.79–6.11 | 2.60 | 2.30 |
| Nb | 1.94 | 0.02–12.85 | 16 | 15.50 |
| Total Se (μg/g) | pH | TOC | |
|---|---|---|---|
| Mean | 0.45 | 7.10 | 1.44 |
| Median | 0.33 | 7.13 | 1.37 |
| Range | 0.00–1.95 | 6.28–7.67 | 0.30–3.10 |
| Standard deviation | 0.36 | 0.25 | 0.50 |
| Coefficient of variation | 0.80 | 0.04 | 0.35 |
| Category | Se Concentration (μg/g) | Area (km2) | Proportion (%) |
|---|---|---|---|
| Se-deficiency | <0.125 | 776.6 | 6.1 |
| Se-marginal | 0.125–0.175 | 741.2 | 5.8 |
| Se-moderate | 0.175–0.4 | 5064.3 | 39.7 |
| Light Se-enrichment | 0.4–0.6 | 3307.5 | 25.9 |
| High Se-enrichment | 0.6–3 | 2861.1 | 22.5 |
| Se-excessive | >3 | 0 | 0 |
| YN (n = 18) | WA (n = 42) | SX (n = 25) | LZ (n = 15) | FF (n = 11) | FX (n = 5) | CX (n = 22) | CA (n = 13) | JZ (n = 1) | HD (n = 41) | |||||||||||
|---|---|---|---|---|---|---|---|---|---|---|---|---|---|---|---|---|---|---|---|---|
| Se | SeEF | Se | SeEF | Se | SeEF | Se | SeEF | Se | SeEF | Se | SeEF | Se | SeEF | Se | SeEF | Se | SeEF | Se | SeEF | |
| Avg. | 0.36 | 3.98 | 0.41 | 4.60 | 0.41 | 4.60 | 0.21 | 2.28 | 0.75 | 8.37 | 0.46 | 5.13 | 0.45 | 5.03 | 0.35 | 3.93 | 0.57 | 6.33 | 0.57 | 6.35 |
| Max. | 1.07 | 11.90 | 1.25 | 13.84 | 1.77 | 19.64 | 0.47 | 5.22 | 1.80 | 19.98 | 0.69 | 7.71 | 1.21 | 13.43 | 0.85 | 9.40 | 0.57 | 6.33 | 1.95 | 21.66 |
| Min. | 0.08 | 0.89 | 0.00 | 0.01 | 0.00 | 0.01 | 0.02 | 0.26 | 0.12 | 1.33 | 0.26 | 2.84 | 0.00 | 0.01 | 0.12 | 1.34 | 0.57 | 6.33 | 0.05 | 0.53 |
| Se | pH | TOC | As | Cd | Pb | Cr | Ni | Cu | Zn | SiO2 | Al2O3 | CaO | Fe2O3 | K2O | MgO | MnO | Na2O | P2O5 | L | BA | |
|---|---|---|---|---|---|---|---|---|---|---|---|---|---|---|---|---|---|---|---|---|---|
| Se | 1 | ||||||||||||||||||||
| pH | 0.001 | 1 | |||||||||||||||||||
| TOC | 0.228 ** | −0.148 * | 1 | ||||||||||||||||||
| As | 0.036 | −0.004 | −0.031 | 1 | |||||||||||||||||
| Cd | 0.282 ** | −0.124 | 0.162 * | 0.033 | 1 | ||||||||||||||||
| Pb | 0.454 ** | −0.135 | 0.196 ** | 0.067 | 0.656 ** | 1 | |||||||||||||||
| Cr | 0.144 * | 0.048 | 0.157 * | 0.055 | 0.101 | 0.385 ** | 1 | ||||||||||||||
| Ni | 0.150 * | 0.027 | 0.221 ** | 0.016 | 0.113 | 0.207 ** | 0.222 ** | 1 | |||||||||||||
| Cu | −0.031 | −0.145 * | −0.018 | 0.018 | 0.058 | 0.080 | 0.168 * | 0.186 ** | 1 | ||||||||||||
| Zn | 0.270 ** | −0.239 ** | 0.213 ** | 0.039 | 0.351 ** | 0.438 ** | 0.307 ** | 0.217 ** | 0.383 ** | 1 | |||||||||||
| SiO2 | −0.055 | 0.062 | −0.154 * | 0.015 | −0.100 | −0.190 ** | −0.347 ** | −0.295 ** | −0.550 ** | −0.334 ** | 1 | ||||||||||
| Al2O3 | 0.230 ** | 0.065 | 0.300 ** | 0.007 | 0.082 | 0.295 ** | 0.286 ** | 0.136 | −0.277 ** | 0.026 | −0.261 ** | 1 | |||||||||
| CaO | 0.028 | −0.116 | −0.200 ** | −0.029 | 0.147 * | 0.189 ** | 0.120 | 0.139 | 0.636 ** | 0.347 ** | −0.730 ** | −0.175 * | 1 | ||||||||
| Fe2O3 | 0.128 | 0.052 | −0.023 | 0.042 | 0.166 * | 0.441 ** | 0.544 ** | 0.213 ** | 0.591 ** | 0.488 ** | −0.601 ** | 0.097 | 0.566 ** | 1 | |||||||
| K2O | −0.018 | 0.081 | 0.235 ** | 0.057 | 0.083 | 0.071 | 0.090 | −0.012 | −0.387 ** | 0.061 | 0.067 | 0.448 ** | −0.240 ** | −0.079 | 1 | ||||||
| MgO | −0.184 * | −0.079 | −0.178 * | 0.024 | −0.026 | −0.060 | 0.114 | 0.130 | 0.878 ** | 0.243 ** | −0.618 ** | −0.318 ** | 0.728 ** | 0.610 ** | −0.298 ** | 1 | |||||
| MnO | −0.098 | 0.019 | −0.021 | 0.060 | 0.065 | 0.125 | 0.541 ** | 0.198 ** | 0.527 ** | 0.368 ** | −0.596 ** | −0.024 | 0.530 ** | 0.665 ** | −0.110 | 0.628 ** | 1 | ||||
| Na2O | −0.168 * | 0.049 | −0.232 ** | 0.048 | −0.092 | −0.201 ** | 0.045 | −0.090 | −0.291 ** | −0.117 | 0.291 ** | 0.040 | −0.327 ** | −0.159 * | 0.343 ** | −0.177 * | −0.111 | 1 | |||
| P2O5 | 0.030 | −0.254 ** | 0.329 ** | 0.102 | 0.011 | 0.116 | 0.284 ** | −0.061 | 0.181 * | 0.341 ** | −0.222 ** | −0.021 | 0.071 | 0.248 ** | 0.062 | 0.109 | 0.156 * | 0.109 | 1 | ||
| L | −0.018 | 0.180 * | 0.357 ** | 0.106 | −0.010 | 0.003 | 0.138 | 0.123 | 0.044 | 0.118 | −0.247 ** | 0.326 ** | −0.084 | 0.116 | 0.292 ** | 0.008 | 0.110 | −0.118 | 0.071 | 1 | |
| BA | −0.126 | −0.110 | −0.245 ** | −0.013 | 0.006 | −0.054 | −0.014 | 0.087 | 0.878 ** | 0.236 ** | −0.500 ** | −0.523 ** | 0.788 ** | 0.486 ** | −0.400 ** | 0.916 ** | 0.471 ** | −0.233 ** | 0.071 | −0.109 | 1 |
| Elements | PC1 | PC2 | PC3 | PC4 | PC5 | PC6 |
|---|---|---|---|---|---|---|
| Se | −0.095 | 0.688 | 0.141 | −0.078 | −0.019 | −0.024 |
| pH | −0.012 | −0.123 | 0.119 | 0.182 | −0.719 | 0.112 |
| TOC | −0.155 | 0.177 | 0.718 | −0.029 | 0.439 | −0.083 |
| As | 0.006 | 0.082 | 0.044 | 0.035 | −0.007 | 0.928 |
| Cd | 0.029 | 0.755 | −0.057 | −0.006 | 0.091 | 0.080 |
| Pb | 0.111 | 0.881 | 0.053 | 0.170 | 0.074 | 0.004 |
| Cr | 0.354 | 0.268 | 0.149 | 0.647 | 0.050 | −0.055 |
| Ni | 0.239 | 0.256 | 0.345 | 0.020 | −0.146 | −0.088 |
| Cu | 0.857 | 0.003 | 0.012 | −0.247 | 0.178 | 0.063 |
| Zn | 0.391 | 0.472 | 0.102 | 0.148 | 0.426 | 0.070 |
| SiO2 | −0.758 | −0.097 | −0.392 | −0.096 | −0.039 | 0.135 |
| Al2O3 | −0.199 | 0.247 | 0.543 | 0.479 | −0.161 | −0.169 |
| CaO | 0.829 | 0.150 | −0.080 | −0.165 | −0.001 | −0.077 |
| Fe2O3 | 0.774 | 0.298 | 0.065 | 0.322 | 0.003 | 0.021 |
| K2O | −0.311 | −0.015 | 0.294 | 0.564 | 0.041 | 0.094 |
| MgO | 0.918 | −0.165 | −0.079 | −0.146 | 0.055 | 0.066 |
| MnO | 0.778 | 0.021 | 0.065 | 0.322 | −0.005 | 0.018 |
| Na2O | −0.258 | −0.260 | −0.394 | 0.618 | 0.076 | 0.120 |
| P2O5 | 0.156 | −0.031 | 0.103 | 0.276 | 0.763 | 0.123 |
| L | 0.057 | −0.125 | 0.770 | 0.123 | −0.065 | 0.241 |
| BA | 0.857 | −0.110 | −0.218 | −0.344 | 0.081 | 0.060 |
| Eigenvalues | 5.610 | 3.297 | 1.840 | 1.471 | 1.387 | 1.027 |
| Explained variance (%) | 26.716 | 15.699 | 8.763 | 7.006 | 6.606 | 4.889 |
| Cumulative (%) | 26.716 | 42.414 | 51.177 | 58.184 | 64.790 | 69.679 |
| Cr | Ni | Cu | Zn | As | Cd | Pb | |
|---|---|---|---|---|---|---|---|
| Mean | 60.63 | 34.86 | 29.40 | 85.42 | 3.89 | 0.27 | 29.03 |
| Median | 60.20 | 31.45 | 23.17 | 73.93 | 3.67 | 0.24 | 27.13 |
| Minimum | 25.32 | 13.23 | 7.36 | 23.30 | 0.95 | 0.08 | 11.01 |
| Maximum | 129.57 | 278.15 | 360.96 | 253.72 | 8.49 | 1.29 | 99.83 |
| Standard Deviation | 11.47 | 22.01 | 28.81 | 37.10 | 1.43 | 0.14 | 9.49 |
| Coefficient of variation (%) | 19 | 63 | 98 | 43 | 37 | 52 | 33 |
| World average data | 42 | 18 | 14 | 62 | 4.7 | 1.1 | 25 |
| ECP | 65 | 30 | 23 | 64 | 10 | 0.12 | 23 |
Publisher’s Note: MDPI stays neutral with regard to jurisdictional claims in published maps and institutional affiliations. |
© 2022 by the authors. Licensee MDPI, Basel, Switzerland. This article is an open access article distributed under the terms and conditions of the Creative Commons Attribution (CC BY) license (https://creativecommons.org/licenses/by/4.0/).
Share and Cite
Hao, H.; Zhang, M.; Wang, J.; Jiang, S.; Ma, J.; Hu, Y.; Niu, H.; Panchal, B.; Sun, Y. Distribution Pattern and Enrichment Mechanism of Selenium in Topsoil in Handan Se-Enriched Belt, North China. Sustainability 2022, 14, 3183. https://doi.org/10.3390/su14063183
Hao H, Zhang M, Wang J, Jiang S, Ma J, Hu Y, Niu H, Panchal B, Sun Y. Distribution Pattern and Enrichment Mechanism of Selenium in Topsoil in Handan Se-Enriched Belt, North China. Sustainability. 2022; 14(6):3183. https://doi.org/10.3390/su14063183
Chicago/Turabian StyleHao, Huidi, Minmin Zhang, Jinxi Wang, Shuting Jiang, Juanjuan Ma, Yafan Hu, Hongya Niu, Balaji Panchal, and Yuzhuang Sun. 2022. "Distribution Pattern and Enrichment Mechanism of Selenium in Topsoil in Handan Se-Enriched Belt, North China" Sustainability 14, no. 6: 3183. https://doi.org/10.3390/su14063183
APA StyleHao, H., Zhang, M., Wang, J., Jiang, S., Ma, J., Hu, Y., Niu, H., Panchal, B., & Sun, Y. (2022). Distribution Pattern and Enrichment Mechanism of Selenium in Topsoil in Handan Se-Enriched Belt, North China. Sustainability, 14(6), 3183. https://doi.org/10.3390/su14063183