Article

Interactive Effects of Rainfall Intensity and Initial Thaw Depth on Slope Erosion

1
Shaanxi Provincial Land Engineering Construction Group, Key Laboratory of Degraded and Unused Land Consolidation Engineering, Ministry of Natural Resources, Xi’an 710075, China
2
Shaanxi Provincial Land Engineering Construction Group, Shaanxi Provincial Land Consolidation Engineering Technology Research Center, Xi’an 710075, China
3
Shaanxi Provincial Land Engineering Construction Group, Land Engineering Technology Innovation Center, Ministry of Natural Resources, Xi’an 710075, China
4
State Key Laboratory of Eco-Hydraulics in Northwest Arid Region of China, Xi’an University of Technology, Xi’an 710048, China
5
Yulin Institute of Forestry, Yulin 719000, China
*
Author to whom correspondence should be addressed.
Sustainability 2022, 14(6), 3172; https://doi.org/10.3390/su14063172
Submission received: 28 January 2022 / Revised: 3 March 2022 / Accepted: 4 March 2022 / Published: 8 March 2022
(This article belongs to the Special Issue Soil Erosion and Water and Soil Conservation)

Abstract

:
Seasonal freeze–thaw processes have led to severe soil erosion in the middle and high latitudes of the world, so understanding the freeze–thaw erosion process is of great significance for soil and water conservation as well as for ecological engineering. The area affected by freeze–thaw erosion in China exceeds 13% of the national territory. However, there is little data regarding the impact of rainfall intensity and initial thaw depth on soil erosion. Here, the effects that different rainfall intensities (0.6 mm/min, 0.9 mm/min and 1.2 mm/min) and different initial thaw depths (0 cm, 2 cm, 4 cm and 6 cm) had on the soil erosion process on the loess slope were studied under simulated rainfall conditions. The results showed that the infiltration rate decrease with prolonged runoff time, and then stabilized. Runoff occurred more quickly during increasingly intense rainfall, especially when little soil had thawed. The variation in runoff and sediment yield occurred in two stages: slow growth and rapid growth. As soil thawed to greater depths, rainfall intensity had less influence on the sediment. A linear relationship existed between the cumulative runoff and the sediment yield of all treatments. (R2 > 0.92, p < 0.01). Rainfall intensity and thaw depth had interacting effects on erosion. At low rainfall intensities, the initial thaw depth played a leading role in the erosion process, but at higher rainfall intensities, rainfall intensity played a larger role. Stage II erosion amount accounted for more than 90% of the total erosion across all treatments. The results of this research provide a guide for furthering the understanding of the soil water erosion mechanism of thawing slopes.

1. Introduction

Soil erosion is a pressing environmental problem. Seasonal freezing and thawing processes have caused serious soil erosion in the middle and high latitudes of the world [1,2,3]. The Loess Plateau in temperate China is in one of the main locations of freeze–thaw erosion in China [4]. The region experiences about 105–125 days per year below 0 °C, and receives about 450–550 mm annual precipitation on average [5,6,7]. This erosion process is also found elsewhere throughout the world. In inland northeastern Oregon [8], 86% of soil erosion events are caused by freeze–thaw processes and snowmelt runoff. In the northwest coastal region of the United States along the Pacific, over 90% of the total annual snow erosion is caused by melting snow [9].
Many studies have pointed out that soil is more prone to erosion after undergoing a freeze–thaw cycle. An impermeable frozen layer of soil prevents water infiltration during thawing, but surface runoff easily enters thawed soil [10,11,12,13]. When the soil’s interior structure is damaged, the entire area can become more prone to soil erosion [14]. In short, the freeze–thaw process changes the structure of the topsoil and thereby influences the water erosion process as well.
Generally speaking, soil erosion is a relatively complex process affected by raindrop impact, impact surface and sediment transport [15]. Soil erosion can even be initiated by a single raindrop, depending on the rainfall intensity. The concentration of transported sediment initially increases as rainfall intensity increases [16]. However, as rainfall continues, the concentration of transported sediment decreases because the erosion process shifts from transport limitation to detachment limitation, which includes raindrop detachment, or the impact of the splash [17]. The simultaneous effects of simulated rainfall and thawing conditions on soil erosion processes were previously evaluated by Wang et al. [1]. Those results suggest that rainfall strongly affects unfrozen soil [18]. However, the interactive effects that rainfall intensity and thawing have on soil erosion requires further study.
Although rainfall is generally moderate during the spring thaw, its capacity to erode can be relatively large for incompletely thawed soils with poor permeability [19,20,21,22,23]. Initial thaw depth may also be a key factor contributing to soil loss during spring thaw. Here, a rainfall experiment was designed to study the runoff and sediment of a loess slope under different rainfall intensities and thawing depths and evaluated differences in the erosion processes, so as to provide theoretical basis for further revealing the influence of incomplete thawing layer on slope soil erosion.

2. Materials and Methods

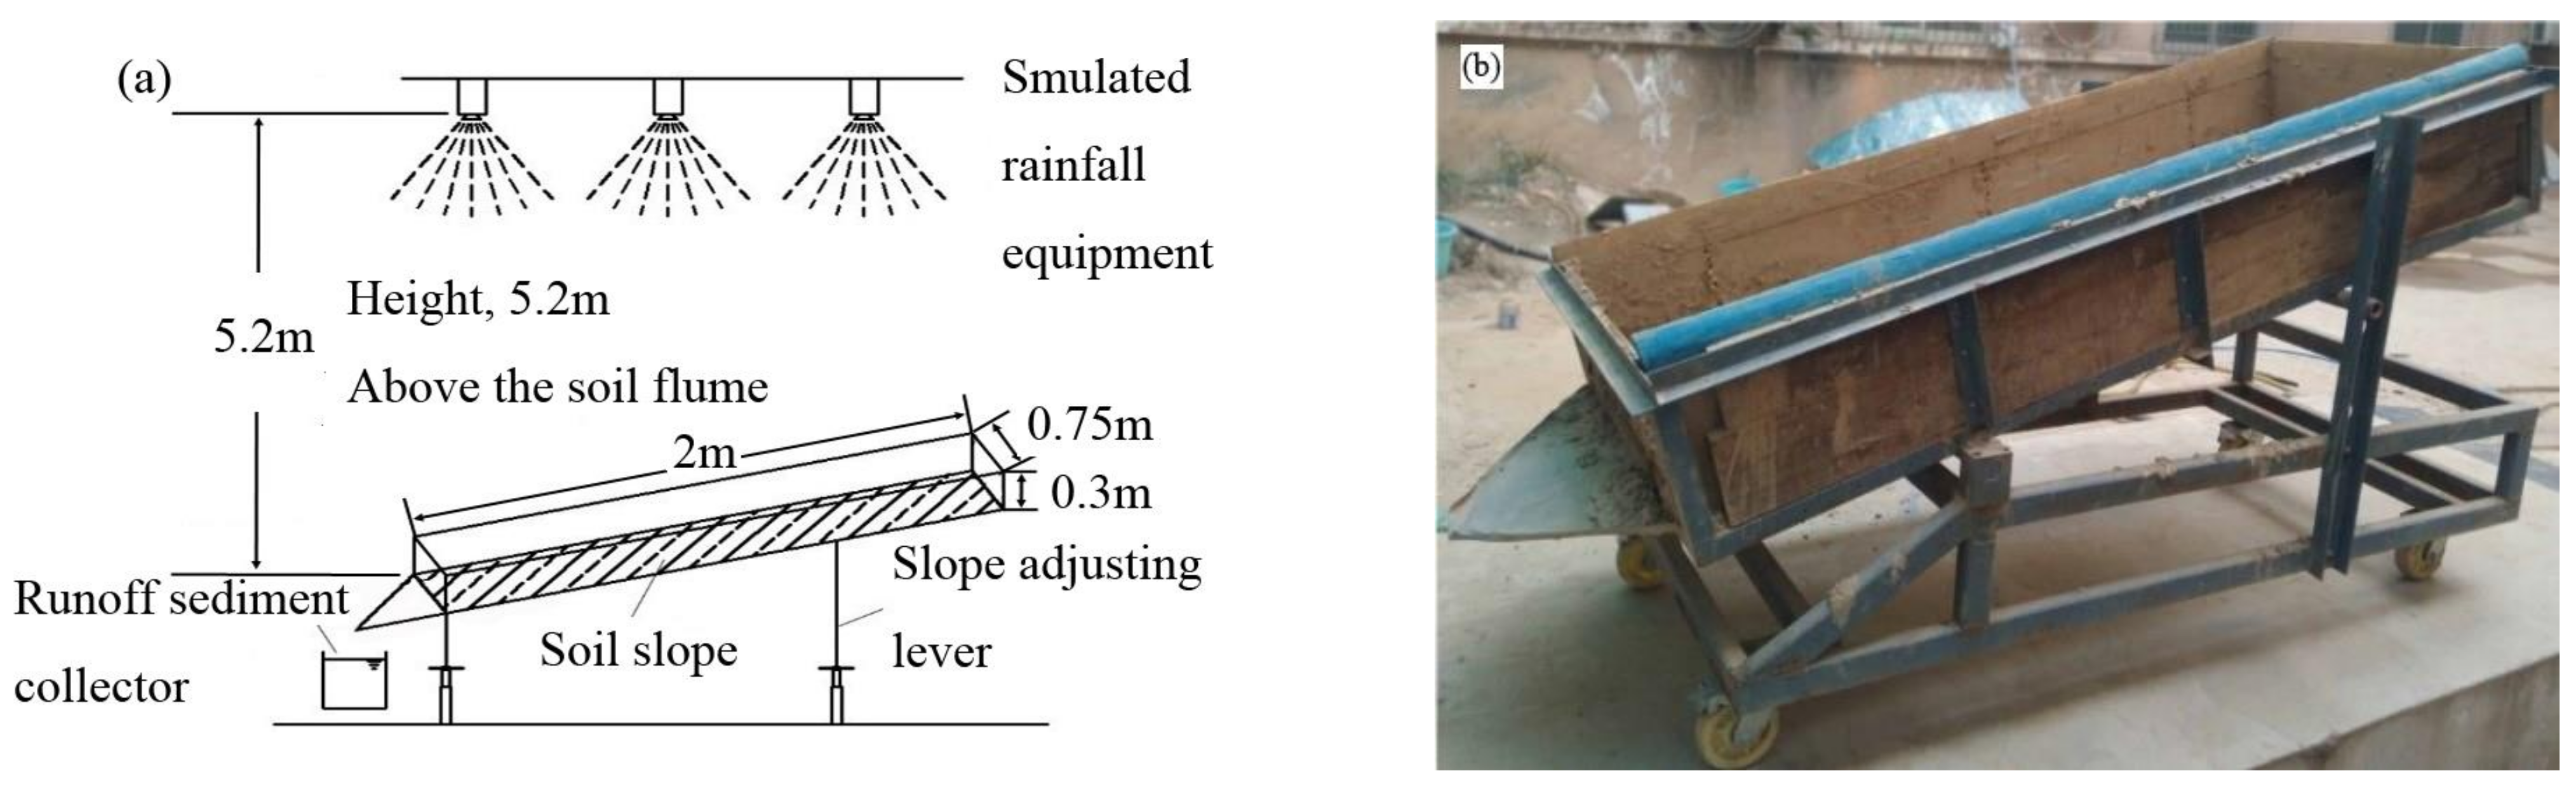
2.1. Material and Device

The simulated rainfall experiments were conducted at the State Key Laboratory of Eco-hydraulics in the Northwest Arid Region of China (Xi’an University of Technology) in Xi’an in October 2016. Soil was gathered from the Wangmaogou watershed (37°34′13″–37°36′03″ N, 110°20′46″–110°22′46″) of the Loess Plateau of China (Figure 1). The watershed is a two-branched depression on the left bank of the Wuding River, with an area of 5.97 km2. The main land use types in the watershed are grassland, slope farmland, terrace and woodland [24,25,26]. The surface layer is loose and compact loess with a thickness of 20 m to 30 m. Soil particles with 2 mm distribution were measured using a Mastersizer 2000 particle size analyzer. The mechanical composition of the gathered soil was 0.20% ± 0.001% clay, 72.01% ± 2.93% silt, and 27.79% ± 3.74% sand, which is classified as silt loam according to United States soil textural classification standards. The dry bulk density of the soil is about 1.3 ± 0.1 g/cm3, the organic matter content is 2.0 ± 0.1 g/kg [27], and the saturated water content of the soil is 46.41%.
The test device was composed of three main parts: the frozen soil system, the test flume channel and the rainfall system. The frozen soil system was developed by Xi’an University of Technology. Internal dimensions of the freeze–thaw laboratory were length 4.5 m × width 2.5 m × height 2.5 m, with temperature variation ranging from −40 °C~30 °C (±1 °C). In addition, the laboratory had refrigeration and heating systems to fulfill the treatment requirements. The downspray rainfall simulator was developed by Xi’an University of Technology. The effective rainfall coverage area was about 4.5 m × 4.5 m, and the rainfall height was 5.2 m. The system allowed us to adjust rainfall intensity from 0.5 mm/min to 2 mm/min. The uniformity of rainfall was above 85% (Figure 1). The water temperature during simulated rainfall experiments was about 10 °C and remained relatively constant. The test soil tank consisted of an impermeable wooden trough—200 cm long, 75 cm wide and 30 cm deep—anchored by iron at the edges and set at an angle on a movable trolley. A runoff collection device was installed at the bottom of the flume to collect runoff and sediment (Figure 2b).

2.2. Experimental Design

The average maximum depth of frozen soil in the Loess Plateau is 97.8 cm. From March to May each year, the frozen soil layer gradually melts [28]. Field monitoring shows that thawing proceeds through deeper soil layers more gradually, and erosion mainly occurs at the soil surface [29]. The experiment included four initial thaw depth (0 cm, 2 cm, 4 cm, 6 cm) and three rainfall intensity (0.6 mm/min, 0.9 mm/min and 1.2 mm/min) [30]. Initial soil moisture content was held constant at 15%, and the designed slope was 15 degrees [31] (Table 1). The soil samples collected in the field were sifted through a 5 mm × 5 mm screen, and impurities such as roots and stones were removed. Before filling the soil tank, a layer of gauze and 5 cm of natural sand was laid on the bottom to ensure that the permeability of the soil used in the experiment was close to that of the natural slope. The amount of soil to be used is calculated using the designed dry soil capacity (1.30 g/cm3) and the layered filling method is used. To ensure that the two layers are tightly bound, fill the trough with 5 cm of soil at once, then the top layer need to be slightly roughened before laying the next layer. The depth of soil was 20 cm. In order to avoid the influence of the wall on the erosion process, the slope was designed to be high in the middle and low on both sides.
The initial thaw depth was controlled by the frozen soil system. The soil tank was pushed into the frozen soil device, which maintained the temperatures between −18 °C and −22 °C. The soil tank was left in the frozen soil device for more than 24 h to ensure that all the soil froze. The soil tank was then pushed out of the frozen soil system and allowed to thaw at room temperature until the thaw reached the desired depth. The thaw depth was measured by a 2 mm diameter steel needle [32]. The thaw depth was tested every 25 min at 12 uniformly distributed monitoring points in the soil trough.
Rainfall intensity was determined to be uniform before each test by using six rainfall gauges. Uniformity was measured three times before starting the test, and the average value was taken. When the uniformity of the rainfall was greater than 85% and the difference between the measured rainfall intensity and the target rainfall intensity was less than 5%, then the subsequent formal rainfall test could be performed. The runoff duration was set to last for 60 min. Runoff and sediment were collected in the storage bucket every minute, and the runoff volume was measured. Sediment was separated from the muddy water and then dried at 105 °C for 24 h and subsequently weighed.

2.3. Methods

The coefficient of variation (CV) indicates the degree of data dispersion, the formula is as follows [33]:
CV = ( SD / Mean ) 100 %
where CV is the coefficient of variation (%); SD is the standard deviation; Mean is the average value.
The Photoshop (Adobe Photoshop CS4 Extended 11.0.1, San Jose, CA, USA) was used to design the experimental system. Origin 8.5 (OriginLab, Northampton, MA, USA) software was used to conduct the regression analysis and to plot the data. Descriptive parameters were calculated using SPSS 21.0 (IBM SPSS Statistics Version 21, Armonk, NY, USA).

3. Results

3.1. Characteristics of Runoff and Sediment Yield under Different Treatments

3.1.1. Initial Runoff Time and Rills Occurrence Time under Different Treatments

Table 2 is initial runoff time and rills occurrence time. After the beginning of rainfall, the time when the slope began to occur runoff and the water outlet forms continuous runoff is the initial runoff time. Under the same initial thaw depth, the initial runoff time decreased with the increases in the rainfall intensity. As the initial thaw depth increased from 0 cm to 6 cm under the same rainfall intensity, the initial runoff time lengthened significantly (Table 2). When the initial thaw depth increased from 0 cm to 6 cm under different rainfall intensities, the initial runoff time increased by 28.13 min (0.6 mm/min), 25.91 min (0.9 mm/min) and 11.43 min (1.2 mm/min). The results showed that the greater the rainfall intensity, the smaller the delay in the initial runoff time with the increase of initial thaw depth. Rills occurrence time refers to the time when the back wall of the drop sill has obvious traceable erosion development. Under the same initial thaw depth, rills occurrence time decreased with the increase of rainfall intensity (except FT6). The rills occurrence time increased sharply with the increase of initial thaw depth (4 cm to 6 cm) under larger rainfall intensity (1.2 mm/min). Rills occurrence time had no obvious change rule with the increase of initial thaw depth under the same rainfall intensity.

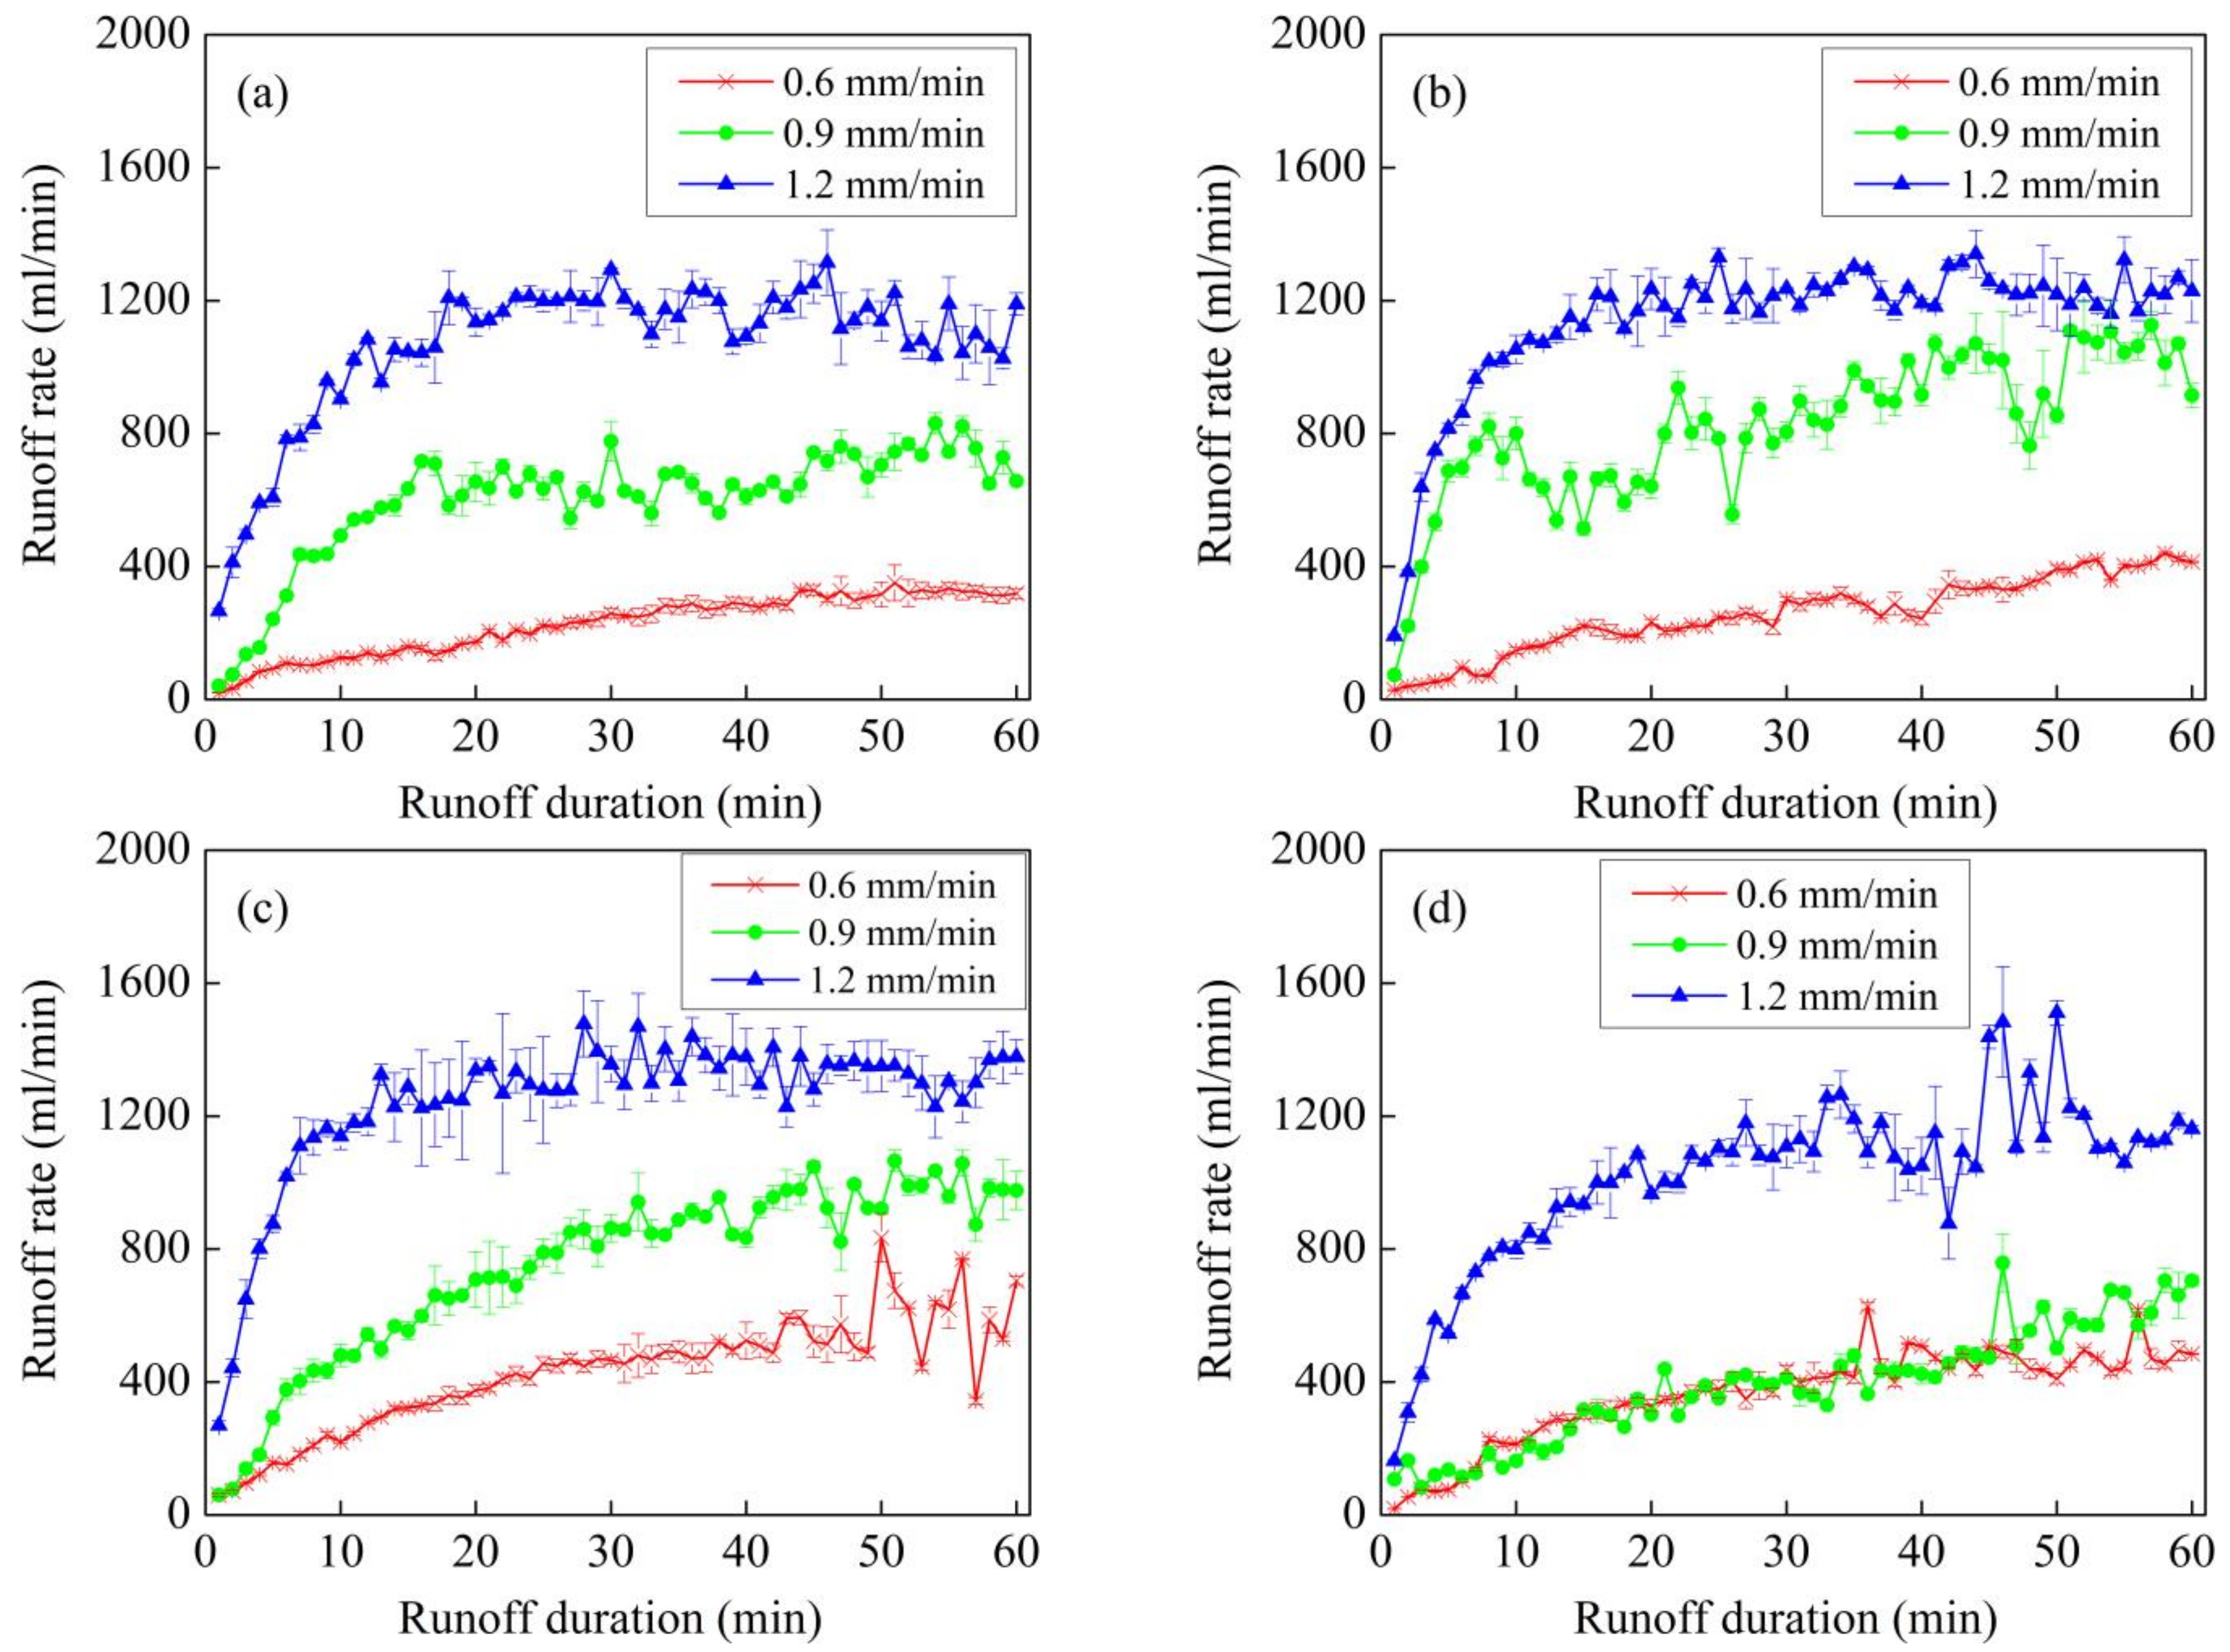
3.1.2. Runoff Process and Characteristics

Figure 3 shows temporal variations in runoff rate under different experimental treatments. As shown in Figure 3, the runoff yield of different treatments increased rapidly at the beginning of each treatment, and then tended to stabilize as the rainfall continued. Runoff rate tended to be greater and to stabilize faster at higher rainfall intensities (Figure 3). Under weak rainfall intensity conditions (0.6 mm/min), runoff rate gradually stabilized after 35 min at different initial thaw depth. For the rainfall intensity of 0.9 mm/min, runoff rate fluctuated sharply with the prolongation of runoff time and tended to stabilize at about 25 min. Runoff rate tended to stabilize at about 10 min under 1.2 mm/min intensity. Combined with Figure 3 and Table 2, it can be seen that the occurrence of rills has little impact on the runoff.
In order to further understand the effects of rainfall intensity and initial thaw depth on the runoff process, the variation range of runoff rate, average runoff rate and coefficient of variation CV under different treatments were calculated in Table 3. Table 3 proves that under the same initial thaw depth, the variation range of runoff rate and the average runoff rate increase with the increase of rainfall intensity. When rainfall intensity increased, average runoff increased significantly. The minimum values of average runoff occurred at 0 cm under 0.6 mm/min intensity and at 6 cm thaw under 0.9 mm/min and 1.2 mm/min intensities respectively. For the same treatment, the CV of runoff rate of different treatments ranged from 17.82% to 43.13%. The CV of runoff rate tended to decrease with increased rainfall intensity (except FT6, 0.9 mm/min), which indicates that runoff fluctuated less at greater rainfall intensities.

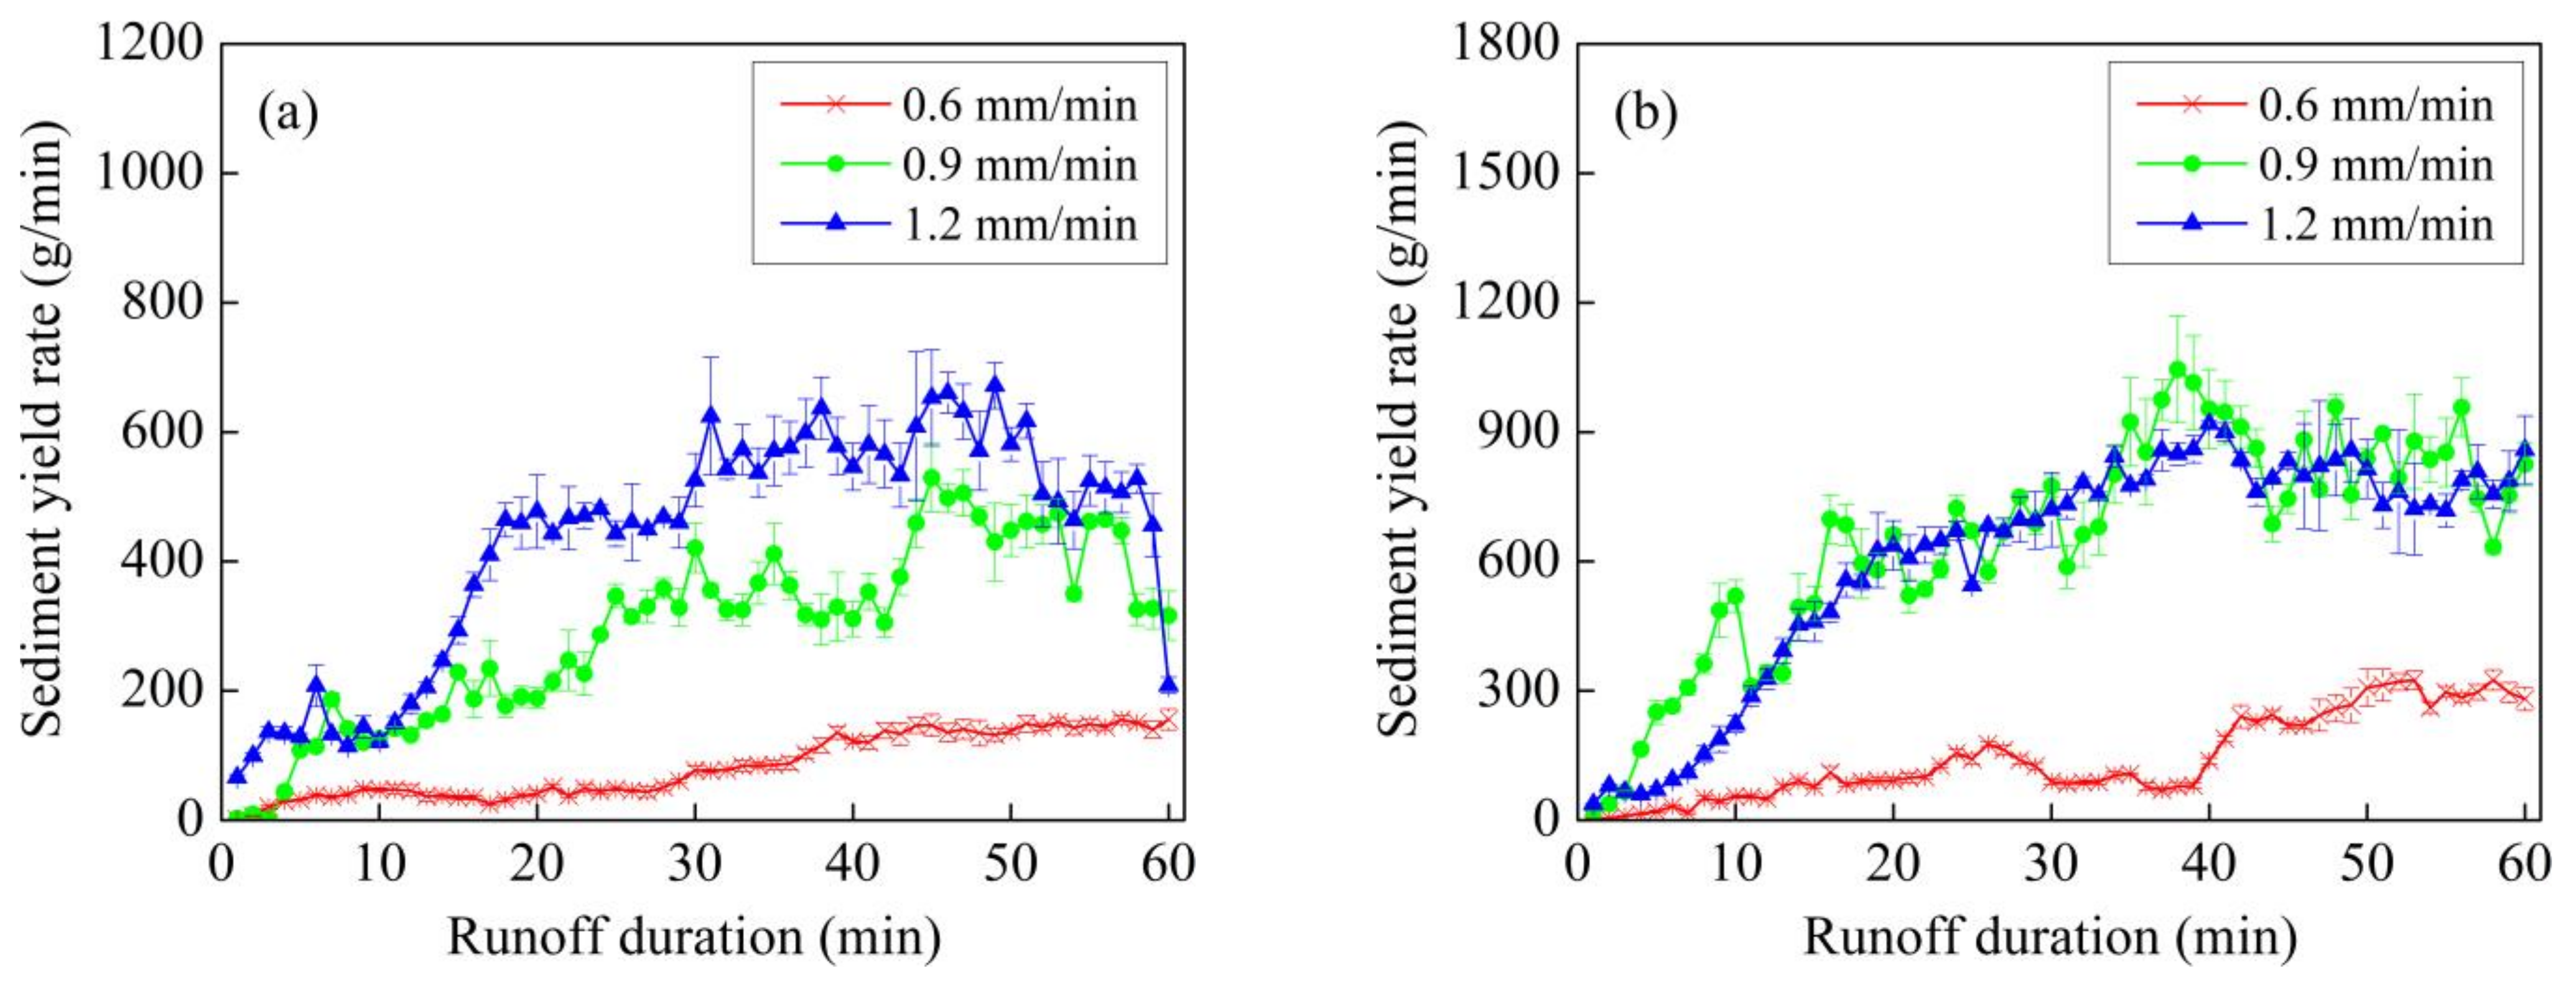
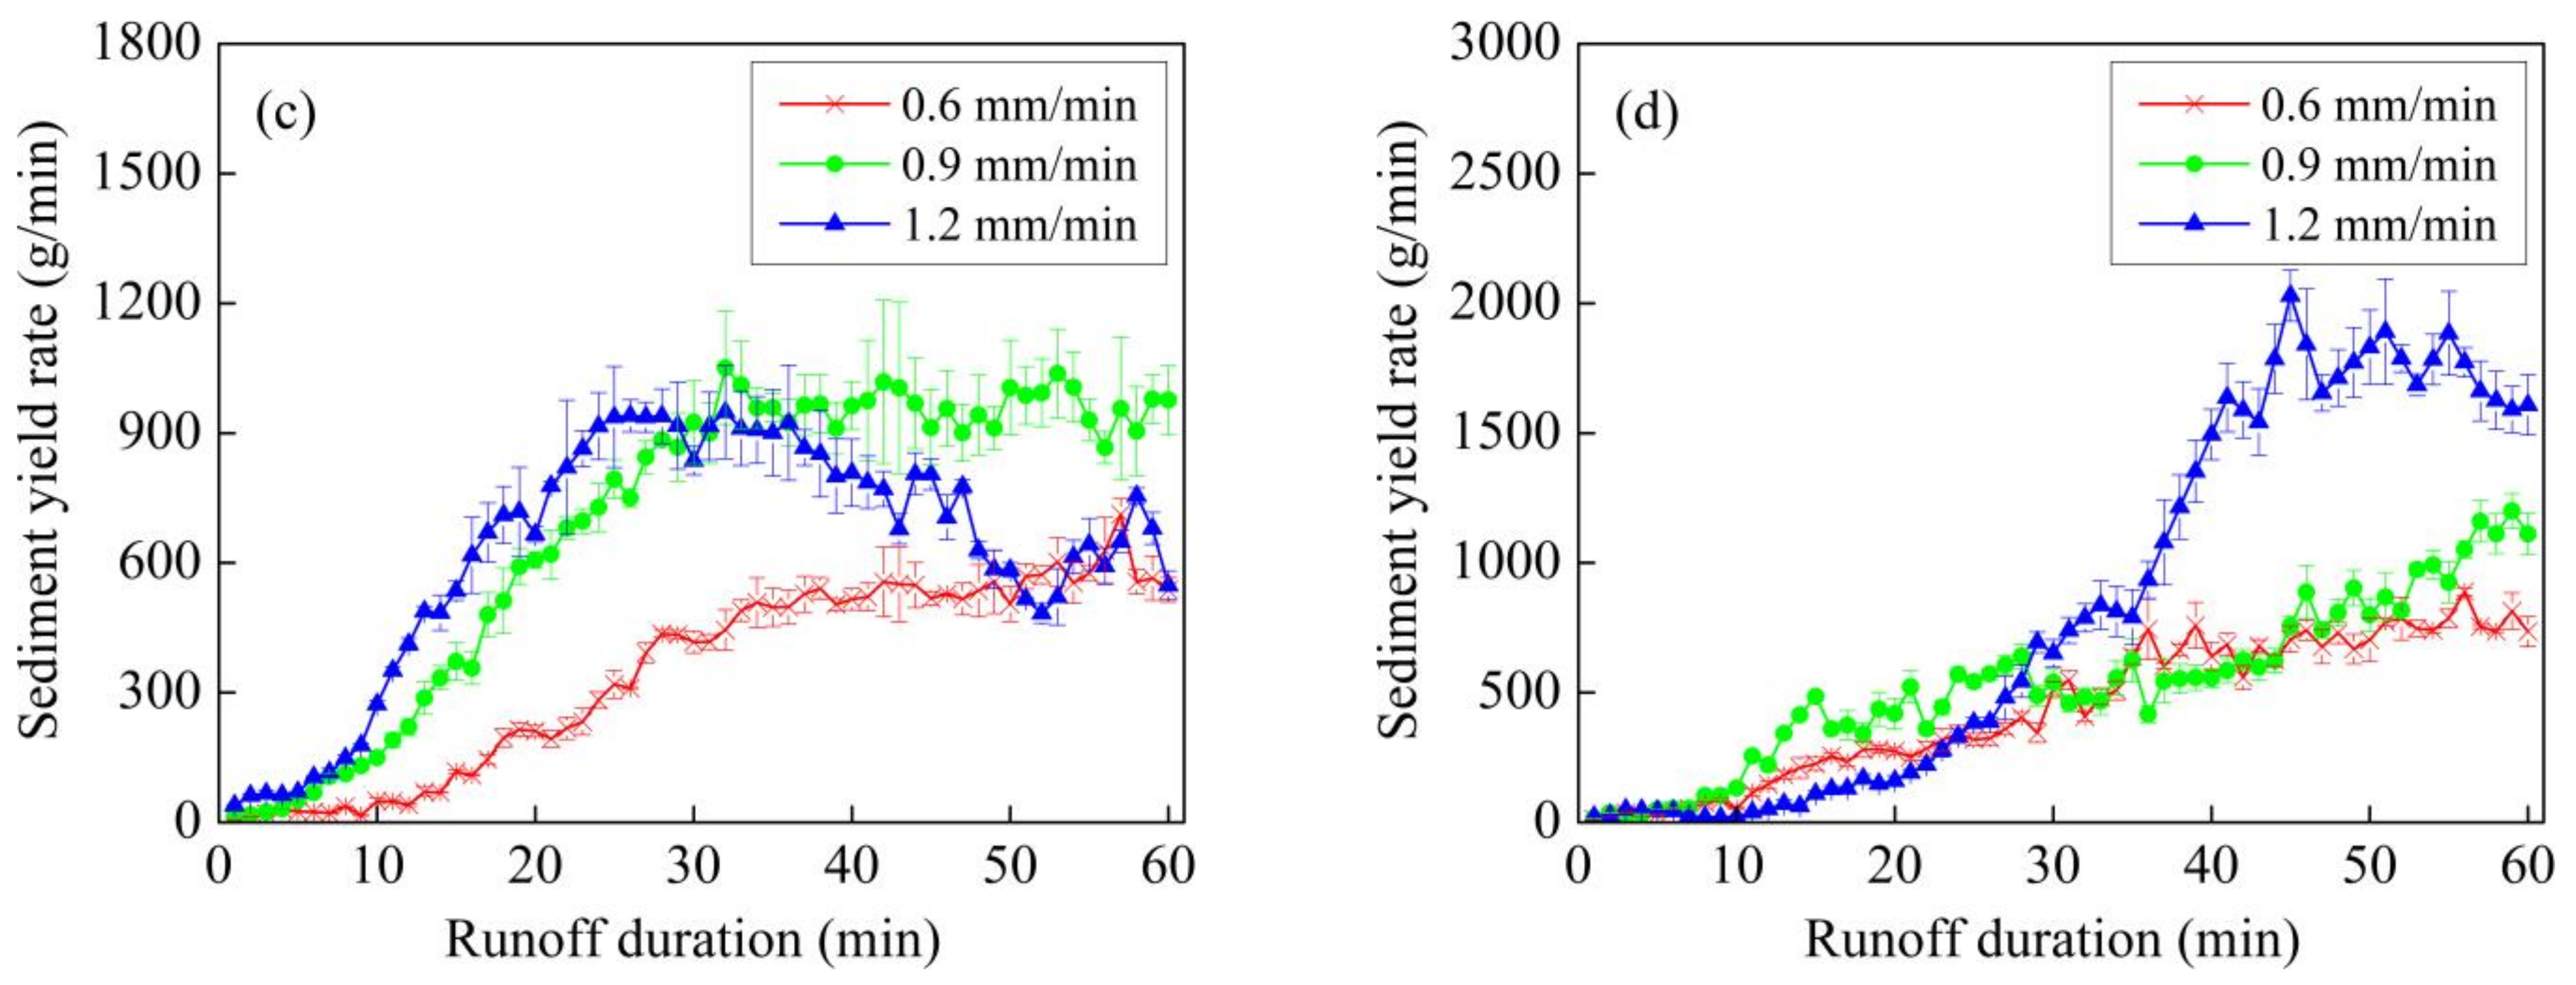
3.1.3. Sediment Yield Process and Characteristics

Figure 4 shows temporal variations in sediment yield rate under different experimental treatments. In general, sediment yield rate increased with runoff time over different initial thaw depths under different rainfall intensity. With the extension of runoff duration time, sediment yield rate plateaued or slightly decreased in some experiments. When rainfall intensity was 0.6 mm/min and initial thaw depth was 0 cm or 2 cm, the frozen soil layer was close to the surface, and the effect of rainfall on the thaw rate was limited. The frozen soil layer can only be thawed slowly through heat conduction. The thin thawed surface layer offered little erodible substance, which reduced the erosion dynamic and sediment yield. When the initial thaw depth was 2 cm, the change trend of sediment yield rate under 0.9 mm/min and 1.2 mm/min intensity is approximately the same. When the initial thaw depth was 4 cm, the sediment yield rate decreased after 30 min under 1.2 mm/min intensity. When the initial thaw depth was 6 cm, the change trend of sediment yield rate under 0.6 mm/min and 0.9 mm/min intensity is approximately the same. Under the rainfall intensity of 1.2 mm/min, sediment yield rate increased and tended to stabilize as runoff continued, but then it decreased at the end of the runoff yield (except at the greatest initial thaw depth of 6 cm). When rainfall is strong, the erodible substances in the thawed surface layer can be quickly washed away, generating runoff and leading to rapidly increasing erosion shortly after the formation of a landslide [34]. Due to the slow thawing of the frozen layer, the amount of remaining erodible material decreases with continued rainfall, therefore gradually stabilizing sediment yield. At the end of the experiment with the deepest thaw (6 cm), sediment yield increased sharply under each of the different rainfall intensities.
In order to further understand the effects of rainfall intensity and initial thaw depth on the sediment yield process, the variation range of sediment yield rate, average sediment yield rate and coefficient of variation CV under different treatments were calculated in Table 4. Table 4 proves that under the same initial thaw depth, the variation range of sediment yield rate increase with the increase of rainfall intensity (except FT4, 1.2 mm/min). Under the same rainfall intensity, the variation range of sediment yield rate increase with the increase of initial thaw depth. Under the same initial thaw depth, with the increase of rainfall intensity, average sediment yield rate increased by 5.17 times (FT0), 4.19 times (FT2), 1.81 times (FT4) and 1.89 times (FT6), respectively (Table 4). In general, average sediment yield increased with the increases in initial thaw depth (except FT6, 0.9 mm/min). For the same treatment, the CV of the sediment yield rate of different treatments ranged from 38.66% to 86.72%, which indicates that sediment yield fluctuated more than runoff, perhaps as a result of the development of rill erosion [35,36,37,38].

3.2. Runoff-Sediment Relationship under Different Treatments

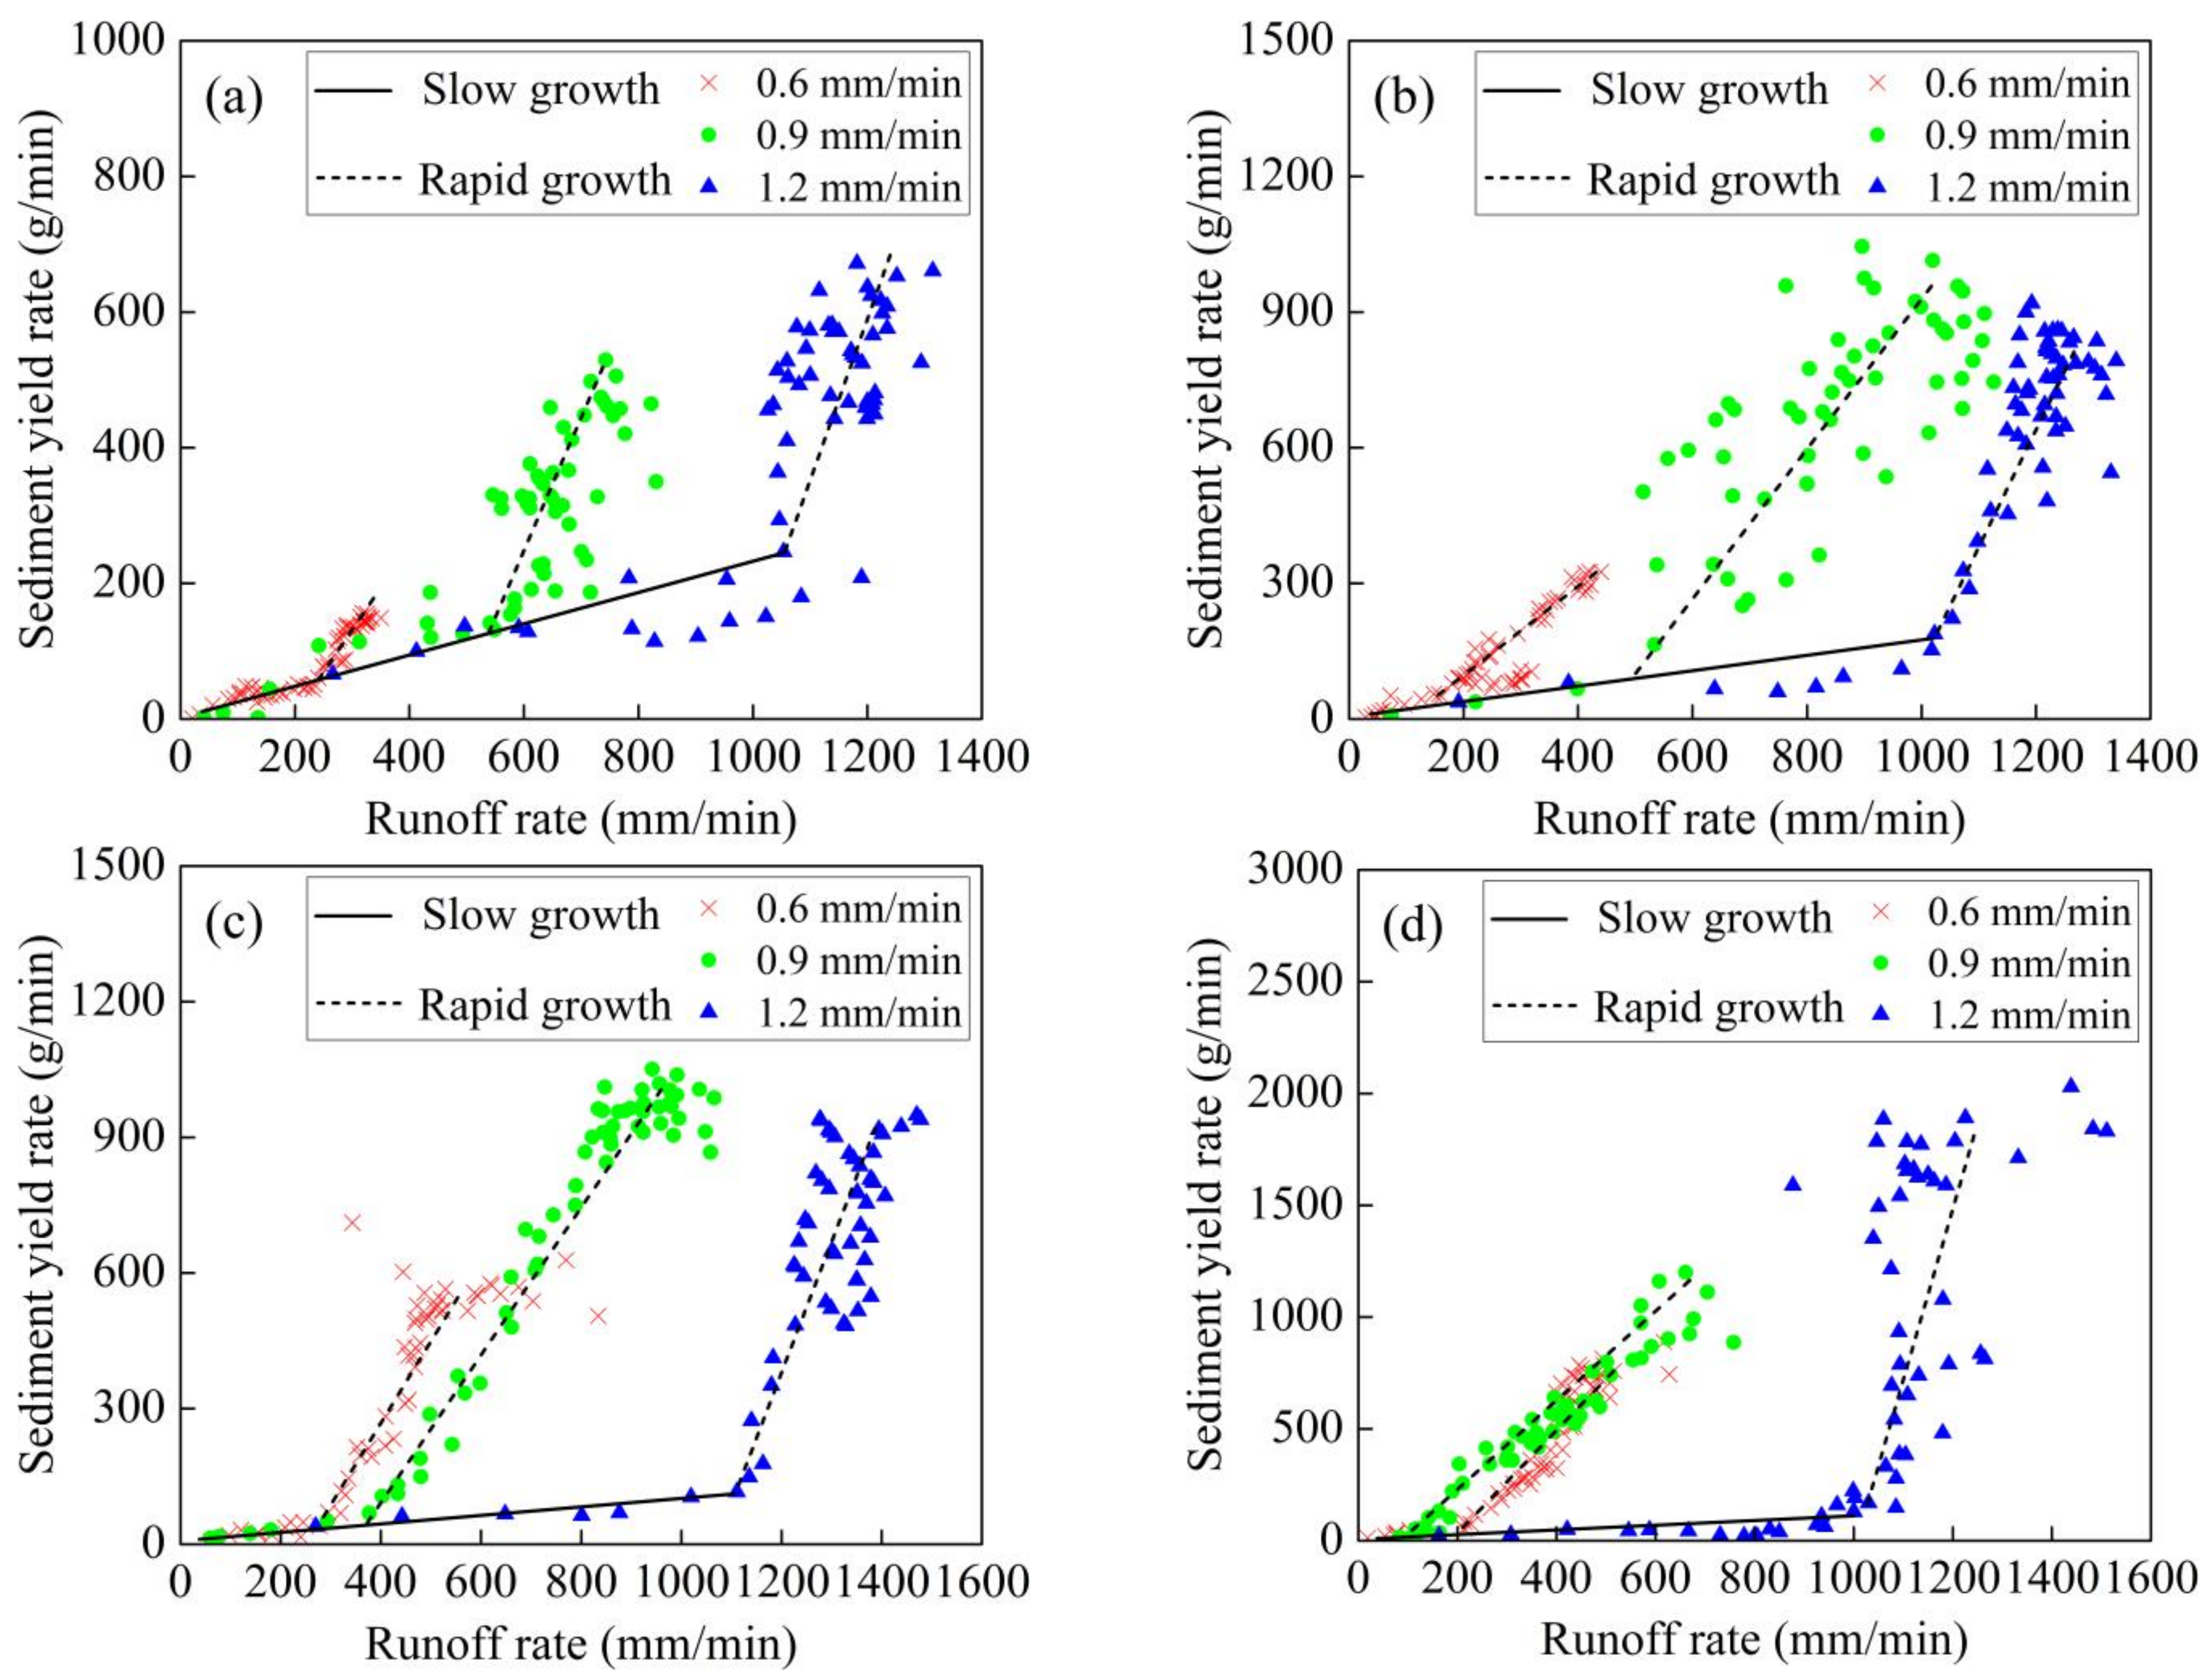
3.2.1. Relationship between Runoff Rate and Sediment Yield Rate

In this study, the relationship between sediment yield and runoff rate on thawing slopes could be divided into two stages: a slow growth period and a rapid growth period. During the slow growth period, sediment yield increased slowly with increasing runoff, mainly due to the lack of infiltration in the early stage of rainfall (when thaw depth is 0 cm) and to the ability of the frozen soil to resist erosion. For thawed soil, a large amount of rainfall infiltrated in the early stages, which reduced runoff, the transport capacity of sediment, and sediment yield [39]. As rainfall continued during the period of rapid growth soil water content increased, infiltration decreased and gradually stabilized, runoff increased rapidly, and rills formed on the soil surface. The length and depth of rills developed rapidly with continued rainfall, and sediment yield increased rapidly [40].
The two stages intersected when the water-sediment relationship suddenly changed. When holding initial thaw depth constant, the ordinate of the mutation point of the runoff-sediment relationship increased with increasing rainfall intensity, and the corresponding runoff yield increased too (Figure 5). At greater initial thaw depths, the sudden change point approached gradually for rainfall intensities of 0.6 mm/min and 0.9 mm/min, and the gap between runoff rates decreased. This indicated that the influence of rainfall intensity on the water-sediment relationship gradually decreased at greater initial thaw depths.

3.2.2. Correlation between Accumulative Runoff and Accumulative Sediment Yield

The change-point between slow growth and rapid growth in the water-sediment relationship indicated a change in the erosion pattern. Based on the timing of rill occurrence in the experiment, the slope erosion was divided into stage I (before the appearance of the rills) and stage II (after the appearance of the rills). The cumulative sediment yield and cumulative runoff in the two erosion stages of each field test are fitted respectively, and it is found that the relationship between cumulative runoff and cumulative sediment yield is a linear function:
y = A 1 x + B 1
y = A 2 x + B 2
where y is the cumulative sediment yield (kg); x is the cumulative runoff (L); and A1, A2, B1 and B2 are regression coefficients.
The fitting coefficient R2 of cumulative runoff and cumulative sediment yield is more than 0.9 (Table 5). In this study, parameter A is defined as the sediment yield capacity coefficient. The larger the A, the stronger the sediment yield capacity. The size of A mainly depends on the erosion type, and the A value of inter-rill erosion is less than that of rill erosion. Under weak rainfall intensity (0.6 mm/min), the A values of stages I and II increase with the increase of initial thaw depth. Under the rainfall intensity of 0.9 mm/min, the A value of stage II increases with the increase of initial thaw depth, but the change of A value of stage I has no obvious law. For the rainfall intensity of 1.2 mm/min, the A value of stage I decreases with the increase of initial thaw depth, while the A value of stage II increases with the increase of initial thaw depth. In general, the sediment yield capacity in stage II increases with the increase of rain intensity and initial thaw depth.

3.3. Contributions of Rainfall Intensity and Initial Thaw Depth on Erosion

In this study, the contribution rate method was used to quantify changes in erosion caused by rainfall intensity and initial thaw depth [16]. The contribution ratio of rainfall intensity and initial thaw depth to erosion was calculated by comparing erosion at a rainfall intensity of 0.6 mm/min and at an initial thaw depth of 0 cm (Table 6). At the intermediate rainfall intensity (0.9 mm/min), the contribution rate of rainfall intensity to erosion decreased at greater initial thaw depths, and the contribution of initial thaw depth to erosion dominated at greater initial thaw depths. At the greatest rainfall intensity (1.2 mm/min), the contribution rate of rainfall intensity to erosion be always greater than that of the initial thaw depth. At initial thaw depths from 0-4 cm, the contribution rate of initial thaw depth to erosion increased gradually.

4. Discussion

4.1. Effects of Rainfall Intensity and Initial Thaw Depth on Runoff and Sediment Yield Processes

The initial thaw depth of soil strongly influences soil infiltration, runoff yield and erosion. In fact, incomplete thawing of soil is a primary factor affecting soil erosion in spring [41]. When frozen soil is closer to the surface, the infiltration flow reaches the frozen soil interface more quickly, and the soil infiltration capacity decreases rapidly. This shortens the time required for flow convergence on the slope surface while advancing the runoff generation time [42]. When holding initial thaw depth constant, increases in rainfall intensity can saturate the thawed soil relatively quickly and produce runoff, leading to earlier runoff generation times which is consistent with the previous results of Liu et al. [39].
When holding rainfall intensity constant, the variation in runoff with initial thaw depth mainly results from the interaction of two factors: (1) The greater the initial thaw depth, the more time it takes for rainfall to reach the frozen soil layer, saturate the surface soil and generate runoff. The surface soil stores more water before runoff. (2) After runoff generation, the infiltration of precipitation accelerates the soil thawing, and runoff generation and infiltration undergo a process of mutual growth and decline. When infiltrating water reaches the frozen soil layer, the nonfrozen soil layer reaches saturation and runoff occurs. At that point infiltration capacity decreases and runoff yield increases rapidly. However, as the frozen soil layer thaws, the infiltration capacity gradually increases along with the infiltration volume, and the surface runoff decreases [1,3,39].
The fluctuation of sediment yield during rainfall is mainly affected by rill erosion. As rainfall progresses, a drop ridge forms at the exit of the slope, which intensifies the erosion and eventually evolves into rill erosion, where the erosion sediment yield increases rapidly. In this study, rill erosion accounted for most of the erosion, and the sediment yield increased at greater initial thaw depths. This differs from the research of Liu et al. [39], whose study showed that sediment yield is affected by a combination of soil moisture content, rainfall intensity and initial thaw depth. To some extent, sediment yield decreases at greater initial thaw depths. This may be due to the differences in rainfall duration and soil texture used in the experimental designs. In the experimental study of Liu et al. [39], rainfall lasted only 20 min, and greater initial thaw depth resulted in the increase of infiltration. Rill erosion began to develop but was relatively short in duration. When the initial thaw depth was large, the slope surface had not experienced traceable erosion and sliding (in contrast to this experiment, which did have traceable erosion and sliding), so the sediment yield was low. In addition, the soft texture of loess soil is much more erodible than black soil [43]. The soft texture is one of the reasons why loess soil is more prone to slide and undergo headward erosion [44].

4.2. Effects of Rainfall Intensity and Initial Thaw Depth on Soil Erosion Amount

The basic theory of the Water Erosion Prediction Project (WEPP) model characterizes two types of soil erosion: inter-rill erosion and rill erosion [45]. Inter-rill erosion refers to the separation and transport of soil particles on the soil surface by thin-layer flow, which is the initial stage of hydraulic erosion on slope surface. Rill erosion is a process of erosion and transportation of runoff to rill head, wall and bottom soil after the formation of rills [46,47].
In this study, the process of soil erosion is divided into two stages (I and II). The ratios of stages I and II to total erosion amount were calculated (Table 7). At the lowest rainfall intensity (0.6 mm/min) and the highest rainfall intensity (1.2 mm/min), erosion amount of stage II increased with initial thaw depth. At the rainfall intensity of 0.9 mm/min, the contribution rate of stage II increased with increased initial thaw depth when the initial thaw depth was 0–4 cm. When the initial thaw depth exceeded 4 cm, the contribution decreases, which indicates that there may be a critical initial thaw depth for high rainfall intensity that changes the trend of the contribution rate of stage II.
In the stage I, rainfall is the main erosive force, and the erosion type is mainly inter-rill erosion; In the stage II after the appearance of the rills, runoff becomes the main erosive force, and the erosion type is mainly rill erosion. During the experiment, stage II erosion amount accounted for more than 90% of the total erosion in all treatments, indicated that rill erosion is the main erosion form of slope erosion, which is consistent with previous studies, but there are also some important differences. Wang et al. [48] found that rill erosion can account for 50% to 70% of total sediment transport, and in some extreme cases it can account for 90% of total erosion. Kimaro et al. [49] and Bewket et al. [50] found that rill erosion can account for about 70% of the total erosion in different areas. The results of this study showed that incomplete thawing can aggravate rill formation and soil erosion, and that relatively small amounts of runoff from snowmelt or rainfall during thawing can lead to the loss of large amounts of soil.

4.3. Implications for the Relationship between Rainfall Intensity and Soil Thawing Depth and Erosion

Variation in rainfall intensity and initial thaw depth inevitably lead to different erosion patterns, although the impact of each on erosion is quite different. The results of this study showed that initial thaw depth had a greater impact on erosion at low rainfall intensities (Table 5). As rainfall intensity increased, the contribution of rainfall intensity to erosion gradually became the dominant factor. The study of Zhou et al. [41] shows that for the same initial thaw depth, the erosion amount increases with the increasing rainfall intensity. Under the same rainfall intensity, the amount of soil erosion decreases with increased thawing depth, which is different from the results of this study. This is because the experiment of Zhou et al. [41] only lasted for 20 min, and this experiment continued for 60 min after the slope began to produce flow. As rainfall continues, soil water content approaches saturation, which results in increased runoff. The greater the runoff sand content, the greater the final amount of erosion. Moreover, the study of Zhou et al. [41] did not quantitatively show the joint influence of initial thaw depth and rainfall intensity on erosion.

5. Conclusions

In this study, the effects of rainfall intensity and thawing depth on loess slope erosion were analyzed. The major findings were as follows: First, the initial runoff generation time quickened at greater rainfall intensities and slowed at greater initial thaw depths. Second, the minimum values of average runoff occurred at 0 cm under 0.6 mm/min intensity and at 6 cm thaw under 0.9 mm/min and 1.2 mm/min intensities, respectively. In general, the average sediment yield increased with initial thaw depth. The sediment production process had more severe fluctuation than the runoff process. The relationship between water and sediment on thawing slopes was found to vary between two stages: a slow growth period and a rapid growth period. As soil thawed at greater depths, rainfall intensity had less influence on the relationship between runoff and sediment. A linear relationship exists between the cumulative runoff and the cumulative sediment yield of the two slopes. Third, rainfall intensity and depth of thaw had interacting effects on erosion. The initial thaw depth played a leading role in the erosion process at low rainfall intensities, but rainfall intensity played a larger role at higher rainfall intensities. Stage II erosion amount accounted for more than 90% of the total erosion across all treatments.

Author Contributions

Conceptualization, Y.S. and P.L.; methodology, P.L.; software, Y.S.; formal analysis, Y.S.; data curation, Y.S.; writing—original draft preparation, Y.S.; writing—review and editing, Y.S. and J.W.; visualization, Y.S.; proofreading, Y.S.; supervision, H.W. and Y.Z.; project administration, N.L.; funding acquisition, N.L. All authors have read and agreed to the published version of the manuscript.

Funding

This research was funded and supported by the Shaanxi Natural Science Basic Research Program (2021JQ-961), Department of science and technology of Shaanxi Province; Gansu Province Soil and Water Conservation Compensation Fee Program (2020-46) and Water Conservancy Research and Technology Promotion Project (2021-71), Institute of Soil and Water Conservation of Gansu.

Institutional Review Board Statement

Not applicable.

Informed Consent Statement

Not applicable.

Data Availability Statement

Not applicable.

Conflicts of Interest

The authors declare no conflict of interest.

References

  1. Wang, T.; Li, P.; Ren, Z.P.; Xu, G.C.; Li, Z.B.; Yang, Y.Y.; Yao, J.W. Effects of freeze-thaw on soil erosion processes and sediment selectivity under simulated rainfall. J. Arid. Land 2017, 9, 234–243. [Google Scholar] [CrossRef] [Green Version]
  2. Bochove, E.V.; Danielle, P.; Pelletier, F. Effects of freeze–thaw and soil structure on nitrous oxide produced in a clay soil. Soil Sci. Soc. Am. J. 2000, 64, 1638–1643. [Google Scholar] [CrossRef]
  3. Su, Y.Y.; Li, P.; Ren, Z.P.; Xiao, L.; Zhang, H. Freeze-thaw effects on erosion process in loess slope under simulated rainfall. J. Arid. Land 2020, 12, 937–949. [Google Scholar] [CrossRef]
  4. Wang, T.; Li, P.; Li, Z.B.; Hou, J.M.; Xiao, L.; Ren, Z.P.; Xu, G.C.; Yu, K.X.; Su, Y.Y. The effects of freeze–thaw process on soil water migration in dam and slope farmland on the Loess Plateau, China. Sci. Total Environ. 2019, 666, 721–730. [Google Scholar] [CrossRef]
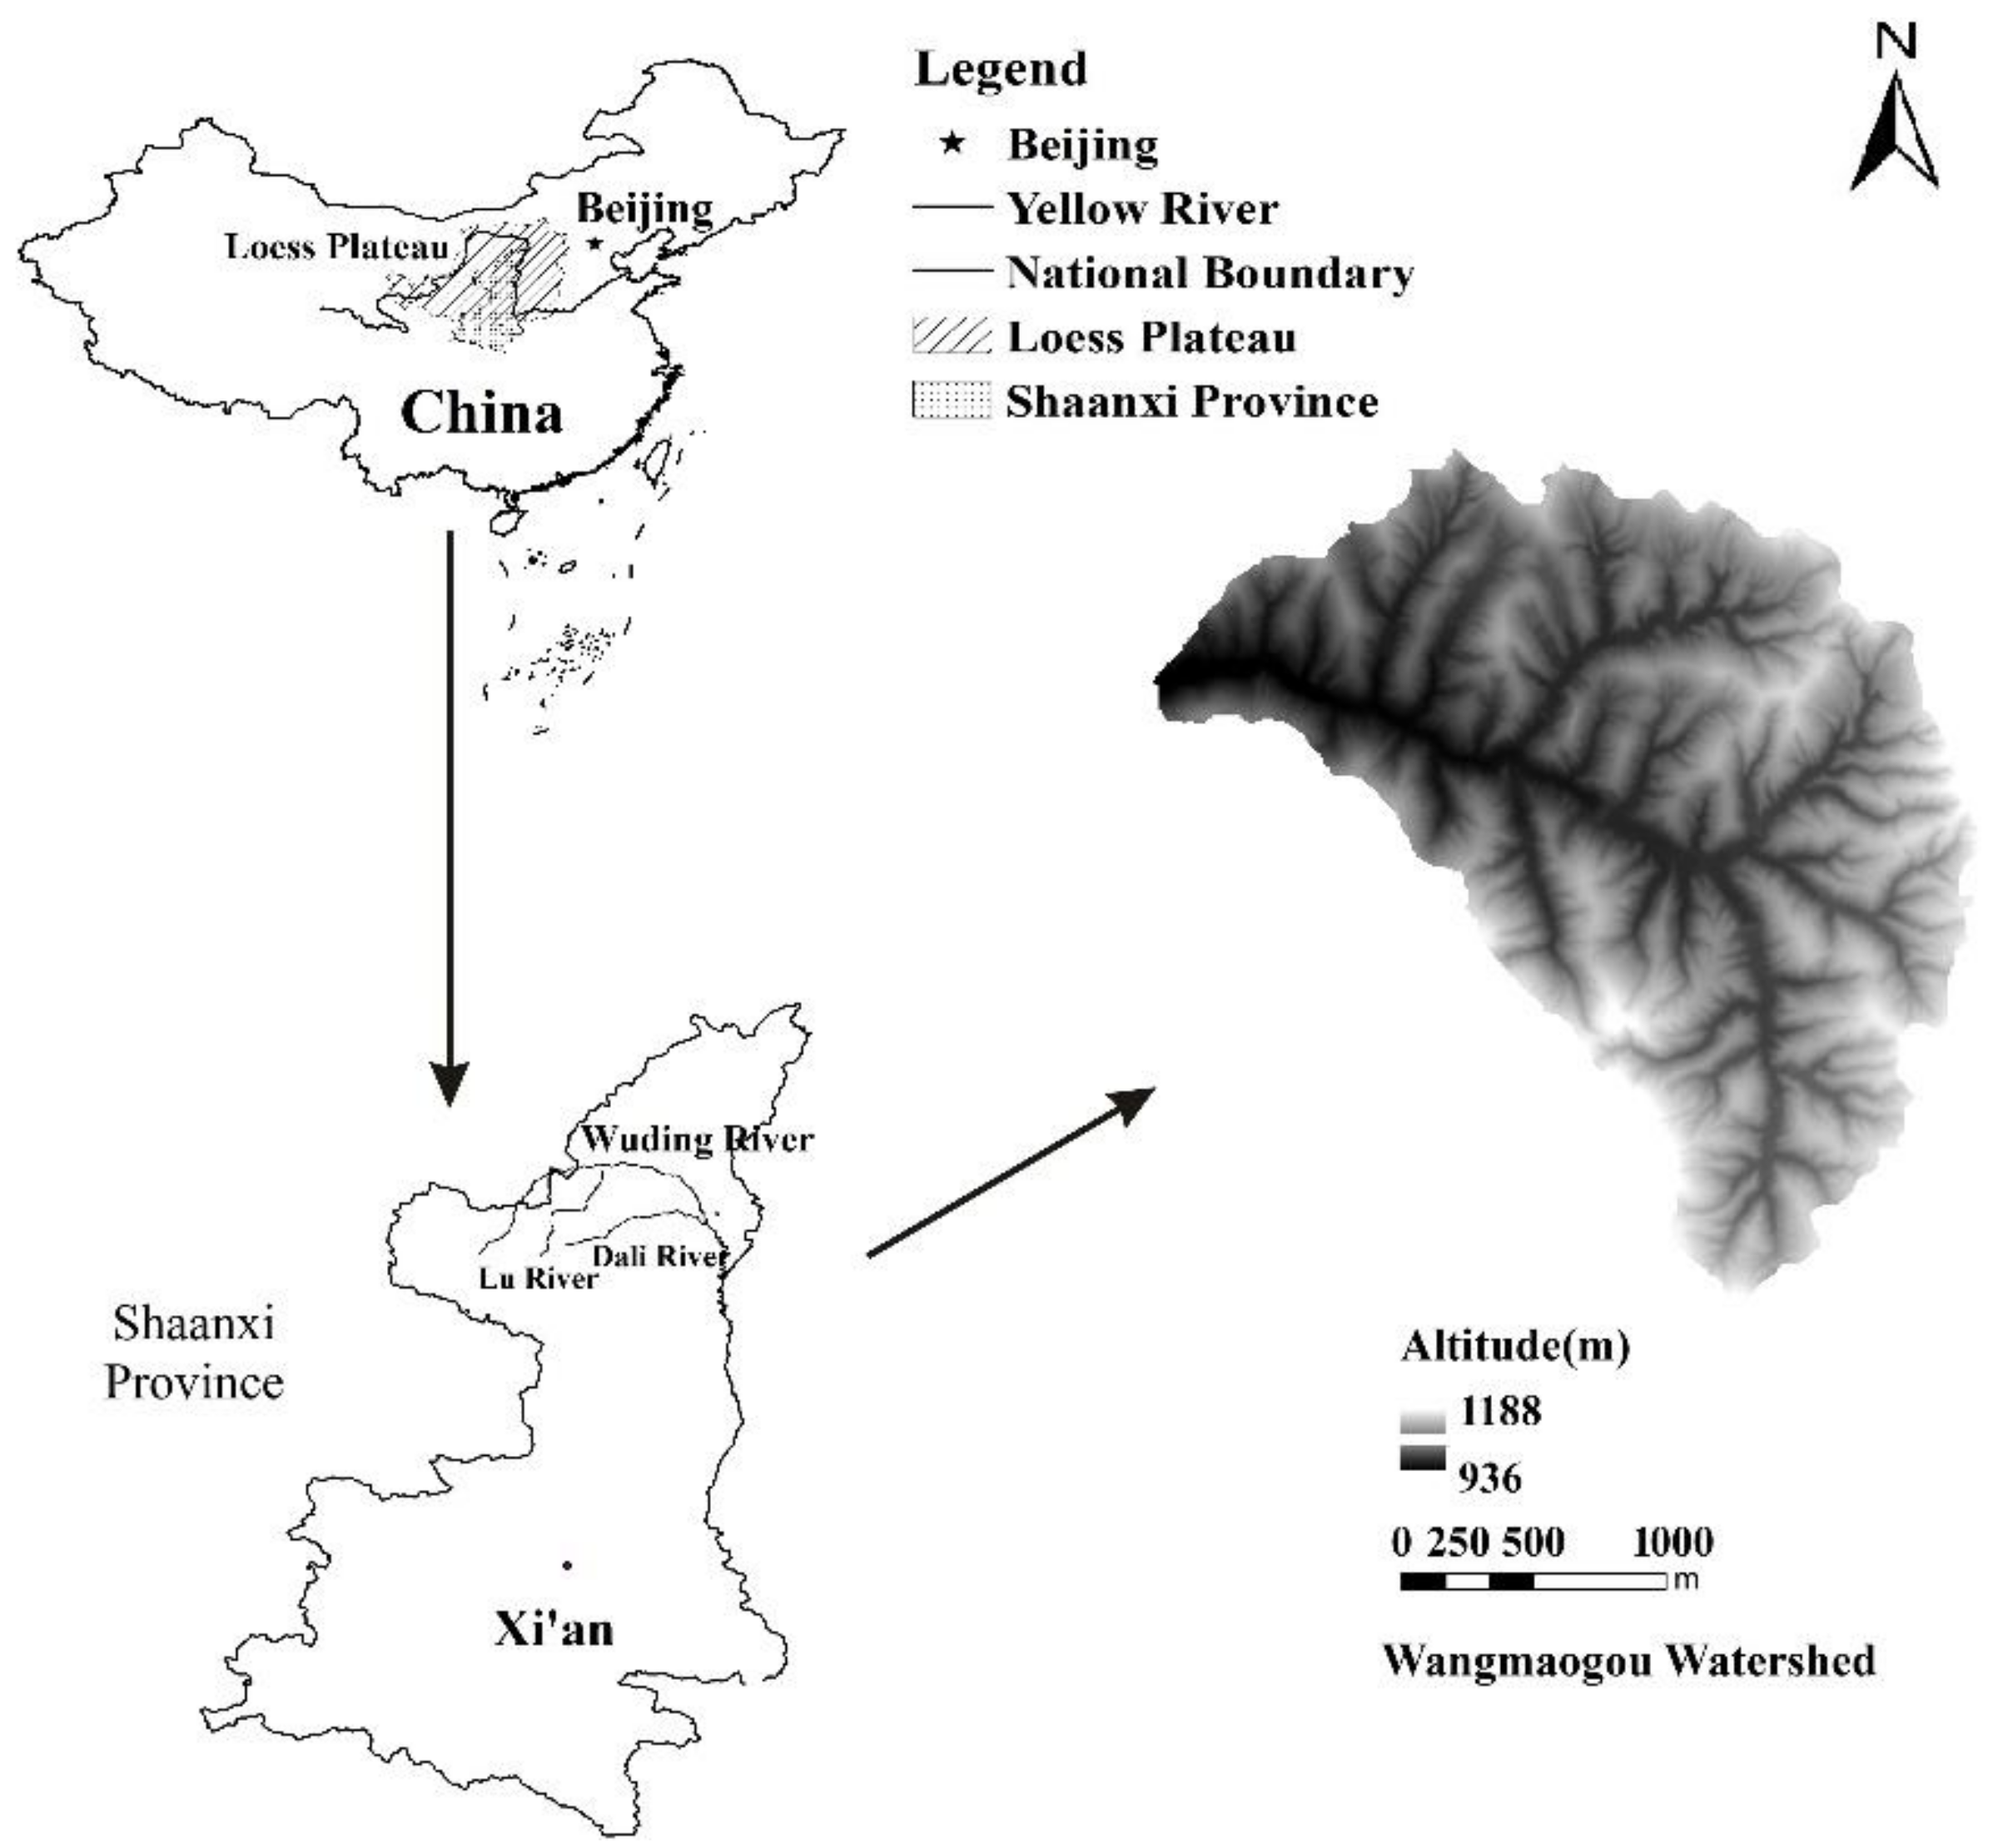
  5. Zhao, B.H.; Li, Z.B.; Li, P.; Xu, G.C.; Gao, H.D.; Cheng, Y.T.; Chang, E.H.; Yuan, L.; Zhang, Y.; Feng, Z.H. Spatial distribution of soil organic carbon and its influencing factors under the condition of ecological construction in a hilly-gully watershed of the Loess Plateau, China. Geoderma 2017, 296, 10–17. [Google Scholar] [CrossRef]
  6. Zhang, Y.; Li, P.; Liu, X.J.; Xiao, L.; Shi, P.; Zhao, B.H. Effects of farmland conversion on the stoichiometry of carbon, nitrogen, and phosphorus in soil aggregates on the Loess Plateau of China. Geoderma 2019, 351, 188–196. [Google Scholar] [CrossRef]
  7. Wang, T.; Li, P.; Liu, Y.; Hou, J.M.; Li, Z.B.; Ren, Z.P.; Cheng, S.D.; Zhao, J.H.; Hinkelmann, R. Experimental investigation of freeze-thaw meltwater compound erosion and runoff energy consumption on loessal slopes. Catena 2020, 185, 104310. [Google Scholar] [CrossRef]
  8. Kirkby, M.J. Modeling water erosion processes. In Soil Erosion; Kirkby, M.J., Morgan, R.P.C., Eds.; Wiley: Chichester, UK, 1980; pp. 183–196. [Google Scholar]
  9. Zuzel, J.; Pikul, J. Effects of straw mulch on runoff and erosion from small agricultural plots in northeastern oregon. Soil Sci. 1993, 156, 111–117. [Google Scholar] [CrossRef]
  10. Wang, L.; Shi, Z.H.; Wu, G.L.; Fang, N.F. Freeze/thaw and soil moisture effects on wind erosion. Geomorphology. 2014, 207, 141–148. [Google Scholar] [CrossRef]
  11. Øygarden, L. Rill and gully development during extreme winter runoff event in Norway. Catena 2003, 50, 217–242. [Google Scholar] [CrossRef]
  12. Sharratt, B.S.; Lindstrom, M.J.; Benoit, G.R.; Young, R.A.; Wilts, A. Runoff and soil erosion during spring thaw in the northern US Corn Belt. J. Soil Water Conserv. 2000, 55, 487–494. [Google Scholar]
  13. Rui, D.H.; Ji, M.C.; Nakamur, D.; Suzuki, T. Experimental study on gravitational erosion process of vegetation slope under freeze–thaw. Cold Reg. Sci. Technol. 2018, 151, 168–178. [Google Scholar] [CrossRef]
  14. Ma, Q.; Zhang, K.; Jabro, J.D.; Ren, L.; Liu, H. Freeze–thaw cycles effects on soil physical properties under different degraded conditions in Northeast China. Environ. Earth Sci. 2019, 78, 321. [Google Scholar] [CrossRef]
  15. Zhang, X.C.; Nearing, M.A.; Norton, L.D.; Miller, W.P.; West, L.T. Modeling inter rill sediment delivery. Soil Sci. Soc. Am. J. 1998, 62, 438. [Google Scholar] [CrossRef]
  16. Assouline, S.; Ben, H.M. Effects of rainfall intensity and slope gradient on the dynamics of interrill erosion during soil surface sealing. Catena 2006, 66, 211–220. [Google Scholar] [CrossRef]
  17. Nearing, M.A.; Polyakov, V.O. Sediment transport in rill flow under deposition and detachment conditions. Catena 2003, 51, 33–43. [Google Scholar]
  18. Kinnell, P.I.A. Raindrop-impact-induced erosion processes and prediction: A review. Hydrol. Processes 2005, 19, 2815–2844. [Google Scholar] [CrossRef]
  19. Saxton, K.E.; Mccool, D.K.; Papendick, R.I. Slot mulch for runoff and erosion control. J. Soil Water Conserv. 1981, 36, 44–47. [Google Scholar]
  20. Wang, T.; Li, P.; Hou, J.M.; Li, Z.B.; Ren, Z.P.; Cheng, S.D.; Xu, G.C.; Su, Y.Y.; Wang, F. Response of the Meltwater Erosion to Runoff Energy Consumption on Loessal Slopes. Water 2018, 10, 1522. [Google Scholar] [CrossRef] [Green Version]
  21. Pikul, J.L.; Aase, J.K. Fall Contour Ripping Increases Water Infiltration into Frozen Soil. Soil Sci. Soc. Am. J. 1998, 62, 1017. [Google Scholar] [CrossRef] [Green Version]
  22. Wu, Y.Y.; Wei, O.Y.; Hao, Z.C.; Lin, C.Y.; Liu, H.B.; Wang, Y.D. Assessment of soil erosion characteristics in response to temperature and precipitation in a freeze-thaw watershed. Geoderma 2018, 328, 56–65. [Google Scholar] [CrossRef]
  23. Sun, B.Y.; Xiao, J.B.; Li, Z.B.; Ma, B.; Zhang, L.T.; Huang, Y.L.; Bai, L.F. An analysis of soil detachment capacity under freeze-thaw conditions using the Taguchi method. Catena 2018, 162, 100–107. [Google Scholar] [CrossRef]
  24. Chang, E.H.; Li, P.; Li, Z.B.; Xiao, L.; Zhao, B.H.; Su, Y.Y.; Feng, Z.H. Using water isotopes to analyze water uptake during vegetation succession on abandoned cropland on the Loess Plateau, China. Catena 2019, 181, 104095. [Google Scholar] [CrossRef]
  25. Shi, P.; Qin, Y.; Liu, Q.; Zhu, T.T.; Li, Z.B.; Li, P.; Ren, Z.P.; Liu, Y.; Wang, F.C. Soil respiration and response of carbon source changes to vegetation restoration in the Loess Plateau, China. Sci. Total Environ. 2019, 707, 135507. [Google Scholar] [CrossRef] [PubMed]
  26. Shi, P.; Feng, Z.H.; Gao, H.D.; Li, P.; Xiao, L. Has “Grain for Green” threaten food security on the Loess Plateau of China? Ecosyst. Health Sustain. 2020, 6, 1709560. [Google Scholar] [CrossRef] [Green Version]
  27. Shi, P.; Zhang, Y.; Zhang, Y.; Yu, Y.; Li, P.; Li, Z.B.; Xiao, L.; Xu, G.C.; Zhu, T.T. Land-use types and slope topography affect the soil labile carbon fractions in the Loess hilly-gully area of Shaanxi, China. Arch. Agron. Soil Sci. 2020, 66, 638–650. [Google Scholar] [CrossRef]
  28. Wang, S.J.; Wang, X.F.; Wang, L. Status and Ecological Functions of Water and Heat During Non-growing Period in Loess Plateau. Bull. Soil Water Conserv. 2017, 37, 284–288, (In Chinese with English Abstract). [Google Scholar]
  29. Zhao, J.B.; Cao, J.J.; Zhang, C.; Gulzat, H.; Hu, J. The soil infiltration research of the Quanji township in the northwest Qinghai Lake area. J. Earth Environ. 2010, 1, 175–182, (In Chinese with English Abstract). [Google Scholar]
  30. Wei, X.; Li, X.G.; Huang, C.H. Impacts of freeze-thaw cycles on runoff and sediment yield of slope land. Trans. Chin. Soc. Agric. Eng. 2015, 31, 157–163, (In Chinese with English Abstract). [Google Scholar]
  31. Xu, Y.; Tian, J.L.; Liu, P.L.; Xu, X.X. Topographic Differentiation Simulation of Soil and Water Loss of Slope Farmland in Loess Plateau. J. Soil Water Conserv. 2005, 19, 20–23, 27, (In Chinese with English Abstract). [Google Scholar]
  32. Ban, Y.Y.; Lei, T.W.; Chen, C.; Liu, Z.Q. Study on the facilities and procedures for meltwater erosion of thawed soil. Int. Soil Water Conserv. Res. 2016, 4, 142–147. [Google Scholar] [CrossRef] [Green Version]
  33. Su, Y.Y.; Li, P.; Ren, Z.P.; Xiao, L.; Wang, T.; Zhang, Y. Slope Erosion and Hydraulics during Thawing of the Sand-Covered Loess Plateau. Water 2020, 12, 2461. [Google Scholar] [CrossRef]
  34. Ban, Y.Y.; Lei, T.W.; Liu, Z.Q.; Chen, C. Comparative study of erosion processes of thawed and non-frozen soil by concentrated meltwater flow. Catena 2017, 148, 153–159. [Google Scholar] [CrossRef]
  35. Lei, T.W.; Nearing, M.A.; Haghighi, K.; Braits, V.F. Rill erosion and morphological evolution: A simulation model. Water Resour. Res. 1998, 34, 3157–3168. [Google Scholar] [CrossRef]
  36. Wirtz, S.; Seeger, M.; Ries, J.B. Field experiments for understanding and quantification of rill erosion processes. Catena 2012, 91, 21–34. [Google Scholar] [CrossRef]
  37. Chen, X.Y.; Zhao, Y.; Mi, H.X.; Mo, B. Estimating rill erosion process from eroded morphology in flume experiments by volume replacement method. Catena 2015, 136, 135–140. [Google Scholar] [CrossRef]
  38. Wu, B.; Wang, Z.L.; Zhang, Q.W.; Shen, N.; Liu, J. Response of soil detachment rate by raindrop-affected sediment-laden sheet flow to sediment load and hydraulic parameters within a detachment-limited sheet erosion system on steep slopes on Loess Plateau, China. Soil Tillage Res. 2019, 185, 9–16. [Google Scholar] [CrossRef]
  39. Liu, J.; Fan, H.M.; Zhou, L.L.; Wu, M.; Chai, Y.; Liu, Y.H. Study on effects of rainfall in the spring thaw period on black soil slope erosion. J. Soil Water Conserv. 2009, 23, 64–67, (In Chinese with English Abstract). [Google Scholar]
  40. Ting, J.M.; Torrence, M.R.; Ladd, C.C. Mechanisms of Strength for Frozen Sand. J. Geotech. Eng. 1983, 109, 1286–1302. [Google Scholar] [CrossRef]
  41. Zhou, L.L.; Wang, T.L.; Fan, H.M.; Wu, M.; Chai, Y.; Zhang, D.Y. Effects of incompletely thawed layer on black soil slope rainfall erosion. J. Soil Water Conserv. 2009, 23, 1+4-37, (In Chinese with English Abstract). [Google Scholar]
  42. Bajracharya, R.M.; Lal, R. Seasonal soil loss and erodibility variation on a miamian silt loam soil. Soil Sci. Soc. Am. J. 1992, 56, 1560. [Google Scholar] [CrossRef]
  43. Fan, H.M.; Liu, Y.J.; Xu, X.Q.; Wu, M.; Zhou, L.L. Simulation of rill erosion in black soil and albic soil during the snowmelt period. Acta Agric. Scand. Sect. B-Soil Plant Sci. 2017, 67, 510–517. [Google Scholar] [CrossRef]
  44. Li, G.Y.; Fan, H.M. Effect of freeze-thaw on water stability of aggregates in a black aoil of northeast China. Pedosphere 2014, 24, 285–290. [Google Scholar] [CrossRef]
  45. Soto, B.; Díaz-Fierros, F. Runoff and soil erosion from areas of burnt scrub: Comparison of experimental results with those predicted by the WEPP model. Catena 1998, 31, 257–270. [Google Scholar] [CrossRef]
  46. Meyer, L.D.; Foster, G.R.; Nikolov, S. Effect of flow rate and canopy on rill erosion. Trasactions ASAE 1975, 18, 0905–0911. [Google Scholar] [CrossRef]
  47. Elliot, W.J.; Laflen, J.M. A Process-based rill erosion model. Trasactions ASAE 1998, 136, 65–72. [Google Scholar]
  48. Wang, W.L.; Lei, A.L.; Li, Z.B.; Tang, K.L. Study on dynamic mechanism of rills, shallow furrows and gully in the soil erosion chain. Adv. Water Sci. 2003, 14, 471–475, (In Chinese with English Abstract). [Google Scholar]
  49. Kimaro, D.N.; Poesen, J.; Msanya, B.M.; Deckers, J.A. Magnitude of soil erosion on the northern slope of the Uluguru Mountains, Tanzania: Interrill and rill erosion. Catena 2008, 75, 38–44. [Google Scholar] [CrossRef]
  50. Bewket, W.; Sterk, G. Assessment of soil erosion in cultivated fields using a survey methodology for rills in the Chemoga watershed, Ethiopia. Agric. Ecosyst. Environ. 2003, 97, 81–93. [Google Scholar] [CrossRef]
Figure 1. The geographical location of tested soil.
Sustainability 14 03172 g001
Figure 2. Experimental device diagram. (a) Setting for the artificial simulation of rainfall. (b) Test equipment real diagram.
Sustainability 14 03172 g002
Figure 3. Temporal variations in runoff rate under different treatments. (a) FT0. (b) FT2. (c) FT4. (d) FT6.
Sustainability 14 03172 g003
Figure 4. Temporal variations in sediment yield rate under different treatments. (a) FT0. (b) FT2. (c) FT4. (d) FT6.
Sustainability 14 03172 g004aSustainability 14 03172 g004b
Figure 5. Relationship between runoff rate and sediment yield rate under different treatments. (a) FT0. (b) FT2. (c) FT4. (d) FT6.
Sustainability 14 03172 g005
Table 1. Design table of simulated rainfall test.
State of SlopeInitial Thaw Depth (cm)TreatmentsRainfall Intensity
(mm/min)
Slope (°)Initial Soil Moisture Content (%)Runoff Duration
(min)
Freeze–thaw slopes0FT00.6151560
0.9151560
1.2151560
2FT20.6151560
0.9151560
1.2151560
4FT40.6151560
0.9151560
1.2151560
6FT60.6151560
0.9151560
1.2151560
Table 2. Initial runoff time and rills occurrence time.
TreatmentsFT0FT2FT4FT6
Rainfall Intensity
(mm/min)
0.60.91.20.60.91.20.60.91.20.60.91.2
Initial Runoff Time (min)10.135.472.5817.0012.835.3718.8016.446.7538.2631.3814.01
Rills Occurrence Time (min)1610712881577111112
Table 3. Characteristic values of runoff process under different treatments.
TreatmentsRainfall Intensity (mm/min)Variation Range of Runoff Rate (mL/min)Average Runoff Rate (mL/min)CV (%)
FT00.620.42–350.24225.5139.74
0.940.88–830.91599.1928.83
1.2266.05–1314.421067.0620.10
FT20.628.89–440.05256.4143.13
0.973.89–1126.51821.329.91
1.2191.29–1340.451140.3818.36
FT40.659.52–833.9425.2339.57
0.959.98–1065.54747.1624.59
1.2269.72–1477.491244.5817.82
FT60.618.69–627.71365.6237.37
0.983.33–757.98392.9244.01
1.2163.02–1510.991019.0724.55
Table 4. Characteristic values of sediment yield process under different treatments.
TreatmentsRainfall Intensity
(mm/min)
Variation Range of Sediment Yield Rate
(g/min)
Average Sediment Yield Rate (g/min)CV (%)
FT00.61.13–155.8183.3558.61
0.92.04–529.54293.3846.80
1.266.21–672.04431.1541.36
FT20.64.04–324.98145.3868.11
0.97.94–1045.01653.0838.66
1.237.32–919.63608.5043.30
FT40.65.93–711.55347.4363.25
0.913.68–1051.00688.2751.33
1.239.36–949.16627.1444.03
FT60.612.1–888.36443.7760.96
0.916.48–1200.20538.1757.97
1.219.52–2029.92838.5286.72
Table 5. Cumulative runoff and cumulative sediment yield fitted equation under different erosion stages.
Rainfall Intensity (mm/min)TreatmentsStage IStage II
0.6FT0y = 0.253x − 0.009R2 = 0.9994 **y = 0.364x − 0.227R2 = 0.9835 **
FT2y = 0.345x − 0.026R2 = 0.9964 **y = 0.573x − 0.359R2 = 0.9816 **
FT4y = 0.372x − 0.078R2 = 0.9388 **y = 0.962x − 0.859R2 = 0.9987 **
FT6y = 0.608x − 0.133R2 = 0.9766 **y = 1.389x − 1.571R2 = 0.9939 **
0.9FT0y = 0.336x − 0.040R2 = 0.9924 **y = 0.537x − 1.424R2 = 0.9910 **
FT2y = 0.468x − 0.263R2 = 0.9842 **y = 0.871x+0.029R2 = 0.9992 **
FT4y = 0.275x − 0.053R2 = 0.9806 **y = 1.018x − 1.239R2 = 0.9993 **
FT6y = 0.464x − 0.094R2 = 0.9550 **y = 1.387x − 0.249R2 = 0.9985 **
1.2FT0y = 0.242x+0.006R2 = 0.9988 **y = 0.442x − 2.222R2 = 0.9925 **
FT2y = 0.158x − 0.078R2 = 0.9553 **y = 0.590x − 1.765R2 = 0.9975 **
FT4y = 0.175x − 0.193R2 = 0.9242 **y = 0.618x − 0.004R2 = 0.9950 **
FT6y = 0.091x − 0.097R2 = 0.9253 **y = 1.194x − 6.953R2 = 0.9728 **
Note: **, Correlation is significant at the 0.01 level.
Table 6. Contribution rate of rainfall intensity and initial thaw depth to sediment.
Treatments0.6i0.9i1.2iM (kg)M1 (kg)M2 (kg)Contribution Rate of Rainfall Intensity (%)Contribution Rate of Initial Thaw Depth (%)
0.9i–0.601.2i–0.600.9i–0.6i1.2i–0.6i0.6i–0.600.9i–0.6i
/0.9i–0.60
1.2i–0.6i
/1.2i–0.60
0.9i–0.90
/0.9i–0.60
1.2i–1.20
/1.2i–0.60
FT05.0017.6025.8712.620.8712.620.87010010000
FT28.7239.1836.5134.1831.5130.4627.793.7289.1288.1910.8811.81
FT420.8541.3037.6336.332.6320.4516.7815.8556.3451.4343.6648.57
FT626.6332.2950.3127.2945.315.6623.6821.6320.7452.2679.2647.74
Note: 0.6i (0.9i and 1.2i) is sediment under the condition of rainfall intensity 0.6 mm/h (0.9 mm/min and 1.2 mm/min) and initial thaw depth i (i = 0, 2, 4, 6) cm; M is comprehensive increment of sediment; M1 is variable amount of sediment due to change of rainfall intensity; M2 is variable volume of sediment due to changes in thawing depth, M = M1 + M2.
Table 7. Contributions of inter-rill erosion and rill erosion to slope erosion.
Rainfall
Intensity
(mm/min)
TreatmentsTotal
Erosion Amount
(kg)
Stage IStage II
Erosion Amount (kg)Contribution Rate (%)Erosion Amount (kg)Contribution Rate (%)
0.6FT05.000.5010.024.5089.98
FT28.720.313.538.4296.47
FT420.850.472.2620.3797.74
FT626.630.441.6626.1898.34
0.9FT017.600.734.1416.8795.86
FT239.181.102.8038.0997.2
FT441.300.210.5041.0999.50
FT632.290.601.8531.6998.15
1.2FT025.870.772.9925.1097.01
FT236.510.521.4235.9998.58
FT437.630.411.0837.2298.92
FT650.310.360.7249.9599.28
Publisher’s Note: MDPI stays neutral with regard to jurisdictional claims in published maps and institutional affiliations.

