Abstract
Foreign trade in subdeveloped regions may lead to serious environmental problems. The direct and possible indirect ways in which foreign trade correlates with green economic efficiency in subdeveloped regions are qualitatively analyzed. Empirical tests are conducted based on the data of 80 prefecture-level cities in Central China. Results show that: (1) Foreign trade in Central China has a significant parabolic type of relationship with green economic efficiency. (2) Foreign trade in Central China will indirectly correlate with green economic efficiency through stimulating industries agglomerated in big cities, changing the level of industrial specialization and adjusting policy and technical environments. Whether the indirect relation between foreign trade and green growth is positive is determined by the scale of foreign trade itself. (3) The relation between foreign trade and green economic efficiency in different cities of Central China is heterogeneous. From the perspective of spatial heterogeneity, the negative relation of cities along major rivers and cities not belonging to capital city groups is more significant. From the perspective of city characteristic heterogeneity, a parabolic type of relationship of foreign trade with green economic efficiency is significant in large cities or cities with a pleasant policy environment, whereas the relationship is negative in small and medium sized cities or cities with a high proportion of manufacturing. Policy implications are proposed.
1. Introduction
Since 1978 China has experienced rapid economic growth; however, because China has a vast territory, coupled with a relatively short development period, development gaps among regions are relatively significant, with the degree of development decreasing in an east-central-west gradient. Central China is a typical representative of a subdeveloped region. The GDP of Central China is relatively high, but there is still a large gap compared with the developed regions in Eastern China. From the perspective of industrial structure, there are relatively fewer types of industries in Central China, mainly those dealing with raw materials, fuel power and agricultural processing. From the perspective of innovation ability, the development of high-tech in Central China is relatively slow [1,2]. As a subdeveloped region, Central China is facing pressures of both growth and transformation. In order to overcome this difficult position, Central China continues to expand the scale of foreign trade and integrate into the international market.
Based on the Belt and Road Initiative, Central China has increased both the number of free trade zones and the range of the China Railway Express. As a result, Central China has experienced a sharp increase in foreign trade. In 2019, the total import and export volume of the six provinces in Central China (Hubei, Hunan, Jiangxi, Anhui, Henan and Shanxi) was USD 343,127.29 million, about 6.36 times that of 2006 (the data source is the official website of the National Bureau of Statistics). From the perspective of spatial distribution, large cities are obviously the core of foreign trade, in which the scale of foreign trade is still growing; The overall development trend of foreign trade in Central China is ‘from south to north’ (Figure 1). The positive relationship between foreign trade and high-quality development has been empirically studied through testing whether it has stimulated regional economic growth, promoted industrial upgrading, and at the same time changed the spatial distribution of factor supply such as labor and intermediate goods [3,4,5]. On 22 July 2021, the ‘Opinions of the Central Committee of the Communist Party of China and the State Council on Promoting the High-quality Development of Central China in the New Era’ was officially released. It clearly proposes to ‘strive to promote inland high-level opening up’, meaning foreign trade will be more important to Central China.
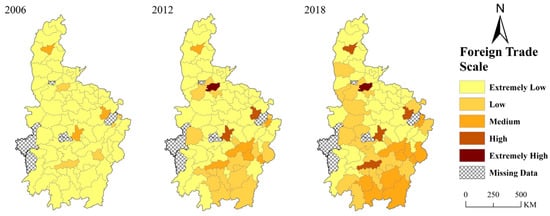
Figure 1.
Foreign trade scale of Central China.
In contrast to simply stimulating economic growth, foreign trade also has a substantial impact on environmental quality; however, the environmental effect of foreign trade is still disputed. Grossman and Kruegerconfirmed that the impact of income on air quality in NAFTA was an inverted parabolic type, which is the so-called environmental Kuznets curve [6]. As for developing countries, there might be ‘pollution refuge paradise’ in the process of international trade That is, with the expansion of foreign trade, the environmental quality will decrease substantially [7,8,9]. As the largest developing country, China also has the phenomenon of ‘pollution refuge’ in the process of expanding the scale of foreign trade [10]. Others believe that the ‘pollution refuge hypothesis’ is not necessarily valid, for the selection of pollution indicators will greatly affect the conclusion [11]. Dietzenbacher and Mukhopadhyay found that India has gained double benefits of increasing income and improving environmental quality in the process of foreign trade [12]. By using data of South Africa, Kohler confirmed that trade liberalization reduces per capita carbon dioxide emissions [13].
Subdeveloped regions, such as Central China, may be confronted with more serious ecological and environmental risks in their pursuit of economic growth. On the one hand, developed regions will gradually eliminate most polluting companies to achieve an environmental goal, while subdeveloped regions will passively accept these polluting companies [14]. On the other hand, subdeveloped regions face double competition from developed regions and from other subdeveloped regions, which may lead to the behavior of a ‘supervision race to the bottom line’ and gradually reduce the intensity of environmental regulation [15]; however, little research has used city-level data to detail the green growth status in Central China and the role of foreign trade in forging it. It is worth exploring whether subdeveloped regions such as Central China will face serious ecological and environmental risks in the process of opening up to the outside world, exploring an efficient and green growth path.
To make a more in-depth discussion on the relationship between foreign trade and green economy efficiency in subdeveloped regions, based on the practices of Central China, we have made the following marginal contributions in this paper. First, qualitative analysis is performed on the relationship between foreign trade and green economic efficiency in subdeveloped regions. Second, green economic efficiency of cities in Central China are estimated and analyzed by using the data of prefecture-level cities in this region from 2006 to 2018. Third, a variety of econometric models are employed to empirically test whether there is a negative relationship between foreign trade and green economic efficiency in Central China. Fourth, we empirically test the heterogeneity of the relationship between foreign trade and green economic efficiency in Central China from the perspective of spatial location and city characteristics. Fifth, policy implications which provide references for balancing the contradiction between economic growth and environmental protection in subdeveloped regions are proposed.
2. Theoretical Hypotheses and Mechanism Analysis
In this section, we analyze how foreign trade is associated with green economic efficiency (Figure 2).
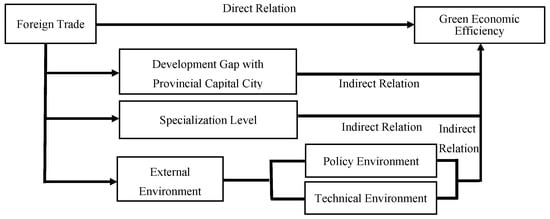
Figure 2.
How foreign trade correlates with green economic efficiency.
Foreign trade of subdeveloped regions might have two opposite direct effects on green economic efficiency. From the perspective of changing economic efficiency, foreign trade improves regional economic efficiency by expanding the market size, arousing the ‘domestic market selection effect’ and the ‘export market selection effect’, while decreasing economic efficiency through the ‘market crowding effect’ [16,17,18]. The main exports of Central China are electronic products, photovoltaic products, handmade products, etc. Participating in international trade reduces competition intensity of these products and increases selling prices [19]. From the perspective of environmental effects, production capacity expansion without technological progress will increase energy consumption and pollution emissions considering the industrial structure of Central China.
Hypothesis I: Foreign trade directly correlates with the green economic efficiency of Central China, but whether the relation is positive needs to be tested.
According to related research, there might be four major indirect effects foreign trade has on green economic efficiency. First, foreign trade can change the spatial distribution of industries. Agglomeration has been proven to have both a positive spillover effect of improving green economic efficiency through fostering ecological cycles and reducing transportation costs as well as energy consumption. It has the negative spillover effect of ‘regulation capture’ [20,21]. International trade strengthens agglomeration by introducing a foreign market based on the ‘New Economic Geography’ model, then changing the spillover effect [22]. Second, foreign trade has an industrial structure-adjusting effect. Industrial agglomeration is conducive to the improvement of regional specialization [23], forming a ‘high-high’ productivity pattern at the core and periphery [24]. From the perspective of environmental benefits, on the one hand, regional specialization is conducive to environmental protection innovation. On the other hand, similar enterprises tend to imitate each other to cut pollution control expenditures under looser environmental regulation in a subdeveloped region, forming pollution agglomeration, especially in small- and medium-sized cities [25]. Third, Foreign trade has a policy environment-adjusting effect. Foreign trade forces regional policy to adapt to the increasing trade flow, increasing regional productivity [26,27]. To encourage expanding the scale of foreign trade, a positive policy environment may result from loose environmental regulation, increasing pollution emissions. Fourth, foreign trade in subdeveloped regions can change the technological environment for industrial development. One kind of technological innovation aims mainly to improve productivity, which only improves total factor productivity [28,29,30]; however, innovations of this type help reduce pollution emissions. Qiao directly proved that foreign trade has a threshold effect on green innovation efficiency of China [31]. Under certain conditions, foreign trade will have a negative effect on regional green innovation.
Hypothesis II: Foreign trade in subdeveloped regions will indirectly correlate with green economic efficiency by promoting industrial agglomeration in provincial capitals, stimulating regional industrial restructuring, and changing the policy environment as well as the technological environment.
There are 80 prefecture-level cities in Central China. Different cities have different physical and cultural geographical characteristics. For instance, cities along major rivers may be required to make restricted environmental regulations; Cities close to a regional policy administrative center always have a better policy environment. As a result, we propose
Hypothesis III: The relationship between foreign trade and green economic efficiency is spatially heterogeneous in Central China.
3. Econometric Models and Data Analysis
3.1. Econometric Models
To test whether Hypothesis I and Hypothesis III are true, we constructed the following econometric model:
ENE represents green economic efficiency, FX represents scale of foreign trade, and X represents the vector composed of control variables, such as real income level of residents, foreign capital utilization, proportion of manufacturing, natural resources, level of urbanization and financial support (loan balance at the end of the year). Symbols i and t are the labels of city units and years, respectively, while ԑi,t is random disturbance. The relationship between foreign trade and economic efficiency in Central China may be nonlinear, so we add a quadratic term of FX to the model, which is (FX)2. Significantly negative β11 and positive β12 can support a parabolic relationship between foreign trade and green economic efficiency. A positive β11 and negative β12 imply an inverted parabolic relationship on the other hand. To test Hypothesis II, we further construct a set of empirical test models:
The meanings of ENE, FX and X are consistent with Equation (1). MED represents mediation variables. In order to test Hypothesis II, MED will be replaced by a development gap with provincial capital, industrial specialization, industrial policy environment and level of technological innovation. In addition, we considered the nonlinear effect of foreign trade. If β31 and β33 in Equation (3) are significant and β21 in Equation (2) is significant at the same time, we can prove that foreign trade in subdeveloped regions will indirectly correlate with green economic efficiency. Symbols i and t are the labels of city units and years respectively, ԑi,t is random disturbance.
3.2. Data Analysis
This paper uses the data of 80 prefecture-level cities in Central China. Data sources are China city statistical yearbooks, China statistical yearbooks, statistical yearbooks of six provinces in Central China, and statistical bulletins of each city from 2007 to 2019. Data of patents are from the CNRDS database and the official website of the National Bureau of Statistics. Data of Chaohu, which has been incorporated into Hefei, is excluded. Data of Tianmen, Xiantao, Qianjiang and Jiyuan are excluded, for these cities are county-level cities governed by provincial governments. Data of Enshi and Xiangxi are excluded. Indicators such as income, expenditures and costs are all deflated by the price index of the corresponding year, removing the impact of inflation.
3.2.1. Dependent Variable: Green Economic Efficiency
Super Slack Based Model is adopted to estimate the green economic efficiency of prefecture-level cities in Central China from 2006 to 2018 [32]. Input variables are capital, labor and energy utilization. Since prefecture-level cities do not directly report capital stock, capital investment is the value of fixed assets estimated by the perpetual inventory method. Labor input is total employment of prefecture-level cities at the end of the year. Data of energy consumption in prefecture-level cities are not complete, so we use a method to estimate energy input. First, provincial level data are used to calculate the energy consumption per unit GDP (10,000 tons of standard coal) of each province, then total energy consumption of prefecture-level cities are estimated by multiplying the GDP of prefecture-level cities by energy consumption per unit GDP of each province. The good output variable is real regional GDP of prefecture-level cities; the bad output variable is pollution emission of cities, which is measured by industrial wastewater emission, sulfur dioxide emission and industrial smoke emission. In this paper, ENE is used to represent green economic efficiency. On the other hand, total industrial electricity consumption of prefecture-level cities is used to measure energy consumption. Then green economy efficiency is re-estimated as the dependent variable in a robust test, which is represented by ENEA. Figure 3 and Figure 4 show the spatiotemporal variation of green economic efficiency in Central China from 2006 to 2018. Before 2018 green economic efficiency shows a trend of decline, indicating economic growth in the region was at the cost of environmental pollution to some extent. In 2018 president Xi conducted an investigation on the protection of the Yangtze River and intensified the concept of ‘high standard protection’. Then local governments of cities along the Yangtze River forced many polluting enterprises to close, move or transform under environmental protection pressure from the central government. These actions effectively reduced the pollution emission of the region. Figure 4 shows that the green economic efficiency of Shanxi Province is quite low and is declining. Cities in Anhui Province and provincial capitals have a relatively higher green economic efficiency.
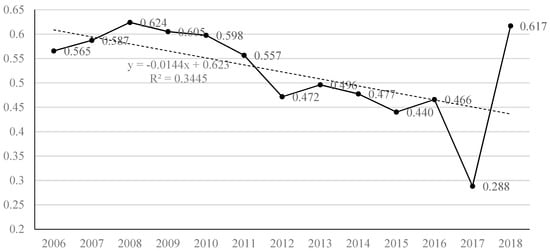
Figure 3.
Temporal change of green economic efficiency in Central China.
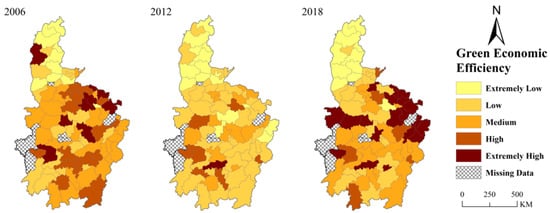
Figure 4.
Spatial heterogeneity of green economic efficiency in Central China.
3.2.2. Main Independent Variable: Status of Foreign Trade
Although the absolute amount of foreign trade in big cities is quite large, the proportion of total foreign trade in GDP may not be high, for the economic scale of big cities is also very large. The absolute amount of foreign trade cannot measure the development status of foreign trade in a city precisely; therefore, we use the ratio of total foreign trade and GDP of prefecture-level cities in Central China to measure the status of foreign trade of prefecture-level cities, excluding the impact of city size on the absolute amount of foreign trade. FX is used to represent the status of foreign trade of cities in Central China. Using Stata 14.0, we draw the fitted scatter diagram of foreign trade and green economy efficiency to preliminarily explore the relationship between them. Figure 5 shows that there is a significant negative relationship between foreign trade and green economy efficiency, indicating expanding foreign trade in Central China is not conducive to green growth.
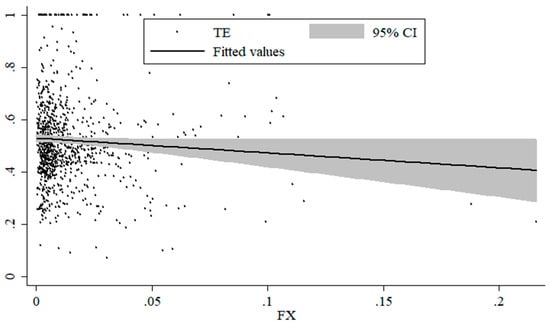
Figure 5.
Fitted scatter Ddagram of foreign trade and green economy efficiency.
3.2.3. Mediating Variable: Development Gap with Provincial Capital; Level of Industrial Specialization; Policy Environment; Technology Innovation
The development gap between a prefecture-level city and a provincial capital is the indicator of industrial distribution, which is measured by the ratio of GDP of a prefecture-level city and GDP of a provincial capital, for the main direction of industrial flow is from the provincial capital in the region. The relative-diversification index can accurately reflect industrial specialization of a region. At the same time, a relative-diversification index is more suitable than an absolute-diversification index for the horizontal comparison between cities.; therefore, we use the method of Li and Song to estimate the industrial relative-diversification index of prefecture-level cities in Central China, which is expressed as RDI [33]. The policy environment of industrial development includes multiple dimensions of indicators such as direct government investment, public service level and environmental regulation; therefore, we use the entropy method to estimate the policy environment of industrial development in prefecture-level cities in Central China [34]. The government’s direct investment and public service level are taken as positive indicators, whereas environmental regulation is a negative indicator. The government’s direct investment is measured by general budget expenditures of government and fixed asset investment per unit of GDP. The level of public service is measured by the number of schools, hospitals and libraries. Environmental regulation is measured by the reciprocal of pollution emission per unit of GDP. Policy environment in this paper is expressed as POLEN. The level of technological innovation is measured by the number of patents authorized in prefecture-level cities, which is expressed as CRE.
3.2.4. Control Variables
The per capita real income level (RIC) of residents is measured by the per capita real wage of prefecture-level cities. The real utilization level of foreign capital (FDI) is measured by real foreign direct investment in prefecture-level cities. The proportion of manufacturing (MAN) is measured by the proportion of manufacturing employment in total employment of the city. The level of urbanization (CD) is measured by the proportion of nonagricultural population in the total population of the city. Natural resources (NR) are measured by the proportion of employment in agriculture, forestry, animal husbandry, sideline fisheries and extractive industries in the total employment of the city. Restricted by the availability of data, we use the year-end loan balance of prefecture-level cities to measure financial support (FANJR). Table 1 shows the descriptive statistics of all data. We have normalized CRE, RIC, FDI and FANJR through performing logarithmic processing on them.

Table 1.
Descriptive statistics.
4. Empirical Test Results
4.1. Basic Regression Results
Table 2 reports the empirical test results of whether foreign trade in Central China is directly associated with green economic efficiency. Results of Model (1) show that the foreign trade in Central China has a parabolic type of relationship with green economic efficiency. In Model (2), Model (3) and Model (4), we add control variables, city fixed effect and year fixed effect successively, showing that the coefficient of FX is still significantly negative, whereas the coefficient of (FX)2 is positive. The parabolic type relationship of foreign trade and green economic efficiency predicts that when the foreign trade scale of Central China is below to a threshold, it will be detrimental to green growth, whereas, if foreign trade has passed the threshold, it will become boost green growth. A lower scale of foreign trade means it is not the key factor to promote growth of the city, and cities of this kind cannot always supervise foreign trade activity effectively. As a result, the negative externality of foreign trade on green growth might exceed the positive externality; however, with the increasing importance of foreign trade in GDP, government will pay more attention to it and remove unfavorable factors through strict regulations. In addition, with cities’ industrial chains becoming more adapted to the foreign market in the process of expanding foreign trade, production efficiency will become higher. From Figure 1, provincial capitals and regions south of the Yangtze River always have larger scale foreign trade, predicting these regions might benefit more from foreign trade to stimulate green growth. Moreover, we should notice that foreign trade in most cities in Central China counts for only a small part of GDP, as shown in Figure 5, indicating most cities of Central China did not achieve green growth through expanding foreign trade.
Table 2.
Basic regression results.
4.2. Robust Test Results
We examined the results in Table 2 through a robustness test. Corresponding results are reported in Table 3. First, we used ENEA instead of ENE as the dependent variable of the regression. Model (1) in Table 3 reports the regression results. It can be seen that the coefficient of FX is significantly negative and the coefficient of (FX)2 is significantly positive. Second, data before 2013 are excluded, and the coefficients of equation (1) are re-estimated. The regression results of Model (2) in Table 3 show the coefficient of FX is significantly negative, and the coefficient of (FX)2 is significantly positive. However, the absolute value of the coefficients increases, indicating that green growth in Central China has become more sensitive to the change of foreign trade in recent years. Third, the ratio of real foreign capital utilization to GDP is selected as the instrumental variable of foreign trade. Then, instrumental variable estimation was performed. Compared to the regression results in Table 2, the coefficients of FX and (FX)2 reported in the regression results of Model (3) in Table 3 do not increase so much. As a result, there is little chance of a weak instrumental variable. According to the regression results, the coefficient of FX is significantly negative, and the coefficient of (FX)2 is significantly positive. Fourth, we used the difference GMM method to re-estimate the coefficients of equation (1). The first-order lag term of the status of green economic efficiency (ENE) was added to the control variables. Most second-order lag term of FX, (FX)2, CD and MAN were selected as their own instrumental variables. The results of Model (4) in Table 3 show that the coefficient of FX is significantly negative, the coefficient of (FX)2 is significantly positive, and instrumental variables have all passed the valid test and the over-identification test. The robust test results support Hypothesis I, which means we can conclude that foreign trade in Central China has a parabolic type of relationship with green economic efficiency is robust.
Table 3.
Robust test results.
4.3. Mediating Effect Test
Table 4 reports the test results of Hypothesis II. Results of Model (1) and Model (2) show that the increase of foreign trade scale reduces the coefficient of AGG, and the improvement of AGG predicts decreases in green economic efficiency. Therefore, foreign trade has a negative indirect relationship with green economic efficiency in Central China, for the expansion of foreign trade predicts a wider development gap between prefecture-level city and provincial capital. In the process of industrial agglomeration in Central China, the negative externality of foreign trade to the environment obviously exceeds the positive externality. There are two possible reasons. First, the increase in the scale of foreign trade has widened the economic gap between cities and intensified competition between cities, which may have caused cities, especially small and medium-sized cities, to relax their environmental regulations when attracting investments. Second, agglomeration of polluting industries has formed a brand effect in the international market. Increasing export orders for these products have stimulated productivity but led to an increase in energy consumption and pollution. Foreign trade in the subdeveloped region is still dominated by products with high energy consumption and high pollution. Data of 2014 show that export products of Central China were mainly machinery and appliances, vehicles, steel and fossil fuels [19]. The expansion of the scale of foreign trade and the upgrading of the foreign trade industries did not occur simultaneously.
Table 4.
Mediating effect test results.
Results of Model (3) and Model (4) show that foreign trade has a parabolic type of relationship with the relative-diversification index in Central China, and the improvement of the relative-diversification index predicts a positive stimulus on green economic efficiency. Therefore, foreign trade in Central China has a negative indirect relationship with regional green economic efficiency because a larger foreign trade scale means a higher level of industrial specialization when cities’ FX is quite low, whereas if FX passes the threshold, the indirect relationship between foreign trade and green growth will turn positive, which predicts only cities with relatively higher FX can take advantage of the positive indirect stimulating effect of foreign trade on green growth. In Central China cities with lower FX are those small and medium-sized cities with a high proportion of leading industries. According to Ricardo’s comparative advantage theory, expanding the scale of foreign trade always starts in those industries and then strengthening the leading position of the industries. Taking Shiyan as an example, the leading position of the automobile industry has been strengthened. In 2020 the automobile industry in Shiyan achieved an output value of CNY 65 billion, accounting for nearly 70% of the total industrial output value above provincial domain scale. Stronger industrial specialization also means higher costs and greater difficulties in adjusting the industrial system. In the future, it will be difficult for most cities in Central China to abandon existing industries and develop a new industrial system. As a result, the most feasible industrial transformation plan is to improve resource utilization efficiency and reduce pollution emissions of the existing industries.
Panel B reports the test results of whether foreign trade in Central China has changed the external environment of industrial development, indirectly correlating with green economic efficiency. It can be found that the relationship between FX and POLEN is an inverted parabolic type and that a positive policy environment is conducive to increasing green economic efficiency of Central China, indicating that in most cities of Central China foreign trade has a positive indirect relationship with green growth through a policy adjustment channel. In cities with higher FX, governments tend to strengthen environmental regulations to achieve ecological goals because economic growth is not the priority to governments. A positive coefficient of POLEN indicates that enterprises in Central China are not very sensitive to the intensity of environmental regulation. On the contrary, improvement of the policy environment may be mainly caused by the improvement of public service levels and the infrastructure construction level, which will increase the attraction of talent. With more professional and technical personnel, production processes of enterprises will be optimized, improving resource utilization efficiency and reducing pollution emissions. According to the regression results of Model (7) and Model (8), the relationship between FX and CRE is an inverted parabolic type. However, the negative coefficient of CRE in Model (8) indicates that current technological innovation may focus mainly on expanding productivity rather than on environmental protection, which has a negative impact on green economic efficiency. Expanding the scale of foreign trade in cities with lower FX in Central China predicts a decrease in green economic efficiency in relation to improving the technological innovation environment. For cities newly engaged in foreign trade, only lower prices can help their products claim a large market share quickly. As a result, innovations are aimed at promoting productivity in such cities. As mentioned above, the industrial characteristics of Central China determine that more production will lead to higher energy consumption and higher pollution, reducing regional green economic efficiency, whereas to build competitive foreign trade industries, cities need to focus on quality and ecology rather than on quantity so less attention is paid to simply improving productivity. In the future, Central China should pay more attention to advanced production methods and environmental protection technologies of expanding the scale of foreign trade.
5. Heterogeneity Analysis
The industrial structure and policy environment of different cities in Central China are quite different, and the scale of foreign trade in each city is heterogeneous. Therefore, it is reasonable to believe that the relationship between foreign trade and green economic efficiency in Central China will be heterogeneous among different cities. This part of the paper will empirically test the heterogeneous relationship between foreign trade and green economic efficiency in Central China from the perspective of spatial location heterogeneity and heterogeneity of city characteristics.
5.1. Spatial Heterogeneity
Corresponding test results are reported in Table 5. Results of Model (1) and Model (2) report the north-south difference in the impact of foreign trade on green economic efficiency in Central China. The 33° north latitude line is used to divide Central China into a southern part and a northern part. We can see that both coefficients of FX in Model (1) and Model (2) are not significant, so we can conclude that foreign trade has no different relationship with green economic efficiency between cities in the north and the south in Central China. Results of Model (3) and Model (4) report the difference in the relationship of foreign trade and green economic efficiency of cities along major rivers and cities not along major rivers in Central China. Major rivers in Central China are the Yangtze River, the Yellow River and the Huaihe River. It can be seen that the foreign trade of cities along major rivers has a significant negative relationship with green economic efficiency. Cities along major rivers originally had stronger environmental regulations and better environmental protection, but in the face of regional competition pressures, these cities may relax environmental regulation to achieve economic growth, resulting in more obvious damage to the environment. Taking Yichang as an example, before 2018, a large number of chemical enterprises were still located within 5 km of the Yangtze River. Incremental foreign trade orders led to the expansion of productivity and then pollution emissions. Results of Model (5) and Model (6) report the difference in the relationship of foreign trade and green economic efficiency of cities belonging to the capital city group and to those not belonging, showing the negative relationship of foreign trade with green economic efficiency in cities not belonging to the capital city group is more significant. Based on their economic advantages, provincial capital cities in Central China began to explore the road of green transformation with lower pollution and lower energy consumption. In order to avoid pollution spillover from surrounding cities, capital city groups enforced high-standard environmental regulations, eliminating polluting industries while still building foreign trade. Cities not in capital city groups are much farther away from policy centers, so that they may absorb more polluting enterprises in this process. Meanwhile, cities not belonging to capital city groups paid less attention to environmental goals than to economic growth goal.
Table 5.
Heterogeneity test results; A: spatial heterogeneity.
5.2. Heterogeneity of City Characteristics
More profound than the heterogeneity of cities’ spatial location is the heterogeneity of city characteristics. We further analyzed the heterogeneity of how foreign trade is associated with green economic efficiency caused by the heterogeneity characteristics of cities in Central China. Corresponding test results are reported in Table 6. First, we divided cities into large cities and small and medium-sized cities based on the average GDP of Central China. According to the results of Model (1) and Model (2), FX and ENE keep a parabolic type of relationship in large cities, whereas foreign trade has negative effects on green economic efficiency only in small and medium-sized cities. The findings confirmed that in the process of foreign trade, small and medium-sized cities will be confronted with greater pressure for economic growth. Promoting agglomeration of polluting industries is a common method of achieving economic growth to small and medium-sized cities, whereas large cities with large-scale foreign trade industries achieved green growth through engaging in international market. Second, we used the average value of the policy environment as the standard to divide cities into two categories: cities with positive policy environments and cities with negative policy environments. Results of Model (3) and Model (4) show that the parabolic type of relationship between foreign trade and green economic efficiency is significant in cities with positive policy environments, whereas it is insignificant in cities with unpleasant policy environments. This indicates the possibility of promoting green growth in cities with positive policy environments through foreign trade, whereas foreign trade makes no sense in cities with negative policy environments. For mediating effect test results, foreign trade has an inverted parabolic type of relationship with the policy environment, indicating the positive stimulating effect of foreign trade on cities with a positive policy environment. However, this might turn negative for expanding foreign trade in cities with relatively high FX, predicting a lower positive policy environment. Finally, we use the proportion of manufacturing employment to measure the development level of manufacturing, and use its average value in Central China as the standard to divide cities into two categories: cities with a high proportion of manufacturing and cities with a low proportion of manufacturing. The results of Model (5) and Model (6) show that foreign trade has a negative relationship with green economic efficiency in cities with a high proportion of manufacturing. That means engaging manufacturing in Central China in the international market is not conducive to green growth. Central China is specialized in manufacturing, so it should on the one hand pay more attention to upgrading manufacturing and improving green efficiency in the future, On the other hand, to cultivate emerging industries with lower energy consumption and higher production efficiency to replace some existing industries, the whole industry chain needs to be upgraded.
Table 6.
Heterogeneity test results B: heterogeneity of city characteristics.
6. Conclusions and Policy Implications
Through theoretical analysis and empirical regression based on the data from Central China, we come to the following conclusions: (1) Foreign trade in Central China has a significant parabolic type of relationship with green economic efficiency. The result has been proven robust by replacing the dependent variable, adjusting the time span of the data and performing an IV regression and a difference GMM regression. (2) Foreign trade in Central China indirectly correlates with green economic efficiency by stimulating industrial agglomeration in big cities, changing the level of industrial specialization and adjusting policy and technological environments. (3) Foreign trade has a parabolic type of relationship with a relative-diversification index, inverted parabolic type relationship with a positive policy environment and inverted parabolic type relationship with technological innovation, respectively. Whether an indirect relationship between foreign trade and green growth is positive is determined by the scale of foreign trade itself. (4) The relationship between foreign trade and green economic efficiency in different cities of Central China are heterogeneous. From the perspective of spatial heterogeneity, the fact that the negative relationship in cities along major rivers and cities does not belong to capital city groups is more significant. From the perspective of city characteristic heterogeneity, the parabolic type of relationship of foreign trade with green economic efficiency is significant in large cities or in cities with a positive policy environment, whereas the relationship is negative in small and medium-sized cities or in cities with a high proportion of manufacturing. Accordingly, pollution in foreign trade industries in subdeveloped regions should be quite serious, and foreign trade will inevitably increase regional competition. In order to reconcile the contradiction between environmental protection and economic growth, we suggest:
- (1)
- Continuously expanding the scale of high-quality foreign trade. The parabolic type of relationship between foreign trade and green growth in Central China indicates that foreign trade could promote regional green growth. The development of foreign trade industry should therefore be encouraged, and the standard of regional transportation infrastructure construction should be improved. To promote foreign trade in small and medium-sized cities, the domestic transportation system should be improved through increasing navigation capacity of channels and establishing high-speed railway freight system. Pilot free-trade zones and China Railway Express should be launched in more cities. In the process of opening up, attention should be paid to improving the quality of products and diminishing pollution caused by unordered expansion of production capacity. Introducing advanced production technologies in foreign trade improves resource utilization efficiency and pollution control capacity. The experience of cities with large-scale foreign trade should be shared with other cities to reduce adverse impact on green growth due to lack of experience in promoting foreign trade.
- (2)
- Promote the transformation of industries in the region. Surplus industries with high energy consumption and high pollution in Central China should gradually be replaced. Chemical plants along the Yangtze River and small mines in mountainous areas should be closed. Improve and update the production technology of manufacturing to improve efficiency. Old machinery should be replaced, and more reasonable input-output plans should be formulated. High-tech industries with high economic efficiency and less pollution should be cultivated in the region to improve the overall quality of the industrial chain. Tax relief or subsidies should be provided to researchers of environmental protection who can guide the direction of technological innovation to environmental protection and resource recycling.
- (3)
- Environmental regulations should be strengthened. This involves perfecting environmental protection legislation, establishing professional teams to enforce environmental law and increasing penalties for polluting enterprises. In particular, strengthen environmental regulation in small and medium-sized cities, cities with a high proportion of manufacturing and cities in core ecological areas. In doing so, governments can recruit volunteers to strengthen daily patrols and develop special APPs to enable the public to join the supervision of pollution emissions at any time. The ecological compensation transfer payment system should be perfected. Cities with low environmental protection pressure can compensate cities with high pressure; cities with better economic status can compensate cities with slow growth rate; cities with more pollution emissions can compensate cities with less pollution emissions.
- (4)
- Balance regional development and prevent regional vicious competition. For most cities in Central China, the development of foreign trade comes at a cost to the environment, indicating that the importance of economic growth exceeds environmental protection to some extent. First of all, a reasonable assessment index system should be built which further weakens the importance of economic objectives and improves the importance of environmental protection objectives. With the strengthening of environmental regulation, the attraction of cities to industries will decrease. The policy environment should be more positive for industrial development in the region through improving the quality of public services, especially in small and medium-sized cities, thereby increasing the attraction of cities to talents and high-tech enterprises.
Author Contributions
Conceptualization and funding acquisition, J.Z.; methodology, writing and formal analysis, E.G.; data curation, C.Z. All authors have read and agreed to the published version of the manuscript.
Funding
This work was supported by [the National Social Science Fund of China] under Grant [19BGJ033].
Institutional Review Board Statement
Not applicable.
Informed Consent Statement
Not applicable.
Data Availability Statement
Publicly available datasets were analyzed in this study, data sources are China City Statistical Yearbooks, China Statistical Yearbooks, Statistical Yearbooks of 6 provinces in Central China, Statistical Bulletins of each city from 2007 to 2019, these data can be found here: [https://data.cnki.net/Yearbook/Navi?type=type&code=A, accessed on 23 January 2022 https://data.stats.gov.cn/easyquery.htm, accessed on 23 January 2022]. Data of patents was obtained from CNRDS database and are available with the permission of CNRDS database.
Conflicts of Interest
The authors declare no conflict of interest.
References
- Wang, Y.; Lin, H. Industrial structure in Central China: Concentration, isomorphism and specialization. Soc. Sci. Hunan 2012, 6, 103–105. [Google Scholar]
- Yao, P.; Zhang, M. Industrial development in China in the 70 years after the founding of new China: Industrial development, achievements, problems and countermeasures in central China. J. Macro Qual. Res. 2019, 7, 103–113. [Google Scholar]
- Hu, F. Study on the relationship of industrial structure upgrading, foreign trade and environmental pollution—From the evidence of Eastern and Central China. Inq. Econ. Issues 2011, 9, 117–122. [Google Scholar]
- Huang, T.Z.; Chen, X. The research on economic growth effects of foreign trade—regional economic perspective panel data test. Econ. Probl. 2011, 10, 33–36. [Google Scholar]
- Ma, M. An empirical analysis of foreign trade development and employment effect in Central China. Stat. Decis. 2015, 19, 141–144. [Google Scholar]
- Grossman, G.M.; Krueger, A.B. Environmental impacts of a north American free trade agreement. CEPR Discuss. Pap. 1992, 8, 223–250. [Google Scholar]
- Copeland, B.R.; Scott, T.M. North-south trade and the environment. Q. J. Econ. 1994, 109, 755–787. [Google Scholar] [CrossRef]
- Levinson, A.; Taylor, M.S. Unmasking the pollution haven effect. Int. Econ. Rev. 2008, 49, 223–254. [Google Scholar] [CrossRef] [Green Version]
- Zhang, Y.G. China’s regional trade patterns under the perspective of carbon emissions: Pollution haven and factor endowment. China Ind. Econ. 2015, 8, 5–19. [Google Scholar]
- Zhang, Y.; Zhang, N.; Qin, F. Does pollution haven hypothesis hold for the export of agricultural production material? Influence of agricultural production material firms’ pollution on export. Issues Agric. Econ. 2015, 36, 88–94. [Google Scholar]
- Kearsley, A.; Riddel, M. A further inquiry into the pollution haven hypothesis and the environmental Kuznets curve. Ecol. Econ. 2010, 69, 905–919. [Google Scholar] [CrossRef]
- Dietzenbacher, E.; Mukhopadhyay, K. An empirical examination of the pollution haven hypothesis for India: Towards a green Leontief paradox? Environ. Resour. Econ. 2007, 36, 427–449. [Google Scholar] [CrossRef]
- Kohler, M. CO2 emissions, energy consumption, income and foreign trade: A south African perspective. Energy Policy 2013, 63, 1042–1050. [Google Scholar] [CrossRef]
- Liu, Y.; Li, L. The mechanism of vertical environmental regulation on the transfer of polluting industries: Analysis based on the perspective of local government competition. Ecol. Econ. 2021, 37, 206–219. [Google Scholar]
- Kim, J.; Wilson, J.D. Capital mobility and environmental standards: Racing to the bottom with multiple tax instruments. Jpn. World Econ. 1997, 9, 537–551. [Google Scholar] [CrossRef]
- Krugman, P. Geography and Trade; MIT Press: Cambridge, UK, 1991; pp. 98–109. [Google Scholar]
- Melitz, M.J. The impact of trade on intra-industry reallocations and aggregate industry productivity. Econometrica 2003, 71, 1695–1725. [Google Scholar] [CrossRef] [Green Version]
- Redding, S.; Venables, A.J. Economic geography and international inequality. J. Int. Econ. 2004, 62, 53–82. [Google Scholar] [CrossRef] [Green Version]
- Song, Z.; Che, S.; Liu, W. Analysis of spatial pattern and trade structure of foreign trade in Central China. Geogr. Res. 2017, 36, 2291–2304. [Google Scholar]
- Fan, C.C.; Scott, A.J. Industrial agglomeration and development: A survey of spatial economic issues in east Asia and a statistical analysis of Chinese regions. Econ. Geogr. 2003, 79, 295–319. [Google Scholar] [CrossRef]
- Ma, Y.; Liu, Q. Research on mechanism and effect of industrial agglomeration on green economic efficiency. Inq. Econ. Issues 2021, 7, 101–111. [Google Scholar]
- Brakman, S.; Garretsen, H.; Gigengack, R. Negative feedbacks and industrial location. J. Reg. Sci. 1996, 36, 631–651. [Google Scholar] [CrossRef]
- Guy, M.; Ferdinand, R.; Redding, S.J. Urbanization and structural transformation. Q. J. Econ. 2008, 127, 535–586. [Google Scholar]
- Wang, K.; Zhao, B.; Ding, L. Economic catch-up, structural transformation and green total factor productivity. J. Shanxi Univ. Financ. Econ. 2021, 43, 15–26. [Google Scholar]
- Zhang, G.; Liang, Q. Export, agglomeration and TFP growth. J. Int. Trade 2010, 12, 12–16. [Google Scholar]
- Hsieh, C.T.; Klenow, P.J. Misallocation and manufacturing TFP in China and India. Q. J. Econ. 2009, 124, 1403–1448. [Google Scholar] [CrossRef] [Green Version]
- Liang, W.; Ge, H. The impact of fiscal expenditure fluctuation on TFP growth: An empirical analysis on provincial panel data from 1979 to 2018. J. Tech. Econ. Manag. 2021, 3, 86–90. [Google Scholar]
- Grossman, G.M.; Helpman, E. Trade, innovation, and growth. Am. Econ. Rev. 1990, 80, 86–91. [Google Scholar]
- Humphrey, J.; Schmitz, H. How does insertion in global value chains affect upgrading in industrial clusters? Reg. Stud. 2002, 36, 1017–1027. [Google Scholar] [CrossRef]
- Wang, X.Y.; Bu, L.F. International export trade and enterprise innovation—Research based on a quasi-natural experiment of “CR Express”. China Ind. Econ. 2019, 10, 80–98. [Google Scholar]
- Qiao, M. Heterogeneous Threshold effect of foreign trade on green innovation efficiency of industrial enterprises. Forum Sci. Technol. China 2019, 11, 93–102. [Google Scholar]
- Tone, K. A slacks-based measure of efficiency in data envelopment analysis. Eur. J. Oper. Res. 2001, 130, 498–509. [Google Scholar] [CrossRef] [Green Version]
- Li, J.; Song, D. Specialization, diversification and urban agglomeration economy—An empirical study based on the panel data of China’s prefecture level units. J. Manag. World 2008, 2, 25–34. [Google Scholar]
- Yang, L.; Sun, Z.C. The development of western new-type urbanization level evaluation based on entropy method. Econ. Issues 2015, 3, 115–119. [Google Scholar]
Publisher’s Note: MDPI stays neutral with regard to jurisdictional claims in published maps and institutional affiliations. |
© 2022 by the authors. Licensee MDPI, Basel, Switzerland. This article is an open access article distributed under the terms and conditions of the Creative Commons Attribution (CC BY) license (https://creativecommons.org/licenses/by/4.0/).