Article

Strength and Microstructure Characteristics of Metakaolin-Based Geopolymer Mortars with High Water-to-Binder Ratios

1
Belgian Nuclear Research Centre (SCK CEN), Institute for Environment, Health and Safety, Boeretang 200, 2400 Mol, Belgium
2
Department of Materials Engineering, KU Leuven, Kasteelpark Arenberg 44, 3001 Leuven, Belgium
*
Author to whom correspondence should be addressed.
Sustainability 2022, 14(6), 3141; https://doi.org/10.3390/su14063141
Submission received: 10 February 2022 / Revised: 2 March 2022 / Accepted: 5 March 2022 / Published: 8 March 2022

Abstract

:
Geopolymers and other alkali-activated materials were investigated in detail as alternatives to ordinary Portland cement because of their reduced CO2 emissions, high (radionuclide) binding capacities, and low permeabilities. The last two properties make them potential materials for the immobilization of several types of chemical waste. In this context, the direct immobilization of liquid waste streams would be a useful application. This study aimed to develop geopolymers with high water-to-binder ratios, but with good mechanical strengths, while elucidating the parameters that dictate the strengths. Three potential metakaolin geopolymer recipes were cast and cured for 28 days, after which their strengths, mineralogy, and microstructures were determined. The results show that it is possible to attain acceptable mechanical strengths at water-to-binder ratios that vary from 0.75 to 0.95, which is a significant increase from the ratio of 0.55 that is commonly used in the literature. It was found that the most important parameter that governs the mechanical strength is the dilution of the activating solution, which is represented by the H2O/Na2O ratio, while the microstructure was found to benefit from a high SiO2/Al2O3 ratio.

1. Introduction

In recent years, alkali-activated materials (AAMs) have been studied intensively as an alternative to ordinary Portland cement (OPC) systems, from the perspective of reducing the CO2 emissions that are associated with OPC production, or for superior heat and acid resistance. Most AAMs are produced by dissolving an aluminosilicate precursor in a strongly basic solution, which is followed by the condensation of small aluminosilicate structures into a 3D network gel. The structure of this gel depends on both the chemistry of the activating solution and the type of precursor used. In Ca-rich precursors, such as ground granulated blast furnace slag (BFS) and type C fly ash, a CASH-type gel is formed, which is similar in structure to the CSH gels that are formed in OPC systems. In Ca-poor precursors, such as metakaolin and type F fly ash, a NASH-type gel is formed instead, which has shown to have a nanozeolitic structure. These Ca-poor types of AAMs are often called “geopolymers” [1].
Alkali-activated binders typically offer relatively fast settings, low solubilities, and low permeabilities, which make them interesting materials in the context of (radioactive) waste immobilization [2,3,4,5], with numerous applications that have already been developed for a variety of wastes [6]. Most studies of AAMs focus on the acquisition of high mechanical strength and durability, while little work has been conducted on the accommodation of high amounts of water [7], which is relevant given the high-water contents (more than 90% [8]) of certain types of liquid waste. In the context of the immobilization of liquid wastes, an optimization of the water content, while retaining acceptable mechanical strength, is vital. Of the mentioned precursors, metakaolin-based materials typically require the highest water-to-binder (W/B) ratios because of the high adsorption of water on metakaolin particles, which makes them the most interesting precursors to immobilizing large quantities of liquid waste.
The goal of this study is the manufacture of a metakaolin-based geopolymer with a high W/B ratio that still satisfies the mechanical strength characteristics expected of a stabilized waste form, as defined by the Belgian waste acceptance criteria (ACRIA) (i.e., a minimum flexural and compressive 28-day strength of 1 and 8 MPa, respectively [9]). Once accomplished, the compositional parameters, which determine the strength at high W/B ratios, can be investigated.

2. Materials and Methods

2.1. Materials and Mixing

Metakaolin (MetamaxTM, BASF, Ludwigshafen, Germany) was chosen as the sole aluminosilicate precursor in this study. The XRD analyses reveal the product to be completely amorphous, with a minor amount of crystalline anatase, which is common to most metakaolin precursors. This is also reflected in the TiO2 content of the precursor’s chemical composition (Table 1).
A NaOH solution was prepared by dissolving NaOH pellets (Merck, Belgium) in deionized water. The activating solution was then acquired by either dissolving sodium disilicate (Na2O·2SiO2, Silmaco, Belgium) powder in the NaOH solution, or by mixing a liquid sodium silicate solution with the NaOH solution and supplementing it with additional free water. The activating solution was then mixed with the metakaolin precursor and sand (25 wt.%) to produce a geopolymer mortar. A low-sand fraction was chosen in order to increase the waste loading for future waste immobilization.

2.2. Design of Recipe

The design of a recipe for a durable geopolymer with good mechanical strength is a multifaceted task, as each variable can affect the cured end product. For instance, several studies [10,11,12,13,14] have found that curing at an elevated temperature for a limited period of time can be beneficial for the development of the mechanical strength, while substituting Na for K in the activating solution can lead to a denser microstructure [15,16]. In this work, these variables were fixed by only using Na-based activating solutions and curing them at room temperature (relevant for waste immobilization technology) for 28 days.
As the main objective of the study is the development of geopolymers with high W/B ratios, the balancing of a high-water content with the sufficient activation of the precursor is required. The majority of the studies on metakaolin geopolymers try to balance the W/B ratio, or the solid-to-liquid (S/L) ratio, around the compromise of increased workability at higher liquid contents and increased mechanical strength at lower liquid contents. Various studies have found that an S/L ratio around 0.8 provided an optimal mechanical strength while retaining satisfactory workability [17,18,19]. Similarly, a W/B ratio below 0.55 is often used to attain high-strength geopolymers [20,21,22,23]. In this work, geopolymers with W/B ratios between 0.75 and 0.95 were designed (Table 2). The direct effect is the dilution of the activating solution. Most studies advocate a highly concentrated activation solution to facilitate the dissolution of the precursor, with NaOH concentrations ranging from 5 to 10 M [24,25,26], on the assumption that only a small amount of free water is added to the mixture. If high W/B ratios are used, the H2O/Na2O ratio becomes a more suitable parameter with which to estimate the efficacy of a recipe. For this reason, while H2O/Na2O ratios around 11 are often found in the literature [7,27], the three proposed recipes (R1, R2, and R3) cover a large range, from 17 to 34. The role of the molarity of the NaOH is also tested by the fact that the main difference between the R1 and R2 recipes is the molarity of the NaOH solution (5 M vs. 10 M).
Another variable that was handled in the recipes is the SiO2/Al2O3 ratio, which is often directly related to the compressive strength of the geopolymer. R1 and R2 were set at a ratio of 2.8, while R3 was increased to 3.8, which is close to the value of 4 that was reported by Lahoti et al. as the optimal ratio for acquiring high-strength products [7]. A ratio higher than 4 was not attempted, as this is related to a significant decrease in the mechanical strength [28].

2.3. Characterization

After 28 days of curing, a duplicate sample of each recipe was used to test the flexural and compressive strengths, while another duplicate was subsampled for the microstructural and mineralogical characterizations. One piece was reserved for the determination of the water-saturated porosity, following the procedure described in [29], and another piece was reserved for the scanning electron microscopy (SEM) analysis, while the remainder was further reduced in size, and was sieved for analysis by X-ray diffraction (XRD), mercury intrusion porosimetry (MIP), Fourier transform infrared spectroscopy (FTIR), and N2 physisorption analysis. All of the subsamples were freeze-dried while awaiting analysis.
The MIP measurements were performed at KU Leuven, Belgium, using an AutoPore IV 9500 device, in which mercury was injected up to a pressure of 200 MPa. As a nonwetting liquid, mercury will not spontaneously flow into pores by capillary action; it requires the exertion of a pressure that depends on the size of the pore. This relationship, which is described by the Washburn equation [30], allows for the calculation of the pore size distribution by measuring the pressure and the intruded volume.
The nitrogen physisorption measurements were carried out on a TriStar 3020 device, at a temperature of 77 K, with the purposes of determining the specific surface area and quantifying the pore sizes in the range of 4–100 nm. The specific surface area was calculated using both the t-plot method [31,32] and the BET theory [33], with the former allowing a distinction between the external surfaces and the contributions from the condensation of the N2 in the micropores. The pore-size distributions were calculated by the Barret–Joyner–Halenda (BJH) method [34], which was applied to the desorption isotherm.
The samples for the XRD were mixed with a crystalline internal standard (ZnO), after which the measurements were performed on a Bruker D8 device in a 2θ range of 5–60°, with a step size of 0.02° every 0.2 s using Cu Kα radiation at 40 kV and 40 mA. The mineralogical composition was quantified using Rietveld refinement in the Profex software [35], in which the intensities of the ZnO peaks were used to estimate the quantity of the amorphous phases.
The FTIR analyses were performed on powdered samples that were diluted by an infrared unresponsive KBr powder on a Bruker Tensor II spectrometer that was equipped with a diffuse reflectance (DRIFTS) module, which produces similar results to the classic transmissive measurements.
The samples for the SEM were broken in order to expose fresh surfaces, and they were coated with a 5 nm-thick gold layer. The images were recorded on a Phenom Desktop device by using backscattered electrons, at an accelerating voltage of 10 keV.

3. Results

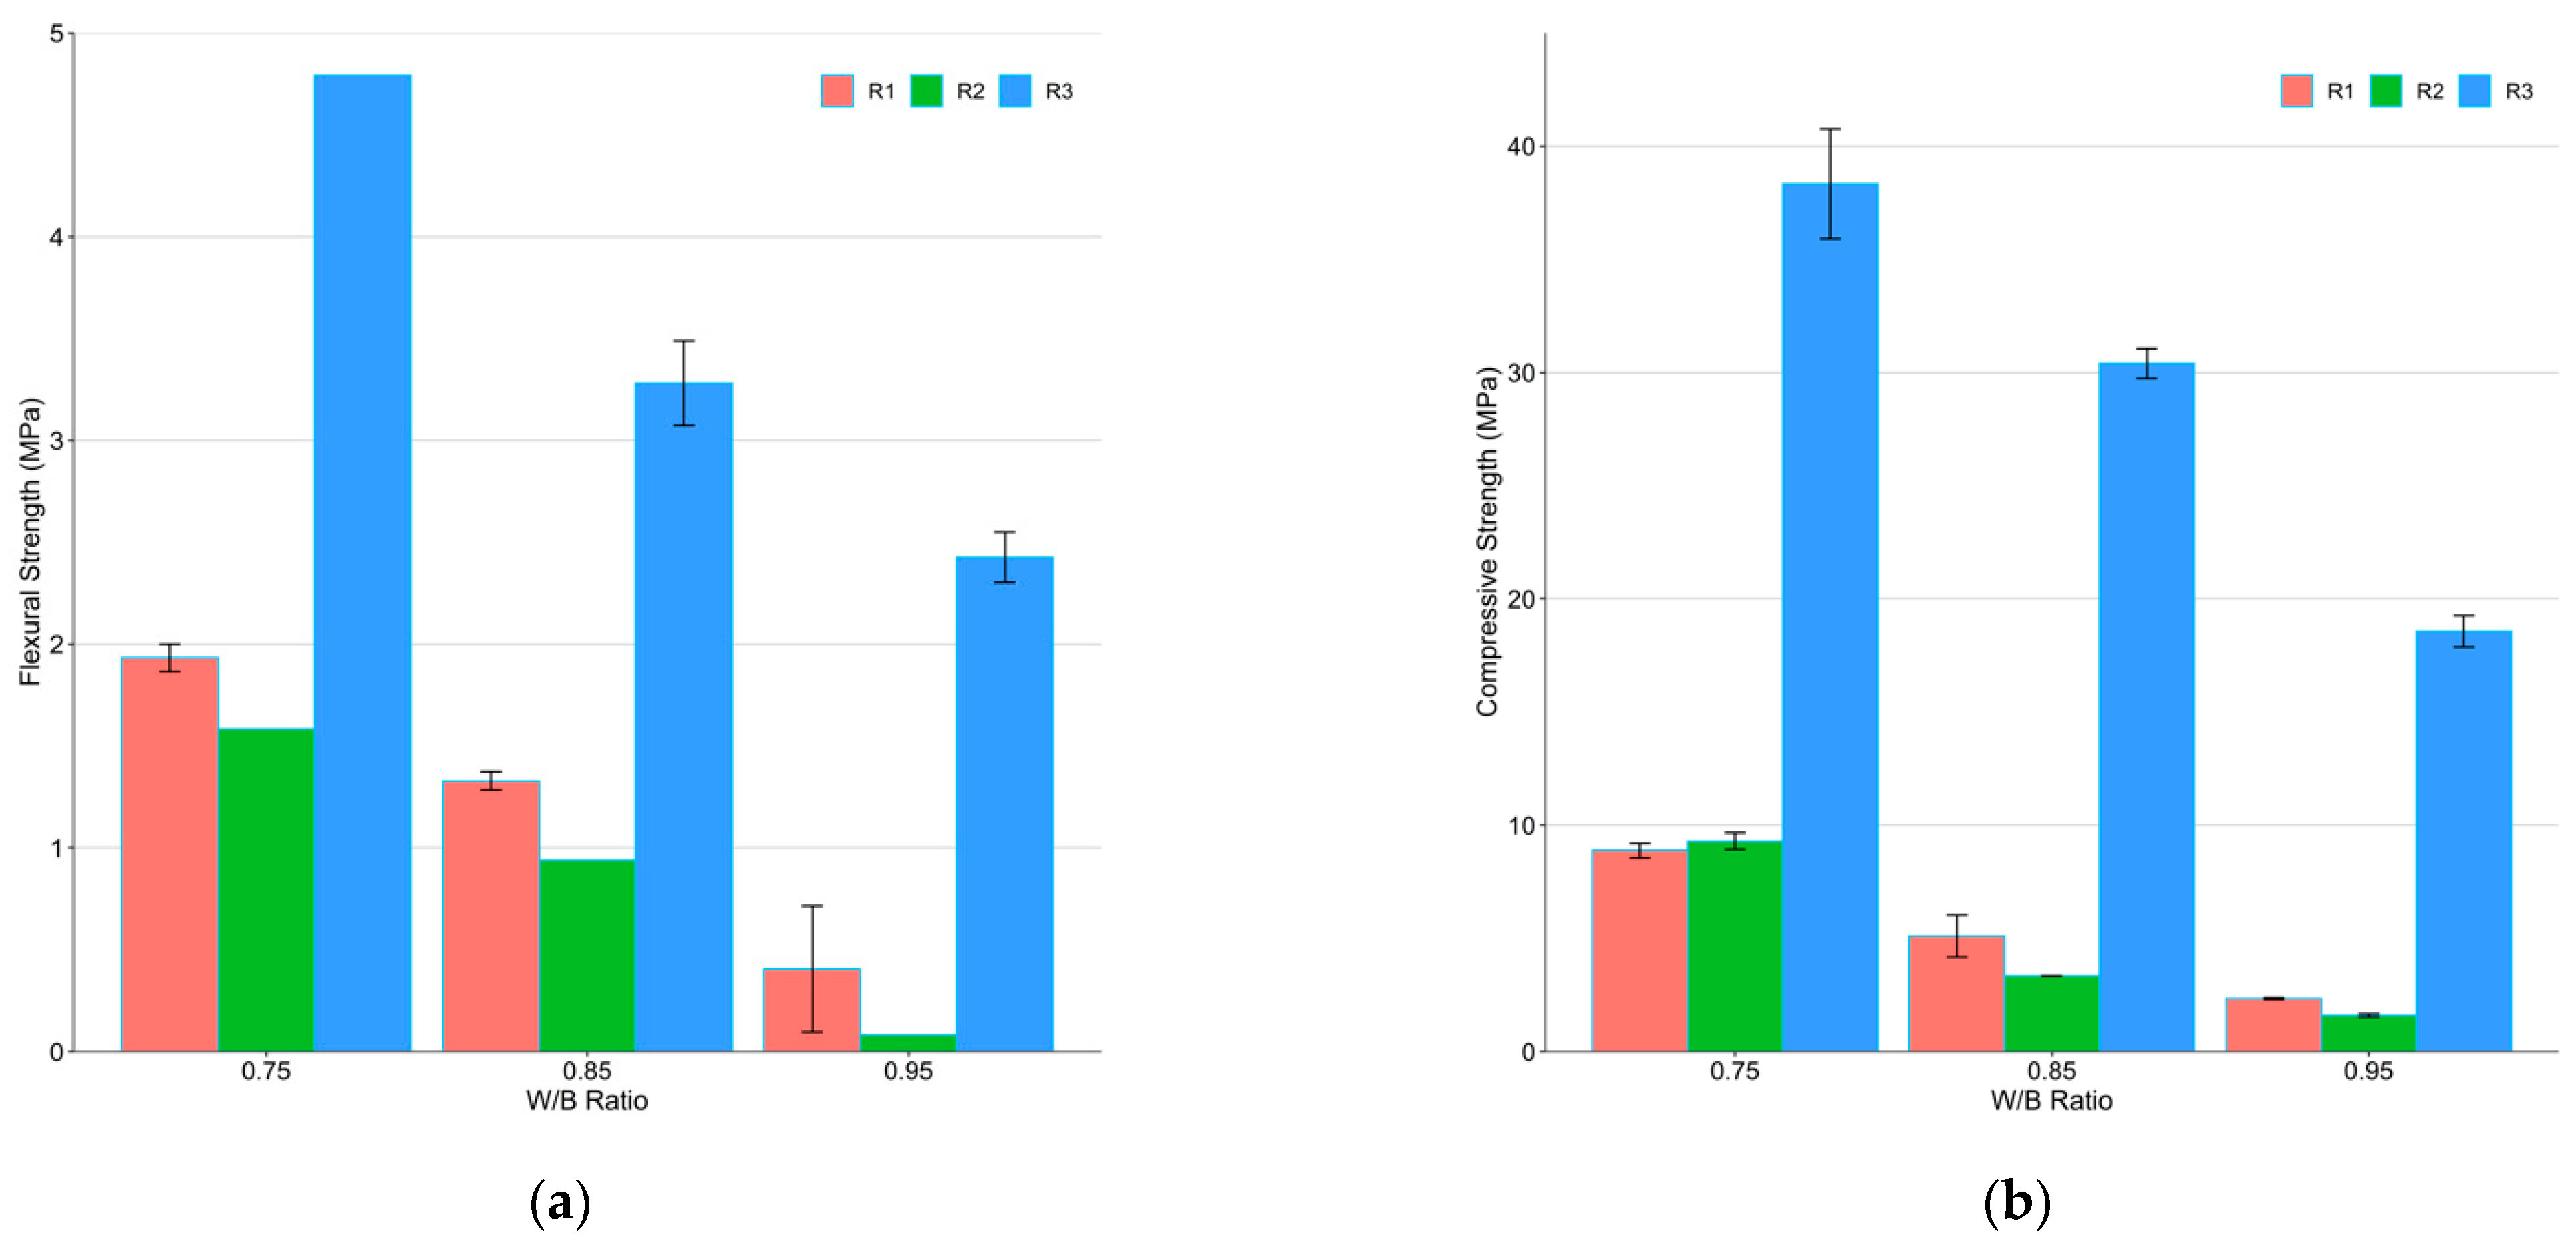
3.1. Mechanical Strength

After 28 days of curing, the prisms of each recipe were inspected and were found to contain no visible cracks or displays of any signs of bleeding. The mechanical strength was subsequently tested and was found to vary depending on the recipe and the W/B ratio (Figure 1). Both the flexural and compressive strengths consistently decreased with an increase in the W/B ratio. The flexural strengths of W/B 0.75 and 0.85 for Recipes 1 and 2 straddle the lower limit (1 MPa) for the ACRIA waste acceptance criteria, while the highest W/B ratio of 0.95 stays well below 1 MPa. With the exception of the lowest W/B ratio, the compressive strengths do not meet the minimum criterion of 8 MPa. Recipe 3 performed markedly better, with a flexural strength in the range of 2.4 to 4.8 MPa, and a compressive strength in the range of 18.6 to 38.3 MPa.

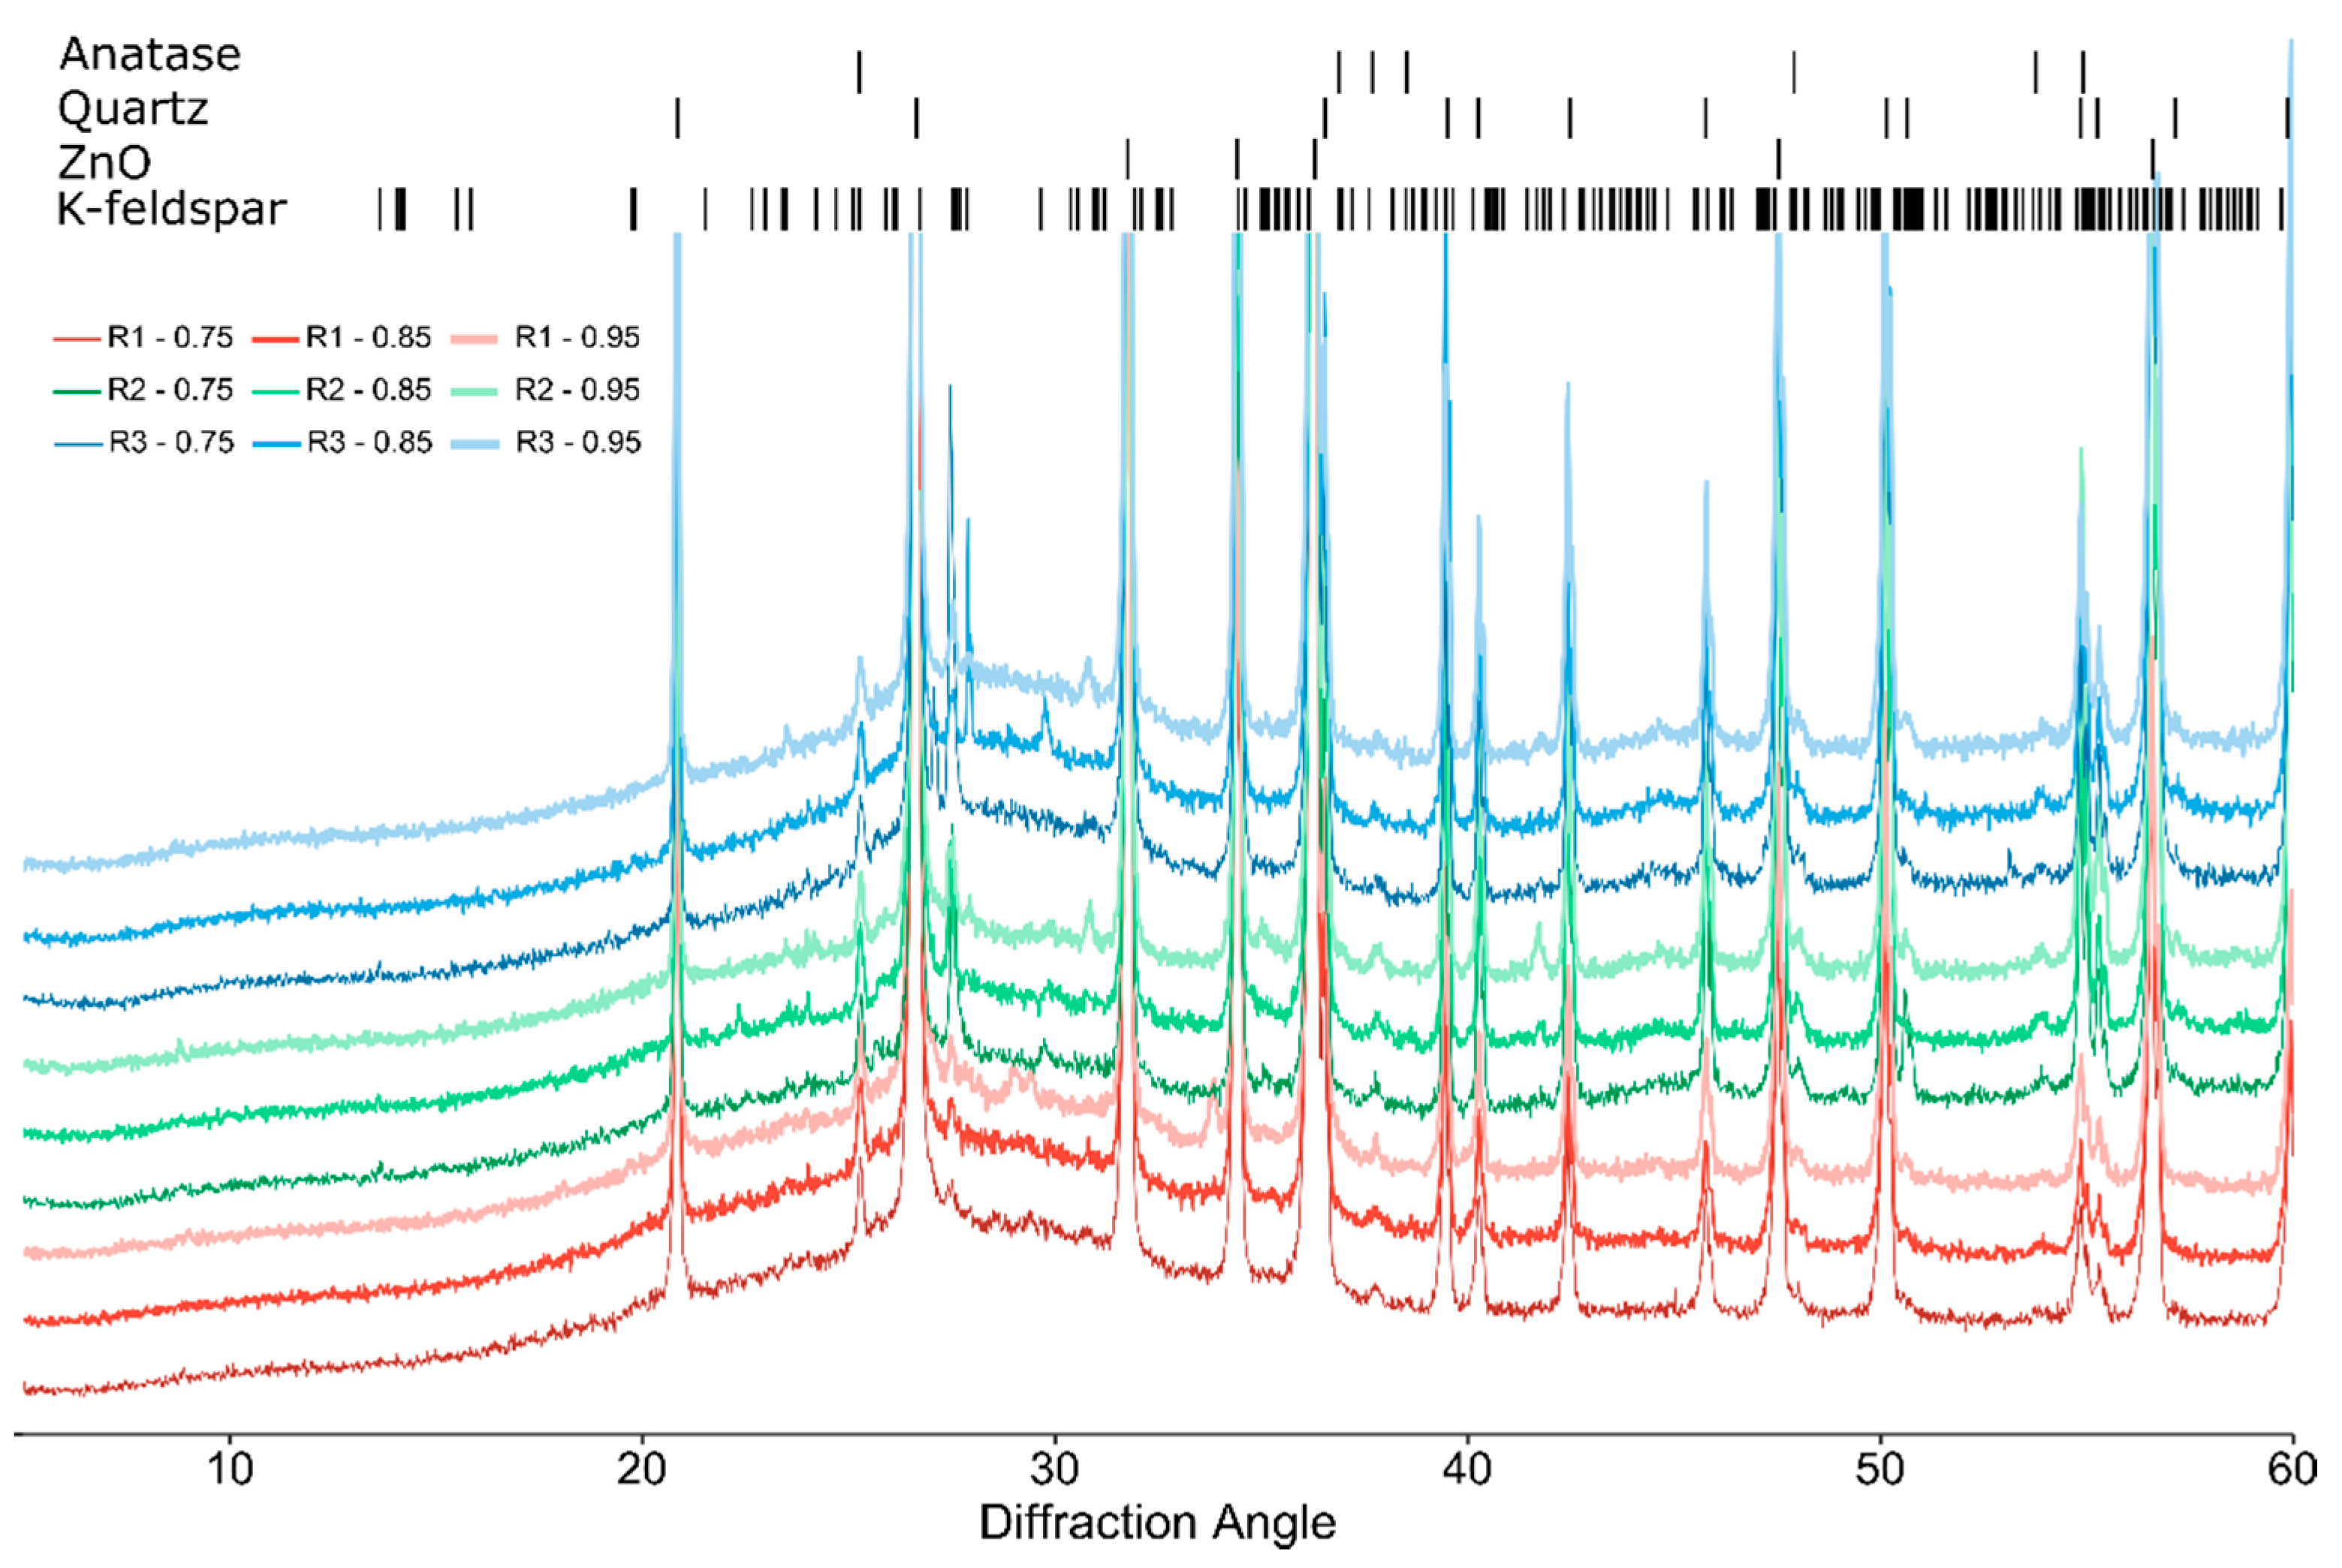
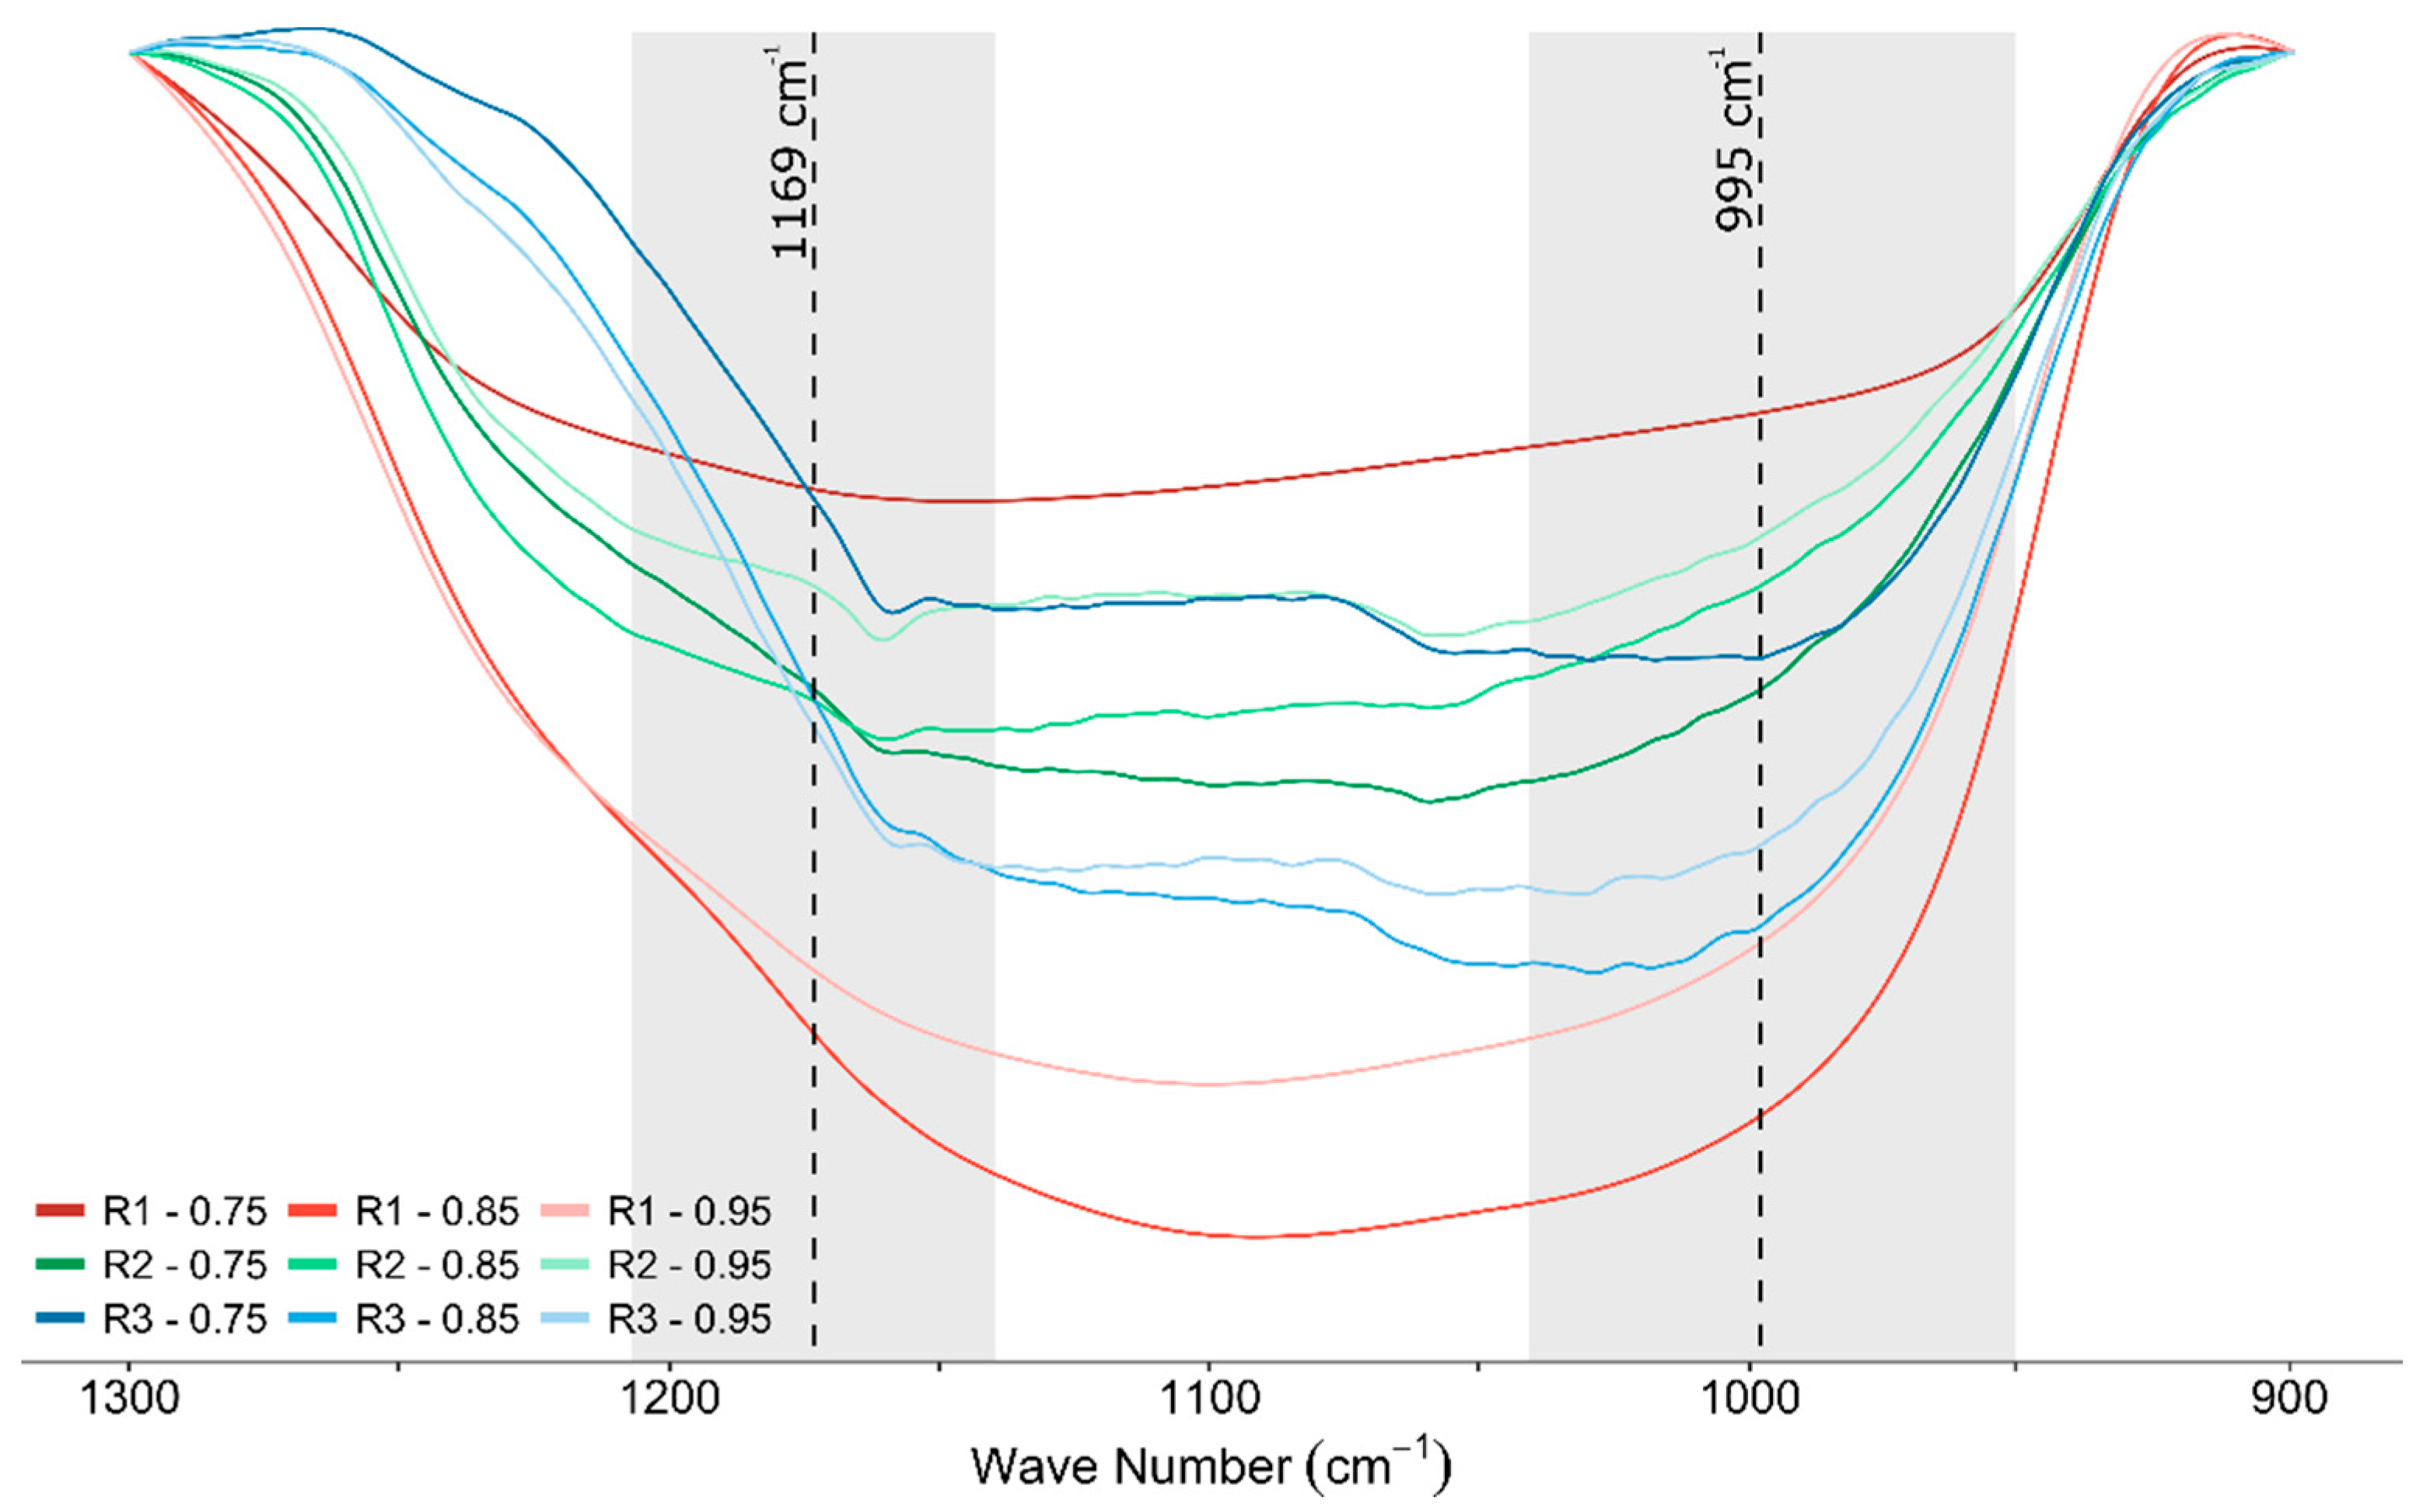
3.2. Mineralogical Analysis

As both the precursor and the formed NASH gel are expected to be amorphous, it is unsurprising that the main features of the XRD patterns (Figure 2) of the geopolymer samples are related to the internal standard ZnO and to the crystalline phases in the aggregate. These phases are quartz and (potassium) feldspar. Traces of anatase (TiO2), which is commonly found in metakaolin precursors, were also found in each sample. The only other crystalline phase that was detected is trona (Na2CO3·NaHCO3·2H2O), which was found in R1-0.95, which could indicate carbonation during curing, which was possibly aided by the high humidity of the curing bench and the high W/B ratio of the geopolymer [36]. The quantified composition (Table 3) indicates aggregate percentages in the range of 20 to 30 wt.%, which agrees well with the amount of sand that was added to the geopolymers.
The FTIR patterns of each recipe show the typical stretching (3400 cm−1) and bending (1648 cm−1) vibrations of water, with little to no difference between the recipes or the W/B ratios (Figure 3). The 1300–900 cm−1 band features the asymmetric stretching vibrations of the Si–O–T bonds, and it is often deconvoluted for the purpose of distinguishing the phases in geopolymer pastes [37]. In the case of mortar, the presence of quartz and its Si–O–Si bonds makes it difficult to deconvolute. Still, it is possible to recognize changes between the recipes (Figure 4). The band at 1169 cm−1 is associated with the asymmetric stretching of unreacted metakaolin. In both the R1 and R2 patterns, the absorption is significant, while it is less so in the R3 patterns. Conversely, the 995 cm−1 band, which is associated with the asymmetric vibrations of the oxygen linkages between the tetrahedral Si in geopolymers [38], is more pronounced in the R3 patterns, which suggests a higher degree of conversion of the metakaolin into a geopolymer gel than in the R1 and R2 samples.

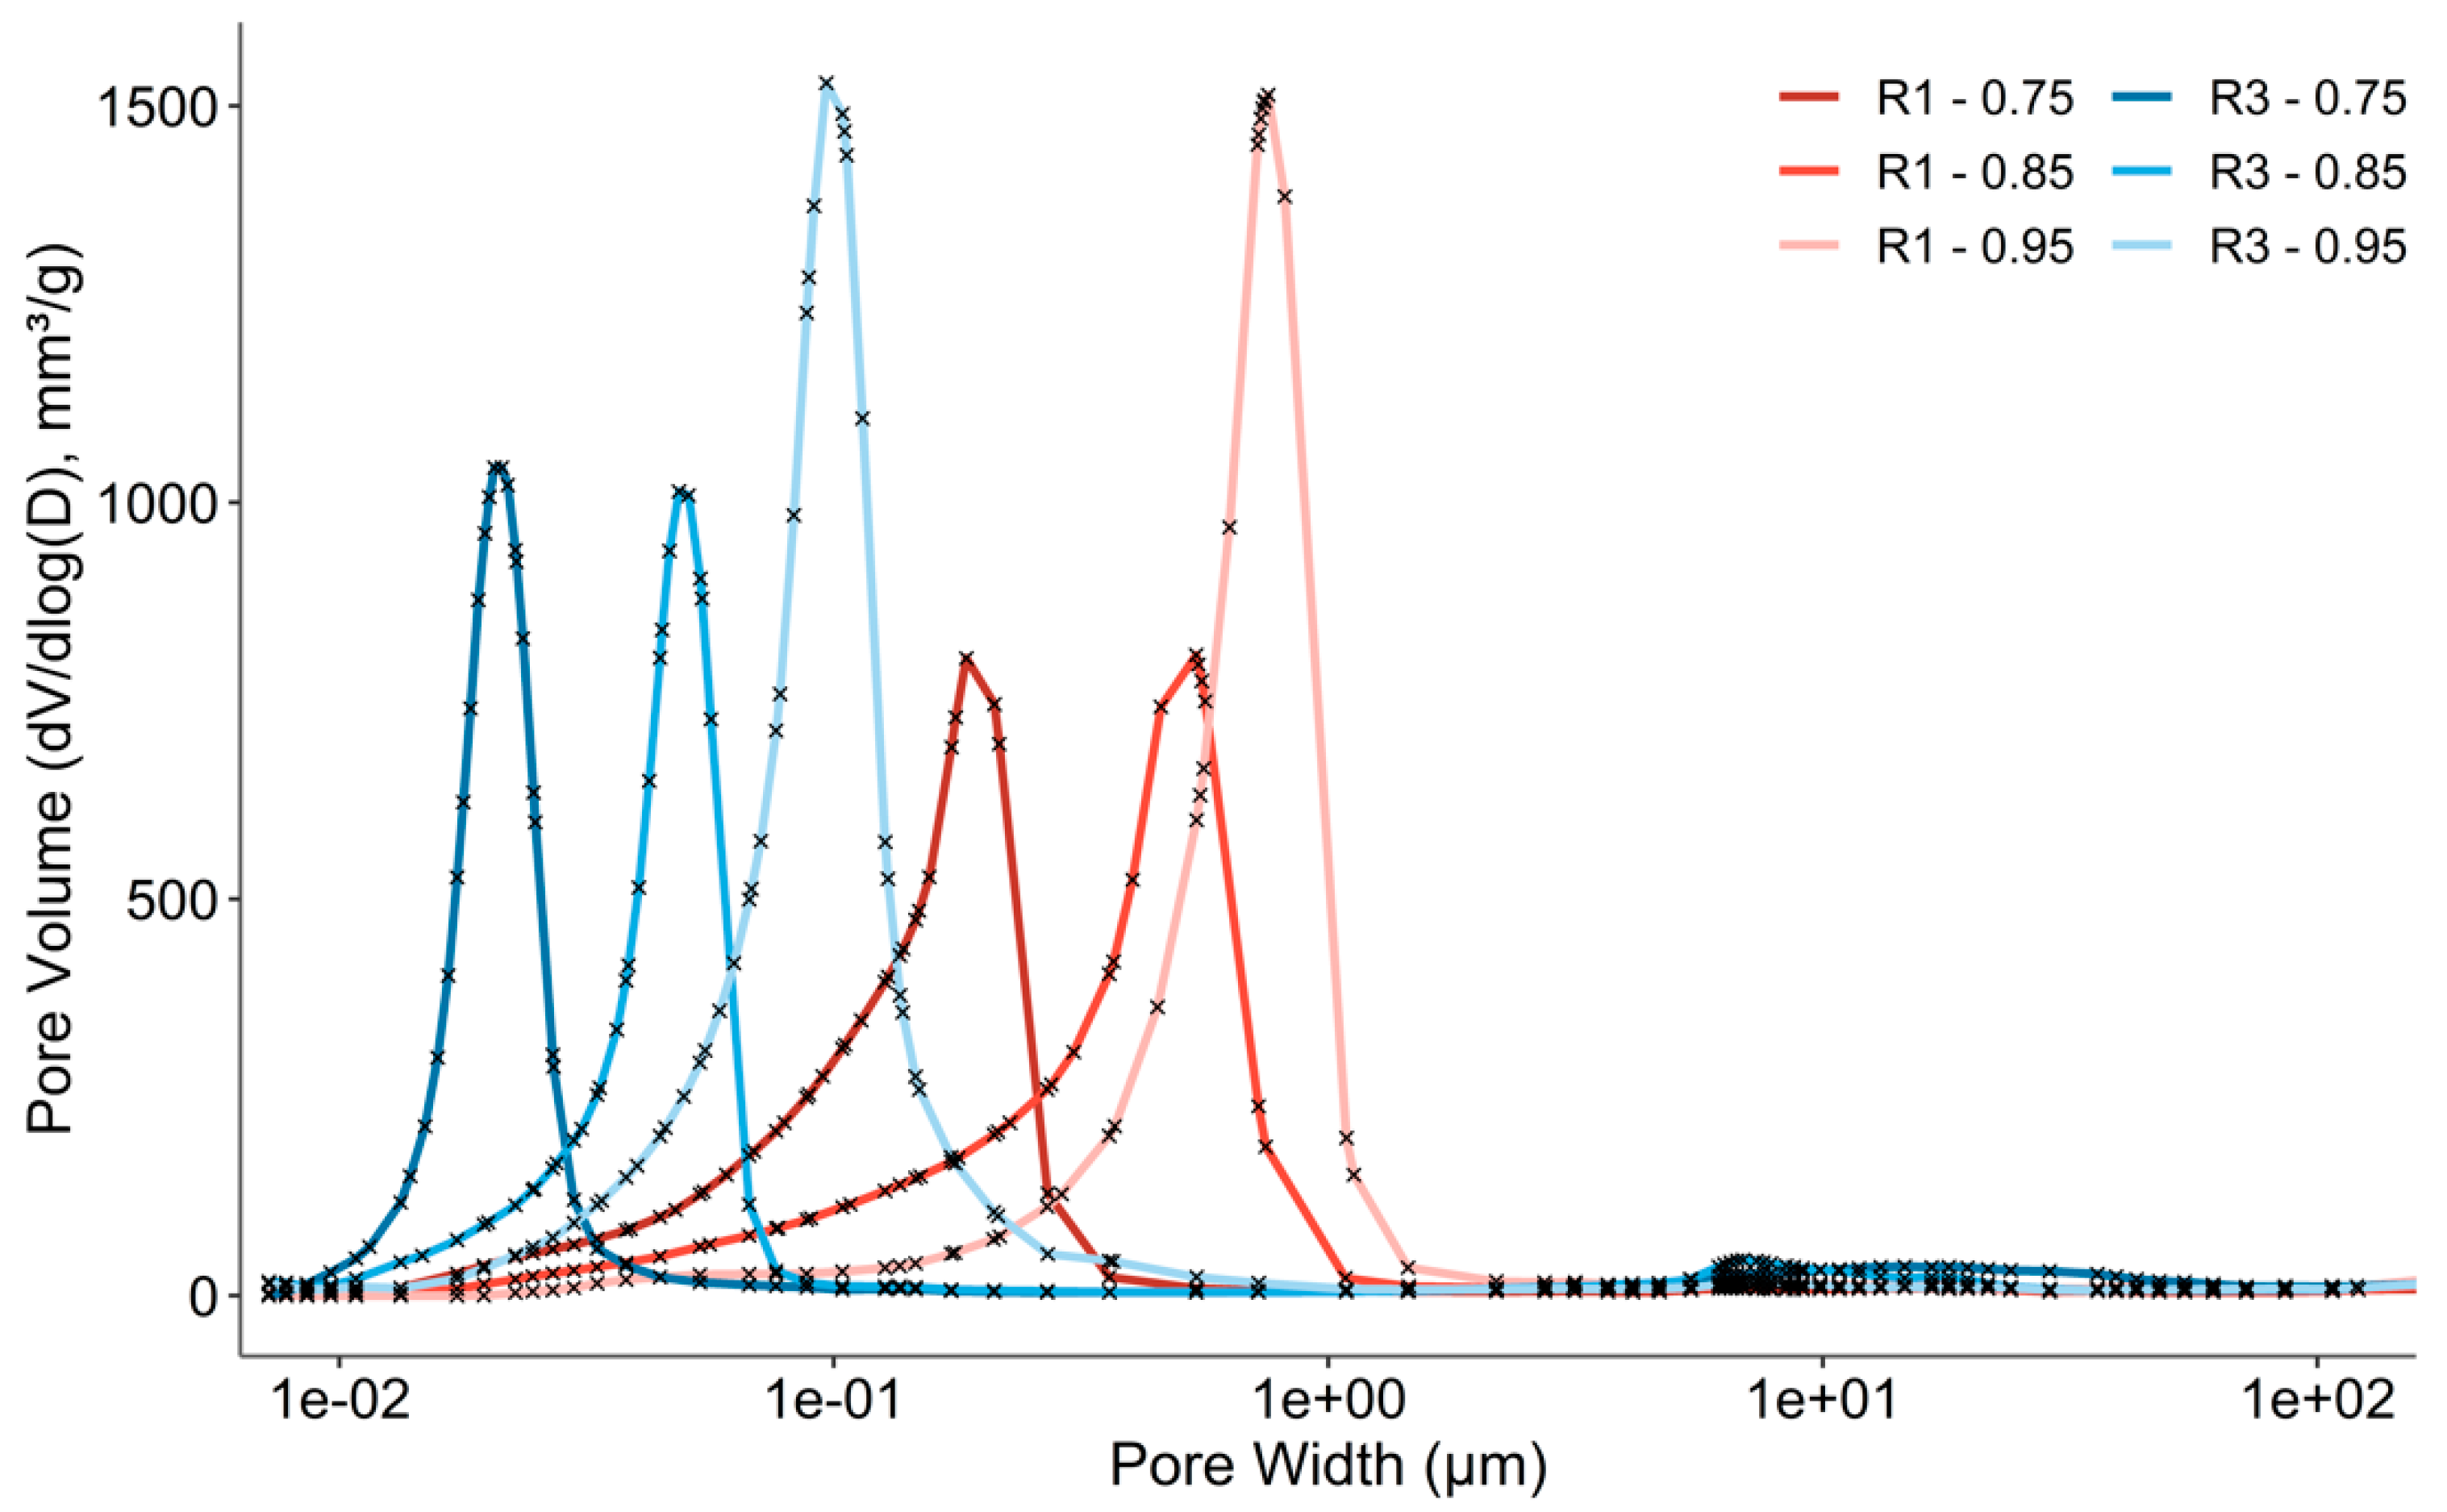
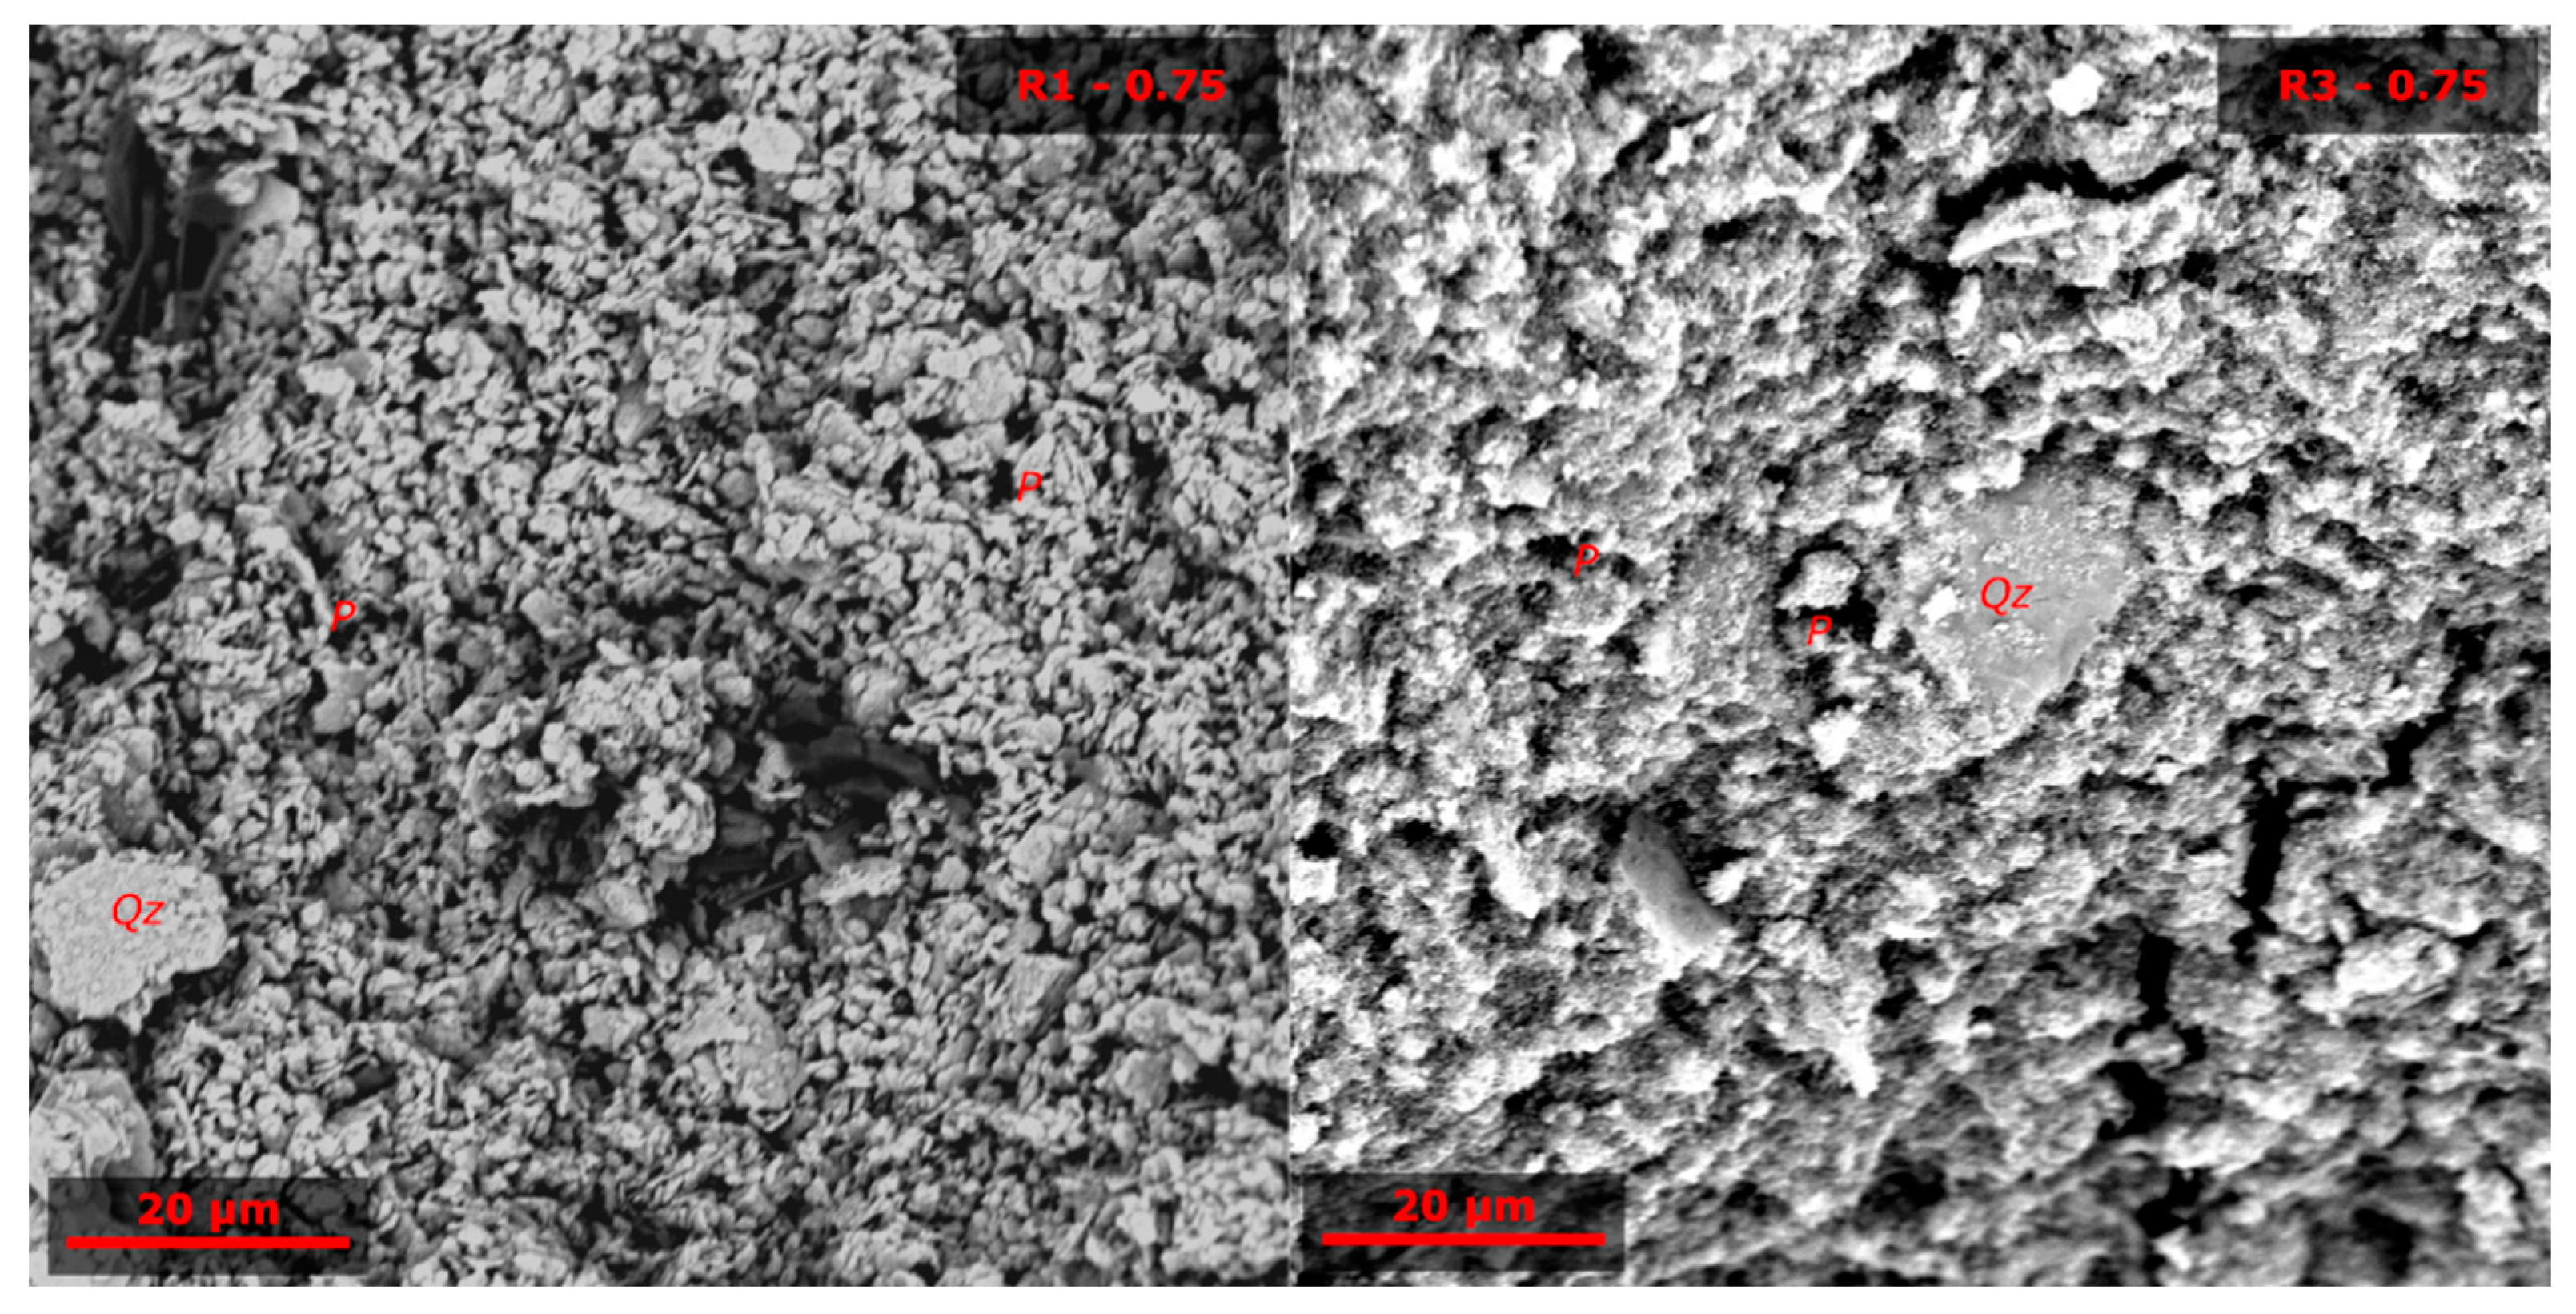
3.3. Microstructural Analysis

The water-saturated porosity (Table 4) does not vary consistently between the W/B ratios or recipes, with the values ranging from 43 to 52%, although the R3 samples do exhibit increases in the porosities with increasing W/B ratios. These measurements allowed for the calculation of the bulk dry density, which does show an inverse relationship with the W/B ratio.
An analysis of the N2 sorption isotherms allows for the calculation of the specific surface areas, and the pore size distributions in the mesopore range from 2 to 50 nm. The specific surface area (SSA), as calculated by the BET theory, decreases with an increasing W/B ratio (Table 5). The SSAs of the R1 samples are significantly higher than those of the R2 and R3 samples, which indicates a structure that is more accessible to nitrogen gas molecules. The SSAs, as calculated by the t-plot method, which allows for a distinction between the contributions of meso- and micropores (which are defined as pores smaller than 2 nm), are similar to the data that was obtained by the BET theory, which indicates that the contribution of the micropores to the total surface area, and also to the total pore network, is limited. As with the SSA, the cumulative pore volume in the mesopore range is related to the W/B ratio, with the highest pore volumes occurring in samples with W/B ratios of 0.75. Again, the highest pore volumes are found in the R1 samples, which confirms the SSA data. The distribution of these pores (Figure 5) is centered on approximately 20 nm, and it tapers off towards larger pore diameters. In both the R1 and R3 samples with W/B ratios of 0.95, there is a notable lack of peaks in the distribution, which indicates that the majority of their pore networks are situated on larger scales. The peak at 4 nm, which is present in all of the samples, is not taken into account, as it is a common artifact that is attributable to the forced closure of the hysteresis loop in the sorption isotherm at a partial pressure of 0.42 [39].
The porosities that were calculated from the MIP data, which cover a wider range of pore sizes (from 0.07 to 400 µm), are similar to those that were determined by the water saturation (Table 4), with values ranging from 36 to 67 wt.%. Interestingly, there is no direct link between the porosity and the W/B ratio. The pore size distribution of the MIP data does show significant variation, with the modal pore diameter increasing with the W/B ratio (Figure 6). Moreover, the modal diameters of the R1 samples (185 to 755 nm) are significantly higher than the modal diameters of the R3 samples (21 to 104 nm).
Lastly, the SEM images (Figure 7) of the surfaces of the freshly broken samples show significant differences between the R1 and R3 samples. In the case of the R1 sample, the microstructure seems rather coarse, with µm-sized particles that stick together. By contrast, the R3 sample features a more cohesive microstructure. This could be an indication that, in the R3 sample, the degree of geopolymerization is higher than in the R1 sample, which results in the NASH gel effectively binding together the unreacted metakaolin precursor and the aggregate. The lower degree of geopolymerization in the R1 samples means that less NASH gel is available to bind the other phases, which results in a coarser microstructure. In both the R1 and R3 samples, the majority of the pores seem to be constrained to the sub 2 µm range, which agrees with the MIP data.

4. Discussion

4.1. Factors Influencing the Mechanical Strength

The geopolymers that were synthesized for this study were targeted to meet the acceptable mechanical strengths for waste immobilization, while being able to accommodate a high amount of water. As was mentioned earlier, most studies are not concerned with the challenge of acquiring such high W/B or S/L ratios, and, therefore, they design their materials around the molar proportions that are known to produce high performances at lower W/B ratios. Therefore, it is unsurprising that, when the compressive strength is compared to the W/B ratio (Figure 8a), the optimal values are found around a ratio of 0.4 to 0.5, with the strengths rapidly decreasing towards higher ratios. The R1 and R2 samples follow the general trend, with negligible strengths at the W/B ratios above 0.8. The decreasing trend can, at least partially, be attributed to the dilution of the activating solution, as is shown by the similar downward trend in the H2O/Na2O ratio (Figure 8b). The increased mechanical strengths of the R3 samples can also be attributed to the lower H2O/Na2O ratios, with the positive offset (compared to the data of Ghanbari, et al. [40]) explained by the difference between the paste and the mortar. There could also be influences of the other parameters, such as the SiO2/Al2O3 and Na2O/Al2O3 ratios, but there is no immediately discernable relation to the compressive strength.
Nevertheless, to elucidate the most influential parameters in determining the mechanical strength, all of the data, both from this study and from the literature, can be used as inputs in a principal component analysis. The biplot (Figure 9) shows that the majority of the variation can be attributed to the compressive strength and to the H2O/Na2O ratio, with which it is negatively correlated. The remainder of the variation can mainly be attributed to the H2O/Al2O3 ratio and, to a lesser extent, to the SiO2/Al2O3 and Na2O/Al2O3 ratios. As with the H2O/Na2O ratio, the importance of the H2O/Al2O3 ratio is related to the dilution of the precursor in a system where water becomes more important.
Given these results, achieving acceptable mechanical strengths for geopolymers with high W/B ratios is possible given the right adjustment of H2O/Na2O and H2O/Al2O3. As the amount of water is fixed by design, the variable to control the strength would be Na2O/Al2O3. The literature data can be used as input in a partial least squares model to predict the compressive strength. This type of model is especially effective in the case of multicollinearity among the predictors, which is the case with compositional variables [42]. At four used components, the root mean squared error of prediction is high, at 16 MPa, with an explained variance of 70%, which is due to the high variability in the curing conditions. Nevertheless, general trends on the basis of this model can be inferred. If a set of simulated geopolymer compositions is given as input to the model (Figure 10), the negative relationship between the W/B ratio and the compressive strength is confirmed, in addition to the confirmation of the positive effect that the Na2O/Al2O3 ratio has on the compressive strength. The offset between the modeled compressive strength and the measured strength for the R3 samples can be attributed to the difference between the paste (in the model) and the mortar (in this study) [20].

4.2. Conceptual Model for the Development of Mechanical and Microstructural Properties

The geopolymerization process has been studied in detail by a variety of authors over the past few years. In brief, an alkaline solution attacks the aluminosilicate structure of metakaolin to produce silicate and aluminate species in the solution. These dissolved species can then combine into aluminosilicate oligomers, which will start forming a gel once the concentration of dissolved aluminate is high enough to destabilize the dissolved silicate species. This process (gel formation with ongoing dissolution) proceeds until the reacting slurry solidifies [1]. The observations in the current study can be tied in with this process to explain the variations in the microstructural and mineralogical properties, which dictate the mechanical strength.
As was discussed previously, the composition of the activating solution is important, as its concentration determines the extent to which the precursor is dissolved, and its silicate content can influence the formation of oligomers. While multiple studies stress the importance of the molarity of NaOH to dissolving the aluminosilicate framework [43,44,45], the lack of difference in the mechanical strengths between the R1 and R2 samples, which were prepared using 5 M and 10 M NaOH, respectively, indicates that this is just one parameter to be considered. In systems with high-water contents, the activating solution becomes diluted to such an extent that it is the H2O/Na2O ratio (and, to a lesser extent, the H2O/Al2O3 ratio), instead, that determines the mechanical strength. An increase in the H2O/Na2O ratio results in a decrease in the pH of the activating solution, as less hydroxide ions are present per volume of water. This, in turn, reduces the extent to which the framework of the precursor can be dissolved and broken down into dissolved species, which can take part in the gel formation. The reduction of this ratio in R3, compared to R2 and R1, explains the higher conversion of the metakaolin precursor into the geopolymer gel, as was observed by FTIR, and the more cohesive microstructure, as was observed by SEM in the R3 samples. The influence of the H2O/Na2O ratio explains the consistent inverse dependence of the mechanical strength on the W/B ratio, in both the current study and the literature.
While the dilution has a significant effect on the mineralogy and the mechanical strength, it cannot directly explain some of the microstructural observations. On the one hand, the total pore volume, as determined by both MIP and water saturation, does not vary significantly between recipes. On the other hand, the MIP data (Figure 6) shows a significant shift in the modal pore size towards smaller pores in R3, compared to R1. This apparent contradiction can be attributed to the difference in the SiO2/Al2O3 ratio of both recipes. In low-SiO2/Al2O3 (<2.8) systems, soluble silicate species are typically instable, which allows for a greater degree of gel reorganization and densification. This results in a dense microstructure with large and interconnected pores. Conversely, in high-SiO2/Al2O3 (>3.3) systems, the dissolved silicate species are more stable, which results in homogeneous microstructures with smaller pores [46]. This explains why, while both R1 and R3 have similar porosities, the modal pore sizes in the nanometer range of the R3 samples (SiO2/Al2O3 = 3.8) are smaller than those of the R3 sample (SiO2/Al2O3 = 2.8). It is to be expected that the R1 samples exhibit higher numbers of large pores that are visible at a scale that is suited for microscopy, although this could not be quantitatively verified, as the low strength of these samples prevents polishing. The surface SEM measurements (Figure 7) do reveal that the microstructures of the R1 samples are less cohesive than those of the R3 samples. An additional indication is the specific surface areas, as determined by nitrogen physisorption (Table 5), which are significantly higher in the R3 compared to the R1 samples.

5. Conclusions

The goals of this study were to design metakaolin-based geopolymers with acceptable mechanical strengths at high W/B ratios, and to investigate the main parameters that influence the strength development. While the molarity of the activator is often cited as a positive influence on the mechanical strength, we have shown that this view can be extended to an effect of the concentration and dilution, which is especially relevant in systems with high-water contents. While the parameters that govern the dilution (H2O/Na2O and H2O/Al2O3) play significant roles in the determination of the microstructure and the mechanical strength, the former is also influenced by the SiO2/Al2O3 ratio, with higher ratios resulting in more homogeneous microstructures with smaller pores, which is desirable with respect to the reduction in the transport properties in the context of radioactive waste immobilization (e.g., diffusion [47] and permeability [48]).
As a general recommendation for geopolymers with high-water contents, good mechanical strengths and homogeneous microstructures can be achieved by limiting the H2O/Na2O ratio to a maximum of 20, and by setting the SiO2/Al2O3 ratio between 3.3 and 4. To further optimize the strength of high-W/B-ratio geopolymers, full factorial studies can be carried out in future research.

Author Contributions

Conceptualization, Q.T.P., L.F. and T.N.N.; methodology, Q.T.P. and L.F.; formal analysis, L.F. and T.N.N.; investigation, L.F. and T.N.N.; writing—original draft preparation, L.F.; writing—review and editing, Q.T.P. and T.N.N.; project administration, Q.T.P. All authors have read and agreed to the published version of the manuscript.

Funding

This work received funding (in parts) from the Belgian Energy Transition Fund (ASOF project), the IRSN (France), and the European Union’s Horizon 2020 research and innovation program for Nuclear Fission and Radiation Protection Research (Call NFRP-2019-2020), under the grant agreement: No. 945098 (PREDIS).

Institutional Review Board Statement

Not applicable.

Informed Consent Statement

Not applicable.

Data Availability Statement

Not applicable.

Conflicts of Interest

The authors declare no conflict of interest.

References

  1. Provis, J.L.; Van Deventer, J.S. Geopolymers: Structures, Processing, Properties and Industrial Applications; Elsevier: Amsterdam, The Netherlands, 2009. [Google Scholar]
  2. Van Jaarsveld, J.; Van Deventer, J. The effect of metal contaminants on the formation and properties of waste-based geopolymers. Cem. Concr. Res. 1999, 29, 1189–1200. [Google Scholar] [CrossRef]
  3. Davidovits, J.; Comrie, D. Long term durability of hazardous toxic and nuclear waste disposals. Geopolymer 1988, 88, 125–134. [Google Scholar]
  4. Shi, C.; Grattan-Bellew, P.E.; Stegemann, J.A. Conversion of a waste mud into a pozzolanic material. Constr. Build. Mater. 1999, 13, 279–284. [Google Scholar] [CrossRef]
  5. Cantarel, V.; Nouaille, F.; Rooses, A.; Lambertin, D.; Poulesquen, A.; Frizon, F. Solidification/stabilisation of liquid oil waste in metakaolin-based geopolymer. J. Nucl. Mater. 2015, 464, 16–19. [Google Scholar] [CrossRef]
  6. Cantarel, V.; Motooka, T.; Yamagishi, I. Geopolymers and Their Potential Applications in the Nuclear Waste Management Field-A Bibliographical Study. JAEA Rev. 2017. Available online: https://jopss.jaea.go.jp/search/servlet/search?5059195 (accessed on 2 January 2022).
  7. Lahoti, M.; Narang, P.; Tan, K.H.; Yang, E.-H. Mix design factors and strength prediction of metakaolin-based geopolymer. Ceram. Int. 2017, 43, 11433–11441. [Google Scholar] [CrossRef]
  8. Phung, Q.T.; Ferreira, E.; Seetharam, S.; Nguyen, V.T.; Govaerts, J.; Valcke, E. Understanding hydration heat of mortars containing supplementary cementitious materials with potential to immobilize heavy metal containing waste. Cem. Concr. Compos. 2021, 115, 103859. [Google Scholar] [CrossRef]
  9. Vandoorne, T.; Coppens, E. Aanpassingen aan de acceptatiecriteria m.b.t tot de immobilisatiematrix op basis van cement voor heterogeen and homogeen geconditioneerd afval (Amendments to the Acceptance Criteria with Regard to the Cement-Based Immobilization Matrix for Heterogeneous and Homogeneous Conditioned Waste). 2016, p. 22. Available online: https://fanc.fgov.be/nl/system/files/8.recumo-deeldossier-afval.pdf (accessed on 2 January 2022).
  10. Kani, E.N.; Allahverdi, A. Effects of curing time and temperature on strength development of inorganic polymeric binder based on natural pozzolan. J. Mater. Sci. 2009, 44, 3088–3097. [Google Scholar] [CrossRef]
  11. Kim, H.; Kim, Y. Relationship between compressive strength of geo-polymers and pre-curing conditions. Appl. Microsc. 2013, 43, 155–163. [Google Scholar] [CrossRef]
  12. Perera, D.; Uchida, O.; Vance, E.; Finnie, K. Influence of curing schedule on the integrity of geopolymers. J. Mater. Sci. 2007, 42, 3099–3106. [Google Scholar] [CrossRef]
  13. Samal, S.; Blanco, I. An Application Review of Fiber-Reinforced Geopolymer Composite. Fibers 2021, 9, 23. [Google Scholar] [CrossRef]
  14. Samal, S.; Thanh, N.P.; Marvalova, B.; Petrikova, I. Thermal characterization of metakaolin-based geopolymer. Jom 2017, 69, 2480–2484. [Google Scholar] [CrossRef]
  15. Zhang, Y.; Sun, W.; Li, Z. Synthesis and microstructural characterization of fully-reacted potassium-poly (sialate-siloxo) geopolymeric cement matrix. ACI Mater. J. 2008, 105, 156. [Google Scholar]
  16. Provis, J.L.; Van Deventer, J.S. Geopolymerisation kinetics. 1. In situ energy-dispersive X-ray diffractometry. Chem. Eng. Sci. 2007, 62, 2309–2317. [Google Scholar] [CrossRef]
  17. Kong, D.L.; Sanjayan, J.G.; Sagoe-Crentsil, K. Comparative performance of geopolymers made with metakaolin and fly ash after exposure to elevated temperatures. Cem. Concr. Res. 2007, 37, 1583–1589. [Google Scholar] [CrossRef]
  18. Liew, Y.M.; Kamarudin, H.; Al Bakri, A.M.; Bnhussain, M.; Luqman, M.; Nizar, I.K.; Ruzaidi, C.; Heah, C. Optimization of solids-to-liquid and alkali activator ratios of calcined kaolin geopolymeric powder. Constr. Build. Mater. 2012, 37, 440–451. [Google Scholar] [CrossRef]
  19. Lin, K.-L.; Shiu, H.-S.; Shie, J.-L.; Cheng, T.-W.; Hwang, C.-L. Effect of composition on characteristics of thin film transistor liquid crystal display (TFT-LCD) waste glass-metakaolin-based geopolymers. Constr. Build. Mater. 2012, 36, 501–507. [Google Scholar] [CrossRef]
  20. Hou, L.; Li, J.; Lu, Z.-y. Effect of Na/Al on formation, structures and properties of metakaolin based Na-geopolymer. Constr Build Mater 2019, 226, 250–258. [Google Scholar] [CrossRef]
  21. Duxson, P.; Mallicoat, S.W.; Lukey, G.C.; Kriven, W.M.; van Deventer, J.S. The effect of alkali and Si/Al ratio on the development of mechanical properties of metakaolin-based geopolymers. Colloids Surf. A Physicochem. Eng. Asp. 2007, 292, 8–20. [Google Scholar] [CrossRef]
  22. Lahalle, H.; Benavent, V.; Trincal, V.; Wattez, T.; Bucher, R.; Cyr, M. Robustness to water and temperature, and activation energies of metakaolin-based geopolymer and alkali-activated slag binders. Constr. Build. Mater. 2021, 300, 124066. [Google Scholar] [CrossRef]
  23. Wardhono, A. The effect of water binder ratio on strength development of class C fly ash geopolymer mortar prepared by dry geopolymer powder. MATEC Web Conf. 2019, 258, 05032. [Google Scholar]
  24. Wang, H.; Li, H.; Yan, F. Synthesis and mechanical properties of metakaolinite-based geopolymer. Colloids Surf. A Physicochem. Eng. Asp. 2005, 268, 1–6. [Google Scholar] [CrossRef]
  25. Pinto, A. Alkali-Activated Metakaolin Based Binders. Ph.D. Thesis, University of Minho, Braga, Portugal, 2004. [Google Scholar]
  26. Zuhua, Z.; Xiao, Y.; Huajun, Z.; Yue, C. Role of water in the synthesis of calcined kaolin-based geopolymer. Appl. Clay Sci. 2009, 43, 218–223. [Google Scholar] [CrossRef]
  27. Kamalloo, A.; Ganjkhanlou, Y.; Aboutalebi, S.H.; Nouranian, H. Modeling of compressive strength of metakaolin based geopolymers by the use of artificial neural network. Int. J. Eng. 2010, 23, 143–150. [Google Scholar]
  28. Aquino, W.; Lange, D.; Olek, J. The influence of metakaolin and silica fume on the chemistry of alkali–silica reaction products. Cem. Concr. Compos. 2001, 23, 485–493. [Google Scholar] [CrossRef]
  29. Jacops, E.; Phung, Q.T.; Frederickx, L.; Levasseur, S. Diffusive Transport of Dissolved Gases in Potential Concretes for Nuclear Waste Disposal. Sustainability 2021, 13, 10007. [Google Scholar] [CrossRef]
  30. Washburn, E.W. Note on a method of determining the distribution of pore sizes in a porous material. Proc. Natl. Acad. Sci. USA 1921, 7, 115. [Google Scholar] [CrossRef] [Green Version]
  31. Thommes, M.; Kaneko, K.; Neimark, A.V.; Olivier, J.P.; Rodriguez-Reinoso, F.; Rouquerol, J.; Sing, K.S. Physisorption of gases, with special reference to the evaluation of surface area and pore size distribution (IUPAC Technical Report). Pure Appl. Chem. 2015, 87, 1051–1069. [Google Scholar] [CrossRef] [Green Version]
  32. De Boer, J.; Lippens, B.; Linsen, B.; Broekhoff, J.; Van den Heuvel, A.; Osinga, T.J. The t-curve of multimolecular N2-adsorption. J. Colloid Interface Sci. 1966, 21, 405–414. [Google Scholar] [CrossRef]
  33. Brunauer, S.; Emmett, P.H.; Teller, E. Adsorption of gases in multimolecular layers. J. Am. Chem. Soc. 1938, 60, 309–319. [Google Scholar] [CrossRef]
  34. Barrett, E.P.; Joyner, L.G.; Halenda, P.P. The determination of pore volume and area distributions in porous substances. I. Computations from nitrogen isotherms. J. Am. Chem. Soc. 1951, 73, 373–380. [Google Scholar]
  35. Doebelin, N.; Kleeberg, R. Profex: A graphical user interface for the Rietveld refinement program BGMN. J. Appl. Crystallogr. 2015, 48, 1573–1580. [Google Scholar] [CrossRef] [PubMed] [Green Version]
  36. Bernal, S.A.; Provis, J.L.; Brice, D.G.; Kilcullen, A.; Duxson, P.; van Deventer, J.S. Accelerated carbonation testing of alkali-activated binders significantly underestimates service life: The role of pore solution chemistry. Cem. Concr. Res. 2012, 42, 1317–1326. [Google Scholar] [CrossRef]
  37. Zhang, Z.; Wang, H.; Provis, J.L. Quantitative study of the reactivity of fly ash in geopolymerization by FTIR. J. Sustain. Cem. Based Mater. 2012, 1, 154–166. [Google Scholar] [CrossRef] [Green Version]
  38. Rovnaník, P. Effect of curing temperature on the development of hard structure of metakaolin-based geopolymer. Constr. Build. Mater. 2010, 24, 1176–1183. [Google Scholar] [CrossRef]
  39. Bertier, P.; Schweinar, K.; Stanjek, H.; Ghanizadeh, A.; Clarkson, C.; Busch, A.; Kampman, N.; Prinz, D.; Amann-Hildenbrand, A.; Krooss, B. On the use and abuse of N2 physisorption for the characterization of the pore structure of shales. In The Clay Minerals Society Workshop Lectures Series; Clay Mineral Society: Boulder, CO, USA, 2016; pp. 151–161. [Google Scholar]
  40. Ghanbari, M.; Hadian, A.; Nourbakhsh, A.; MacKenzie, K. Modeling and optimization of compressive strength and bulk density of metakaolin-based geopolymer using central composite design: A numerical and experimental study. Ceram. Int. 2017, 43, 324–335. [Google Scholar] [CrossRef]
  41. Duxson, P.; Lukey, G.; Separovic, F.; Van Deventer, J. Effect of alkali cations on aluminum incorporation in geopolymeric gels. Ind. Eng. Chem. Res. 2005, 44, 832–839. [Google Scholar] [CrossRef]
  42. Wold, H. Soft modelling by latent variables: The non-linear iterative partial least squares (NIPALS) approach. J. Appl. Probab. 1975, 12, 117–142. [Google Scholar] [CrossRef]
  43. Zhang, Z.; Wang, H.; Provis, J.L.; Bullen, F.; Reid, A.; Zhu, Y. Quantitative kinetic and structural analysis of geopolymers. Part 1. The activation of metakaolin with sodium hydroxide. Thermochim. Acta 2012, 539, 23–33. [Google Scholar]
  44. Rifaai, Y.; Yahia, A.; Mostafa, A.; Aggoun, S.; Kadri, E.-H. Rheology of fly ash-based geopolymer: Effect of NaOH concentration. Constr. Build. Mater. 2019, 223, 583–594. [Google Scholar] [CrossRef]
  45. Rees, C.A.; Provis, J.L.; Lukey, G.C.; van Deventer, J.S. Attenuated total reflectance fourier transform infrared analysis of fly ash geopolymer gel aging. Langmuir 2007, 23, 8170–8179. [Google Scholar] [CrossRef]
  46. Duxson, P.; Provis, J.L.; Lukey, G.C.; Mallicoat, S.W.; Kriven, W.M.; Van Deventer, J.S. Understanding the relationship between geopolymer composition, microstructure and mechanical properties. Colloids Surf. A Physicochem. Eng. Asp. 2005, 269, 47–58. [Google Scholar] [CrossRef]
  47. Patel, R.A.; Phung, Q.T.; Seetharam, S.C.; Perko, J.; Jacques, D.; Maes, N.; De Schutter, G.; Ye, G.; Van Breugel, K. Diffusivity of saturated ordinary Portland cement-based materials: A critical review of experimental and analytical modelling approaches. Cem. Concr. Res. 2016, 90, 52–72. [Google Scholar] [CrossRef]
  48. Phung, Q.T.; Maes, N.; De Schutter, G.; Jacques, D.; Ye, G. Determination of water permeability of cementitious materials using a controlled constant flow method. Constr. Build. Mater. 2013, 47, 1488–1496. [Google Scholar] [CrossRef]
Figure 1. (a) Flexural strengths of the prisms of each recipe (1, 2, and 3) after 28 days of curing; (b) compressive strengths of the same prisms.
Sustainability 14 03141 g001
Figure 2. XRD patterns of the samples considered in this study. Individual patterns were scaled to allow comparison.
Sustainability 14 03141 g002
Figure 3. FTIR patterns of the samples considered in this study. Individual patterns were scaled to allow comparison.
Sustainability 14 03141 g003
Figure 4. Detailed view of the band associated with the Si–O–T stretching modes in geopolymers. Two characteristic bands, at 1169 and 995 cm−1, are highlighted. The offset of the patterns was eliminated to allow intersample comparison.
Sustainability 14 03141 g004
Figure 5. Porosity curves derived from the desorption isotherms of nitrogen physisorption measurements of R1, R2, and R3 samples.
Sustainability 14 03141 g005
Figure 6. Porosity curves derived from mercury intrusion porosimetry measurements of R1 and R3 samples.
Sustainability 14 03141 g006
Figure 7. SEM images of samples, R1-0.75 and R3-0.75, taken at a magnification of 3000x. Examples of large quartz (Qz) particles and pores (P) are indicated on the image.
Sustainability 14 03141 g007
Figure 8. Comparison of the compressive strengths of literature data [7,27,40,41] and the data collected in the current study to (a) the W/B ratio, and (b) the H2O/Na2O ratio. The general trend in (b) is best described by the curve in blue (formula: y = 480 e 4.6 x ). The shift in the compressive strength between the R3 samples and the R1 and R2 samples is indicated with arrows.
Sustainability 14 03141 g008
Figure 9. Biplot showing the contributions of each variable to the variation in the data, as determined by a principal component analysis.
Sustainability 14 03141 g009
Figure 10. Predictions by partial least squares regression of the compressive strengths of a variety of geopolymer compositions with fixed W/B ratios. The strengths of the Recipe 1 and 3 samples are indicated as a reference.
Sustainability 14 03141 g010
Table 1. Chemical compositions (from the specification sheet) in weight percentages of the metakaolin precursor and the sodium silicate (SS) (solid or liquid) used in the preparation of the activating solution.
SiO2Al2O3Fe2O3CaOTiO2MgONa2OK2OP2O5LOI
Metakaolin52.0844.270.450.031.680.080.260.170.040.83
SS (sol.)54.5 27.5 18
SS (liq.)26.78 8.97 64.25
Table 2. Mix compositions of the samples prepared in this work. Ratios of elements are presented as molar ratios.
RecipeActivatorW/B RatioWater/SolidsSiO2/Al2O3Na2O/SiO2H2O/Na2ONaOH, M
R1NaOH + SS (liq.)0.750.512.750.1726.85
NaOH + SS (liq.)0.850.572.750.1730.45
NaOH + SS (liq.)0.950.622.750.1733.95
R2NaOH + SS (sol.)0.750.432.810.1825.710
NaOH + SS (sol.)0.850.472.810.1829.110
NaOH + SS (sol.)0.950.512.810.1832.510
R3NaOH + SS (sol.)0.750.483.790.2617.010
NaOH + SS (sol.)0.850.523.790.2619.310
NaOH + SS (sol.)0.950.573.790.2621.510
Table 3. Quantitative mineralogical compositions in weight percentages of the samples considered in this study. Abbreviations are as follows: “Amorph” are amorphous phases; “Ana” is anatase; “Fs” is feldspar; and “Qz” is quartz.
AmorphAnaFsQzTrona
R1-0.75760.40.3230
R1-0.85790.40.2200
R1-0.95710.60.8262.0
R2-0.75700.41.7280
R2-0.85750.41.1240
R2-0.95700.41.1280
R3-0.75760.42.1220
R3-0.85690.21.7290
R3-0.95710.22.1260
Table 4. Pore volumes and bulk dry densities as determined by water saturation of the geopolymer samples, and the porosity as determined by mercury intrusion porosimetry.
Pore Volume (%)Bulk Dry Density (kg/m³)Porosity (%, MIP)
R1-0.7545123441
R1-0.8550115953
R1-0.9546105148
R2-0.75441357/
R2-0.85441301/
R2-0.95451287/
R3-0.7543137737
R3-0.8547126336
R3-0.9552113667
Table 5. Results of the N2 physisorption experiments. Specific surface areas (SSAs) were calculated from the adsorption isotherm, while cumulative pore volumes (CPVs) were calculated from the desorption isotherm.
SSA (m²/g, BET)SSA (m²/g, t-plot)Micropore Area (m²/g)CPV (cm³/g)
R1-0.7510.210.80.00.052
R1-0.857.66.70.90.027
R1-0.954.54.50.00.014
R2-0.756.46.20.20.025
R2-0.852.52.10.50.013
R2-0.951.71.30.40.013
R3-0.755.14.60.40.018
R3-0.852.42.40.00.007
R3-0.951.91.90.10.004
Publisher’s Note: MDPI stays neutral with regard to jurisdictional claims in published maps and institutional affiliations.

