
The Coffee Compromise: Is Agricultural Expansion into Tree Plantations a Sustainable Option?

 , ,
, ,  ,
, 
Abstract
:1. Introduction
2. Materials and Methods
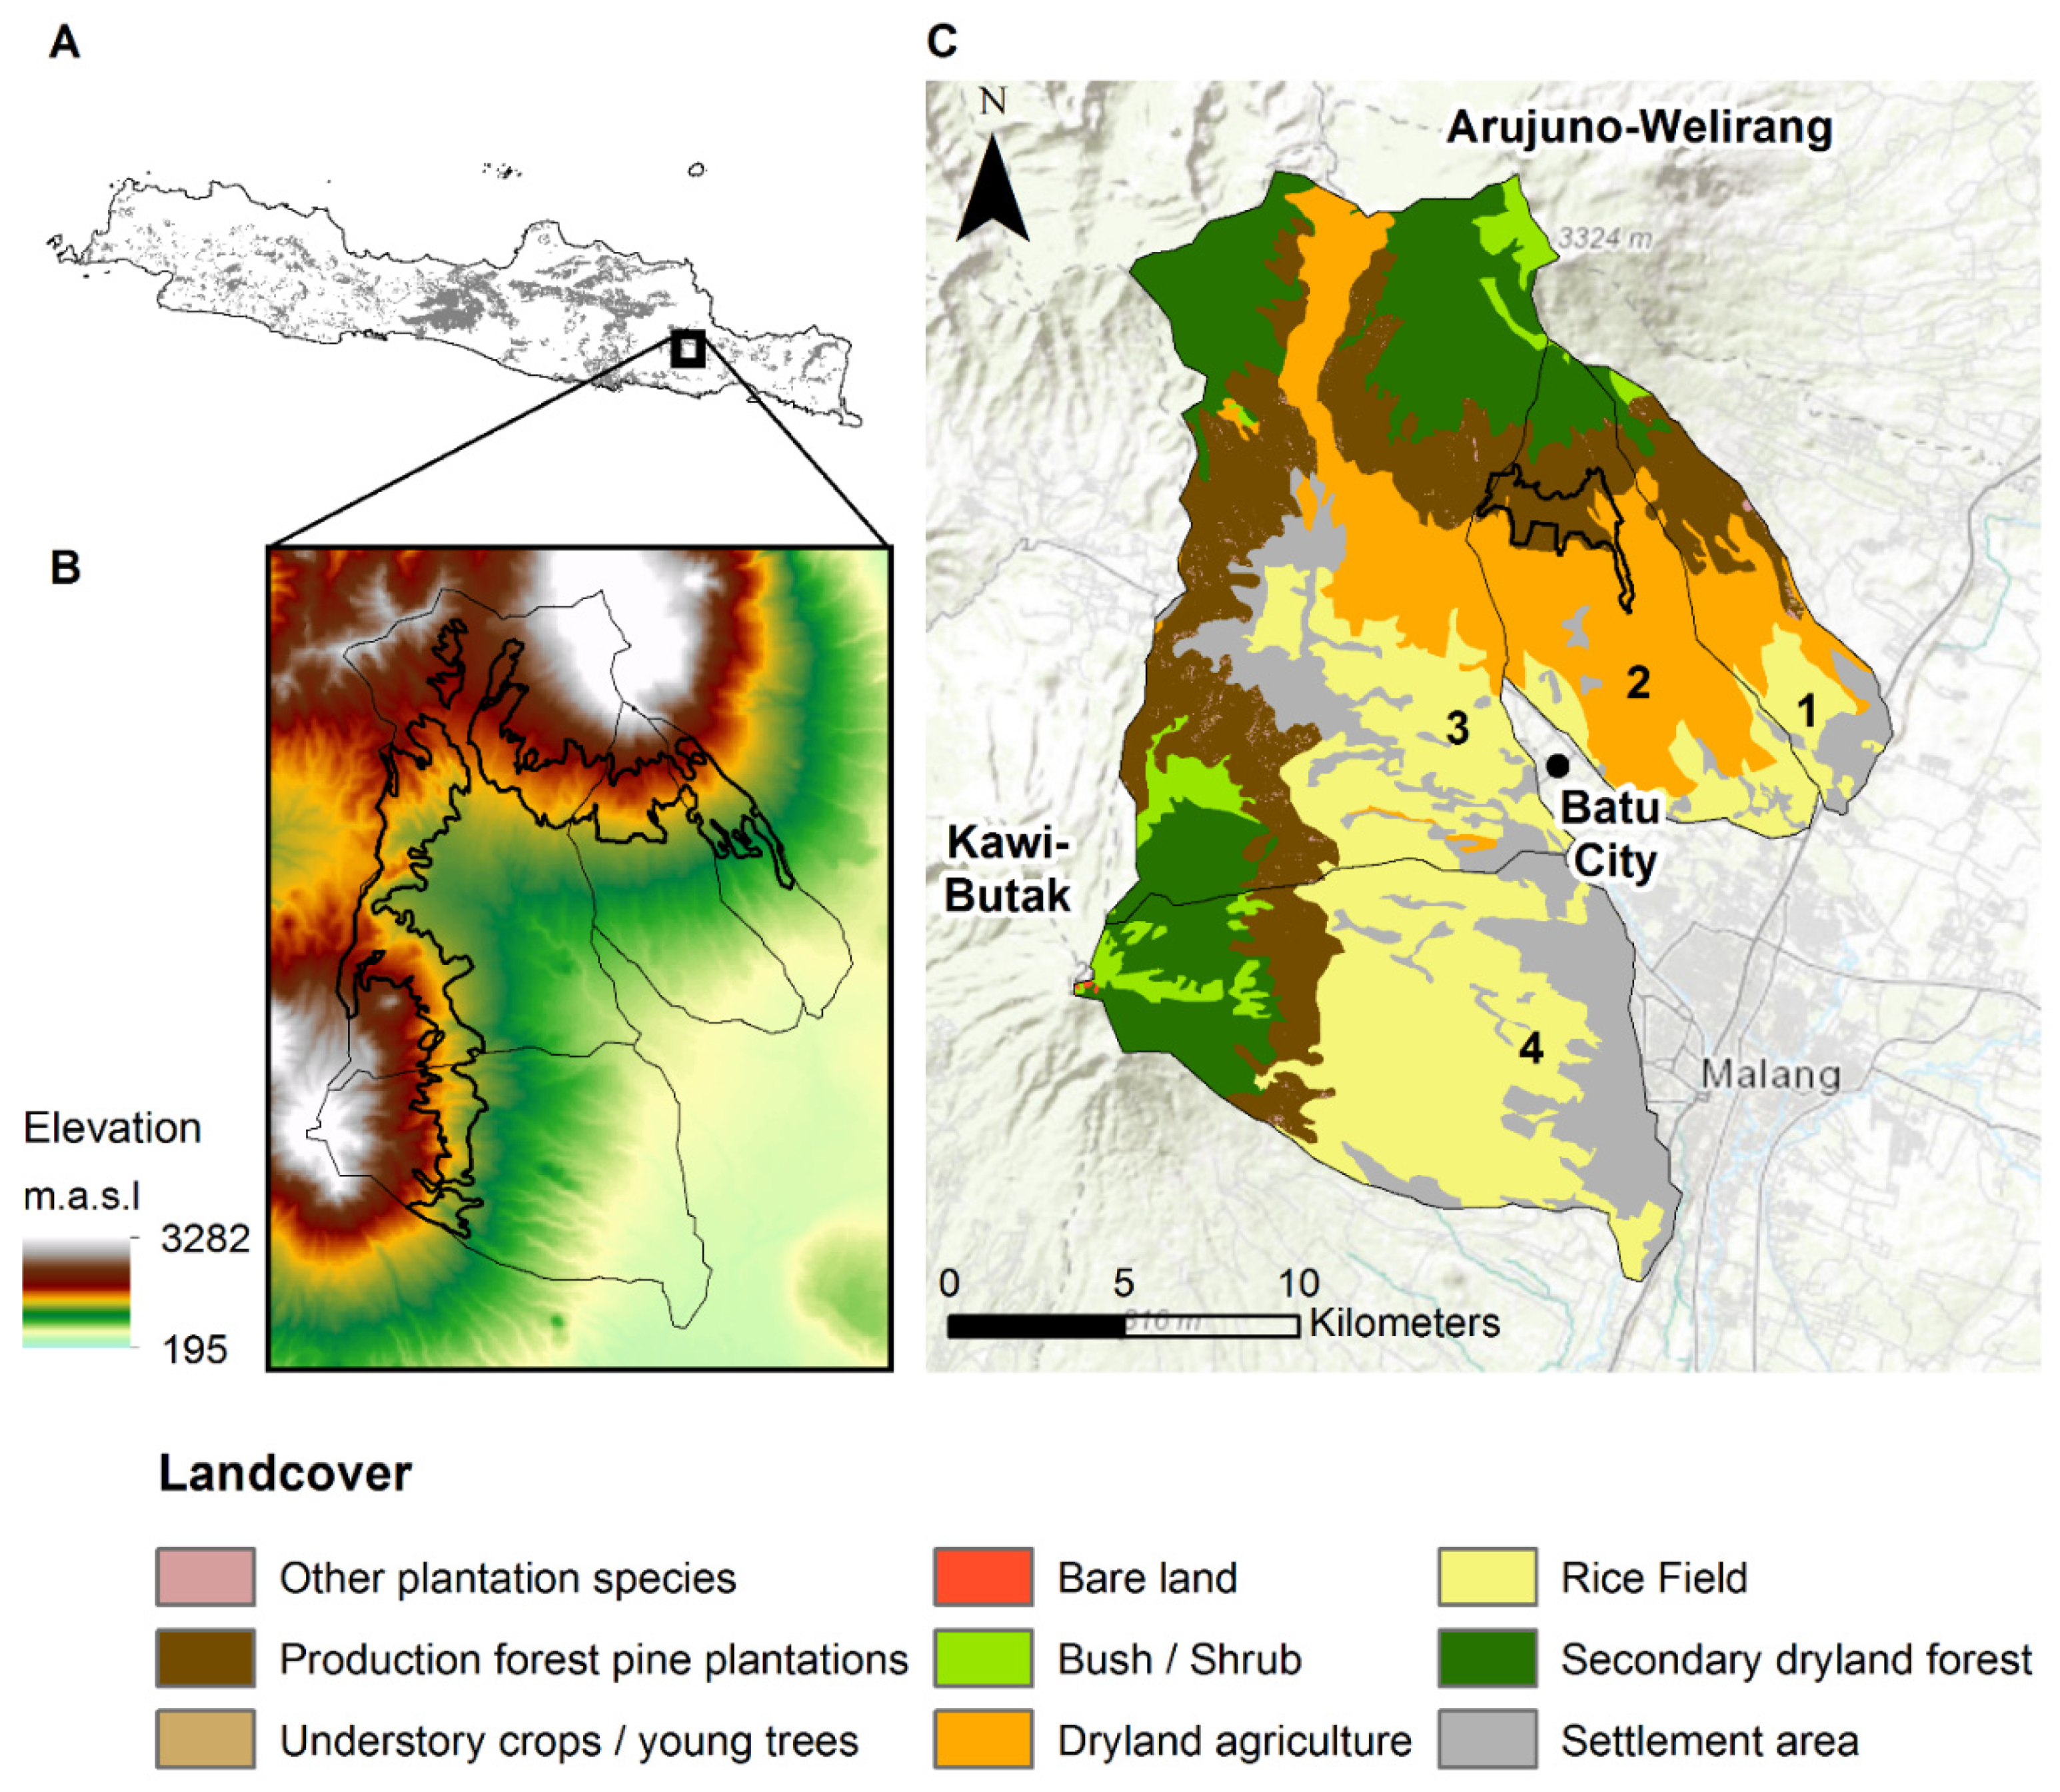
2.1. Study Site
2.2. Scenarios
- Secondary forest (forest)—the most likely natural forest state in the area, given historical disturbance.
- Monoculture pine plantation (pine)—Pinus merkusii with no ground cover vegetation.
- Pine–coffee agroforestry (agroforestry)—Pinus merkusii with coffee (Coffea arabica) as an understory.
- Monoculture sun coffee (coffee)—Arabica coffee (Coffea arabica) with no understory or interplanting.
- Annual crop (crop)—generic root vegetable crop modelled on taro (Colocasia esculenta) and with no interplanting.
2.3. Modelling
2.3.1. Carbon Storage
2.3.2. Nitrogen Retention
2.3.3. Sediment Retention
2.3.4. Water Yield
2.3.5. Products
3. Results
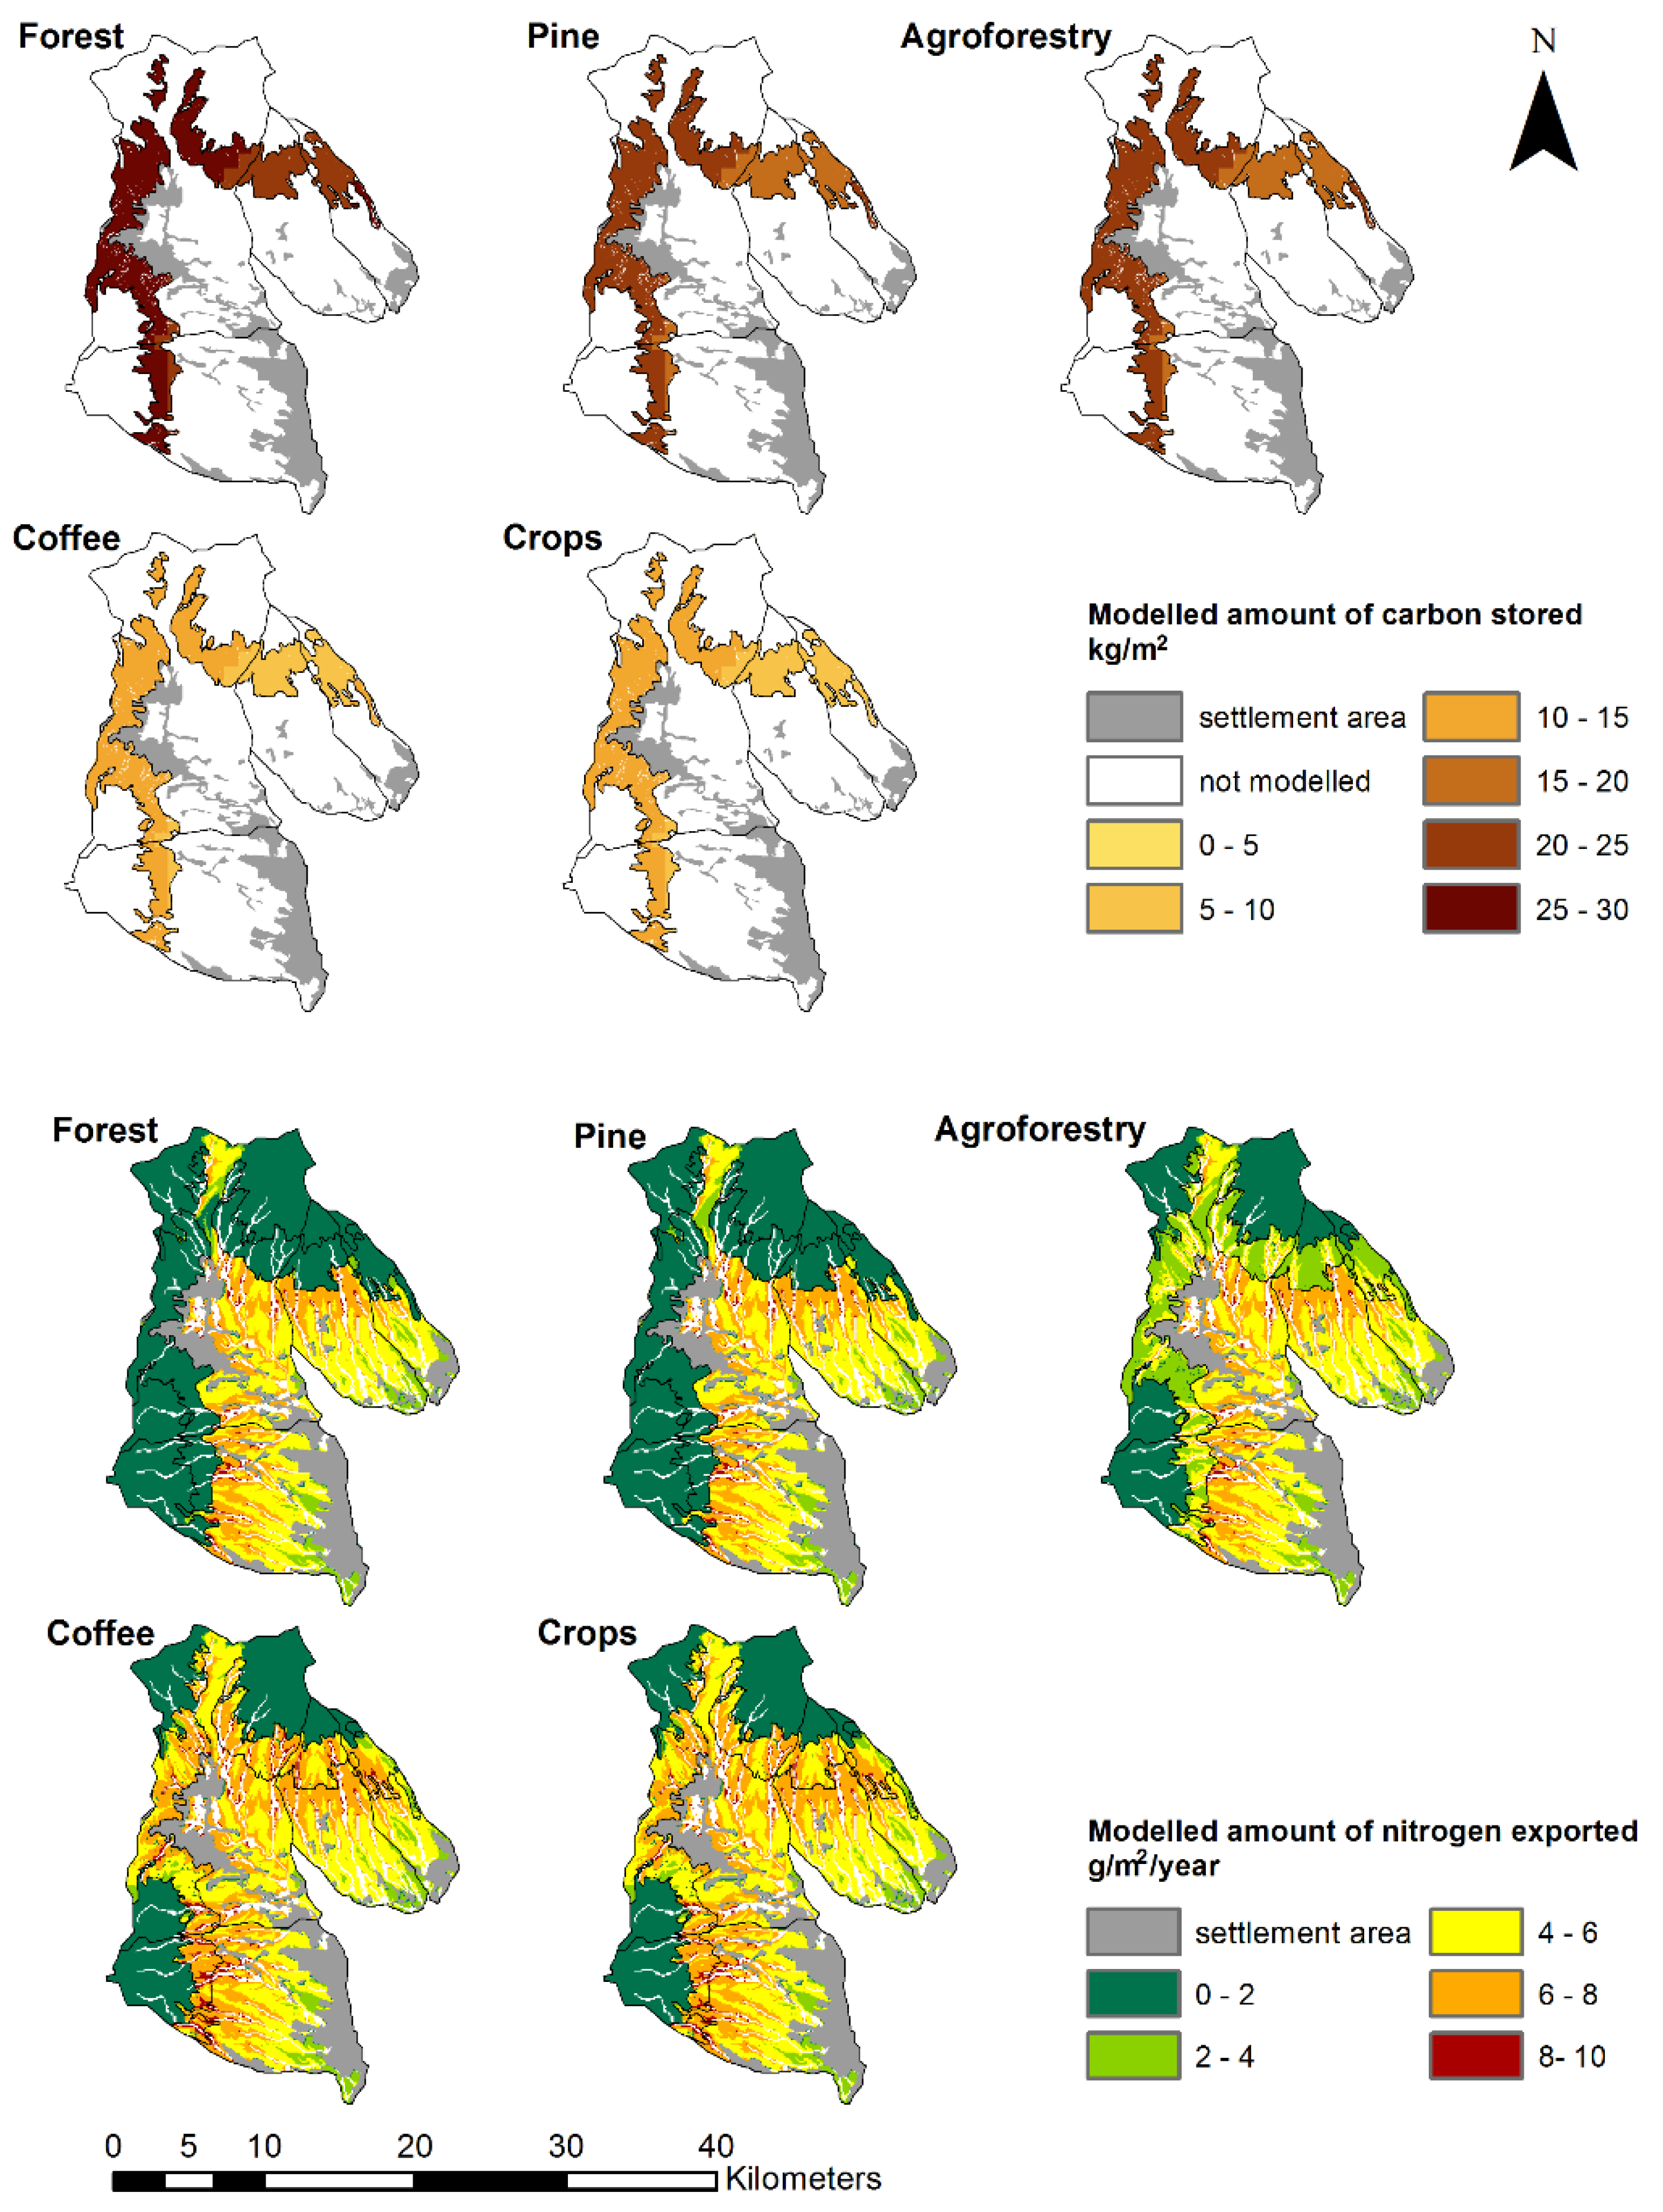
3.1. Carbon Storage
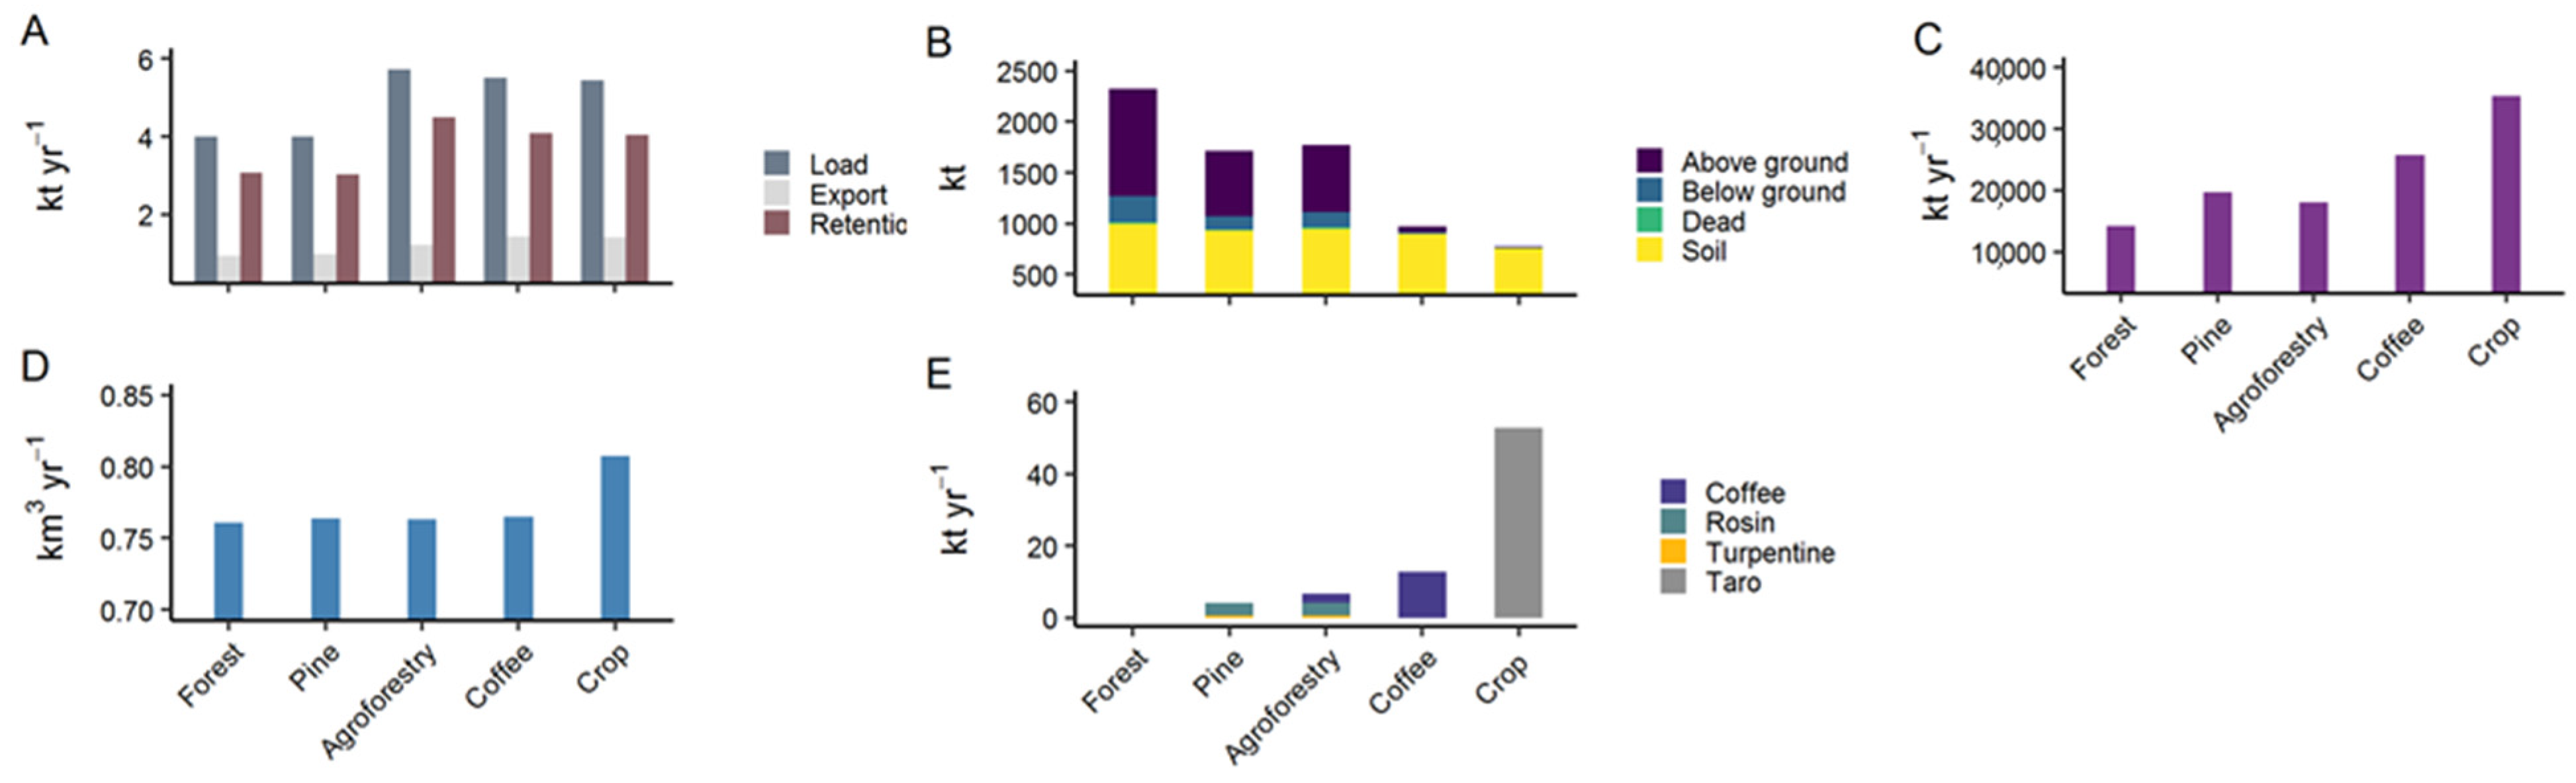
3.2. Nitrogen Retention
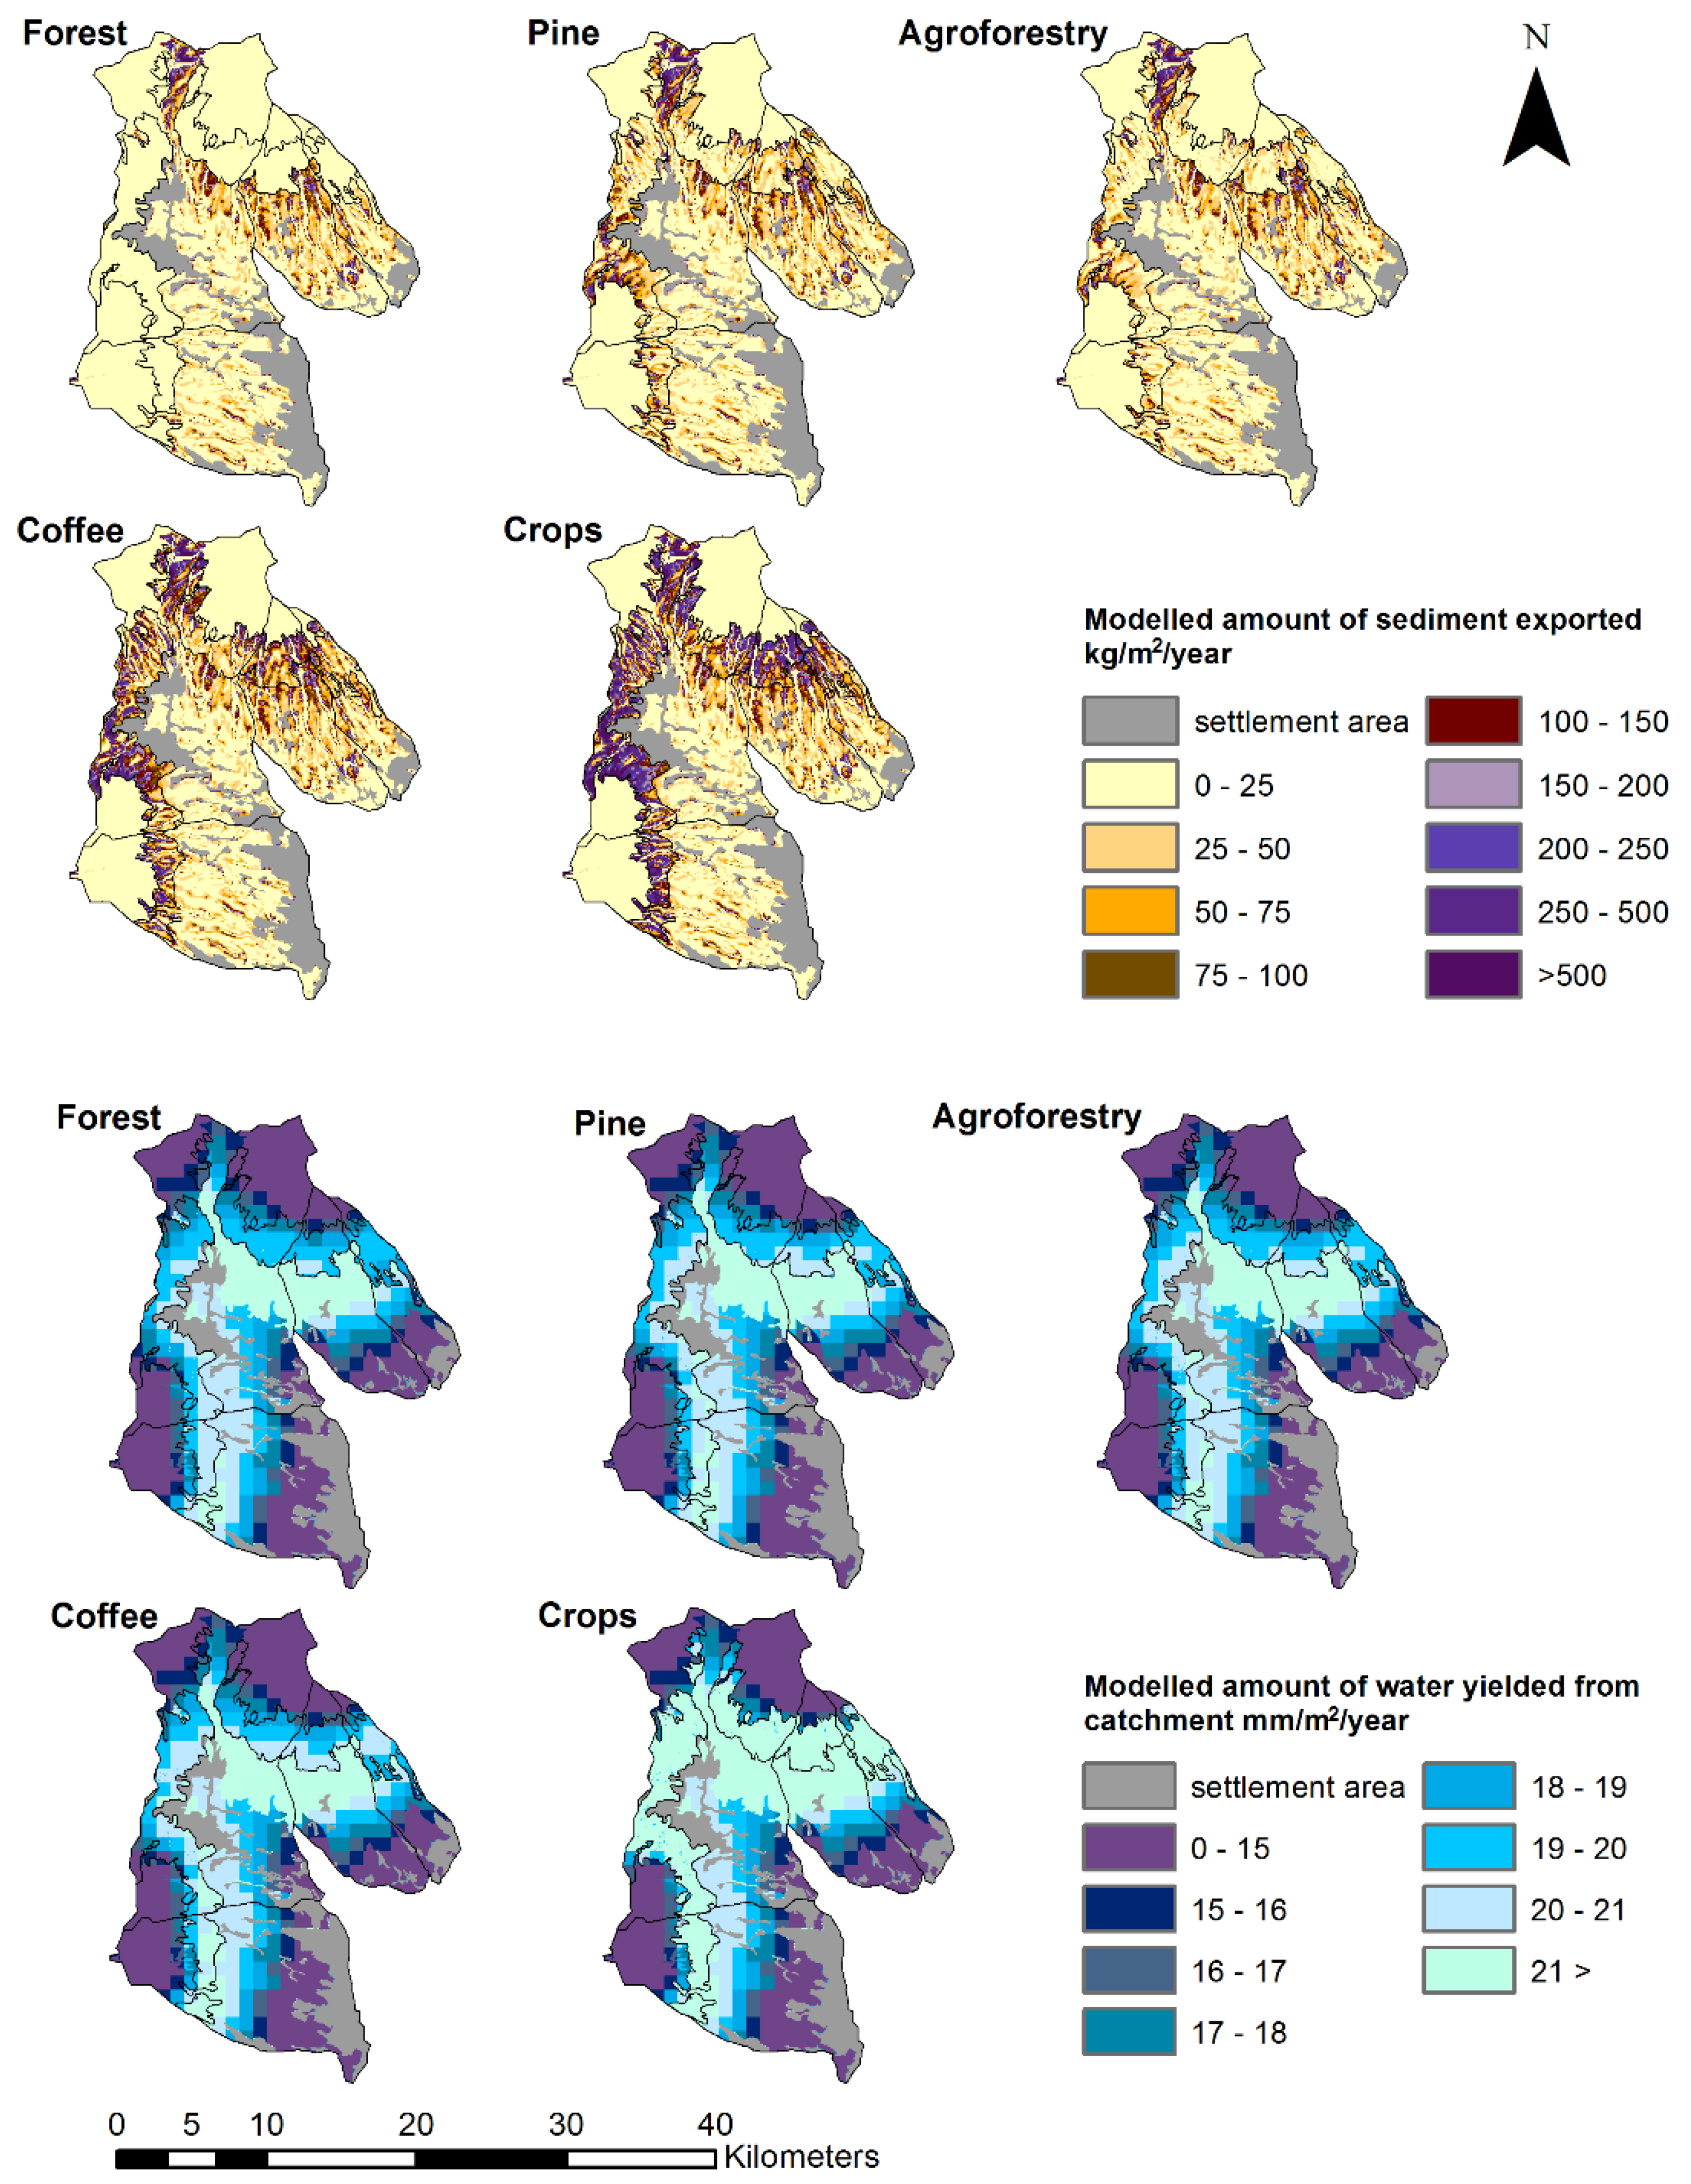
3.3. Sediment Retention
3.4. Water Yield
3.5. Products
3.6. Trade-Offs
4. Discussion
5. Conclusions
Supplementary Materials
Author Contributions
Funding
Institutional Review Board Statement
Informed Consent Statement
Data Availability Statement
Acknowledgments
Conflicts of Interest
References
- Gibbs, H.K.; Ruesch, A.S.; Achard, F.; Clayton, M.K.; Holmgren, P.; Ramankutty, N.; Foley, J.A. Tropical forests were the primary sources of new agricultural land in the 1980s and 1990s. Proc. Natl. Acad. Sci. USA 2010, 107, 16732. [Google Scholar] [CrossRef] [PubMed] [Green Version]
- Carlson, K.M.; Curran, L.M.; Ratnasari, D.; Pittman, A.M.; Soares-Filho, B.S.; Asner, G.P.; Trigg, S.N.; Gaveau, D.A.; Lawrence, D.; Rodrigues, H.O. Committed carbon emissions, deforestation, and community land conversion from oil palm plantation expansion in West Kalimantan, Indonesia. Proc. Natl. Acad. Sci. USA 2012, 109, 7559. [Google Scholar] [CrossRef] [PubMed] [Green Version]
- Ahrends, A.; Hollingsworth, P.M.; Ziegler, A.D.; Fox, J.M.; Chen, H.; Su, Y.; Xu, J. Current trends of rubber plantation expansion may threaten biodiversity and livelihoods. Glob. Environ. Chang. 2015, 34, 48–58. [Google Scholar] [CrossRef]
- Barr, C.; Resosudarmo, I.A.P.; Dermawan, A.; McCarthy, J.F.; Moeliono, M.; Setiono, B. Decentralization of Forest Administration in Indonesia; Center for International Forestry Research (CIFOR): Bogor, Indonesia, 2006. [Google Scholar]
- Margono, B.A.; Turubanova, S.; Zhuravleva, I.; Potapov, P.; Tyukavina, A.; Baccini, A.; Goetz, S.; Hansen, M.C. Mapping and monitoring deforestation and forest degradation in Sumatra (Indonesia) using Landsat time series data sets from 1990 to 2010. Environ. Res. Lett. 2012, 7, 034010. [Google Scholar] [CrossRef]
- Laurance, W.F.; Sayer, J.; Cassman, K.G. Agricultural expansion and its impacts on tropical nature. Trends Ecol. Evol. 2014, 29, 107–116. [Google Scholar] [CrossRef]
- Koh, L.P.; Ghazoul, J. Spatially explicit scenario analysis for reconciling agricultural expansion, forest protection, and carbon conservation in Indonesia. Proc. Natl. Acad. Sci. USA 2010, 107, 11140. [Google Scholar] [CrossRef] [Green Version]
- Lee, J.S.H.; Garcia-Ulloa, J.; Ghazoul, J.; Obidzinski, K.; Koh, L.P. Modelling environmental and socio-economic trade-offs associated with land-sparing and land-sharing approaches to oil palm expansion. J. Appl. Ecol. 2014, 51, 1366–1377. [Google Scholar] [CrossRef] [Green Version]
- Clough, Y.; Krishna, V.V.; Corre, M.D.; Darras, K.; Denmead, L.H.; Meijide, A.; Moser, S.; Musshoff, O.; Steinebach, S.; Veldkamp, E.; et al. Land-use choices follow profitability at the expense of ecological functions in Indonesian smallholder landscapes. Nat. Commun. 2016, 7, 13137. [Google Scholar] [CrossRef]
- Waldron, A.; Garrity, D.; Malhi, Y.; Girardin, C.; Miller, D.C.; Seddon, N. Agroforestry Can Enhance Food Security While Meeting Other Sustainable Development Goals. Trop. Conserv. Sci. 2017, 10, 1940082917720667. [Google Scholar] [CrossRef] [Green Version]
- Rice, R.A. Fruits from shade trees in coffee: How important are they? Agrofor. Syst. 2011, 83, 41–49. [Google Scholar] [CrossRef]
- Jezeer, R.E.; Santos, M.J.; Boot, R.G.A.; Junginger, M.; Verweij, P.A. Effects of shade and input management on economic performance of small-scale Peruvian coffee systems. Agric. Syst. 2018, 162, 179–190. [Google Scholar] [CrossRef]
- Rice, R.A. Agricultural intensification within agroforestry: The case of coffee and wood products. Agric. Ecosyst. Environ. 2008, 128, 212–218. [Google Scholar] [CrossRef]
- Coltri, P.P.; Zullo Junior, J.; Dubreuil, V.; Ramirez, G.M.; Pinto, H.S.; Coral, G.; Lazarim, C.G. Empirical models to predict LAI and aboveground biomass of Coffea arabica under full sun and shaded plantation: A case study of South of Minas Gerais, Brazil. Agrofor. Syst. 2015, 89, 621–636. [Google Scholar] [CrossRef]
- Pumariño, L.; Sileshi, G.W.; Gripenberg, S.; Kaartinen, R.; Barrios, E.; Muchane, M.N.; Midega, C.; Jonsson, M. Effects of agroforestry on pest, disease and weed control: A meta-analysis. Basic Appl. Ecol. 2015, 16, 573–582. [Google Scholar] [CrossRef]
- Jezeer, R.E.; Santos, M.J.; Verweij, P.A.; Boot, R.G.A.; Clough, Y. Benefits for multiple ecosystem services in Peruvian coffee agroforestry systems without reducing yield. Ecosyst. Serv. 2019, 40, 101033. [Google Scholar] [CrossRef]
- Jose, S. Agroforestry for ecosystem services and environmental benefits: An overview. Agrofor. Syst. 2009, 76, 1–10. [Google Scholar] [CrossRef]
- Tscharntke, T.; Clough, Y.; Bhagwat, S.A.; Buchori, D.; Faust, H.; Hertel, D.; Hölscher, D.; Juhrbandt, J.; Kessler, M.; Perfecto, I.; et al. Multifunctional shade-tree management in tropical agroforestry landscapes—A review. J. Appl. Ecol. 2011, 48, 619–629. [Google Scholar] [CrossRef] [Green Version]
- Jain, S.K.; Singh, P. Economic analysis of industrial agroforestry: Poplar (Populus deltoides) in Uttar Pradesh (India). Agrofor. Syst. 2000, 49, 255–273. [Google Scholar] [CrossRef]
- Phimmavong, S.; Maraseni, T.N.; Keenan, R.J.; Cockfield, G. Financial returns from collaborative investment models of Eucalyptus agroforestry plantations in Lao PDR. Land Use Policy 2019, 87, 104060. [Google Scholar] [CrossRef]
- Mercer, D.E.; Frey, G.E.; Cubbage, F.W. Economics of agroforestry. In Handbook of Forest Resource Economics; Routledge: London, UK, 2014; pp. 188–209. [Google Scholar]
- Coe, R.; Sinclair, F.; Barrios, E. Scaling up agroforestry requires research ‘in’ rather than ‘for’ development. Curr. Opin. Environ. Sustain. 2014, 6, 73–77. [Google Scholar] [CrossRef] [Green Version]
- Blaser, W.J.; Oppong, J.; Hart, S.P.; Landolt, J.; Yeboah, E.; Six, J. Climate-smart sustainable agriculture in low-to-intermediate shade agroforests. Nat. Sustain. 2018, 1, 234–239. [Google Scholar] [CrossRef]
- Pirard, R.; Petit, H.; Baral, H. Local impacts of industrial tree plantations: An empirical analysis in Indonesia across plantation types. Land Use Policy 2017, 60, 242–253. [Google Scholar] [CrossRef] [Green Version]
- Cahyono, E.D.; Fairuzzana, S.; Willianto, D.; Pradesti, E.; McNamara, N.P.; Rowe, R.L.; Noordwijk, M.V. Agroforestry Innovation through Planned Farmer Behavior: Trimming in Pine–Coffee Systems. Land 2020, 9, 363. [Google Scholar] [CrossRef]
- Iskandar, B.S.; Iskandar, J.; Partasamita, R.; Alfian, R.L. Planting coffee and take care of forest: A case study on coffee cultivation in the forest carried out among people of Palintang, highland of Bandung, west Java, Indonesia. Biodiversitas J. Biol. Divers. 2018, 19, 2183–2195. [Google Scholar] [CrossRef]
- Rahmanulloh, A.; McDonald, G. Indonesia Coffee Annual Report 2018; USDA: Washington, DC, USA, 2018. [Google Scholar]
- Rahmanulloh, A.; McDonald, G. Indonesia Coffee Annual Report 2019; USDA: Washington, DC, USA, 2019. [Google Scholar]
- Perum Perhutani. Laporan Tahunan; Annual Report 2018; Perhutani: Jakarta, Indonesia, 2018. [Google Scholar]
- Nelson, E.; Mendoza, G.; Regetz, J.; Polasky, S.; Tallis, H.; Cameron, D.; Chan, K.M.A.; Daily, G.C.; Goldstein, J.; Kareiva, P.M.; et al. Modeling multiple ecosystem services, biodiversity conservation, commodity production, and tradeoffs at landscape scales. Front. Ecol. Environ. 2009, 7, 4–11. [Google Scholar] [CrossRef]
- Goldstein, J.H.; Caldarone, G.; Duarte, T.K.; Ennaanay, D.; Hannahs, N.; Mendoza, G.; Polasky, S.; Wolny, S.; Daily, G.C. Integrating ecosystem-service tradeoffs into land-use decisions. Proc. Natl. Acad. Sci. USA 2012, 109, 7565. [Google Scholar] [CrossRef] [Green Version]
- Zheng, H.; Wang, L.; Peng, W.; Zhang, C.; Li, C.; Robinson, B.E.; Wu, X.; Kong, L.; Li, R.; Xiao, Y.; et al. Realizing the values of natural capital for inclusive, sustainable development: Informing China’s new ecological development strategy. Proc. Natl. Acad. Sci. USA 2019, 116, 8623–8628. [Google Scholar] [CrossRef] [Green Version]
- Kay, S.; Crous-Duran, J.; García de Jalón, S.; Graves, A.; Palma, J.H.N.; Roces-Díaz, J.V.; Szerencsits, E.; Weibel, R.; Herzog, F. Landscape-scale modelling of agroforestry ecosystems services in Swiss orchards: A methodological approach. Landsc. Ecol. 2018, 33, 1633–1644. [Google Scholar] [CrossRef] [Green Version]
- Maulidiyah, E.; Anggoro, S.; Suherman, S. Groundwater Conservation in Batu City East Java: An Ecohydrological Approach. Adv. Sci. Lett. 2017, 23, 2299–2301. [Google Scholar] [CrossRef]
- Badan Pusat Statistik. Sensus Penduduk. 2010. Available online: https://sp2010.bps.go.id/index.php/site?id=3579000000&wilayah=Kota-Batu (accessed on 2 January 2020).
- Ministry of Environment and Forestry. Penutupan Lahan. 2015. Available online: http://webgis.dephut.go.id/ArcGIS/rest/services/Penutupan_Lahan_2015/MapServer (accessed on 19 August 2019).
- Sharp, R.; Tallis, H.T.; Ricketts, T.; Guerry, A.D.; Wood, S.A.; Chaplin-Kramer, R.; Nelson, E.; Ennaanay, D.; Wolny, S.; Olwero, N.; et al. InVEST 3.8.1 User’s Guide; The Natural Capital Project, Stanford University: Stanford, CA, USA, 2020. [Google Scholar]
- Sharps, K.; Masante, D.; Thomas, A.; Jackson, B.; Redhead, J.; May, L.; Prosser, H.; Cosby, B.; Emmett, B.; Jones, L. Comparing strengths and weaknesses of three ecosystem services modelling tools in a diverse UK river catchment. Sci. Total Environ. 2017, 584–585, 118–130. [Google Scholar] [CrossRef] [Green Version]
- Chacko, S.; Kurian, J.; Ravichandran, C.; Vairavel, S.M.; Kumar, K. An assessment of water yield ecosystem services in Periyar Tiger Reserve, Southern Western Ghats of India. Geol. Ecol. Landsc. 2019, 5, 32–39. [Google Scholar] [CrossRef] [Green Version]
- Resende, F.M.; Cimon-Morin, J.; Poulin, M.; Meyer, L.; Loyola, R. Consequences of delaying actions for safeguarding ecosystem services in the Brazilian Cerrado. Biol. Conserv. 2019, 234, 90–99. [Google Scholar] [CrossRef]
- Hairiah, K.; Kurniawan, S.; Aini, F.K.; Lestari, N.D.; Lestariningsih, I.D.; Widianto; Zulkarnaen, T.; van Noordwijk, M. Carbon Stock assessment for a forest-to-coffee conversion landscape in Kalikonto Watershed (East Java, Indonesia): Scaling up from plot to landscape level. In Proceedings of the International Conference on Coffee Science (ASIC), Denpasar, Indonesia, 3–8 October 2010. [Google Scholar]
- IPCC. 2006 IPCC Guidelines for National Greenhouse Gas Inventories; National Greenhouse Gas Inventories Programme, Eggleston, H.S., Buendia, L., Miwa, K., Ngara, T., Tanabe, K., Eds.; Institute for the Global Environmental Strategies (IGES): Kanagawa, Japan, 2006; Volume 4. [Google Scholar]
- Hairiah, K.; Rahayu, S. Petunjuk praktis Pengukuran karbon tersimpan di berbagai macam penggunaan lahan. In World Agroforestry Centre–ICRAF; SEA Regional Office, University of Brawijaya: Unibraw, Indonesia, 2007; p. 77. [Google Scholar]
- Hiederer, R.; Kochy, M. Global Soil Organic Carbon Estimates and the Harmonized World Soil Database. In EUR Scientific and Technical Research Series; European Commission Joint Research Centre: Brussels, Belgium, 2012. [Google Scholar]
- Hairiah, K.; van Noordwijk, M.; Sari, R.R.; Saputra, D.D.; Widianto; Suprayogo, D.; Kurniawan, S.; Prayogo, C.; Gusli, S. Soil carbon stocks in Indonesian (agro) forest transitions: Compaction conceals lower carbon concentrations in standard accounting. Agric. Ecosyst. Environ. 2020, 294, 106879. [Google Scholar] [CrossRef]
- FAO. Fertilizer Use by Crop in Indonesia; Food and Agriculture Organization of the United Nation: Rome, Italy, 2005. [Google Scholar]
- Galloway, J.N.; Dentener, F.J.; Capone, D.G.; Boyer, E.W.; Howarth, R.W.; Seitzinger, S.P.; Asner, G.P.; Cleveland, C.C.; Green, P.A.; Holland, E.A.; et al. Nitrogen cycles: Past, present, and future. Biogeochemistry 2004, 70, 153–226. [Google Scholar] [CrossRef]
- Jones, L.; Vieno, M.; Fitch, A.; Carnell, E.; Steadman, C.; Cryle, P.; Holland, M.; Nemitz, E.; Morton, D.; Hall, J.; et al. Urban natural capital accounts: Developing a novel approach to quantify air pollution removal by vegetation. J. Environ. Econ. Policy 2019, 8, 413–428. [Google Scholar] [CrossRef] [Green Version]
- Lehner, B.; Verdin, K.; Jarvis, A. New Global Hydrography Derived from Spaceborne Elevation Data. Eos Trans. Am. Geophys. Union 2008, 89, 93–94. [Google Scholar] [CrossRef]
- Fick, S.E.; Hijmans, R.J. WorldClim 2: New 1-km spatial resolution climate surfaces for global land areas. Int. J. Climatol. 2017, 37, 4302–4315. [Google Scholar] [CrossRef]
- Panagos, P.; Borrelli, P.; Meusburger, K.; Yu, B.; Klik, A.; Jae Lim, K.; Yang, J.E.; Ni, J.; Miao, C.; Chattopadhyay, N.; et al. Global rainfall erosivity assessment based on high-temporal resolution rainfall records. Sci. Rep. 2017, 7, 4175. [Google Scholar] [CrossRef] [Green Version]
- Fischer, G.; Nachtergaele, F.; Prieler, S.; van Velthuizen, H.T.; Verelst, L.; Wiberg, D. Global Agro-Ecological Zones Assessment for Agriculture; IIASA: Laxenburg, Austria; FAO: Rome, Italy, 2008. [Google Scholar]
- Panagos, P.; Borrelli, P.; Meusburger, K.; Alewell, C.; Lugato, E.; Montanarella, L. Estimating the soil erosion cover-management factor at the European scale. Land Use Policy 2015, 48, 38–50. [Google Scholar] [CrossRef]
- Stone, R.P.; Hilborn, D. Universal Soil Loss Equations (USLE), Order No. 12-051 [Factsheet]. Available online: http://www.omafra.gov.on.ca/english/engineer/facts/12-051.htm (accessed on 1 May 2018).
- Zhang, L.; Hickel, K.; Dawes, W.R.; Chiew, F.H.S.; Western, A.W.; Briggs, P.R. A rational function approach for estimating mean annual evapotranspiration. Water Resour. Res. 2004, 40. [Google Scholar] [CrossRef]
- Zomer, R.J.; Trabucco, A.; Bossio, D.A.; Verchot, L.V. Climate change mitigation: A spatial analysis of global land suitability for clean development mechanism afforestation and reforestation. Agric. Ecosyst. Environ. 2008, 126, 67–80. [Google Scholar] [CrossRef]
- Zhu, X.; Liu, W.; Chen, J.; Bruijnzeel, L.A.; Mao, Z.; Yang, X.; Cardinael, R.; Meng, F.-R.; Sidle, R.C.; Seitz, S.; et al. Reductions in water, soil and nutrient losses and pesticide pollution in agroforestry practices: A review of evidence and processes. Plant Soil 2020, 453, 45–86. [Google Scholar] [CrossRef]
- Cristiano, P.M.; Campanello, P.I.; Bucci, S.J.; Rodriguez, S.A.; Lezcano, O.A.; Scholz, F.G.; Madanes, N.; Di Francescantonio, D.; Carrasco, L.O.; Zhang, Y.-J.; et al. Evapotranspiration of subtropical forests and tree plantations: A comparative analysis at different temporal and spatial scales. Agric. For. Meteorol. 2015, 203, 96–106. [Google Scholar] [CrossRef]
- Donohue, R.J.; Roderick, M.L.; McVicar, T.R. Roots, storms and soil pores: Incorporating key ecohydrological processes into Budyko’s hydrological model. J. Hydrol. 2012, 436–437, 35–50. [Google Scholar] [CrossRef]
- Redhead, J.W.; Stratford, C.; Sharps, K.; Jones, L.; Ziv, G.; Clarke, D.; Oliver, T.H.; Bullock, J.M. Empirical validation of the InVEST water yield ecosystem service model at a national scale. Sci. Total Environ. 2016, 569–570, 1418–1426. [Google Scholar] [CrossRef] [Green Version]
- Suprayogo, D.; Azmi, E.N.; Ariesta, D.A.; Sutejo, Y.A.; Hakim, A.L.; Prayogo, C.; McNamara, N.P. Tree and plant interactions in the agroforestry system: Does the management of coffee intensification disrupt the soil hydrological system and pine growth? IOP Conf. Ser. Earth Environ. Sci. 2020, 449, 012045. [Google Scholar] [CrossRef] [Green Version]
- Fardiansyah, I.; Wicaksono, K.P. Growth and Production Response of Coffee Plants (Coffea arabica) at Different Levels of Cultivation Management in Agroforestry Systems. J. Prod. Tanam. 2019, 7, 2053–2060. [Google Scholar]
- Perum Perhutani. Statistik Tahun 2014–2018; Perum Perhutani: Jakarta, Indonesia, 2019. [Google Scholar]
- FAO FAOSTAT Online Statistical Service. Available online: http://www.fao.org/faostat/en/#home (accessed on 1 May 2018).
- Guillaume, T.; Kotowska, M.M.; Hertel, D.; Knohl, A.; Krashevska, V.; Murtilaksono, K.; Scheu, S.; Kuzyakov, Y. Carbon costs and benefits of Indonesian rainforest conversion to plantations. Nat. Commun. 2018, 9, 2388. [Google Scholar] [CrossRef]
- David, M.B.; Drinkwater, L.E.; McIsaac, G.F. Sources of Nitrate Yields in the Mississippi River Basin. J. Environ. Qual. 2010, 39, 1657–1667. [Google Scholar] [CrossRef]
- Debernardi, L.; De Luca, D.A.; Lasagna, M. Correlation between nitrate concentration in groundwater and parameters affecting aquifer intrinsic vulnerability. Environ. Geol. 2008, 55, 539–558. [Google Scholar] [CrossRef]
- Wu, J.; Sun, Z. Evaluation of Shallow Groundwater Contamination and Associated Human Health Risk in an Alluvial Plain Impacted by Agricultural and Industrial Activities, Mid-west China. Expo. Health 2016, 8, 311–329. [Google Scholar] [CrossRef]
- Muchane, M.N.; Sileshi, G.W.; Gripenberg, S.; Jonsson, M.; Pumariño, L.; Barrios, E. Agroforestry boosts soil health in the humid and sub-humid tropics: A meta-analysis. Agric. Ecosyst. Environ. 2020, 295, 106899. [Google Scholar] [CrossRef]
- Borrelli, P.; Robinson, D.A.; Fleischer, L.R.; Lugato, E.; Ballabio, C.; Alewell, C.; Meusburger, K.; Modugno, S.; Schütt, B.; Ferro, V.; et al. An assessment of the global impact of 21st century land use change on soil erosion. Nat. Commun. 2017, 8, 2013. [Google Scholar] [CrossRef] [PubMed] [Green Version]
- Lavigne, F.; Gunnell, Y. Land cover change and abrupt environmental impacts on Javan volcanoes, Indonesia: A long-term perspective on recent events. Reg. Environ. Chang. 2006, 6, 86–100. [Google Scholar] [CrossRef]
- Béliveau, A.; Lucotte, M.; Davidson, R.; Paquet, S.; Mertens, F.; Passos, C.J.; Romana, C.A. Reduction of soil erosion and mercury losses in agroforestry systems compared to forests and cultivated fields in the Brazilian Amazon. J. Environ. Manag. 2017, 203, 522–532. [Google Scholar] [CrossRef] [PubMed]
- Ilstedt, U.; Bargués Tobella, A.; Bazié, H.R.; Bayala, J.; Verbeeten, E.; Nyberg, G.; Sanou, J.; Benegas, L.; Murdiyarso, D.; Laudon, H.; et al. Intermediate tree cover can maximize groundwater recharge in the seasonally dry tropics. Sci. Rep. 2016, 6, 21930. [Google Scholar] [CrossRef]
- Han, D.; Currell, M.J.; Cao, G.; Hall, B. Alterations to groundwater recharge due to anthropogenic landscape change. J. Hydrol. 2017, 554, 545–557. [Google Scholar] [CrossRef]
- Schilling, K.E.; Gassman, P.W.; Kling, C.L.; Campbell, T.; Jha, M.K.; Wolter, C.F.; Arnold, J.G. The potential for agricultural land use change to reduce flood risk in a large watershed. Hydrol. Process. 2014, 28, 3314–3325. [Google Scholar] [CrossRef]
- Lele, S. Watershed services of tropical forests: From hydrology to economic valuation to integrated analysis. Curr. Opin. Environ. Sustain. 2009, 1, 148–155. [Google Scholar] [CrossRef]
- Sulistyaningsih, T. Sulardi, S.; Sunarto, S. Problems in Upper Brantas Watershed Governance: A Case Study in Batu Indonesia. J. Gov. Politics 2017, 8, 383–410. [Google Scholar]
- Cannavo, P.; Sansoulet, J.; Harmand, J.M.; Siles, P.; Dreyer, E.; Vaast, P. Agroforestry associating coffee and Inga densiflora results in complementarity for water uptake and decreases deep drainage in Costa Rica. Agric. Ecosyst. Environ. 2011, 140, 1–13. [Google Scholar] [CrossRef]
- Temani, F.; Bouaziz, A.; Daoui, K.; Wery, J.; Barkaoui, K. Olive agroforestry can improve land productivity even under low water availability in the South Mediterranean. Agric. Ecosyst. Environ. 2021, 307, 107234. [Google Scholar] [CrossRef]
- DaMatta, F.M. Ecophysiological constraints on the production of shaded and unshaded coffee: A review. Field Crop. Res. 2004, 86, 99–114. [Google Scholar] [CrossRef]
- Jha, S.; Bacon, C.M.; Philpott, S.M.; Ernesto Méndez, V.; Läderach, P.; Rice, R.A. Shade Coffee: Update on a Disappearing Refuge for Biodiversity. BioScience 2014, 64, 416–428. [Google Scholar] [CrossRef] [Green Version]
- Steffan-Dewenter, I.; Kessler, M.; Barkmann, J.; Bos, M.M.; Buchori, D.; Erasmi, S.; Faust, H.; Gerold, G.; Glenk, K.; Gradstein, S.R.; et al. Tradeoffs between income, biodiversity, and ecosystem functioning during tropical rainforest conversion and agroforestry intensification. Proc. Natl. Acad. Sci. USA 2007, 104, 4973–4978. [Google Scholar] [CrossRef] [PubMed] [Green Version]
- Soto-Pinto, L.; Perfecto, I.; Castillo-Hernandez, J.; Caballero-Nieto, J. Shade effect on coffee production at the northern Tzeltal zone of the state of Chiapas, Mexico. Agric. Ecosyst. Environ. 2000, 80, 61–69. [Google Scholar] [CrossRef]
- Cerda, R.; Allinne, C.; Gary, C.; Tixier, P.; Harvey, C.A.; Krolczyk, L.; Mathiot, C.; Clément, E.; Aubertot, J.-N.; Avelino, J. Effects of shade, altitude and management on multiple ecosystem services in coffee agroecosystems. Eur. J. Agron. 2017, 82, 308–319. [Google Scholar] [CrossRef]
- Hameed, A.; Hussain, S.A.; Suleria, H.A.R. “Coffee Bean-Related” Agroecological Factors Affecting the Coffee. In Co-Evolution of Secondary Metabolites; Merillon, J.-M., Ramawat, K.G., Eds.; Springer International Publishing: Cham, Switzerland, 2018; pp. 1–67. [Google Scholar]
- Prasetyo, A.R.; Saleh, M.B.; Soedomo, S. Optimization Pine Plantation Forest Management in Kediri FMU Regional Division II East Java. J. Manaj. Hutan Trop. 2017, 23, 171–181. [Google Scholar] [CrossRef]
- Wintgens, J. The coffee plant. In Coffee: Growing, Processing, Sustainable Production; Wintgens, J., Ed.; Wiley-VCH: Weinheim, Germany, 2004. [Google Scholar]
- van Noordwijk, M.; Rahayu, S.; Hairiah, K.; Wulan, Y.C.; Farida, A.; Verbist, B. Carbon stock assessment for a forest-to-coffee conversion landscape in Sumber-Jaya (Lampung, Indonesia): From allometric equations to land use change analysis. Sci. China 2002, 45, 75–86. [Google Scholar]
- Feliciano, D.; Ledo, A.; Hillier, J.; Nayak, D.R. Which agroforestry options give the greatest soil and above ground carbon benefits in different world regions? Agric. Ecosyst. Environ. 2018, 254, 117–129. [Google Scholar] [CrossRef]
- Lin, B.B.; Perfecto, I.; Vandermeer, J. Synergies between Agricultural Intensification and Climate Change Could Create Surprising Vulnerabilities for Crops. BioScience 2008, 58, 847–854. [Google Scholar] [CrossRef] [Green Version]
- Bunn, C.; Läderach, P.; Ovalle Rivera, O.; Kirschke, D. A bitter cup: Climate change profile of global production of Arabica and Robusta coffee. Clim. Chang. 2015, 129, 89–101. [Google Scholar] [CrossRef] [Green Version]
- Schroth, G.; Läderach, P.; Blackburn Cuero, D.S.; Neilson, J.; Bunn, C. Winner or loser of climate change? A modeling study of current and future climatic suitability of Arabica coffee in Indonesia. Reg. Environ. Chang. 2015, 15, 1473–1482. [Google Scholar] [CrossRef] [Green Version]
- Ovalle-Rivera, O.; Läderach, P.; Bunn, C.; Obersteiner, M.; Schroth, G. Projected Shifts in Coffea arabica Suitability among Major Global Producing Regions Due to Climate Change. PLoS ONE 2015, 10, e0124155. [Google Scholar] [CrossRef] [Green Version]
- Hombegowda, H.C.; Köhler, M.; Röll, A.; Hölscher, D. Tree species and size influence soil water partitioning in coffee agroforestry. Agrofor. Syst. 2020, 94, 137–149. [Google Scholar] [CrossRef]
- Warren-Thomas, E.; Nelson, L.; Juthong, W.; Bumrungsri, S.; Brattström, O.; Stroesser, L.; Chambon, B.; Penot, É.; Tongkaemkaew, U.; Edwards, D.P.; et al. Rubber agroforestry in Thailand provides some biodiversity benefits without reducing yields. J. Appl. Ecol. 2020, 57, 17–30. [Google Scholar] [CrossRef]
- Fay, C.; Sirait, M.; Kusworo, M. Getting the Boundaries Right: Indonesia’s Urgent Need to Redefine its Forests Estate; World Agroforestry Center: Bogor, Indonesia, 2000. [Google Scholar]
- Vermeulen, S.; Cotula, L. Over the heads of local people: Consultation, consent, and recompense in large-scale land deals for biofuels projects in Africa. J. Peasant Stud. 2010, 37, 899–916. [Google Scholar] [CrossRef]
- Malkamäki, A.; D’Amato, D.; Hogarth, N.J.; Kanninen, M.; Pirard, R.; Toppinen, A.; Zhou, W. A systematic review of the socio-economic impacts of large-scale tree plantations, worldwide. Glob. Environ. Change 2018, 53, 90–103. [Google Scholar] [CrossRef]
- Calvet-Mir, L.; Corbera, E.; Martin, A.; Fisher, J.; Gross-Camp, N. Payments for ecosystem services in the tropics: A closer look at effectiveness and equity. Curr. Opin. Environ. Sustain. 2015, 14, 150–162. [Google Scholar] [CrossRef] [Green Version]
- Suich, H.; Lugina, M.; Muttaqin, M.Z.; Alviya, I.; Sari, G.K. Payments for ecosystem services in Indonesia. Oryx 2016, 51, 489–497. [Google Scholar] [CrossRef] [Green Version]
- Ministry of Forestry. Rencana Strategis 2010–2014 Kementerian Kehutanan; Jakarta: Kementerian Luar Negeri Republik Indonesia; Ministry of Forestry: Jakarta, Indonesia, 2010.
- The World Bank. World Bank Approves $22 Million Grant to Help Forest Communities in Indonesia. Available online: https://www.worldbank.org/en/news/press-release/2016/05/27/world-bank-approves-22-million-grant-to-help-forest-communities-in-indonesia (accessed on 5 August 2020).
- Himawan, H. Community Forestry: Key to Solving Current and Emerging Challenges, Second Regional Forum for People and Forests, Bangkok, Thailand, 2011; RECOFTC–The Center for People and Forests: Bangkok, Thailand, 2011. [Google Scholar]
- Byerlee, D. The fall and rise again of plantations in tropical Asia: History repeated? Land 2014, 3, 574–597. [Google Scholar] [CrossRef] [Green Version]
- Payn, T.; Carnus, J.-M.; Freer-Smith, P.; Kimberley, M.; Kollert, W.; Liu, S.; Orazio, C.; Rodriguez, L.; Silva, L.N.; Wingfield, M.J. Changes in planted forests and future global implications. For. Ecol. Manag. 2015, 352, 57–67. [Google Scholar] [CrossRef] [Green Version]
- Santika, T.; Meijaard, E.; Wilson, K.A. Designing multifunctional landscapes for forest conservation. Environ. Res. Lett. 2015, 10, 114012. [Google Scholar] [CrossRef]
- Gaveau, D.L.A.; Sheil, D.; Husnayaen; Salim, M.A.; Arjasakusuma, S.; Ancrenaz, M.; Pacheco, P.; Meijaard, E. Rapid conversions and avoided deforestation: Examining four decades of industrial plantation expansion in Borneo. Sci. Rep. 2016, 6, 32017. [Google Scholar] [CrossRef]
- Myers, R.; Ardiansyah, F. Who Holds Power in Land-use Decisions? Implications for REDD+ in Indonesia; Center for International Forestry Research (CIFOR): Bogor, Indonesia, 2014. [Google Scholar]
- Uryu, Y.; Mott, C.; Foead, N.; Yulianto, K.; Budiman, A.; Setiabudi; Takakai, F.; Nursamsu.; Sunarto.; Purastuti, E.; et al. Deforestation, Forest Degradation, Biodiversity Loss and CO2 Emissions in Riau, Sumatra, Indonesia; WWF Indonesia: Jakarta, Indonesia, 2008. [Google Scholar]
- Miyakuni, K.; Heriyanto, N.M.; Heriansyah, I.; lmanuddin, R.; Kiyono, Y. Allometric equations and parameters for estimating the biomass of planted Pinus merkusii Jungh. et de Vr. forests. Jpn. J. Environ. 2005, 47, 95–104. [Google Scholar]
- Yulistyarini, T.; Sofiah, S. Valuing quality of vegetation in recharge area of Seruk Spring, Pesanggrahan Valley, Batu City, East Java. Biodiversitas J. Biol. Divers. 2011, 12, 229–234. [Google Scholar] [CrossRef]
- Allen, R.G.; Pereira, L.S.; Raes, D.; Smith, M. Crop Evapotranspiration—Guidelines for Computing Crop Water Requirements; FAO—Food and Agriculture Organization of the United Nations: Rome, Italy, 1998. [Google Scholar]
- Defrenet, E.; Roupsard, O.; Van den Meersche, K.; Charbonnier, F.; Pastor Perez-Molina, J.; Khac, E.; Prieto, I.; Stokes, A.; Roumet, C.; Rapidel, B.; et al. Root biomass, turnover and net primary productivity of a coffee agroforestry system in Costa Rica: Effects of soil depth, shade trees, distance to row and coffee age. Ann. Bot. 2016, 118, 833–851. [Google Scholar] [CrossRef] [Green Version]
- Tumuhimbise, R. Plant Spacing and Planting Depth Effects on Corm Yield of Taro (Colocasia esculenta (L.) Schott). J. Crop Improv. 2015, 29, 747–757. [Google Scholar] [CrossRef]


Publisher’s Note: MDPI stays neutral with regard to jurisdictional claims in published maps and institutional affiliations. |
© 2022 by the authors. Licensee MDPI, Basel, Switzerland. This article is an open access article distributed under the terms and conditions of the Creative Commons Attribution (CC BY) license (https://creativecommons.org/licenses/by/4.0/).
Share and Cite
Fitch, A.; Rowe, R.L.; McNamara, N.P.; Prayogo, C.; Ishaq, R.M.; Prasetyo, R.D.; Mitchell, Z.; Oakley, S.; Jones, L. The Coffee Compromise: Is Agricultural Expansion into Tree Plantations a Sustainable Option? Sustainability 2022, 14, 3019. https://doi.org/10.3390/su14053019
Fitch A, Rowe RL, McNamara NP, Prayogo C, Ishaq RM, Prasetyo RD, Mitchell Z, Oakley S, Jones L. The Coffee Compromise: Is Agricultural Expansion into Tree Plantations a Sustainable Option? Sustainability. 2022; 14(5):3019. https://doi.org/10.3390/su14053019
Chicago/Turabian StyleFitch, Alice, Rebecca L. Rowe, Niall P. McNamara, Cahyo Prayogo, Rizky Maulana Ishaq, Rizki Dwi Prasetyo, Zak Mitchell, Simon Oakley, and Laurence Jones. 2022. "The Coffee Compromise: Is Agricultural Expansion into Tree Plantations a Sustainable Option?" Sustainability 14, no. 5: 3019. https://doi.org/10.3390/su14053019
APA StyleFitch, A., Rowe, R. L., McNamara, N. P., Prayogo, C., Ishaq, R. M., Prasetyo, R. D., Mitchell, Z., Oakley, S., & Jones, L. (2022). The Coffee Compromise: Is Agricultural Expansion into Tree Plantations a Sustainable Option? Sustainability, 14(5), 3019. https://doi.org/10.3390/su14053019