Article

Synergistic Effects of Acacia Prunings-Derived Biochar and Nitrogen Application on the Mineral Profile of Maize (Zea mays L.) Grains

1
Department of Agricultural Chemistry and Biochemistry, The University of Agriculture, Peshawar 25130, Pakistan
2
School of Chemical Science, The University of Auckland, Auckland 1142, New Zealand
3
School of Agriculture and Food Sciences, The University of Queensland, St. Lucia, QLD 4072, Australia
4
National Centre of Excellence in Geology, University of Peshawar, Peshawar 25000, Pakistan
5
Institute of Soil and Environmental Sciences, University of Agriculture, Faisalabad 38000, Pakistan
6
Institute for Advanced Study, Shenzhen University, Shenzhen 518060, China
*
Author to whom correspondence should be addressed.
Sustainability 2022, 14(5), 2995; https://doi.org/10.3390/su14052995
Submission received: 17 January 2022 / Revised: 28 February 2022 / Accepted: 1 March 2022 / Published: 4 March 2022
(This article belongs to the Special Issue Biodiversity and Natural Resources Management)

Abstract

:
Despite the proven impact of biochar (BC) on crop yield, little is known about its effect on cereal grain quality. We explored the effect of acacia pruning-derived biochar and nitrogen (N) applications on the mineral profile of maize grains in a field study. Biochar was applied at the rates of 5, 10, 15, and 20 t ha−1 and N at 100, 150, and 200 kg ha−1 along with the control (BC or N not applied) in a split-plot arrangement using a randomized complete block design. At crop maturity, the grains were analyzed for K, P, Ca, Mg, Zn, Fe, and Cu content. The results showed that BC application at the rate of 10 t ha−1 along with N at 200 kg ha−1 resulted in the highest concentrations of K, P, Ca, and Mg in grains. The Fe content was the maximum at the N application rate of 200 kg ha−1 while Zn and Cu had the highest concentration at 150 kg N ha−1 with no BC. It was concluded that the integrated use of BC and N could be a valuable strategy to improve the nutritional quality of maize grains. The enrichment of BC with micronutrients is recommended to achieve the desired concentration of micronutrients in maize grains to help cure malnutrition. However, further investigation is warranted to validate the impact of BC made of different feedstocks on soils of contrasting mineralogy as organo-mineral interactions might mask the true potential of BC.

1. Introduction

Maize (Zea mays L.) is a staple cereal due to its high nutritional value. Maize is rich in phosphorus (P), zinc (Zn), iron (Fe), and various vitamins. After wheat flour, maize flour is the most consumed flour and with lower calories compared to wheat flour [1]. High in proteins and starch with abundant antioxidants, maize flour helps in the prevention of anemia, and cancer [2]. To sustain a healthy life, our body needs many essential minerals, that are sometimes divided into macro-minerals and micro-minerals. Phosphorus (P), potassium (K), calcium (Ca), and magnesium (Mg) are amongst the macro-minerals. The main functions of P are the formation of bones and teeth, maintenance of acid-base balance, and protein formation, while K is needed for proper fluid balance, nerve transmission, and muscle contraction [3,4]. Our body needs Ca to circulate blood, move muscles, and release hormones. The regulation of muscle and nerve functions, blood sugar levels, blood pressure, and protein formation are controlled by Mg [5,6]. Zinc, Fe, and copper (Cu) are the micro-minerals essential for adequate body functioning. For example, the functions of Zn include but are not limited to helping people resist infectious diseases and healthy pregnancies [7]. About 70% of the body’s Fe is found in hemoglobin (red blood cells) and myoglobin (muscle cells) which are responsible for the transport of oxygen from the lung to the cells. Likewise, Cu is an essential part of many enzymes and along with Fe it helps in the formation of red blood cells, prevents osteoporosis, and maintains healthy blood vessels, nerves, and immune functions [8].
In total, 18% of Pakistan’s population are undernourished, 45% are facing severe stunting (low height-for-age), 15% are wasting (low weight-for-height), and 30% are underweight because of multi-faceted malnutrition [9,10]. The deficiency of micro-minerals such as Zn and Fe is negatively affecting human health and is a country-wide serious public health nutrition concern. For instance, in Pakistan, Zn deficiency is an emerging health problem as approximately 20.6% of children have blood Zn levels below 60 μg dL−1. Studies have shown that anemia affects 41–77% of women of reproductive age in Pakistan [11]. The severity of anemia is more common in rural areas, where it is often associated with poor health outcomes such as postpartum hemorrhage, preterm or stillbirth, and low birth weight infants [12].
The severity of malnutrition due to micronutrients deficiency, in particular, has been linked with their low intake through staple food, and the strategies to further improve the quality and quantity of micro- and macronutrients have been the subjects of intense research. Farm-level strategies are being devised to target both quality and quantity parameters [13]. In this regard, the addition of organic wastes and manures has been successfully practiced ensuring adequate nutrient supply to the crops. However, the benefits of such added organic matter (OM) are often short-lived particularly in semi-arid environments due to its rapid decomposition to CO2 within only a few cropping seasons. To sustain a steady supply of nutrients to the plants, OM should be available in the soil for a longer period. This could be successfully achieved with the addition of a stable OM source which should serve as a sink of carbon (C) on agricultural lands. Biochar (BC) is a pyrolyzed biomass and consists mostly of pyrogenic C, which takes longer to decompose than the biomass from which it is generated. The application of BC as a soil additive is vital due to its characteristics, which are responsible for enhancing agricultural productivity through nutrient retention, alleviating environmental problems, and combatting climate change [14,15]. The stable aromatic form of OC is an integral component of BC, and its intended purpose of use distinguishes it from charcoal. BC application is attracting increasing interest as a sustainable technology in Pakistan to improve even highly degraded soils. Besides improving the crop yields, BC application has been shown to increase the crop nutrient uptake, globally. For example, the N uptake in cereals and vegetables was significantly improved in tropical soils under both greenhouse and field-scale experiments [16,17]. Previous studies have shown that BC application has a positive impact on the yield and nutritional quality of maize grain in greenhouse experiments [18]. Similarly, results from semi-arid soil in Australia showed a positive response to BC in combination with fertilizer in pot trials [19]. In Indonesia, maize and wheat yields were enhanced significantly where charcoal was integrated with N fertilizer in the field [20]. Thus, it is expected that the combined application of BC and N fertilizer will have a paramount influence on the nutrient concentrations in maize grains. Therefore, this study was undertaken to investigate the effectiveness of BC and its interaction with N fertilizer in enhancing the mineral composition of maize grains under field conditions. We hypothesized that the application of BC alone or in combination with N will improve the concentration of macronutrients (K, P, Ca, Mg) and micronutrients (Zn, Fe, Cu) in maize grains and help to cure the malnutrition of people in Pakistan.

2. Material and Methods

2.1. Study Site and Biochar Field Trial

This experiment was carried out in the district of Buner (34°30′41″ N 72°29′02″ E), Khyber Pakhtunkhwa (KPK), Pakistan. The climate of Buner is classified as dry sub-tropical with mixed alluvial deposits, loess, and re-deposited loess as the parent material of most of the soils developed. Maize is one of the main crops grown along with other cereals, vegetables, and fruits [10]. The average annual minimum and maximum temperatures at the experimental site are −1.92 °C and 41.50 °C, respectively, while the average total annual rainfall has been 818.20 mm (Pakistan Meteorological Department) for the past twelve years, i.e., 2010–2022. The experiment included two factors: BC treatment (0, 5, 10, 15, and 20 t ha−1) and N application (0, 100, 150, and 200 kg ha−1). The treatments were replicated three times. The experiment was laid out in a randomized complete block design (RCBD) with a split-plot arrangement. The BC treatments were assigned to the main plot and N to the sub-plots. The BC was produced from the prunings of acacia (Acacia nilotica) through slow pyrolysis at a temperature of 450 °C in a stainless-steel kiln. During BC preparation, the maximum temperature reached was 680 °C after 20 min of ignition with an average temperature of ~450 °C throughout the process. The properties of soil and BC are presented in Table 1. BC was applied at the time of seed bed preparation and urea (46% N) was applied in two equal splits, i.e., half at sowing time and the remaining half applied 30 days after emergence. The BC was spread and mixed into top 10 cm soil with a tractor-driven power hoe. The field was thoroughly ploughed with the help of a cultivator followed by planking and fine seedbed preparation. A local variety of maize, Azam (semi dent type; color white; maturity days 95), released by the Cereal Crop Research Institute, Pirsabak (Khyber Pakhtunkhwa, Pakistan) was used in this experiment. The NPK recommended rate for this variety in the country is 120:60:60 kg ha−1, respectively.

Soil Properties (Start of the Experiment)

The soil at the experimental site was sandy loam (60% sand, 30% silt, and 10% clay), and slightly alkaline with pH ranging from 7.92 to 8.48 and electrical conductivity (EC) from 0.33 to 0.41 dS m−1. The soil was marginal in organic matter (OM) with an average OM~0.95%, and low in P and K contents (3.45 and 61.5 mg kg−1, respectively; Table 1).

2.2. Assessment of Soil and Biochar Properties

2.2.1. Soil

Mixed soil samples were randomly collected from three different locations in each experimental unit prior to sowing, at the reproductive and maturation stages of maize. Sampling was carried out at a depth of 15 cm using a manual auger. All the samples were collected in clean plastic bags, air dried in the laboratory, and ground prior to physicochemical evaluation.

Soil pH and Electrical Conductivity

The soil sample (10 g) together with 50 mL of distilled water was taken in a conical flask to make 1:5 soil–water suspension. The soil–water suspension was shaken on a mechanical shaker for 30 min, then allowed to stand for 10 min before determining the pH using the pH 7 and 10.0 standards. The electrical conductivity (EC) was also measured in the same suspension.

Soil Organic Matter

The determination of soil organic matter (SOM) was based on the Walkley–Black chromic acid wet oxidation method, and SOM was used as a proxy variable for soil N. Oxidizable matter in the soil was oxidized by 1 N K2Cr2O7 solution. The reaction was assisted by the heat generated when two volumes of H2SO4 were mixed with one volume of the dichromate [21].

Plant-Available Phosphorus

The plant-available P was measured after digestion of 5 g of soil in 50 mL of 0.5 M sodium bicarbonate solution, pH~8.5 [22]. For the spectrophotometric analysis, the color was developed through an ascorbic acid containing mixed indicator (ammonium molybdate and potassium antimony tartrate in 5 N sulfuric acid). An analysis of P was completed using the colorimetric technique on a spectrophotometer ((UV-6000, Newbury, UK).

Plant-Available Potassium

The plant-available K was measured after extracting 2.5 g of soil using 25 mL, 1.0 N, pH~7, and ammonium acetate [23]. Necessary dilutions were completed to determine K using a flame photometer (Model Sherwood 420, Sherwood, UK).

Soil Texture

Sand, silt, and clay fractions were determined by the soil suspension density (1:20 m/v) in a 1 L volumetric flask. The silt and clay densities were recorded after 40 s, while the clay density was recorded after 2 h using a hydrometer. Sodium hexa-meta-phosphate was used to disperse the soil particles. A blank reading was also taken and corrected for temperature variations.

2.2.2. Biochar

pH and Electrical Conductivity

The EC and pH were measured in 1:10 solid/water suspensions using a digital EC and pH meter. The pH of BC was measured twice by mixing it with deionized (DI) water in a BC: water (w/v) ratio of 1:10. The resulting suspensions were equilibrated for 1 h, then the pH was measured by placing an electrode in the solution just above the settled BC.

Total Carbon and Nitrogen

The BC sub-sample was ground to obtain a <53 μm fraction. The total C and N contents of BC were determined by dry combustion using a Vario Max CNS analyzer (Elementar Analysensysteme GmbH, Hanau, Germany).

Alkalinity

The pH of BC was measured by equilibrating 0.3 g of BC with 15 mL of 1 M NaCl for 24 h. The samples were filtered, and the pH of the NaCl extract was measured. The total alkalinity of BC was quantified by the reaction with HCl and subsequent back titration. First, BC was rapidly shaken (on an automatic shaker) with the HCl solution at a BC:solution (w/v) ratio of 1:50. The shaking intervals were 2, 4, 6, 8, 10, 12, 24, 48, and 72 h. The BC-solution suspensions were then filtered, and the extracts were titrated to pH 8.2 with standardized 0.05 M NaOH in the presence of the phenolphthalein indicator. The total alkalinity (mmol of H+ reacted g−1 of air-dried BC) was calculated from the difference between the amount of acid titrated in the sample and the blank.

Post-Harvest Analyses of Maize Grains

Maize plants were harvested at maturity (after 95 days). Grains were removed from the cobs by a method wherein the cob was first split longitudinally. Then, a force was applied to remove them from the cob. Composite samples of grain, each of 1 kg, were collected from each treatment. The composite samples were reduced to laboratory size samples (100 g each), dried to a constant weight at 65 °C in a forced-air oven, and then sub-samples were finely ground using a Retsch MM400 mixer mill (RETSCH GmbH, Haan, Germany). The finely ground samples were analyzed for mineral composition, i.e., macronutrients (K, P, Ca, Mg), and micronutrients (Zn, Fe, Cu). The samples were analyzed by the method of Rui et al. [24], using an inductively coupled plasma mass spectrometry (ICP-MS) (Agilent 7700 ICP-MS, Agilent, Santa Clara, CA, USA). Briefly, 200 mg of the finely ground maize grain sample along with 5 mL of 69% HNO3 (Tracepur, Merck) and 100 µL of the internal standard solution (10 µg mL−1 scandium in 5% HNO3) were added in the reaction vessel for microwave digestion (Ethos-Up with Maxi−44 Rotor, Milestone SLR, Sorisole, Italy). The vessels were heated to 200 °C over 15 min, held at the same temperature (for 20 min), and cooled to an ambient temperature (over 30 min). Samples were then removed from the microwave and the volumes were made up to 50 mL with ultra-pure water (resistivity of >18 MΩ-cm, conductivity of <0.056 µS cm−1, and <50 parts per billons of total organic carbon). Calibration standards were prepared in a matrix matched solution from 1000 ppm single element standards (Peak Performance, CPI International, Palo Alto, CA, USA). An internal standard (5 ppb Terbium) was used to monitor and correct for instrument drift and matrix effects. The standards were run on the ICP-MS and an external calibration curve was generated. A 15 mL aliquot of each sample was taken in a centrifuge tube and injected into the ICP-MS for the elemental analysis in triplicate.

Statistical Analysis

The data were subjected to an analysis of variance (ANOVA) using the Statistix 8.1 statistical package. The significant differences between treatment means were determined using the least significant difference (LSD) test for main as well as for interactive effects. The effects of BC (0, 5, 10, 15, and 20 t ha−1), N fertilizer (0, 100, 150, and 200 kg ha−1), and the BC × N were estimated with a two-way ANOVA on all the measured data. To reflect the impact of BC (averaged across N levels) visually and statistically, and N (averaged across BC levels) on the grain density of macro- and micronutrients, different regression techniques were employed, and the one with the highest values of the co-efficient of determination (R2) was chosen.

3. Results

3.1. Changes in Soil pH, EC, and OM (at Reproductive Stage and after Harvest)

Variations in soil parameters were found at the reproductive stage of maize while no changes in these parameters were observed after maize harvest (ripening stage) (Table 2 and Table 3). It was observed that the individual effects of BC and N were significant (p ≤ 0.05) on soil pH; however, the BC × N interactive effect was non-significant (p > 0.05). Similarly, BC and its interaction with N also showed a significant (p ≤ 0.05) effect on SOM. In contrast, the effect of N was not significant (p > 0.05). BC and N showed no significant (p > 0.05) effects on the soil EC. The average soil pH values indicated that the soil pH was maximum (7.81) with 20 t ha−1 which was statistically similar to 15 t ha−1 BC. The pH of the soil was the lowest (7.76) with 10 t ha−1 BC. The soil pH peaked at ~7.86 with the 100 kg ha−1 N application followed by 150 kg ha−1. The lowest soil pH ~ 7.78 was observed with the N application at 200 kg ha−1. The maximum SOM (0.79~39% increase) was noticed with the BC application rate of 10 t ha−1 followed by 5 t ha−1, and the lowest (0.57%) was without BC. The EC values non-significantly varied from 0.27 to 0.30 dS m−1 among various treatments. At the maturity stage of the crop, the mean pH and SOM values tended to decrease slightly while the soil EC remained unchanged (Table 3).

3.2. Grain Yield

Data showed that the maize grain yield remained unaffected with the BC application alone and in combination with N (p > 0.05; Table 4). However, the individual effect of N was significant (p ≤ 0.05) on maize yield. Maximum grain yield was recorded (4762 kg ha−1) with the N application at 200 kg ha−1, followed by 150 kg ha−1. Minimum grain yield was observed for the control treatment (without BC and N, 27% decreased yield as compared to the N application at 200 kg ha−1). Overall, the grain yield was negatively correlated with the nutrient grain density (r = −0.540, p ≤ 0.01).

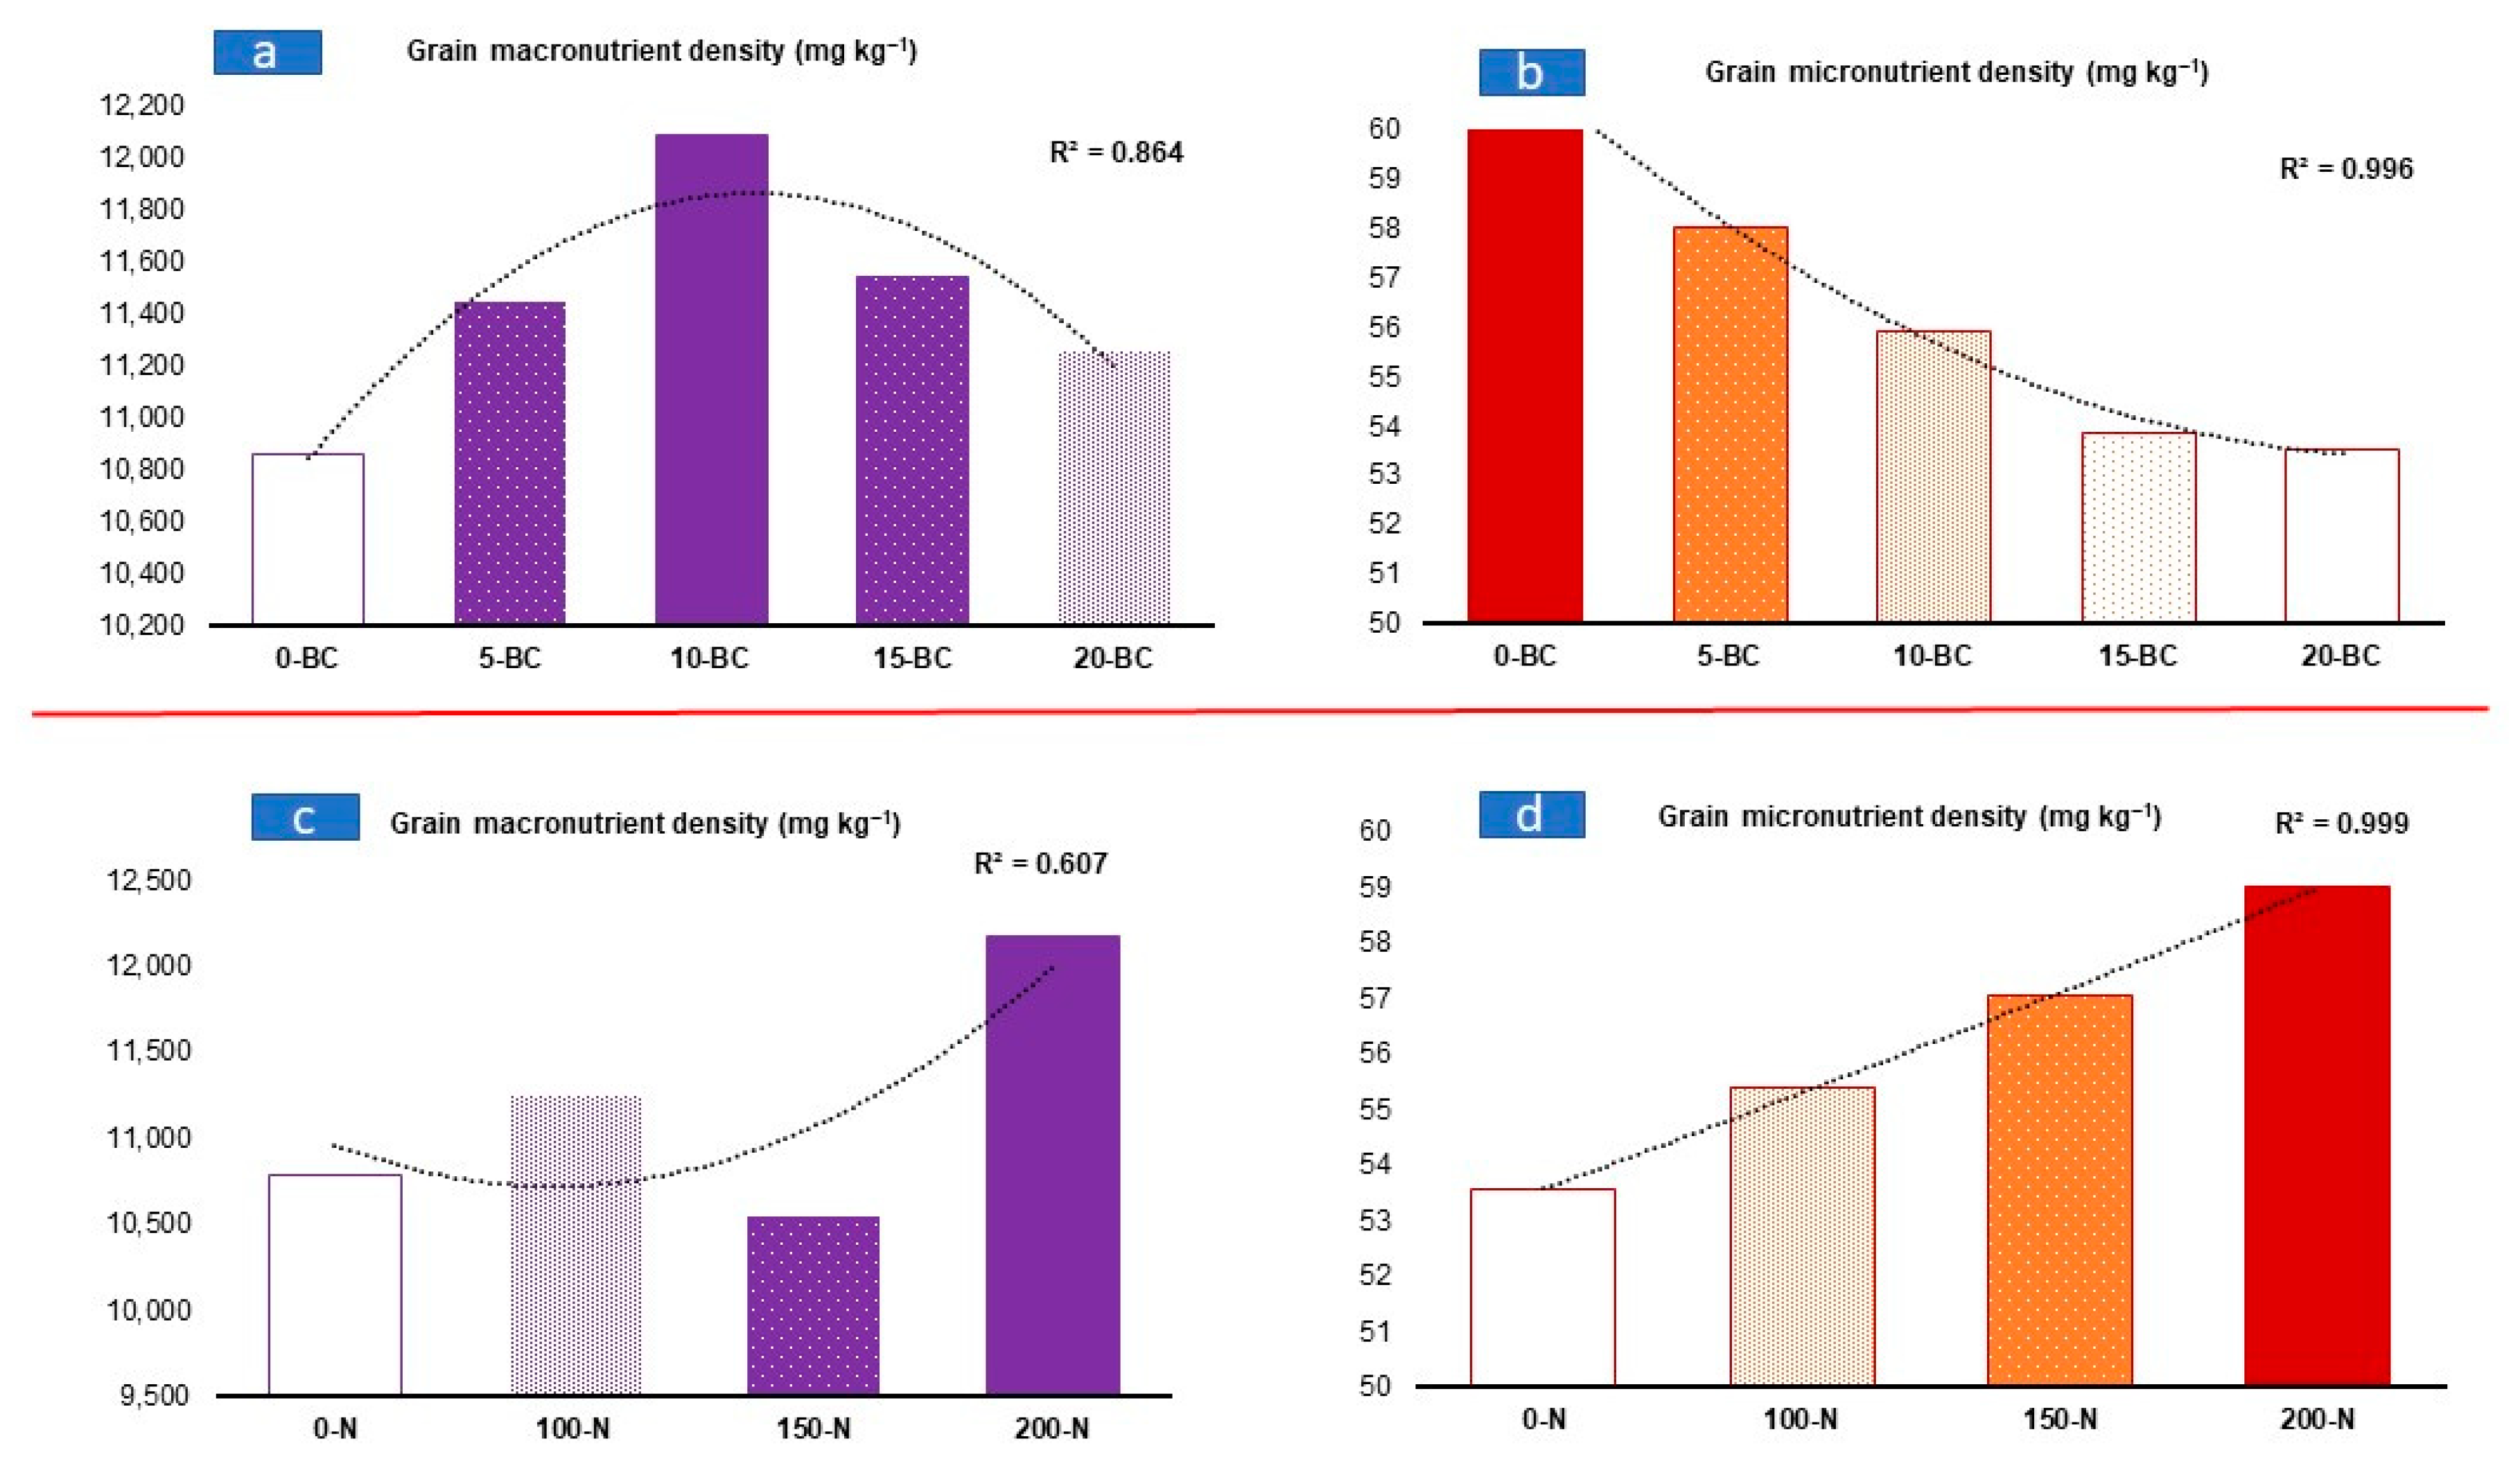
3.3. Effect of Biochar and Nitrogen Application on Macronutrients in Maize Grain

We found that BC and N levels significantly (p ≤ 0.05) affected the K content of maize grain (Table 5). Among the different levels of BC, the application rate of 10 t ha−1 resulted in a maximum grain K content ~4834.68 ± 492 mg kg−1 (12% more than control) >15 t ha−1~4671.47 ± 250 mg kg−1 (8% more than the control). The lowest K content (4319.23 ± 139 mg kg−1) was recorded in maize grain from the control plots (without BC). Regarding the N application, the grain K content increased consistently with increasing N levels. The lowest concentration of K (4278.72 ± 160 mg kg−1) was obtained in control samples, whereas the maximum concentration ~4967.36 ± 394 mg kg−1 was found in the samples from the treatment plots that received 200 kg ha−1 N. The combined effect of BC and N revealed that the grain K content was maximum at 10 t ha−1 BC along with 200 kg N ha−1, and lowest in the control (without BC and N) (Table 5, Figure 1).
An analysis of variance showed that both BC and N levels, individually as well as interactively, significantly (p ≤ 0.05; Table 5) affected the P content of maize grain. The mean data values showed that BC applied at 10 t ha−1 yielded a maximum P content of 3705.52 ± 325 mg kg−1 in maize grain, while the control treatment showed the least concentration of P viz. 3250.73 ± 177 mg kg−1 in the grain. Among different N levels, the highest dose rate of 200 kg ha−1 exhibited maximum P content (3684.42 ± 362 mg kg−1) in the maize grain, followed by 150 kg ha−1. Minimum P content (3218.98 ± 184 mg kg−1) was recorded in grain without the N application. The interaction between BC and N levels revealed that the maximum grain P content (4133.48 ± 26 mg kg−1) was found with the application of 10 t ha−1 of BC along with 200 kg N ha−1, whereas the grain P content was the lowest (3002.72 ± 20 mg kg−1) with the BC application at 20 t ha−1 alone.
The effect of both BC and N as well as BC × N on the Ca content of grains was significant (p ≤ 0.05; Table 5). The maximum average content of Ca (231.07 ± 17 mg kg−1) was analyzed in grain samples at 10 t ha−1 BC, whereas the lowest amount of Ca (189.88 ±11.86 mg kg−1) was examined in the samples collected from the control (without BC and N). The interactive effect of BC and N indicated that BC treatment at 20 t ha−1 without N resulted in the lowest Ca content (155.15 ± 6.50 mg kg), whereas the BC at 10 t ha−1 and N level of 200 kg ha−1 caused the maximum Ca content (247.60 ± 5.06 mg kg−1) in maize grain.
Different BC treatments and N levels significantly (p ≤ 0.05) affected the Mg content of maize grain (Table 5). The interaction effect of BC and N levels was found to be significant (p > 0.05). The mean values of the data indicated that BC applied at 10 t ha−1 generated the highest average Mg content of 1544.80 ± 39.96 mg kg−1 in maize grain, which was followed by 15 t ha−1 that yielded 1509.20 ± 49.01 mg kg−1 Mg content. The average Mg content of maize grain was the lowest (1457.08 ± 29.45 mg kg−1) without BC. Among the different N levels, the Mg content in maize grain was the highest (1542.44 ± 33.25 mg kg−1) with the N application at 200 kg ha−1, and the lowest (1446.81 ± 35.79 mg kg−1) in plots without the application of N.

3.4. Effect of Biochar and Nitrogen Application on Micronutrients in Maize Grain

We found significant individual effects of the BC and N levels (p ≤ 0.05; Table 6) on the grain Zn content. However, the interaction of BC and N was revealed to be non-significant (p > 0.05). The mean values of the data showed that no application of BC resulted in the highest grain Zn content ~26.01 ± 1.06 mg kg−1. The grain average Zn content was lowest (23.19 ± 1.43 mg kg−1) with the application of 20 t ha−1 BC. The grain Zn content increased consistently with increasing N levels. The highest average grain Zn content (25.06 ± 1.68 mg kg−1) was observed when 200 kg N ha−1 was added. The Zn content of the grains was the lowest (22.71 ± 1.04 mg kg−1) without N (Table 6, Figure 1).
The Fe content of maize grain ranged from 24.5 ± 0.98 mg kg−1 (at 20 t ha−1 BC without N) to 33.10 ± 0.98 mg kg−1 (without BC and 150 kg ha−1 N). An analysis of variance of data showed that the individual and combined effects of BC and N were significant (p > 0.05; Table 6) on the Fe content. The Fe content steadily increased with increasing N levels. On the contrary, an increasing level of BC adversely affected the Fe content of maize grain. The mean values indicated that maize grain had maximum Fe content (32.28 ± 1.16 mg kg−1) in those plots that were treated with no BC. Plots treated with 20 t ha−1 of BC showed the minimum amount of Fe content (27.83 ± 2.27 mg kg−1) in the grain.
The Cu content in maize grain showed the significant influence of BC, N, and BC × N interaction. Maize grain’s Cu content significantly (p < 0.05; Table 6) decreased with BC. Among different levels of BC, the highest average grain Cu content (2.87 ± 0.42 mg kg−1) was examined without BC, which was followed by 5 t ha−1. The plots that received 20 t ha−1 BC showed minimal Cu content (2.52 ± 0.51 mg kg−1) in the grains. Regarding the N levels, a constant increase in the grain Cu content of maize was recorded. The highest grain Cu content of 2.83 ± 0.31 mg kg−1 was recorded with the addition of 200 kg N ha−1. The grain Cu content was lowest (2.51 ± 0.28 mg kg−1) without N. The interaction of BC and N levels revealed that the highest grain Cu content (3.30 ± 0.17 mg kg−1) was found with no BC along with 100 kg N ha−1 and the grain Cu content was lowest (2.06 ± 0.02 mg kg−1) with 20 t ha−1 of BC without N.

4. Discussion

4.1. Effect of Biochar and Nitrogen Application on Macronutrients (P, K, Ca, and Mg) in Maize Grain

We found partial support for the first hypothesis. Both the individual and interactive effects of BC and N applications had a synergistic effect on macronutrients (K, P, Ca, Mg). The P content of maize grain significantly increased with BC application up to 10 t ha−1 along with the N application. Dharmakeerthi et al. [25] reported similar findings where the BC application increased P uptake compared with the control. The increased P concentration in maize grain with the BC application might be due to BC-induced changes in soil-available P and plant P uptake that could be driven by a suite of factors involved in the soil’s physical and chemical reactions, and plant growth. A recent meta-analysis of P dynamics in soils and plant systems under the BC application on acidic (pH ≤ 6.5) and neutral/alkaline (pH > 6.5) soils further supports our argument [26]. Nevertheless, the relative more pronounced effect of the BC application has been reported in acidic soils as compared to the high pH soils. The stimulation of the mycorrhizal species with the application of BC that may have changed the soil N/P ratio [27] could also be one of the plausible explanations. As we did not investigate the mycorrhizal effect, the stimulation of the mycorrhizal species seems irrelevant to our study. In addition, N further may have promoted P uptake by increasing the rate of metabolism, root density, P solubility, and its availability by decreasing the soil pH through the absorption of NH4 [28]. The application of BC might have increased enzyme activities and improved several microbial groups’ biomass which suggested a selection pressure of BC to the soil microbial population and induced significantly higher root mass. Similar results were reported by Kocsis et al. [29] where the BC application was effective (in terms of maize yield) on weakly humus sandy soils.
An elevated K content in maize grain with an increasing BC level was maximum at the application rate of 10 t ha−1. Similarly, the K content in grain increased steadily with increasing N levels. The accelerated K uptake by maize with the application of BC may be attributed to the BC-mediated increased availability of BC-containing soluble K that may have impacted its accumulation in grains [30]. Likewise, the significant increase in K uptake with the N application over the control without N was consistent with the reports by Shehu et al. [31]. Although ammonium N from urea strived for the uptake of cation such as K and decreased its availability, the application of urea coupled with BC may have depleted exchangeable and non-exchangeable pools of soil K that enhanced the uptake of K [32].
A significant increase in the Ca content was observed with BC. However, the N application did not significantly (statistically non-significant) affect the Ca content. This divergence might be due to the accelerated nutrients’ availability and enhanced nutrient use efficiency through the nutrients’ retention, modifying soil microbial dynamics, and thereby the increased decomposition of SOM may have occurred [33]. Dharmakeerthi et al. [25] reported similar results that the BC application increased the uptake of Ca as compared to the control (without BC). Correspondingly, the application of N enhanced plant nutrients’ availability and uptake ability in the soil. The increased application of the N fertilizer enhanced nutrients’ uptake response to promote various cellular functions of the plants [34].
The application of BC and N alone and in combination significantly affected the Mg content of maize grain. The highest individual effect of BC was observed at an application rate of 10 t ha−1 which then decreased with increasing levels of BC. However, the Mg content steadily increased with increasing N levels. The present results are consistent with the findings of Dharmakeerthi et al. [25], who reported that the BC application increased the uptake of Mg as compared to the control (without the application of BC). The optimum level of BC may have reduced the leaching losses of the nutrients (as evident by the relative accrual in SOM at the reproductive stage of maize) and made the nutrients available to the crop. In addition, the N application synergistically enhanced the uptake of Mg [35]. Esmaili et al. [36] also reported increased Mg concentration due to the N-induced exchange capacity of roots and subsequent uptake of bivalent cations.

4.2. Effect of Biochar and Nitrogen Application on Micronutrients (Zn, Fe, and Cu) in Maize Grain

The micronutrients viz. Zn, Fe, and Cu of maize grain were also significantly affected by BC and N applications. BC application adversely affected the Fe content of the grain, whereas a positive relation existed between the grain Fe content and N application. The decrease in the Fe content of grain with the BC application might be due to the precipitation of Fe that lowered its mobility into the phloem cells for long distance translocation [37]. Soil OM is known to bind more Zn, and Cu compared to Fe because of the lower sensitivity to redox changes. The fertilizer application methods and cropping sequences are responsible for the variation in the behavior of Zn, Fe, and Cu in the soil and plant systems. The availability of Zn, Cu, and Fe in the soil, as well as their concentrations in different crops, can be improved by applying N, P, and K fertilizers [38]. In alkaline soils, the higher uptake of Zn, Cu, and Fe was usually associated with the increased application of the N fertilizer. On the other hand, the Fe content of the grain was steadily increased with the increasing level of N. This potential argument against such elevated levels could be due to (i) the flush in the microbial activities such as sulfur oxidation by bacteria, which may have reduced soil pH; and (ii) the production of organic acids and mineralization of SOM [39]. A similar trend of results was noted for the grain Cu and Zn contents in maize. We contend that BC, being a porous material, may have adsorbed the available Cu and Zn cations that resulted in the reduced Cu and Zn availability to the plants. The present results were supported by previous literature [40]. Considering the severity of malnutrition in terms of micronutrients in Pakistan, and the vital roles of Zn and Cu, the BC loading with specific micronutrients could be one of the options to improve the maize grain quality. On the contrary, the grain Cu and Zn contents increased with increasing N levels. This might be due to the root to shoot movement of Cu and Zn in the xylem and re-translocation in the plant’s phloem that was facilitated by endogenous chelators such as nicotinamine and 2-deoxymugineic acid (synthesized from methionine) and were thus dependent on N nutrition [41]. Similarly, a high N supply (higher level) may have increased the production of phytosiderophores, which may have indirectly regulated Zn mobility and enhanced its accumulation in grain [42].
Raw biochar is reported to have usually a higher payback time, even with increased crop yields [43]. Moreover, BC with pH > 7.5 is discouraged to apply on alkaline calcareous soils (common in semi-arid to arid environments). Overall, the pH of BC used in our experiment ranged between 6.46 and 6.50 (largely uncommon compared to most of the BC available in the local market). The argument against the comparative accrual in the SOM at the reproductive stage rather than in soil after harvesting dictates the role of the labile pool of BC in the presence of a relatively exhaustive test crop (maize). At that time (reproductive stage), the plant was actively photosynthesizing, and the labile pool of BC was not preferred. However, after the reproductive stage when the photosynthesis was almost stopped and photosynthates may have been stored, metabolically available organic C from the labile pool of BC was preferably consumed, and thus low SOM was found (Table 3). Nevertheless, there is a need to investigate the impact of aged BC on the quality of maize grain, SOM storage potential on soils with different OM contents, soil textures, and clay mineralogy. Clay minerals are the most reactive inorganic components of soils, largely govern soil properties and functions, and may mask the true potential of BC due to organo-mineral interactions. If acacia prunings-derived BC is to be made part of the land management system, no acidification but rather cost-effective micronutrient enrichment techniques have to be further explored.

5. Conclusions

The application of BC and N, individually and interactively, affected the mineral contents of maize grains. BC application at 10 t ha−1 significantly (p < 0.05) improved the macro-mineral contents (K, P, Ca, and Mg). On the other hand, BC application at 20 t ha−1 reduced the contents of micro-minerals (Zn, Fe, Cu) in maize grain. The application of N at 200 kg ha−1 increased the macro- and micro-minerals (Zn, Fe, Cu) of maize grain. It was concluded that the integrated use of BC and N could be a valuable strategy to improve the nutritional quality of maize grains. Micronutrients’ loading with BC is recommended to achieve the desired concentration of micro-minerals in maize grain. Further investigation is warranted to validate the impact of BC made of different feedstocks (other than the prunings of Acacia nilotica and especially of the feedstock available in bulk to promote a circular economy) on contrasting soil types (other than sandy loam).

Author Contributions

S.A. designed the research. H.U. conducted the experiment. S.A. and Y.H. supervised the research experiment. W.A. and M.S. provided help and advice in manuscript preparation. S.M. provided help in laboratory analyses. All authors contributed to editorial changes in the manuscript. All authors have read and agreed to the published version of the manuscript.

Funding

We acknowledge the Higher Education Commission (HEC) of Pakistan for the financial support to complete this study.

Institutional Review Board Statement

Not applicable.

Informed Consent Statement

Not applicable.

Data Availability Statement

Data presented in this study are available on request from the corresponding author.

Acknowledgments

We acknowledge the Higher Education Commission (HEC) of Pakistan for the financial support under the International Research Support Initiative Program (IRSIP), and the School of Chemical Sciences, University of Auckland, New Zealand for facilitating the laboratory analysis for this study. The need for this manuscript partially emerged during the Food and Agriculture Organization of the United Nations project (FAO; Project Reference, GCP/PAK/143/USA, “4R Nutrient Stewardship for Sustainable Agriculture Intensification in Pakistan: Baseline Input Atlas and Promotion of Best Soil Management Practices”). WA is thankful to Khalid Mahmood (Rothamsted Research, United Kingdom) and Hana’a Burezq and Shabbir A. Shahid (Desert Agriculture and Ecosystems Program, Environment and Life Sciences Research Center, Kuwait Institute for Scientific Research, Kuwait) for the thought-provoking discussions on how to tailor the properties of biochar and devise technology packages for small, medium, and large-scale growers of semi-arid and arid regions. The authors are thankful to three anonymous reviewers for their comments and suggestions to improve the quality of this manuscript. All the views expressed in this manuscript are the authors’ own views and do not necessarily reflect the opinion of their respective organizations.

Conflicts of Interest

There is no conflict of interest.

References

  1. Díaz-Gómez, J.L.; Castorena-Torres, F.; Preciado-Ortiz, R.E.; García-Lara, S. Anti-cancer activity of maize bioactive peptides. Front. Chem. 2017, 5, 44. [Google Scholar] [CrossRef] [PubMed]
  2. Nuss, E.T.; Tanumihardjo, S.A. Maize: A paramount staple crop in the context of global nutrition. Comp. Rev. Food Sci. Food Safe 2010, 9, 417–436. [Google Scholar] [CrossRef] [PubMed]
  3. Trautvetter, U.; Jahreis, G.; Kiehntopf, M.; Glei, M. Consequences of a high phosphorus intake on mineral metabolism and bone remodeling in dependence of calcium intake in healthy subjects—A randomized placebo-controlled human intervention study. Nutr. J. 2016, 15, 7. [Google Scholar] [CrossRef] [PubMed] [Green Version]
  4. Roumelioti, M.E.; Glew, R.H.; Khitan, Z.J.; Rondon-Berrios, H.; Argyropoulos, C.P.; Malhotra, D.; Tzamaloukas, A.H. Fluid balance concepts in medicine: Principles and practice. World J. Nephrol. 2018, 7, 1–28. [Google Scholar] [CrossRef] [PubMed]
  5. Grober, U.; Schmidt, J.; Kisters, K. Magnesium in prevention and therapy. Nutrients 2015, 7, 8199–8226. [Google Scholar] [CrossRef] [Green Version]
  6. Al Alawi, A.M.; Majoni, S.W.; Falhammar, H. Magnesium and Human Health: Perspectives and Research Directions. Int. J. Endocrinol. 2018, 2018, 9041694. [Google Scholar] [CrossRef] [Green Version]
  7. Ahmad, K.; Ijaz, A.B.; Muneer, M.; Munawar, I.; Zafar, I. Removal of heavy metals (Zn, Cr, Pb, Cd, Cu and Fe) in aqueous media by calcium carbonate as an adsorbent. Int. J. Chem. Biol. Sci. 2012, 2, 48–53. [Google Scholar]
  8. Abbaspour, N.; Hurrell, R.; Kelishadi, R. Review on iron and its importance for human health. J. Res. Med. Sci. 2014, 19, 164–174. [Google Scholar]
  9. Ministry of National Health Services Regulation and Coordination (MoNHSR&C) GoP. National Nutrition Survey; MoNHSR&C: Islamabad, Pakistan, 2018. [Google Scholar]
  10. NFDC (National Fertilizer Development Centre). Soil Fertility and Inputs Use Atlas of Pakistan: The Khyber Pakhtunkhwa Province; Ahmad, W., Khan, M.J., Mustafa, Z., Mahmood, K., Singh, B., Zia, M.H., Ali, A., Jalil, A., Eds.; NFDC (National Fertilizer Development Centre): Islamabad, Pakistan, 2018; p. 115. ISBN 0978-969-78888-00-9. [Google Scholar]
  11. Baig-Ansari, N.; Badruddin, S.H.; Karmaliani, R.; Harris, H.; Jehan, I.; Pasha, O. Anemia prevalence and risk factors in pregnant women in an urban area of Pakistan. Food Nutr. Bull. 2008, 29, 132–139. [Google Scholar] [CrossRef] [Green Version]
  12. Parks, S.; Hoffman, M.K.; Goudar, S.S.; Patel, A.; Saleem, S.; Ali, S.A. Maternal anaemia and maternal, fetal, and neonatal outcomes in a prospective cohort study in India and Pakistan. BJOG Int. J. Obs. Gynaecol. 2019, 126, 737–743. [Google Scholar] [CrossRef]
  13. Ahmad, W.; Ullah, N.; Xu, L.; El Sabagh, A. Global food and nutrition security under changing climates. Front. Agron. 2022, 3, 799878. [Google Scholar] [CrossRef]
  14. Ahmad, W.; Ullah, N.; Zia, M.H. Soil contamination with metals: Sources, types and implications. In Soil Remediation and Plants: Prospects and Challenges; Academic Press: Cambridge, MA, USA, 2015; pp. 37–61. [Google Scholar]
  15. Al-Wabel, M.I.; Rafique, M.I.; Ahmad, M.; Ahmad, M.; Hussain, A.; Usman, A.R.A. Pyrolytic and hydrothermal carbonization of date palm leaflets: Characteristics and ecotoxicological effects on seed germination of lettuce. Saudi J. Biol. Sci. 2019, 26, 665–672. [Google Scholar] [CrossRef] [PubMed]
  16. Chan, K.Y.; Van Zwieten, V.; Meszaros, I.; Downie, A.; Joseph, S. Agronomic values of green waste biochar as a soil amendment. Soil Res. 2007, 45, 629–634. [Google Scholar] [CrossRef]
  17. Major, J.; Rondon, M.; Molina, D.; Riha, S.J.; Lehmann, J. Maize yield and nutrition during 4 years after biochar application to a Colombian Savanna oxisol. Plant Soil 2010, 333, 117–128. [Google Scholar] [CrossRef]
  18. Uzoma, K.C.; Inoue, M.; Andry, H.; Fujimaki, H.; Zahoor, A.; Nihihara, E. Effect of cow manure biochar on maize productivity under sandy soil condition. Soil Use Manag. 2011, 27, 205–212. [Google Scholar] [CrossRef]
  19. Chan, K.Y.; Van Zwieten, L.; Meszaros, I.; Downie, A.; Joseph, S. Using poultry litter biochar as soil amendments. Aust. J. Soil Res. 2008, 46, 437–444. [Google Scholar] [CrossRef]
  20. Yamato, M.; Okimori, Y.; Wibowo, I.F.; Anshori, S.; Ogawa, M. Effects of the application of charred bark of Acacia mangium on the yield of maize, cowpea and peanut, and soil chemical properties in South Sumatra, Indonesia. Soil Sci. Plant Nutr. 2006, 52, 489–495. [Google Scholar] [CrossRef]
  21. Walkley, A. A critical examination of a raid method for determining organic carbon in soils: Effect of variations in digestion conditions and of organic soil constituents. Soil Sci. 1947, 63, 251–263. [Google Scholar] [CrossRef]
  22. Olsen, S.R.; Cole, C.V.; Watanabe, S.N.; Dean, L.A. Estimation of available phosphorus in soils by extraction with sodium bicarbonate. In Circular; U.S. Department of Agriculture: Washington, DC, USA, 1954; Volume 939, pp. 1–19. [Google Scholar]
  23. Berg, M.G.; Ernest, H.G. Methods of Soil Analysis Used in the Soil Testing Laboratory at Oregon State University; Agricultural Experiment Station, Oregon State University: Corvallis, OR, USA, 1978. [Google Scholar]
  24. Rui, Y.K.; Guo, J.; Huang, K.L.; Jin, Y.H.; Lou, Y.B. Application of ICP-MS to the detection of heavy metals in transgenic corn. Guang Pu Xue Yu Guang Pu Fen Xi = Guang Pu 2007, 27, 796–798. [Google Scholar]
  25. Dharmakeerthi, R.S.; Chandrasiri, J.A.S.; Edirimanne, V.U. Effect of rubber wood biochar on nutrition and growth of nursery plants of Hevea brasiliensis L. Growth in an ultisol. SpringerPlus 2012, 1, 84. [Google Scholar] [CrossRef] [Green Version]
  26. Tesfaye, F.; Liu, X.; Zheng, J.; Cheng, K.; Bian, R.; Zhang, X.; Li, L.; Drosos, M.; Joseph, S.; Pan, G. Could biochar amendment be a tool to improve soil availability and plant uptake of phosphorus? A meta-analysis of published experiments. Environ. Sci. Pollut. Res. 2021, 28, 34108–34120. [Google Scholar] [CrossRef] [PubMed]
  27. Borno, M.L.; Eduah, J.O.; Müller-Stöver, D.S.; Liu, F. Effect of different biochars on phosphorus (P) dynamics in the rhizosphere of Zea mays L. (maize). Plant Soil 2018, 431, 257–272. [Google Scholar] [CrossRef]
  28. Havlin, J.; Balster, N.; Chapman, S.; Ferris, D.; Thompson, T.; Smith, T. Trends in soil science education and employment. Soil Sci. Soc. Am. J. 2010, 74, 1429–1432. [Google Scholar] [CrossRef] [Green Version]
  29. Kocsis, T.; Kotroczó, Z.; Kardos, L.; Biró, B. Optimization of increasing biochar doses with soil–plant–microbial functioning and nutrient uptake of maize. Environ. Technol. Innov. 2020, 20, 101191. [Google Scholar] [CrossRef]
  30. Widowati, W.; Asnah, A. Biochar effect at potassium fertilizer and dosage leaching potassium for two-corn planting season. J. Agric. Sci. 2014, 36, 65–71. [Google Scholar] [CrossRef]
  31. Shehu, H.E.; Kwari, J.D.; Sandabe, M.K. Effects of N, P and K fertilizers on yield content and uptake of N, P and K by sesame (Sesamum indicum L.). Int. J. Agric. Biol. 2010, 12, 845–850. [Google Scholar]
  32. Lehmann, J.; Rillig, M.C.; Thies, J.; Masiello, C.A.; Hockaday, W.C.; Crowley, D. Biochar effects on soil biota. Soil Biol. Biochem. 2011, 43, 1812–1836. [Google Scholar] [CrossRef]
  33. Lehmann, J.; Silva, P.J., Jr.; Steiner, C.; Nehls, T.; Zec, W.; Glaser, B. Nutrient availability and leaching in an archaeological Anthrosol and a Ferralsol of the Central Amazon basin: Fertilizer, manure and charcoal amendments. Plant Soil 2003, 249, 343–357. [Google Scholar] [CrossRef]
  34. Dekok, L.J.; Grill, D.; Hawkesford, M.J.; Schnug, E.; Stulen, I. Cost Action 829. Fundamental Agronomical and Environmental Aspects of Sulphur Nutrition and Assimilation in Plants; Office for Official Publications of the European Communities: Luxemburg, 1999; p. 105. [Google Scholar]
  35. Malvi, U. Interaction of micronutrients with major nutrients with special reference to Potassium. Karnataka J. Agric. Sci. 2011, 24, 106–109. [Google Scholar]
  36. Esmaili1, E.; Kapourchal, S.A.; Malakouti, M.J.; Homaee, M. Interactive effect of salinity and two nitrogen fertilizers on growth and composition of sorghum. Plant Soil Environ. 2008, 12, 537–546. [Google Scholar] [CrossRef] [Green Version]
  37. Morrissey, J.; Guerinot, M.L. Iron uptake and transport in plants: The good, the bad, and the ionome. Chem. Rev. 2009, 109, 4553–4567. [Google Scholar] [CrossRef] [PubMed] [Green Version]
  38. Zhang, S.H.; Li, X.Y.; Li, X.P.; Yuan, F.M.; Yao, Z.H.; Sun, Y.L.; Zhang, F.D. Crop yield, N uptake and nitrates in a fluvo-aquic soil profile. Pedosphere 2004, 14, 131–136. [Google Scholar]
  39. Germida, J.J.; Janzen, H.H. Factors affecting the oxidation of elemental sulfur in soils. Fertil. Res. 1993, 35, 101–114. [Google Scholar] [CrossRef]
  40. Fellet, G.; Marmiroli, M.; Marchiol, L. Elements uptake by metal accumulator species grown on mine tailings amended with three types of biochar. Sci. Total Environ. 2014, 468, 598–608. [Google Scholar] [CrossRef]
  41. Nishiyama, R.; Kato, M.; Nagata, S.; Yanagisawa, S.; Yoneyama, T. Identification of Zn-nicotianamine and Fe−2 deoxymugineic acid in the phloem sap from rice plants (Oryza sativa L.). Plant Cell Physiol. 2012, 53, 381–390. [Google Scholar] [CrossRef]
  42. Zuchi, S.; Cesco, S.; Astolfi, S. High S supply improves Fe accumulation in durum wheat plants grown under Fe limitation. Environ. Exp. Bot. 2012, 77, 25–32. [Google Scholar] [CrossRef]
  43. Kochanek, J.; Rochelle, M.S.; Martinez, C.; Dakuidreketi, A.; Mudge, A.M. Biochar for intensification of plant-related industries to meet productivity, sustainability and economic goals: A review. Resour. Conserv. Recycl. 2022, 179, 106109. [Google Scholar] [CrossRef]
Figure 1. Effect of biochar (BC) (averaged across nitrogen (N) levels), and N (averaged across BC levels) on the maize grain density of macro- and micronutrients. A polynomial regression (second degree) was employed to visually reflect the impact of BC and N. BC was applied at the rates of 5 (5-BC), 10 (10-BC), 15 (15-BC), and 20 t ha−1 (20-BC) and N at 100 (100-N), 150 (150-N), and 200 kg ha−1 (200-N) along with control (without BC and N) in a split-plot arrangement using a randomized complete block design. The macronutrient grain density is the sum of potassium (K), phosphorus (P), calcium (Ca), and magnesium (Mg). The micronutrient grain density represents the sum of zinc (Zn), iron (Fe), and copper (Cu) contents. Clearly, the micro-element grain density was decreased with an increased level of BC as compared to the control (without BC and N) (b). An increased N level elevated the micronutrient grain density (d). However, the macronutrient grain density was maximum at 10-BC followed by 5-BC = 15-BC > 20-BC and control (a). The maximum macronutrient grain density was found at 200-N followed by 100-N, control, and at 150-N (c).
Sustainability 14 02995 g001
Table 1. Soil and biochar properties before starting the field experiment.
PropertyMean
SoilpH 1:5 H2O8.20 ± 0.28
EC 1:5 H2O (dSm−1)0.37 ± 0.04
OM (%)0.95 ± 0.06
Organic C (%)0.55 ± 0.03
Available P (mg kg−1)3.45 ± 0.06
Available K (mg kg−1)61.5 ± 4.24
BiocharpH 1:10 H2O6.46 ± 0.03
EC 1:10 H2O (dS m−1)1.06 ± 0.02
pH NaCl6.50 ± 0.02
EC NaCl (dSm−1)1.90 ± 0.01
Alkalinity (mg L−1)8.00
Total organic C (g kg−1)568 ± 2.0
Total N (g kg−1)9.5 ± 0.10
Values are presented as means ± standard deviation; EC = electrical conductivity; OM = organic matter.
Table 2. Soil properties at the reproductive stage of maize as affected by different biochar (BC) and nitrogen (N) levels.
Biochar (t ha−1)Nitrogen (kg ha−1)Means
0100150200
pH07.74 ± 0.03 ef7.90 ± 0.03 ab7.90 ± 0.05 ab7.77 ± 0.13 c–f7.83 ± 0.09 AB
57.83 ± 0.06 b–f7.78 ± 0.03 c–f7.76 ± 0.04 def7.80 ± 0.02 bc–f7.79 ± 0.03 BC
107.72 ± 0.05 f7.82 ± 0.07 b–f7.77 ± 0.01 c–f7.75 ± 0.03 ef7.76 ± 0.04 C
157.88 ± 0.12 a–d7.84 ± 0.03 a–e7.91 ± 0.04 ab7.82 ± 0.13 bc–f7.86 ± 0.04 A
207.87 ± 0.03 a–d7.95 ± 0.17 a7.88 ± 0.03 a–c7.75 ± 0.03 ef7.86 ± 0.09 A
Mean7.81 ± 0.08 AB7.86 ± 0.07 A7.84 ± 0.07 A7.78 ± 0.03 B
SOM00.46 ± 0.02 fg0.54 ± 0.05 abc0.71 ± 0.05 abc0.55 ± 0.04 efg0.57 ± 0.10 C
50.68 ± 0.02 cd0.67 ± 0.12 bc0.70 ± 0.07 bc0.73 ± 0.10 abc0.69 ± 0.03 B
100.79 ± 0.04 abc0.83 ± 0.12 abc0.78 ± 0.03 abc0.75 ± 0.03 abc0.79 ± 0.03 A
150.81 ± 0.06 ab0.43 ± 0.04 fg0.47 ± 0.03 fg0.56 ± 0.03 def0.57 ± 0.17 C
200.53 ± 0.04 fg0.75 ± 0.14 fg0.43 ± 0.03 fg0.67 ± 0.18 cde0.60 ± 0.14 C
Mean0.65 ± 0.15 A0.64 ± 0.16 A0.62 ± 0.15 A0.65 ± 0.09 A
EC00.26 ± 0.02 ab0.31 ± 0.04 ab0.32 ± 0.04 a0.25 ± 003 ab0.29 ± 0.04 A
50.29 ± 0.03 ab0.23 ± 0.01 b0.27 ± 0.04 ab0.29 ± 0.05 ab0.27 ± 0.03 A
100.31 ± 0.07 ab0.27 ± 0.03 ab0.27 ± 0.03 ab0.28 ± 0.05 ab0.28 ± 0.02 A
150.30 ± 0.07 ab0.30 ± 0.07 ab0.32 ± 0.08 a0.29 ± 0.08 ab0.30 ± 0.01 A
200.30 ± 0.07 ab0.28 ± 0.03 ab0.32 ± 0.05 a0.27 ± 0.02 ab0.29 ± 0.02 A
Mean0.29 ± 0.02 A0.28 ± 0.03 A0.30 ± 0.03 A0.28 ± 0.02 A
Means in each category followed by different letters are significantly different at p ≤ 0.05.
Table 3. Soil properties at the maturity stage of maize as affected by different biochar (BC) and nitrogen (N) levels.
Biochar (t ha−1)Nitrogen (kg ha−1)Means
0100150200
pH07.73 ± 0.05 abc7.85 ± 0.07 ab7.87 ± 0.05 a7.73 ± 0.13 abc7.80 ± 0.08 AB
57.75 ± 0.05 abc7.76 ± 0.03 abc7.73 ± 0.06 abc7.76 ± 0.01 abc7.75 ± 0.02 BC
107.68 ± 0.05 c7.80 ± 0.06 abc7.72 ± 0.02 abc7.72 ± 0.03 bc7.73 ± 0.05 C
157.77 ± 0.26 abc7.83 ± 0.05 ab7.83 ± 0.11 ab7.80 ± 0.12 abc7.81 ± 0.03 A
207.84 ± 0.01 ab7.85 ± 0.11 ab7.85 ± 0.02 ab7.72 ± 0.04 bc7.81 ± 0.06 A
Mean7.75 ± 0.06 AB7.82 ± 0.04 A7.80 ± 0.07 A7.75 ± 0.03 B
SOM00.54 ± 0.05 fgh0.50 ± 0.01 h0.61 ± 0.04 cde0.53 ± 0.03 gf0.55 ± 0.04 D
50.65 ± 0.01 bc0.65 ± 0.01 bc0.60 ± 0.02 de0.66 ± 0.02 b0.64 ± 0.03 B
100.72 ± 0.01 a0.74 ± 0.01 a0.73 ± 0.02 a0.73 ± 0.01 a0.73 ± 0.01 A
150.71 ± 0.01 a0.36 ± 0.07 bc0.62 ± 0.03 bcde0.58 ± 0.02 efg0.57 ± 0.15 D
200.59 ± 0.2 de0.58 ± 0.02 ef0.63 ± 0.03 bcd0.66 ± 0.01 b0.61 ± 0.04 C
Mean0.64 ± 0.08 A0.57 ± 0.14 B0.64 ± 0.05 A0.63 ± 0.08 A
EC00.26 ± 0.02 ab0.31 ± 0.04 ab0.32 ± 0.04 a0.25 ± 0.03 ab0.29 ± 0.04 A
50.29 ± 0.03 ab0.23 ± 0.01 b0.27 ± 0.04 ab0.29 ± 0.05 ab0.27 ± 0.03 A
100.31 ± 0.07 ab0.27 ± 0.03 ab0.27 ± 0.03 ab0.28 ± 0.05 ab0.28 ± 0.02 A
150.30 ± 0.07 ab0.30 ± 0.07 ab0.32 ± 0.08 a0.29 ± 0.08 ab0.30 ± 0.01 A
200.30 ± 0.07 ab0.28 ± 0.03 ab0.32 ± 0.05 a0.27 ± 0.02 ab0.29 ± 0.02 A
Mean0.29 ± 0.02 A0.28 ± 0.03 A0.30 ± 0.03 A0.28 ± 0.02 A
Means in each category followed by different letters are significantly different at p ≤ 0.05.
Table 4. Effect of biochar (BC) and nitrogen (N) application on maize grain yield (kg ha−1).
Biochar (t ha−1).Nitrogen (kg ha1)Means
0100150200
02602.7 ± 41.04 k3106.7 ± 75.11 h4147.7 ± 84.52 f4678.0 ± 46.2 e3633.75 ± 935.9 E
52709.0 ± 17.32 j3145.3 ± 38.9 gh4277.7 ± 15.37 ef4587.7 ± 27.32 cd3679.92 ± 896.2 D
102926.7 ± 60.28 i3425.3 ± 24.73 g4507.3 ± 17.04 cd4788.3 ± 44.1 cd3911.92 ± 881.3 C
154058.0 ± 86.88 f4025.0 ± 34.87 ef4741.7 ± 15.28 cd4616.0 ± 71.51 bc4360.17 ± 371.8 B
204147.3 ± 105.11 f4030.7 ± 30.01 d4645.0 ± 45.64 b5141.3 ± 96.06 a4491.08 ± 508.8 A
Mean3288.7 ± 752.8 D3546.6 ± 456.19 C4463.9 ± 248.26 B4762.3 ± 225.5 A
Means in each category followed by different letters are significantly different at p < 0.05.
Table 5. Macro-elements’ concentration of maize grains (mg kg−1) as affected by different biochar (BC) and nitrogen (N) levels.
ElementBiochar (t ha−1)Nitrogen (kg ha−1)Mean
0100150200
K04133.09 ± 26.14 h4330.52 ± 4.43 fgh4342.71 ± 23.37 fgh4470.60 ± 7.74 efg4319.23 ± 139.33 D
54225.53 ± 9.511 gh4325.20 ± 18.69 fgh4369.28 ± 11.65 fgh5054.11 ± 6.88 b4493.53 ± 378.28 C
104520.30 ± 13.44 ef4496.77 ± 9.05 ef4772.54 ± 3.79 cd5549.09 ± 27.45 a4834.68 ± 492.36 A
154356.38 ± 14.72 de4691.64 ± 15.75 de4667.69 ± 7.55 de4970.18 ± 8.84 bc4671.47 ± 250.95 B
204158.28 ± 5.93 h4491.16 ± 4.75 ef4682.32 ± 7.84 de4792.81 ± 12.70 cd4531.14 ± 278.06 C
Mean4278.72 ± 160.42 C4467.05 ± 150.16 B 4566.91 ± 196.91 B4967.36 ± 394.71 A
p03040.76 ± 6.77 g3169.06 ± 27.58 de3372.95 ± 19.87 c3420.17 ± 18.04 b3250.73 ± 177.39 E
53303.52 ± 10.17 fg3445.92 ± 13.33 de3759.75 ± 27.59 c4025.80 ± 3.84 ab3633.75 ± 323.48 B
103408.00 ± 34.40 def3503.58 ± 3.79 d3777.04 ± 8.00 c4133.48 ± 26.59 a3705.52 ± 325.35 A
153339.92 ± 3.55 efg3417.17 ± 17.14 de3447.11 ± 20.89 de3409.72 ± 5.96 def3403.48 ± 45.35 C
203002.72 ± 20.91 h3392.79 ± 3.18 def3430.98 ± 2.57 de3432.94 ± 16.72 g3314.86 ± 208.91 D
Mean3218.98 ± 184.41 D3385.70 ± 127.96 C3557.57 ± 194.52 B3684.42 ± 362.88 A
Ca0174.74 ± 9.85 fg203.38 ± 26.97 b–f188.53 ± 3.42 d–g192.88 ± 18.50 c–f189.88 ± 11.86 D
5214.80 ± 2.78 a–e183.90 ± 35.97 e–g184.22 ± 6.78 e–g216.45 ± 2.01 a–e199.84 ± 18.24 CD
10207.54 ± 15.38 b–f238.10 ± 7.50 ab231.02 ± 4.68 ab247.60 ± 5.06 a231.07 ± 17.09 A
15247.99 ± 9.47 a215.33 ± 4.62 a–e223.38 ± 3.17 a–d214.06 ± 6.77 a–e225.19 ± 15.75 AB
20155.15 ± 6.50 g228.67 ± 19.91 a–c237.99 ± 6.47 ab224.64 ± 12.82 a–c211.61 ± 38.05 BC
Mean200.05± 36.15 B213.88 ± 21.31 A213.03 ± 24.92 A219.13 ± 19.77 A
Mg01450.85 ± 2.90 g–j1451.42 ± 1.68 f–j1427.95 ± 1.14 h–j1498.09 ± 6.10 a–h1457.08 ± 29.45 B
51444.91 ± 0.64 e–j1468.45 ± 1.06 d–j1408.16 ± 4.79 ij1520.55 ± 1.37 a–g1460.52 ± 47.09 B
101495.67 ± 8.03 a–i1529.55 ± 3.52 a–f1571.94 ± 1.63 ab1582.05 ± 1.50 a1544.80 ± 39.96 A
151447.88 ± 3.32 f–j1491.46 ± 0.91 b–i1546.84 ± 6.09 a-d1550.61 ± 1.28 a–c1509.20 ± 49.01 AB
201394.71 ± 2.56 j1482.04 ± 2.54 c–i1542.31 ± 0.88 a–e1560.89 ± 13.31 a–c1494.99 ± 74.85 AB
Mean1446.81 ± 35.79 C1484.58 ± 29.05 BC1499.44 ± 75.47 AB1542.44 ± 33.25 A
Means in each category followed by different letters are significantly different at p < 0.05.
Table 6. Micro-elements’ concentration of maize grains (mg kg−1) as affected by different biochar (BC) and nitrogen (N) levels.
ElementBiochar (t ha−1)Nitrogen (kg ha−1)Means
0100150200
Zn024.53 ± 0.29 b–f26.12 ± 1.62 ab27.03 ± 0.16 a26.36 ± 0.37 ab26.01 ± 1.06 A
522.30 ± 0.44 fg23.13 ± 0.70 de–g25.29 ± 0.94 a–d26.98 ± 0.17 a24.43 ± 2.12 B
1022.12 ± 0.38 fg22.91 ± 0.23 d–g25.80 ± 0.08 a–c22.73 ± 6.03 e–g23.39 ± 1.64 B
1522.61 ± 0.51 e–g23.45 ± 0.29 c–g22.69 ± 0.18 c–g24.41 ± 0.35 b–g23.29 ± 0.84 B
2022.01 ± 0.37 g21.98 ± 0.37 g23.96 ± 0.12 b–g24.84 ± 0.54 a–e23.19 ± 1.43 B
Mean22.71 ± 1.04 B23.52 ± 1.55 B24.95 ± 1.68 A25.06 ± 1.68 A
Fe030.57 ± 0.67 b–f32.51 ± 0.62 ab33.10 ± 0.98 a32.92 ± 0.20 a32.28 ± 1.16 A
530.66 ± 0.67 b–e30.94 ± 0.52 a–d31.13 ± 0.57 a–c30.25 ± 0.70 c–f30.75 ± 0.38 B
1028.58 ± 0.77 e–h28.65 ± 3.03 e–h31.35 ± 3.85 a–c31.22 ± 1.15 a–c29.95 ± 1.54 C
1527.33 ± 0.56 hi25.80 ± 0.70 ij27.56 ± 1.54 g–i31.63 ± 0.74 a–c28.08 ± 2.49 D
2024.49 ± 0.98 j28.43 ± 0.92 f–h28.82 ± 0.68 d-h29.57 ± 0.26 c–g27.83 ± 2.27 D
Mean28.33 ± 2.56 B29.27 ± 2.57 B30.39 ± 2.19 A31.12 ± 1.29 A
Cu02.80 ± 0.58 d–f3.30 ± 0.17 a3.06 ± 0.03 a–c2.32 ± 0.04 hi2.87 ± 0.42 A
52.67 ± 0.24 e–g2.64 ± 0.05 fg3.15 ± 0.03 ab2.90 ± 0.05 b–e2.84 ± 0.24 A
102.49 ± 0.12 gh2.69 ± 0.02 d–g2.26 ± 0.03 hi2.95 ± 0.10 b–d2.60 ± 0.29 B
152.51 ± 0.11 gh2.17 ± 0.004 i2.51 ± 0.01 gh2.84 ± 0.11 c–f2.51 ± 0.27 B
202.06 ± 0.02 i2.16 ± 0.03 i2.70 ± 0.07 d–g3.16 ± 0.01 ab2.52 ± 0.51 B
Mean2.51 ± 0.28 B2.59 ± 0.47 B2.74 ± 0.37 A2.83 ± 0.31 A
Means in each category followed by different letters are significantly different at p < 0.05.
Publisher’s Note: MDPI stays neutral with regard to jurisdictional claims in published maps and institutional affiliations.

