Article

Prediction of Resin Production in Copal Trees (Bursera spp.) Using a Random Forest Model

by
Julio César Buendía-Espinoza
1,
Elisa del Carmen Martínez-Ochoa
2,*,
Rosa María García-Nuñez
1,*,
Selene del Carmen Arrazate-Jiménez
1 and
Alejandro Sánchez-Vélez
3
1
Maestría en Agroforestería para el Desarrollo Sostenible, Departamento de Suelos, Universidad Autónoma Chapingo, Carretera México-Texcoco Km 38.5, Texcoco 56230, Estado de México, Mexico
2
Academia de Ciencias Básica, Centro de Bachillerato Tecnológico No.3, Texcoco, Empedradillo S/N, San Diego, Texcoco 56200, Estado de México, Mexico
3
Departamento de Ciencias Forestales, Universidad Autónoma Chapingo, Carretera México-Texcoco Km 38.5, Texcoco 56230, Estado de México, Mexico
*
Authors to whom correspondence should be addressed.
Sustainability 2022, 14(13), 8047; https://doi.org/10.3390/su14138047
Submission received: 21 May 2022 / Revised: 28 June 2022 / Accepted: 28 June 2022 / Published: 1 July 2022
(This article belongs to the Special Issue Biodiversity and Natural Resources Management)

Abstract

:
Non-timber forest products (NTFPs) are essential for community development, but their enormous demand has posed a serious threat to trees growing in their natural habitat. Copal resin is one of these products, which has a great deal of religious and ceremonial significance in Mexico and around the world. Resin extraction from a tree depends on its morphological and physiological characteristics, as well as its physical and sanitary condition. In this study, a methodology was proposed for determining the yield and health status of Copal trees, and a random forest (RF) model was developed to explain their resin production based on their morphological and condition characteristics. The experiment was conducted in the Agua Escondida watershed in Puebla, Mexico. With the training data, the average accuracy of the model was 99%, with a Kappa index of 98%, which is considered an excellent level of agreement beyond chance, and with the validation data, the average accuracy was 71% and 47%, which is considered a good level of agreement beyond chance. Tree condition was the most important factor affecting resin production in Copal trees, followed by stem diameter (33 and 38 cm), height (2 and 2.5 m), and diameter of secondary branches (from 8 to 15, 22 and 32 cm).

1. Introduction

Non-timber forest products (NTFPs), also known as non-timber forest benefits, are plant and animal products and services, excluding timber, that are derived from forests harvested by human beings [1]. NTFPs can be classified into a variety of categories, including fibers, gums, waxes, rhizomes, bush soil and resins [2]. NTFPs found in tropical deciduous forests have a great deal of importance for the development of rural communities living in or near the forests, which are continually harvested [2,3]. Tadesse et al. [4] reported that gum Arabic, frankincense, and myrrh are produced from gum and resin from the Leguminoseae and Burseraceae families. Gums such as chicle, latex, rubber, conifer resins for making turpentine, bursera resins for making copal, and linaloe essential oils are the most important NTFPs in Mexico [5]. Copal resin, derived from species of the Bursera genus, is one of the most important NTFPs in this type of vegetation. Among the most important species of this genus in Mexico’s tropical deciduous forests, Bursera bipinnata (Sessé & Moc.) Engl. and Bursera copallifera (Sessé & Moc. Ex DC.) Bullock. are the species that produce the most valuable resin for Copal producers [6,7]. Copal is a resin with economic and religious significance. In temples, Copal is burned as a means of purification [6] and is thought of as a sacred food present in offering rituals [8]. Numerous factors, however, threaten the survival of Copal-producing species within the plant community. For instance, overgrazing reduces the number of seedlings that can replace older trees [9], and the demand for product leads to ignoring the extraction and rest times necessary for trees to recover after harvest [6]. The extraction method is another possible cause of the decline in natural populations, which can have ecological and economic consequences. The process of cutting involves making a series of V-shaped incisions in the bark of the trunk and in the thick branches of the tree, which creates an environment conducive to the development of pests and diseases [10]. Mexican Official Standards for Copal resin harvesting call for management plans that include an inventory and yield calculation [11]. The trees are usually found on communal properties where many extractors gather; thus, there is no formal organization, and producers do not follow sustainable practices. No studies specify how much resin can be extracted from a tree based on its morphological and physiological characteristics [12]. In the region of Izúcar de Matamoros, Puebla, as well as in many other parts of Mexico and the world, Copal continues to be a significant element of religious ceremonies, especially for the Day of the Dead, when people who have died are prayed for and honored, but its excessive demand has caused serious degradation to its natural environment [6].
Non-parametric methods are attractive for classification, since they allow one to use arbitrary data distributions without assuming that the shapes of the underlying densities are known [13]. Random forest (RF) is a nonparametric supervised machine learning classification algorithm [14] that is highly accurate and robust to noise [14,15,16]. The RF method is capable of evaluating complicated interactions between variables because it automatically selects the most significant variables, regardless of the number of variables initially used [14,17,18]. The configuration of an RF is straightforward in comparison to other non-parametric methods, as no complex parameter settings are required.
This study aimed at: (1) proposing factors and indicators to estimate Copal tree condition and resin production guiding by the structure of Webster’s Guide for the evaluation of urban trees [19]; and (2) identifying which morphological and condition variables of Copal trees affect resin production via random forest classification.

2. Materials and Methods
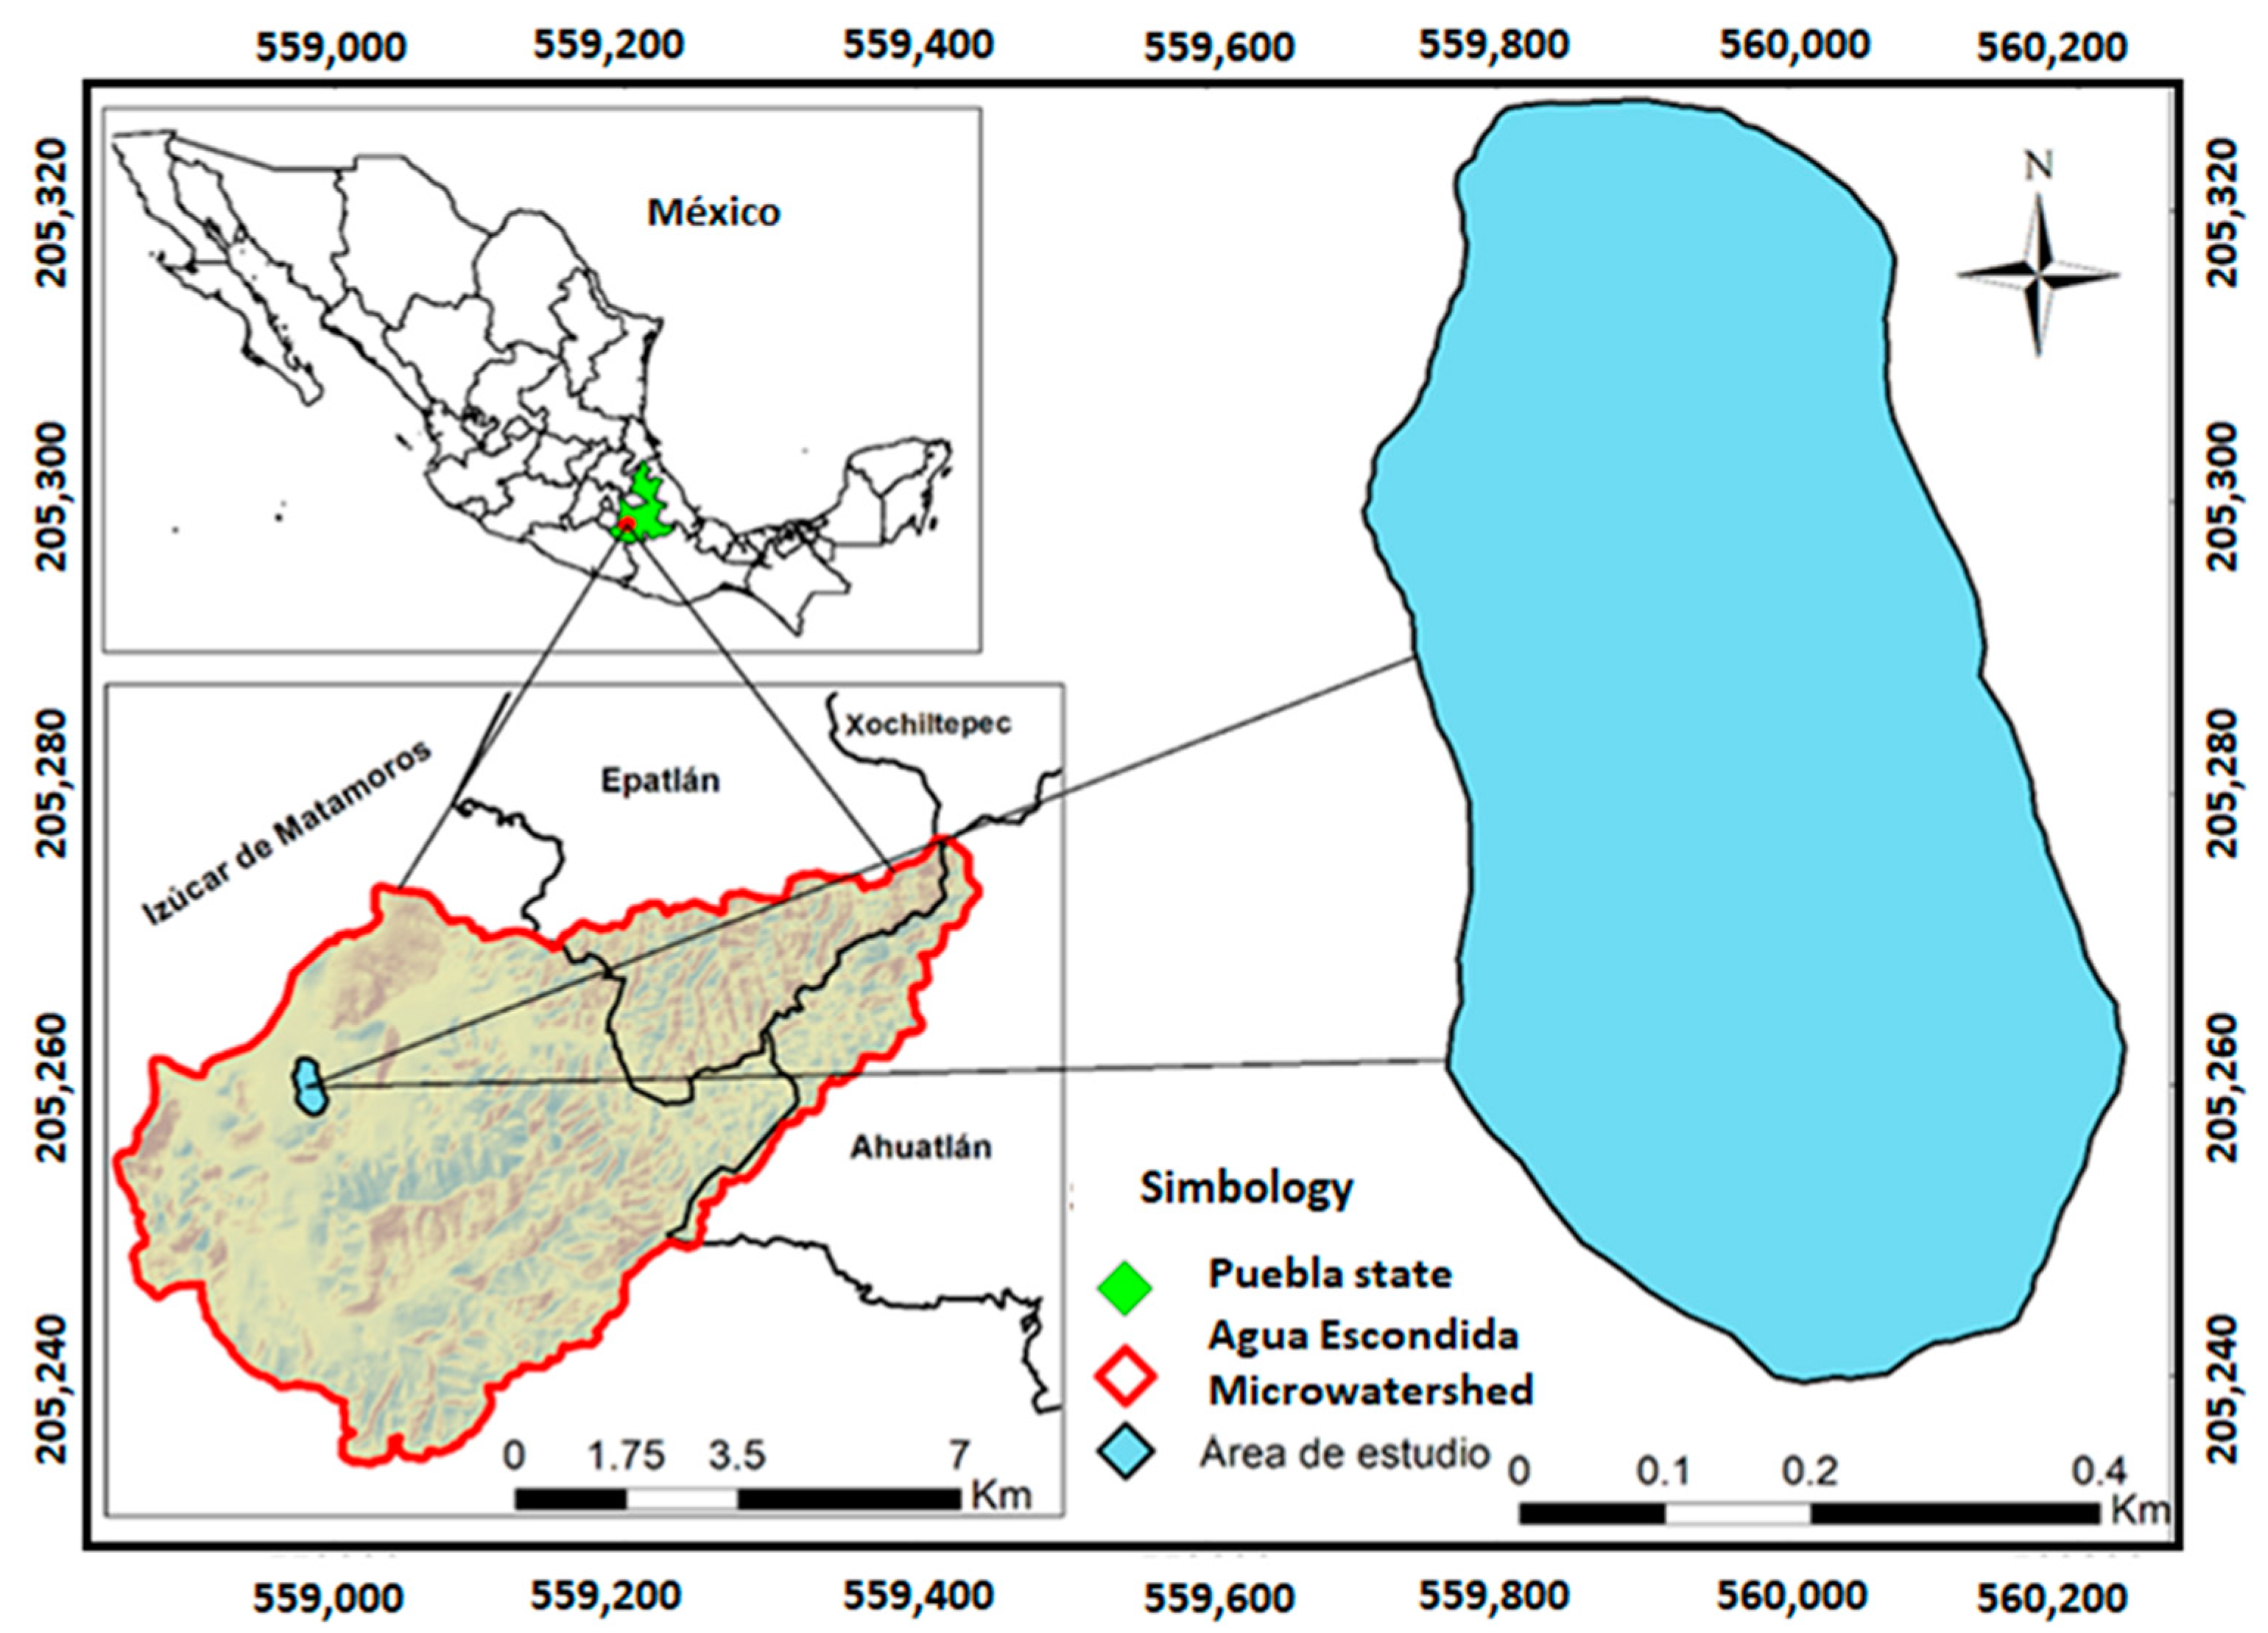
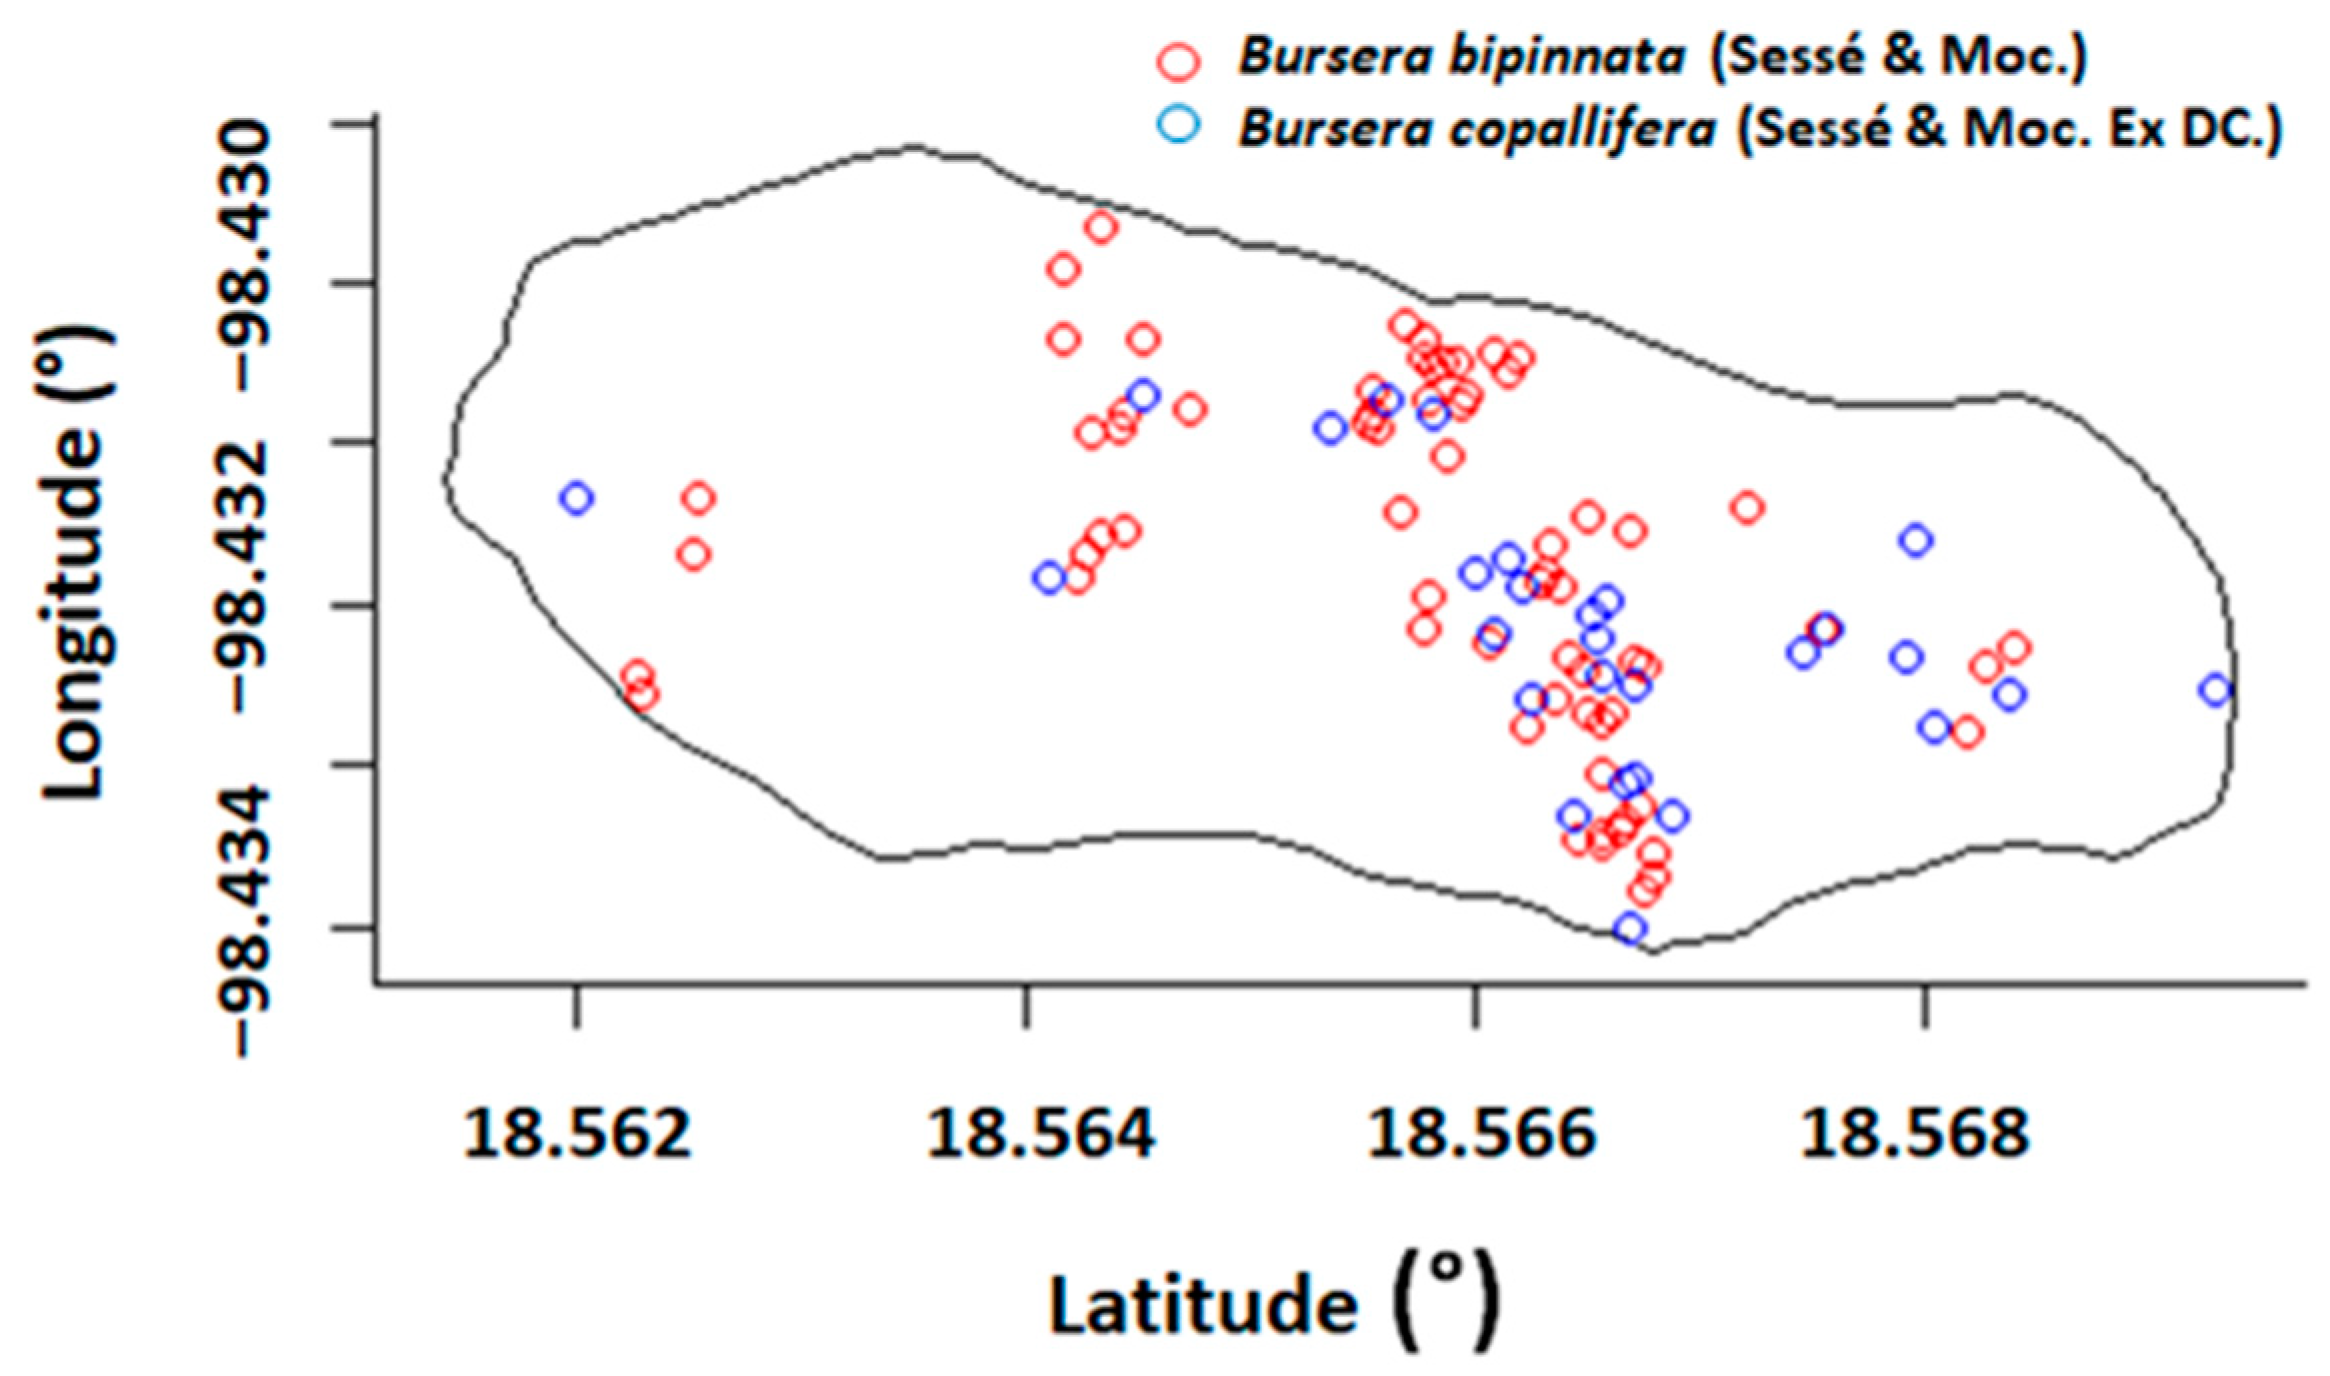
2.1. Study Area

The study area was the Agua Escondida watershed located in the municipalities of Izúcar de Matamoros, Epatlán, Ahuatlán and Xochiltepec in the Puebla state (Figure 1), with elevations from 1100 to 1600 m and an area of 6492 ha as well as a temperature range from 19 to 25 °C and a precipitation range from 700 to 900 mm per year. The predominant soils within the watershed are leptosol, vertisol and regosol, with two main climates: warm sub-humid with summer rains and semi-warm sub-humid with summer rains. Primary land use is agriculture, and the predominant vegetation type is low deciduous forest [20,21,22].
Experimental site. The experimental site was the Ejido San Juan Raboso, municipality of Izucar de Matamoros, located in the region of Cerro de la Virgen, within the Agua Escondida watershed (Figure 1), with an elevation 1282 m and an area of 30.8 ha. The predominant soils are leptosol and vertisol. The main climate is warm sub-humid with summer rains and a temperature range of 18 to 26 °C and precipitation range of 700 to 900 mm per year [22]. Tropical deciduous forest is predominant in this area, typical of an area with two distinct seasons of moisture availability, rainy and dry [23], as well as species that lose their leaves in the dry season, and others with thorny and corky protuberances with sparse and open crowns [24].

2.2. Response Variable

Resin production. For the selection of Copal trees for resin extraction, the amount of resin produced is the primary criterion; however, there is no established method to estimate this quantity. According to Copal growers in this region and other regions [8,25], morphological characteristics affect resin production. Copal resin production was evaluated using the factors and indicators listed in Table 1. Based on the experimental knowledge of Copal producers as well as the scientific knowledge of the researchers, factors and indicators were developed guiding by the structure of Webster’s Guide for the evaluation of urban trees [19]. Resin production was categorized as high, medium, or low according to the sum of the main diameter, height, diameter of secondary branches 1 and 2, and condition of each Copal tree (Table 1). Each of the three production categories, high, medium, and low, was coded as a dummy variable of 2, 1, or 0.

2.3. Explanatory Variables

Condition. One of the most important criteria used by coppice growers to select trees for harvest is their condition. The condition of the tree is defined by many structural factors, such as its appearance, age and condition of the stem [25]. Based on the factors and indicators proposed in Table 1, the condition of Copal trees was evaluated. Factors and indicators were developed based on the experimental knowledge of Copal producers and the scientific knowledge of the researchers guiding by the structure of Webster’s Guide for the evaluation of urban trees [19]. The condition of the trees was assessed in terms of good, regular, or unsatisfactory based on the sum of the indicators, such as the condition of the stembark, branch elongation, branching structure, and damage caused by pests, diseases, and epiphytes, as well as by the percentage of canopy cover (Table 2). Each of the three condition categories, good, regular, and unsatisfactory, was coded as a dummy variable as 2, 1, or 0.
Main stem diameter. One of the most important morphological characteristics of Copal trees affecting the amount of resin extracted is the diameter of the main stem. Smaller diameters than 10 cm cannot be used for extraction due to their low yield, and their exploitation would reduce their production capacity in the future [25,26]. Its code in the model was diameter.
Diameter of secondary branches 1 and 2. Another important morphological characteristic for determining Copal resin content is the diameter of the secondary branches [25,27]. Their codes in the model were dia1 and dia2, respectively.
Total tree height. Copal resin production may also be influenced by its height [25]. Its code in the model was alt.

2.4. Measurement of Variables and Database

Data on the vegetation in the study area were collected using simple random sampling. The sampling unit consisted of a quadrant of 10 square meters [28]. A total of 3097 sampling units (SU) was estimated in the area of 30.8 ha. Within the study area (Figure 2), 100 Copal sampling units were located where their geographic coordinates were recorded, their current condition was evaluated, and their morphological variables of total height, stem diameter, and diameter of two secondary branches were measured [25,29].
Geographic coordinates for each tree were determined by using a global positioning device. Each tree was examined by experienced Copal growers based on factors such as bark condition, branch structure, damage caused by pests, diseases, and epiphytes, percent canopy cover, and branch elongation as measured with a diametric tape (Table 2). Due to their irregular height, the diameter of the stem was measured below the secondary branches using a diametric tape. In many instances, the diameter was the same as the diameter at breast height at 1.30 m above ground level. The diameter of the secondary branches was measured using a diametric tape (diameter of branch 1 and diameter of branch 2). Although some trees had more than two secondary branches, only two were measured, which are most commonly used by Copal producers for extraction of resin. With a Haga-type hypsometer, the height of the tree was measured from ground level to the apex of the canopy. For estimating resin production by each tree, morphology and condition were observed in the field (Table 1).

2.5. Variable Selection

Multicollinearity occurs when two or more predictor variables are closely correlated, which results in less precise estimates of the dependent variable due to the effect of an independent variable on the dependent variable, as opposed to when the independent variables are uncorrelated [30]. Multicollinearity between Copal explanatory variables was assessed with Pearson’s linear correlation coefficient r to evaluate the association between variables [31] and with the variance inflation factor (VIF) to estimate how the variance increases when predictors are correlated [32]. With the Corrplot [33] and Usdm [34] packages of the R statistical language [35], Pearson’s linear correlation and VIF between predictor variables were verified with the objective of avoiding multicollinearity effects and maximizing the contributions of variables [36]. Pearson’s correlation coefficients, | r | , > ~ 0.70 [37] and variables with a VIF greater than four were removed from the model because they represent a significant correlation between them [38].

2.6. Decision Tree

This paper presents the development and validation of a random forest classification model to explain Copal resin production as a function of both morphological and environmental variables, in Ejido San Juan Raboso, located in the Agua Escondida watershed.

2.6.1. Random Forest

RF is a nonparametric supervised machine learning classification algorithm that uses decision trees to identify predictive variables from a portion of the data used to train the model and the remainder to estimate the model’s performance [14]. A predictor variable is considered significant in a classification model if, by omitting it, the out of bag error (OOB) is increased. The model creates many classification trees, each based on bootstrap samples to improve the predictive ability of the model [39]. For RFs, each split of a tree is determined by using a random subset of normalized input factors at each node. Model output is the average of all trees [40]. The RF was run with 75% of the data for training, and the number of trees in the forest (ntree) and number of randomly sampled variables as candidates for each split (mtry) were determined a priori. These parameters were optimized to minimize the model generalization error (OOB) in order to obtain the best predictive power. Based on a set of starting data, the algorithm combines many decision trees by choosing explanatory variables (Table 2) at each node of the tree [41]. Twenty-five percent of the remaining data was used for model validation, which is the most important component of any modeling process to ensure that the results are suitable for scientific studies [42]. Model prediction was performed using the random forest package [43] in R software [35].

2.6.2. Accuracy Assessment

Based on the observational errors of the training dataset that are left out during the process of building each tree, the performance of each model was estimated through the OOB method that is used to evaluate the accuracy of a random forest. The estimate is based on the prediction that you obtain for each data point by averaging only those trees for which the record was not included in the training set [15]. The predictions were validated using the confusion matrix [44] and the Kappa concordance index [45,46]. The overall prediction accuracy is the proportion of correct predictions made by the model for a given class and is calculated as the sum of the total number of correct predictions divided by the total number of predictions made. Kappa accuracy, also known as the Kappa concordance coefficient, is a metric that is used to assess the expected error rate, and it is calculated by subtracting the expected accuracy ( E ) from the observed accuracy ( O ) and dividing that by 1 minus the expected accuracy, ( O E ) ( 1 E ) . Based on Fleiss et al. [47], values above 0.75 represent excellent levels of agreement beyond chance, values below 0.40 suggest low levels of agreement beyond chance, and values between 0.40 and 075 indicate good levels of agreement beyond chance.

2.6.3. Identification of Significant Variables

The mean decrease Gini coefficient (MDG) and mean decrease accuracy (MDA) were used to determine the relative importance of the variables [48]. The first measure is the degree of homogeneity between the nodes and leaves of the classification tree, which means that variables with higher values are more useful in identifying well-differentiated classes (measures the variance between classes of the response variable). The second measure measures the loss of accuracy of the RF as a result of removing a certain variable from the classification. Thus, variables with high values are more important for the classification of the data [49]. For each tree, the two measures of importance are computed separately and are averaged over the entire forest [16,43,49].

2.6.4. Partial Dependence Plot (PDP)

PDP indicates the marginal influence of one or two features on the predicted outcome of a machine learning model [50] and can be used to determine whether the relationship between a target and a feature is linear, monotonic, or more complex.

3. Results

3.1. Database and Variable Selection

The present study examined a total of 100 Copal trees, recorded their geographic coordinates, analyzed their current status, and measured three morphological variables: total height, stem diameter, and diameter of two secondary branches. Four continuous variables (stamen diameter, diameter of secondary branch 1, diameter of secondary branch 2, and tree height) and one categorical variable (condition, Table 2) were used as predictors. Production was considered as a response variable with three levels (Table 1). Based on linear correlation, r, and VIF, the variable secondary branch diameter 1 was excluded from the subsequent modeling process due to its high correlation.

3.2. Decision Trees

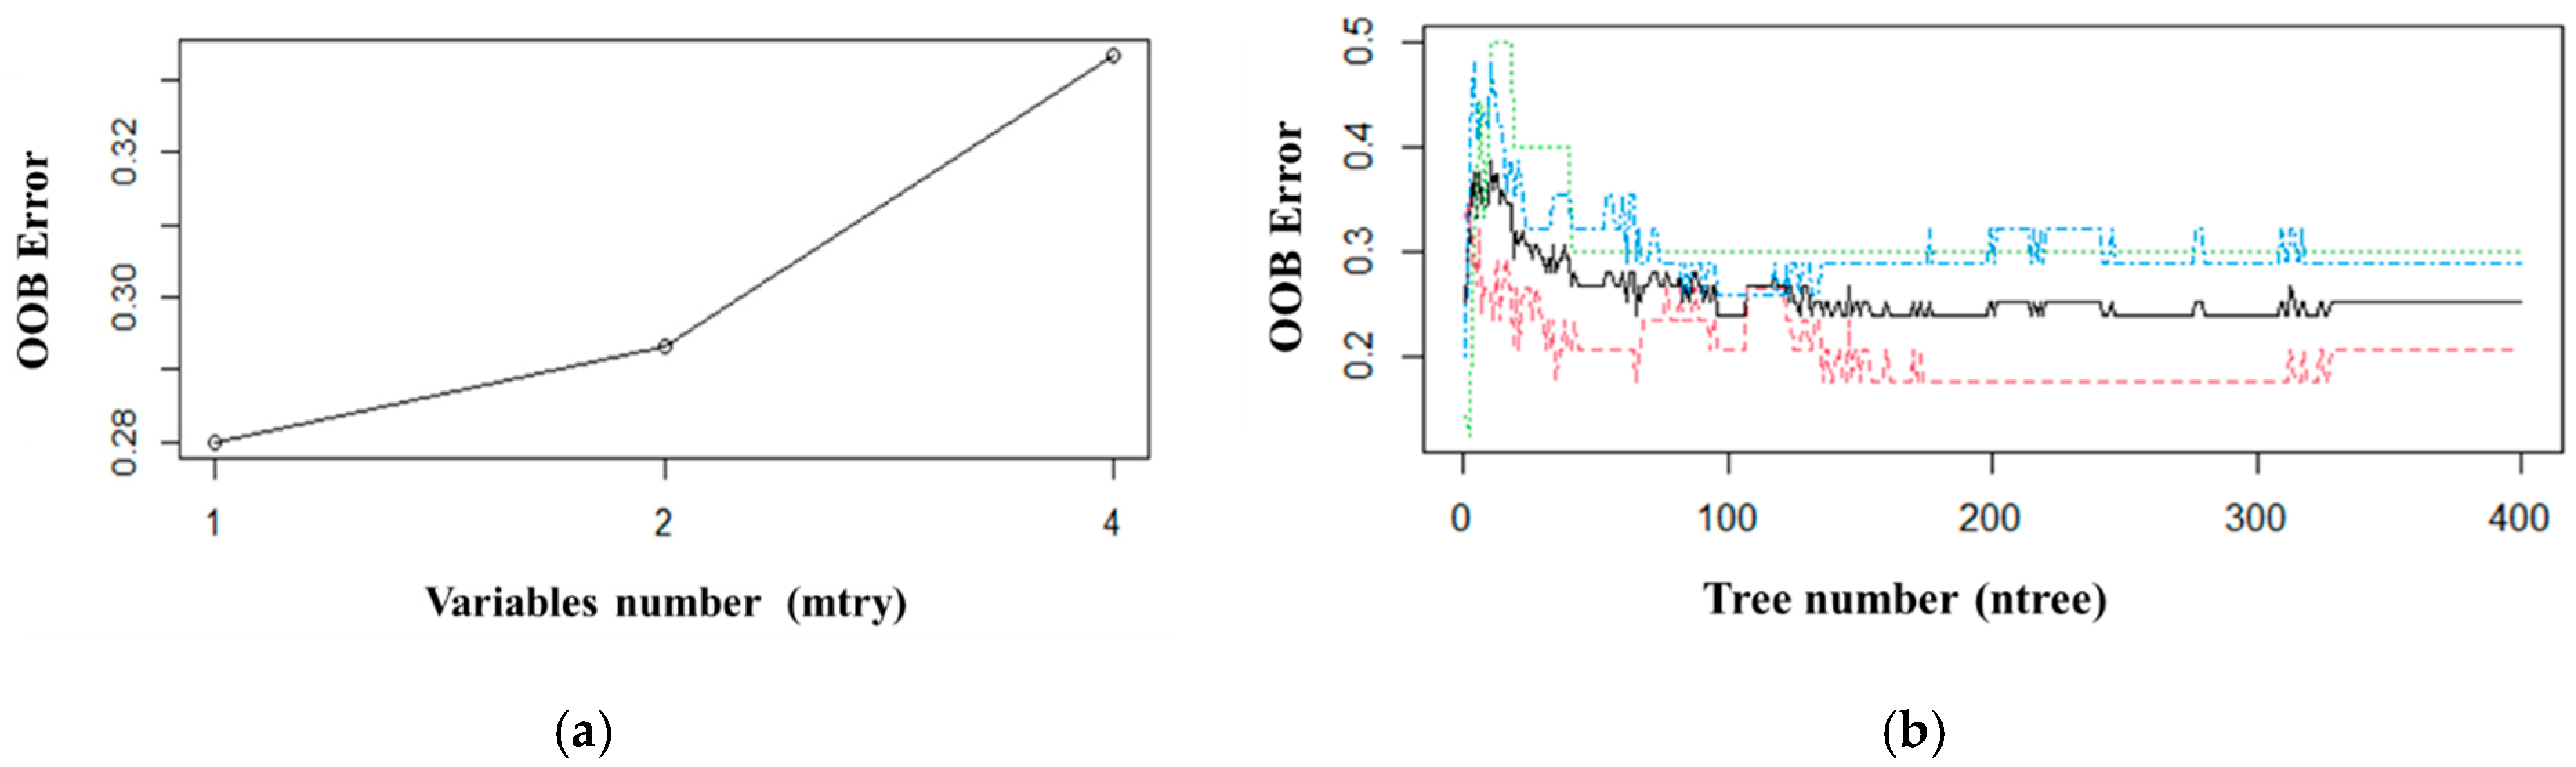
3.2.1. Random Forest

The two key hyperparameters, the number of trees (ntree) and the number of variables in each split (mtry) were determined using the exhaustive method. The initial set of data consisted of 500 trees (ntree) and two variables at every node (mtry), which were determined using the square root of the total number of predictor variables ( 4   variables = 2 ) . RF model parameters mtry and ntree were optimized in order to maximize the predictive accuracy of the estimation. Seventy-six percent of the field data (n = 76) was used to evaluate model performance. The OOB estimate for the RF model error rate was 30.67 percent. Using the exhaustive method, the number of variables (mtry) in the default RF model were assigned from one to four, and the other parameters were fixed to obtain the minimum error rate. Using the same method, ntree was taken to the transversal algorithm by setting the value of mtry. Figure 3 illustrates the results and processes.
A set of parameter combinations was tested across five ntree levels (50, 100, 400, 500, and 1000) and four mtry levels (1 to 4). For stable results, the maximum value of ntree was 1000 [14,51]. The optimum setting of the parameters was mtry = 1 and ntree = 400, resulting in a model error rate of 28.05 percent (Figure 3).

3.2.2. Accuracy Assessment

The chosen model adequately classified 99% of the three resin production classes of Copal trees and achieved a Kappa index of 98% with the training data, 71% and 47% with the validation data, as well as the lowest OOB with 28% with the lowest number of classification trees at 400. The confusion matrices of the final model are shown in Table 3 for the training and validation sets.
From the training data, 100%, 100% and 97% of the total number of trees with high, low and medium resin production were correctly classified. Likewise, 100%, 99% and 100% of trees that did not correspond to high, low and medium resin production were correctly classified. From the validation data, 90%, 0%, and 62% of the total number of predicted trees with high, low and medium resin production were correctly classified by the model, while 71%, 96%, and 80% of trees that did not correspond with high, medium, and low resin production were correctly classified by the model.

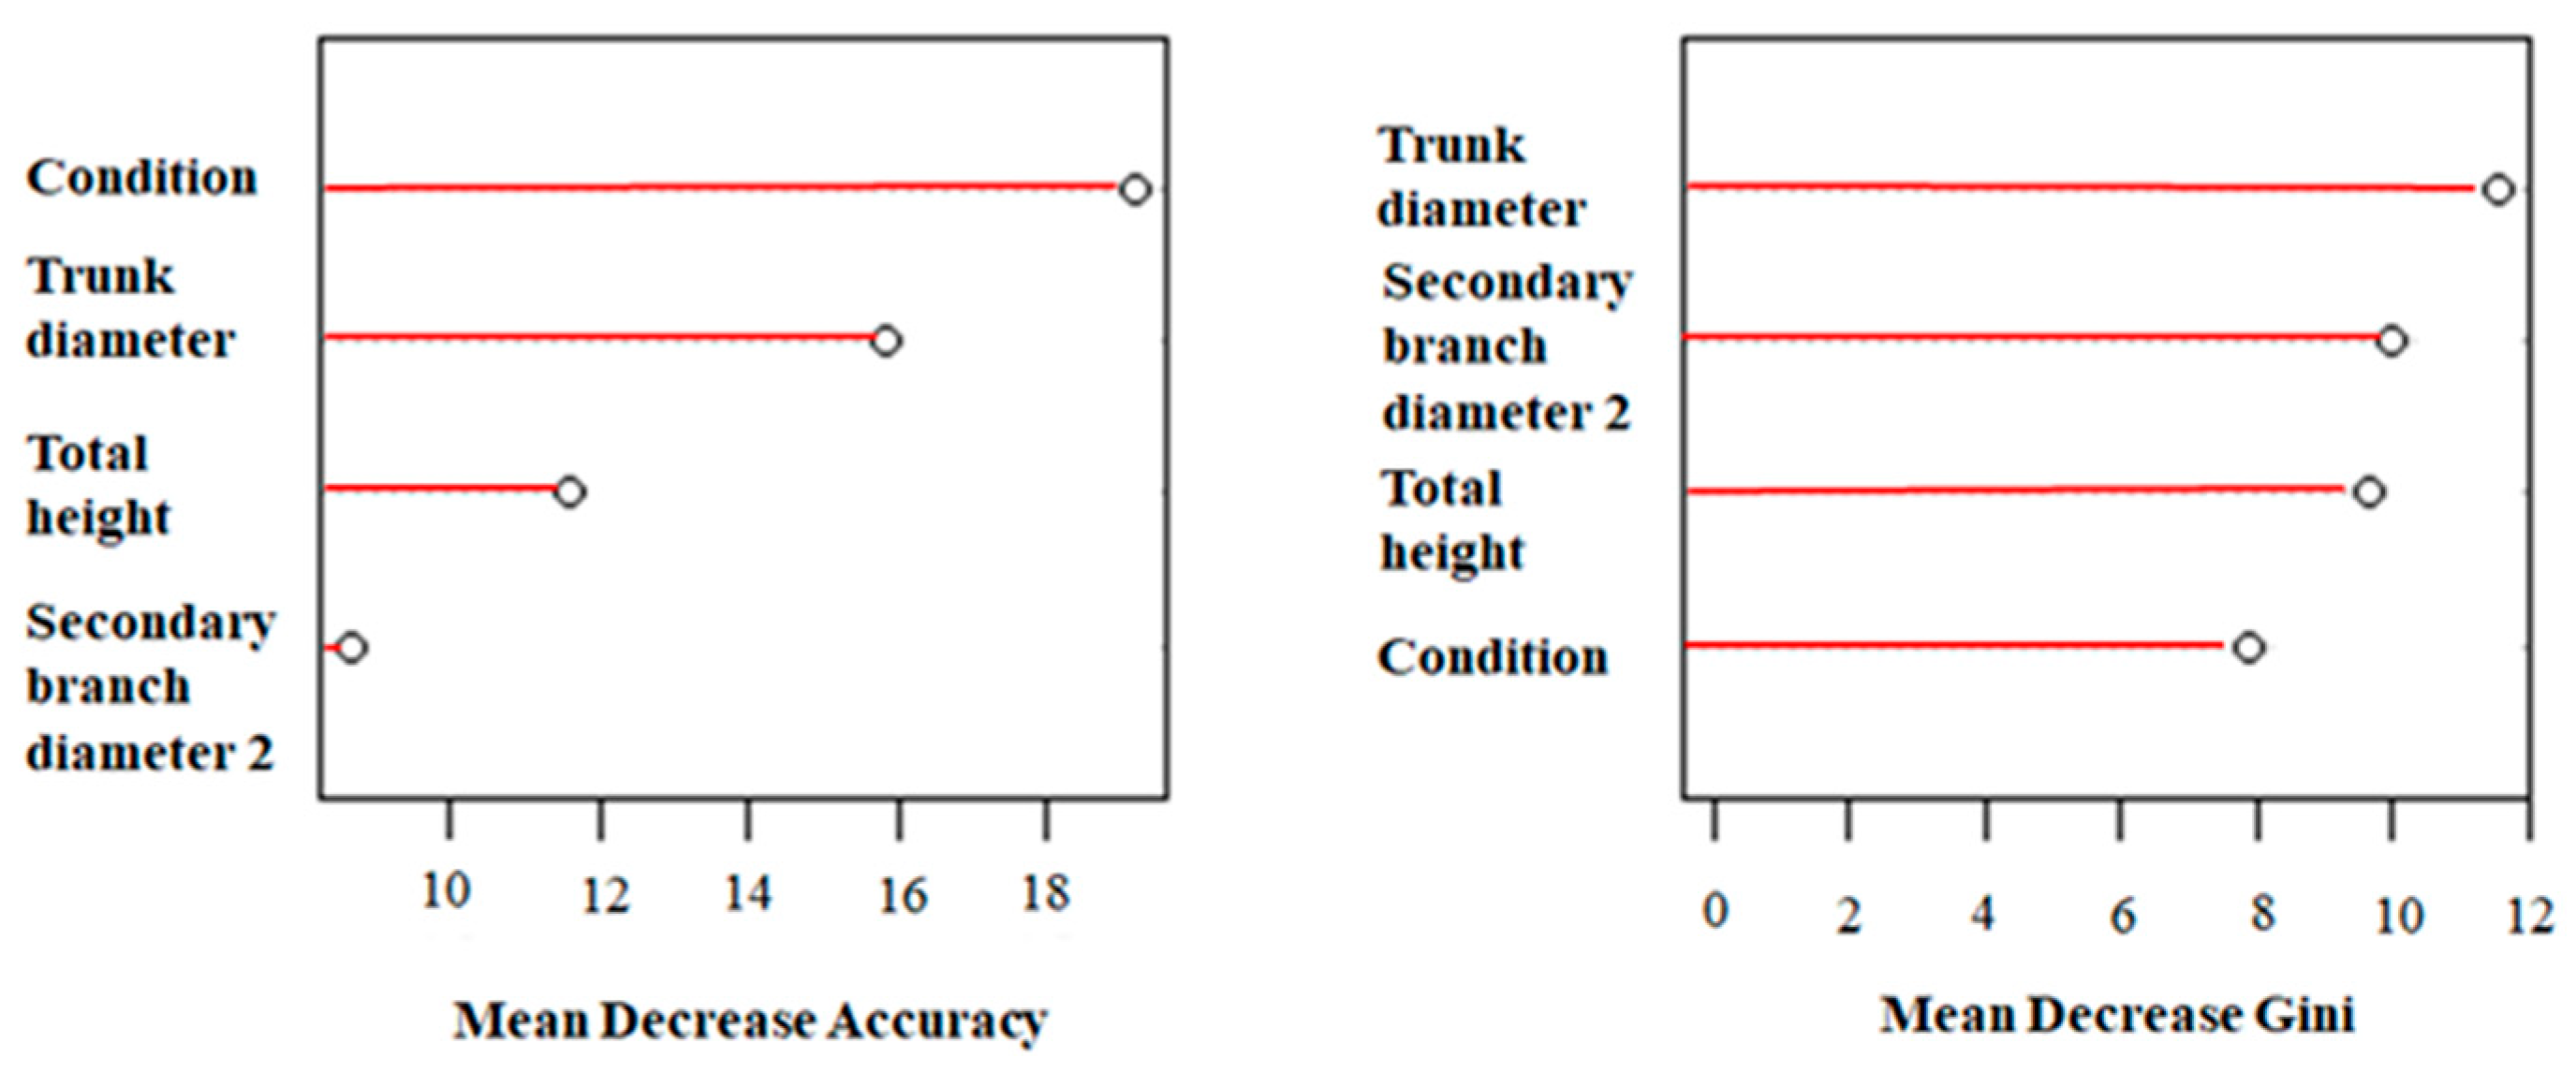
3.2.3. Identification of Significant Variables

Figure 4 illustrates the relative contribution of the four most important predictor variables according to the mean decrease in precision and the mean decrease in the Gini coefficient, obtained by following the OOB minimum error principle.
Considering the mean decrease in precision, the condition variable is the most important variable within the model (the selection of this variable is indicative of the largest change in model precision), followed by tree diameter, tree height, and secondary branch diameter 2. MDG indicated that stem diameter was the variable with the highest homogeneity of data, followed by branch diameter 2, tree height, and condition.

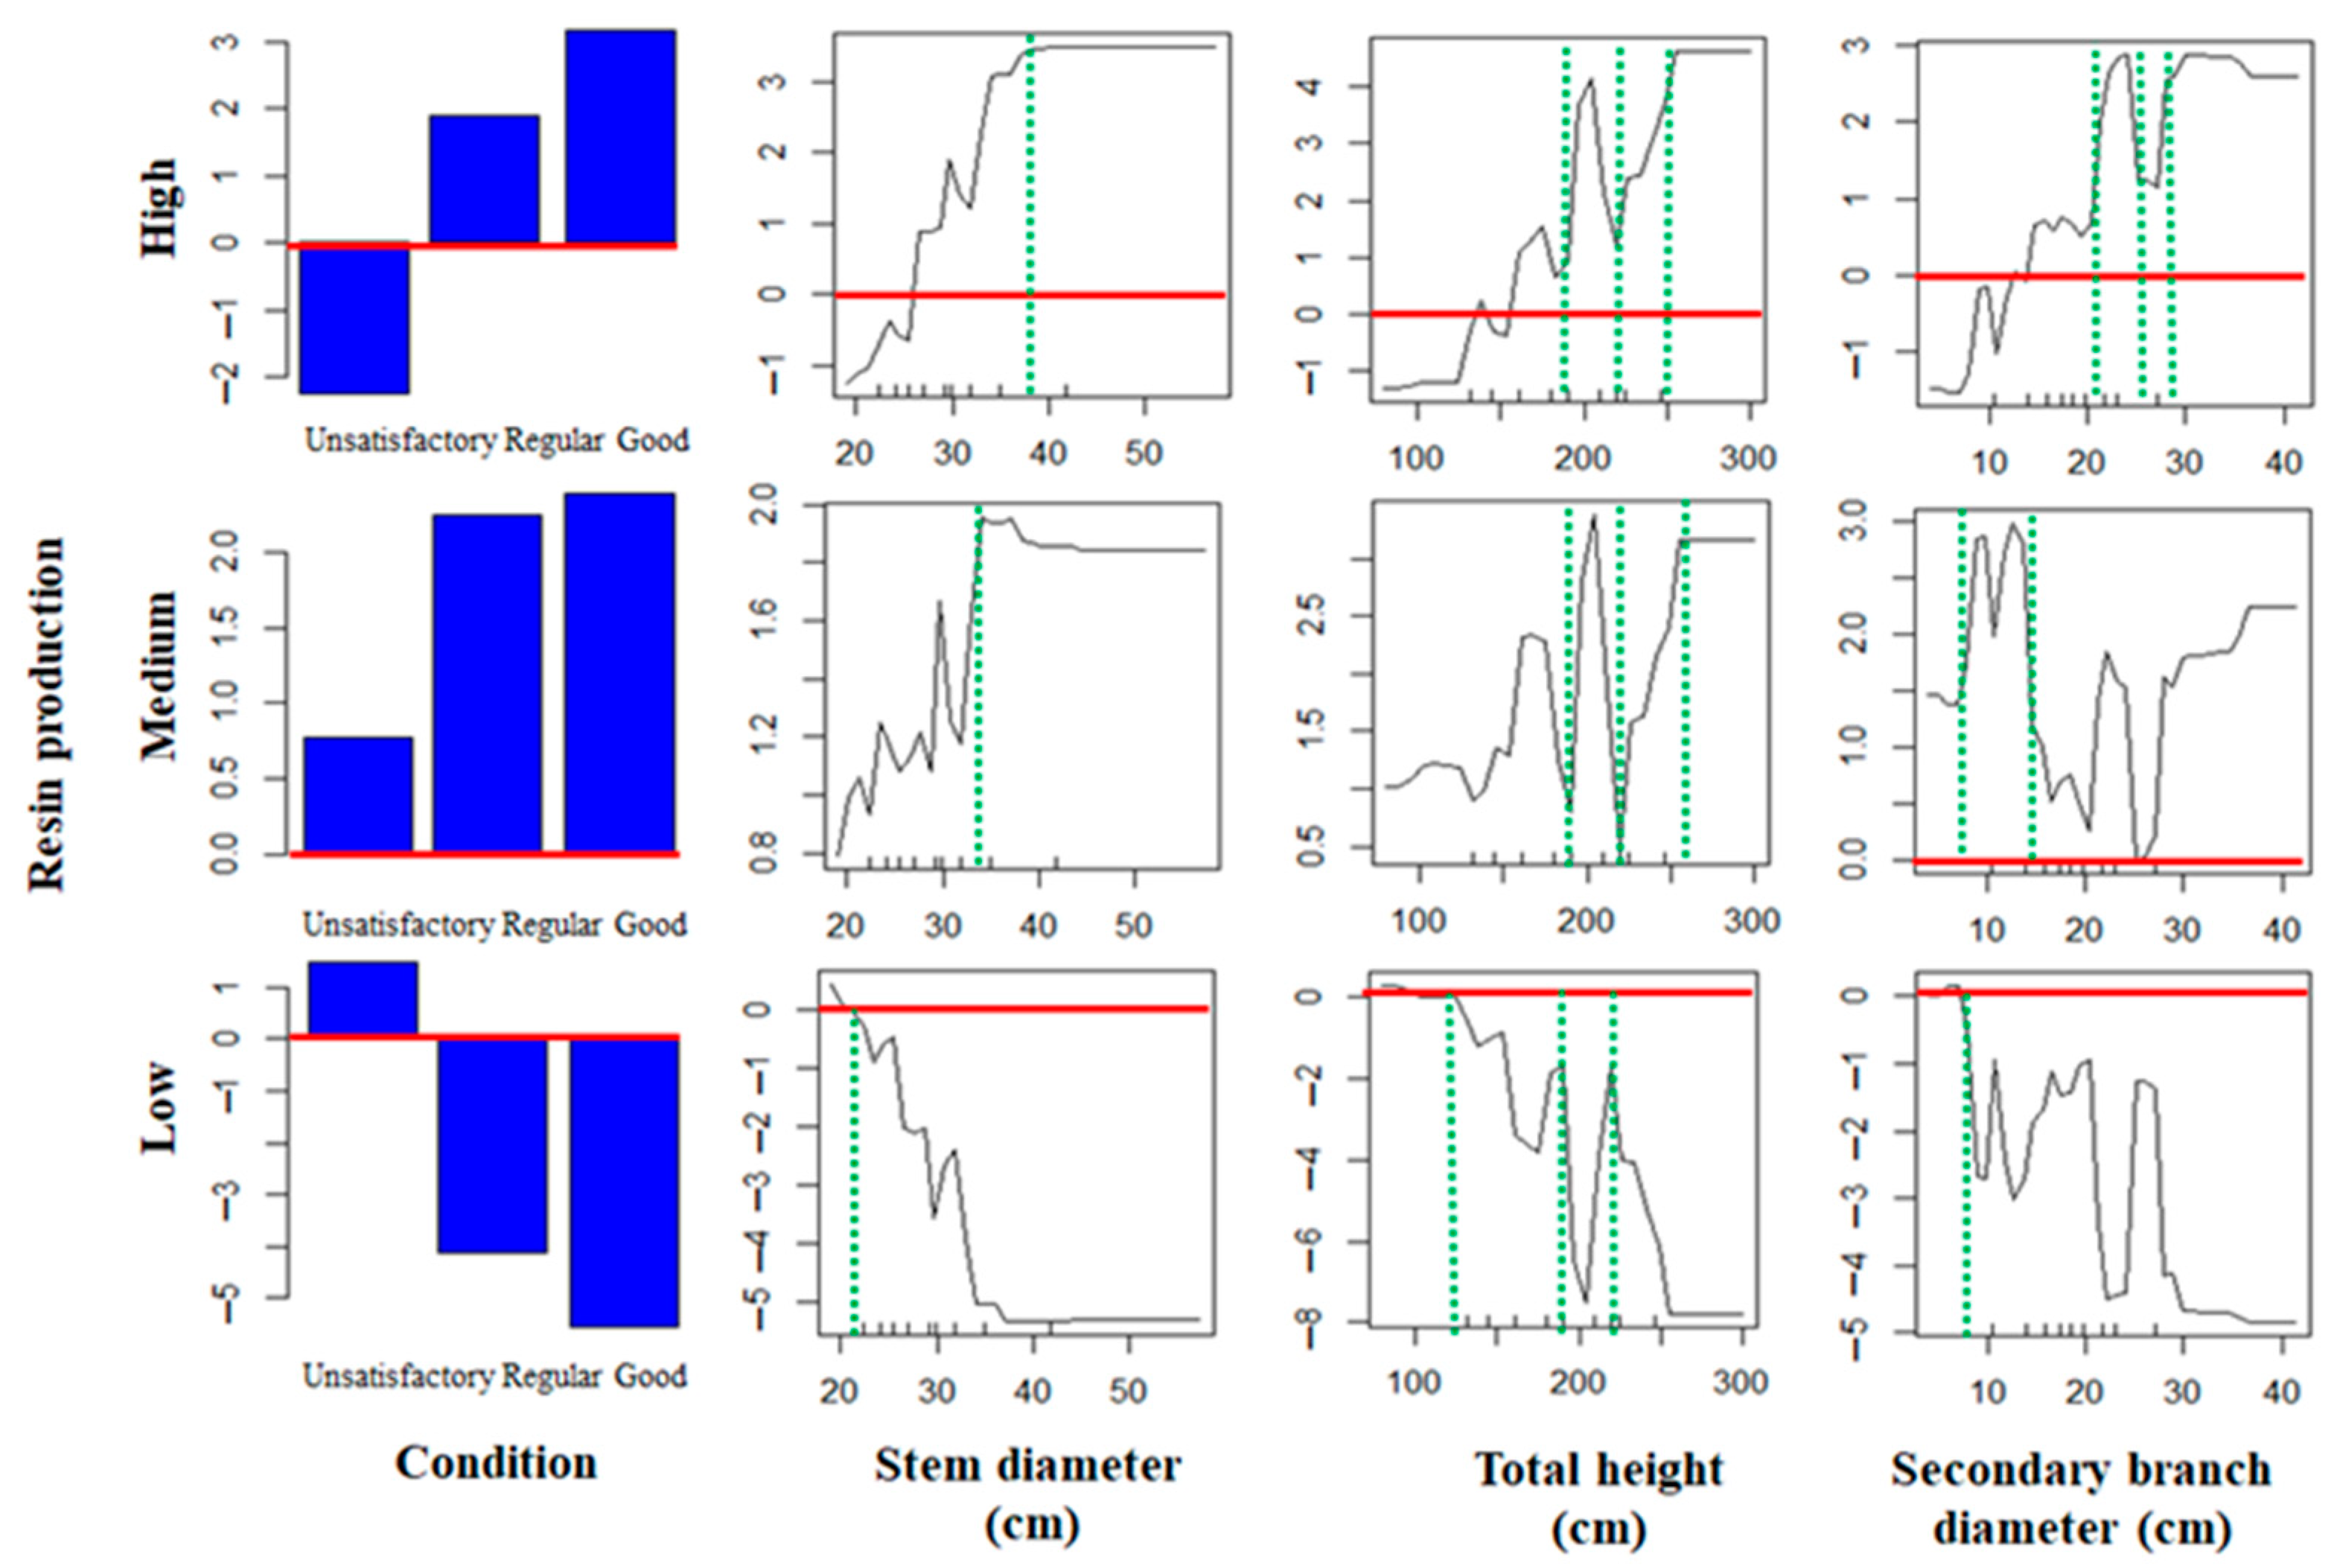
3.2.4. Partial Dependence Plot

Using the RF machine learning model, the partial dependencies of resin production on Copal tree morphological and condition variables were analyzed. Figure 5 demonstrates that the condition of the Copal trees determined the maximum yield of resin in the low category, while the maximum yield in the medium category was obtained when the trees were in good or regular condition and, most of the time, had a stem diameter of 33 cm, a total height between 2 and 2.50 m, and secondary branch diameters between 8 and 15 cm. The same graph shows that the highest production of high grade Copal resin occurs when the Copal tree is in good condition and reaches a diameter of 38 cm at the stem, a total height of 2 and 2.50 m, and a diameter of 22 and 32 cm at its secondary branches.

4. Discussion

Accuracy assessment. The RF model with training data (99%) had a higher prediction accuracy than the RF model with validation data (71%), but both models correctly predicted resin production in Copal trees. Based on the Kappa index, the model produced an excellent classification of resin production classes in Copal trees using training data and a good classification using validation data [47].
Identification of significant variables. One of the variables that affected resin production in the model was condition, which was defined by morphological characteristics of the trees such as robustness and health [6,25]. In the study, one of the indicators of the tree’s condition was the amount of bark present in the stem and the resin cavities. These indicators are affected by the age of the tree, resulting in a reduction in the number and diameter of resin ducts, thus affecting resin production [52]. A second indicator is the damage caused by pests and diseases, which reduce photosynthesis and cause water stress [53]. This leads to a decrease in resin production and reduces the useful life and quality of the trees [54]. Copal growers possess a high level of expertise in identifying the state of the tree and selecting those with resin extraction potential by observing the bark, branching, leaf cover, and even the aroma of the leaves, as well as by identifying the resin ducts present through past cuts [25]. The diameter of the main stem was the second most important variable. Larger diameter stems provide a greater harvest area [25] but produce less resin because it accumulates mainly in the periderm, secondary phloem, and bark, the latter only when the stem is young. During tree growth, the accumulation of resin in the bark decreases, resulting in a reduction of resin-producing sources, which can reduce overall production [55]. Bursera bipinnata (Sessé & Moc.) Engl., Bursera jorullensis (HBK) Engl., and Bursera glabrifolia (HBK) Engl. produce little resin when their diameters are smaller than 20 cm or larger than 50 cm. Exploiting trees with diameters less than 20 cm may reduce their future productivity [9,56,57]. Furthermore, there is evidence that the resin yield in Pinus species is higher in trees with larger diameters as compared to those with smaller diameters [29,58]. The third most important variable was height. Abad-Fitz et al. [25] found that Bursera bipinnata (Sessé & Moc.) Engl. produced little resin in trees up to 6 m tall compared with other Burseraceae species. In Pinus oocarpa Schiede ex Schltdl. species, total tree height is not a determining factor in resin production [29], but it influences latex production in Hevea brasiliensis Müll. Arg. [59], although the variable of greatest interest is the diameter of the main stem. Finally, the diameter of secondary branches was the fourth most important variable.
Montúfar [8] reports that resin is extracted from the thickest branches of Copal trees, whereas in Pinus oocarpa Schiede ex Schltdl., the diameter of secondary branches does not matter, but trees with a high number of secondary branches do since they may be the most productive trees [29]. Concerning the use of incense (Clusia vel. sp. nov.), there is no information available on the influence of the diameter of secondary branches on resin production, but there is information on their importance, primarily in those located closer to the stem [27].
Partial Dependence Plot. The low resin production of Copal trees was determined solely by their unsatisfactory condition [25]. The condition of the trees was also a determining factor in resin production in the medium category, but it had a positive impact [25]. The regular condition of the trees resulted in a regular resin production in trees with stem diameters of 33 cm and heights of 2 and 2.50 m. This means that tree growth was controlled by tree diameter and height [55,57], since trees initially consumed more energy and nutrients, but as they matured, demands decreased; thus, the trees had more energy and nutrients to produce resin [55] to cope with different biotic and abiotic disturbances [60]. The mean resin production of secondary branches with diameters between 8 and 15 cm also increased, but not in other branches, as the resin concentration in the main stem was higher [55]. High category resin production was also affected by the condition of the trees [25]. As a result of the good condition of the trees, high resin production was observed in trees with stem diameters of approximately 38 cm and heights of between 2 and 2.5 m, diameters and heights that are within the optimal ranges for maximum resin production [25,29,55,57,58]. The resin production in the high category also showed an increased production rate when the diameter of the secondary branch was larger, specifically 22 and 32 cm. A similar high degree of influence was reported by Montúfar [8], who reported that Copal extraction is most successful when it is performed on the thickest branches.
As a result, Copal harvesting should move from its natural system to a sustainable system, such as agroforestry, in order to maximize resin production through management practices such as selection, propagation, and constant monitoring in order to preserve tropical deciduous forests [9]. Management practices for Copal populations are key to ensuring maximum resin production; thus, trees that do not meet the ideal characteristics should be removed. Furthermore, it is important to renew the Copal population by transplanting or seeding, as well as to maintain it by eliminating neighboring plants to increase canopy space and by suppressing epiphytes in order to accelerate the growth of the plants [25].

5. Conclusions

The present research revealed the most important morphological and physiological parameters that influence resin production in Copal trees, Bursera bipinnata (Sessé & Moc.) Engl. and Bursera copallifera (Sessé & Moc. Ex DC.) Bullock. As a result of the construction and evaluation of the random forest (RF) model, a new method has been developed to explain and predict Copal resin production in terms of their condition and morphological variables. The random forest classification algorithm achieved good overall accuracy and Kappa concordance index in both the training and validation data. Different levels of Copal resin production were determined primarily by the condition variable, followed by stem diameter, height, and diameter of secondary branches. This study determined optimal stem diameters of 33 and 38 cm, heights of 2 and 2.5 m, and secondary branch diameters of 8 to 15, 22, and 32 cm to achieve optimal resin production at different levels. This research helps to document the traditional management techniques of resin species in Mexico to contribute to forest conservation and to maintain the livelihoods of the people. However, Copal harvesting should be moved from its natural environment to a sustainable system, such as agroforestry, in order to maximize resin production by using management practices and in order to preserve tropical deciduous forests.

Author Contributions

Conceptualization, J.C.B.-E., R.M.G.-N. and S.d.C.A.-J.; methodology, R.M.G.-N., A.S.-V., E.d.C.M.-O. and J.C.B.-E.; software, J.C.B.-E. and S.d.C.A.-J.; validation, R.M.G.-N., S.d.C.A.-J. and A.S.-V.; investigation and resources, J.C.B.-E. and E.d.C.M.-O.; writing—original draft preparation J.C.B.-E., S.d.C.A.-J. and E.d.C.M.-O.; writing—review and editing, J.C.B.-E., S.d.C.A.-J. and E.d.C.M.-O.; visualization, supervision and project administration, J.C.B.-E., E.d.C.M.-O., S.d.C.A.-J., R.M.G.-N. and A.S.-V. All authors have read and agreed to the published version of the manuscript.

Funding

This research was funded by the University of Chapingo and National Council of Science and Technology (CONACyT) of Mexico.

Data Availability Statement

The data presented in this study are available on request from the corresponding author.

Acknowledgments

The researchers thank the Copal producers of Ejido San Juan Raboso for participating in the study.

Conflicts of Interest

The authors declare no conflict of interest.

References

  1. Wong, J.; Baker, N.; Thornber, K. Evaluación de los recursos de productos forestales no madereros. In Experiencias y Principios Biométricos; FAO: Roma, Italy, 2001; 124p. [Google Scholar]
  2. Tapia-Tapia, E.C.; Reyes-Chilpa, R. Productos forestales no maderables en México: Aspectos económicos para el desarrollo sustentable. Madera Bosques 2008, 14, 95–112. [Google Scholar] [CrossRef]
  3. Jiménez, G.A.; Pincay, A.F.A.; Ramos, R.M.P.; Mero, J.O.F.; Cabrera, V.C.A. Utilización de productos forestales no madereros por pobladores que conviven en el bosque seco tropical. Rev. Cuba. Cienc. For. 2017, 5, 270–286. [Google Scholar]
  4. Tadesse, W.; Desalegn, G.; Alia, R. Natural gum and resin bearing species of Ethiopia and their potential applications. For. Syst. 2007, 16, 211–221. [Google Scholar] [CrossRef] [Green Version]
  5. Quiroz, C.J.A.; Magaña, A.M.A. Resinas naturales de especies vegetales mexicanas: Usos actuales y potenciales. Madera Bosques 2015, 21, 171–183. [Google Scholar] [CrossRef] [Green Version]
  6. Linares, E.; Bye, R. El copal en México. Biodiversitas 2008, 78, 8–11. Available online: http://www.unich.edu.mx/wp-content/uploads/2014/01/Biodiversitas.pdf (accessed on 23 November 2021).
  7. Rzedowski, J.; Calderón de Rzedowski, G. Datos para la apreciación de la flora fanerogámica del bosque tropical caducifolio de México. Acta Botánica Mex. 2013, 1, 1–23. [Google Scholar] [CrossRef]
  8. Montúfar, L.A. Copal de Bursera bipinnata. Una resina mesoamericana de uso ritual. Trace (México, DF) 2016, 1, 45–77. Available online: http://www.scielo.org.mx/scielo.php?script=sci_arttext&pid=S0185-62862016000200045&lng=es&tlng=es (accessed on 23 November 2021). [CrossRef]
  9. Cruz, L.A.; Salazar, M.L.; Campos, O.M. Antecedentes y actualidad del aprovechamiento de copal en la sierra de Huautla, Morelos. Rev. Geogr. Agrícola 2006, 1, 97–115. Available online: https://www.redalyc.org/pdf/757/75703707.pdf (accessed on 31 January 2022).
  10. May, T. Aspectos de sostenibilidad de productos no maderables forestales con uso curativo en el oeste de Pará, Brasil. Ambiente Desarro. 2016, 20, 69–84. [Google Scholar] [CrossRef] [Green Version]
  11. Anastacio-Martínez, N.D.; Franco-Maass, S.; Valtierra-Pacheco, E.; Nava-Bernal, G. Aprovechamiento de productos forestales no maderables en los bosques de montaña alta, centro de México. Rev. Mex. Cienc. For. 2016, 7, 21–38. Available online: http://www.scielo.org.mx/scielo.php?script=sci_arttext&pid=S2007-11322016000500021&lng=es&tlng=es (accessed on 25 November 2021).
  12. Purata, V.S.E. Capítulo 6. Bases para el buen manejo. In Uso y Manejo de los Copales Aromáticos: Resinas y Aceites; Purata Velarde, S.E., Ed.; Comisión Nacional para el Conocimiento y Uso de la Biodiversidad (CONABIO): Mexico City, Mexico, 2008; pp. 27–35. [Google Scholar]
  13. Duda, R.O.; Hart, P.E.; Stork, D.G. Pattern Classification; John Wiley & Sons: New York, NY, USA, 2000. [Google Scholar]
  14. Breiman, L. Random forests. Mach. Learn. 2001, 45, 5–32. [Google Scholar] [CrossRef] [Green Version]
  15. Hastie, T.; Tibshirani, R.; Friedman, J. The Elements of Statistical Learning: Data Mining, Inference, and Prediction; Springer Series in Statistic; Springer: New York, NY, USA, 2009. [Google Scholar] [CrossRef]
  16. Rodríguez-Galiano, V.F.; Ghimire, B.; Rogan, J.; Chica-Olmo, M.; Rigol-Sanchez, J.P. An assessment of the effectiveness of a random forest classifier for land-cover classification. ISPRS J. Photogramm. Remote Sens. 2012, 67, 93–104. [Google Scholar] [CrossRef]
  17. Archibald, S.; Roy, D.P.; Van Wilgen, B.W.; Scholes, R.J. What limits fire? An examination of drivers of burnt area in Southern Africa. Glob. Change Biol. 2009, 15, 613–630. [Google Scholar] [CrossRef] [Green Version]
  18. Oliveira, S.; Oehler, F.; San-Miguel-Ayanz, J.; Camia, A.; Pereira, J.M.C. Modeling spatial patterns of fire occurrence in Mediterranean Europe using Multiple Regression and Random Forest. For. Ecol. Manag. 2012, 275, 117–129. [Google Scholar] [CrossRef]
  19. Webster, B.L. Guide to judging the condition of a shade tree. J. Arboric. 1978, 4, 247–249. [Google Scholar]
  20. Instituo Nacional de Estadística y Geografía (INEGI). Prontuario de Información Geográfica Municipal de los Estados Unidos Mexicanos: Ahuatlán, Puebla. México; INEGI: Mexico City, Mexico, 2009.
  21. Instituo Nacional de Estadística y Geografía (INEGI). Prontuario de Información Geográfica Municipal de los Estados Unidos Mexicanos: Epatlán, Puebla. México; INEGI: Mexico City, Mexico, 2009.
  22. Instituo Nacional de Estadística y Geografía (INEGI). Prontuario de Información Geográfica Municipal de los Estados Unidos Mexicanos: Izúcar de Matamoros, Puebla. México; INEGI: Mexico City, Mexico, 2009.
  23. Rzedowski, J. Vegetación de México; Comisión Nacional para el Conocimiento y Uso de la Biodiversidad: Mexico City, Mexico, 2006. [Google Scholar]
  24. Pennington, T.D.; Sarukhán, J. Árboles Tropicales de México: Manual para la Identificación de las Principales Especies; Universidad Nacional Autónoma de México-Fondo de Cultura Económica: Mexico City, Mexico, 2005. [Google Scholar]
  25. Abad-Fitz, I.; Maldonado-Almanza, B.; Aguilar, D.K.M.; Sánchez, M.L.; Gómez, C.L.; Casas, A.; Blancas, J.; García-Rodríguez, Y.M.; Beltrán-Rodríguez, L.; Sierra-Huelsz, J.A.; et al. Consequences of Traditional Management in the Production and Quality of Copal Resin (Bursera bipinnata (Moc. & Sessé ex DC.) Engl.) in Mexico. Forests 2020, 11, 991. [Google Scholar] [CrossRef]
  26. Fuentes, A.F. Identidad taxonómica y aspectos sobre la historia natural y usos del “copal de los Yungas” en Bolivia. Kempffiana 2009, 5, 3–19. [Google Scholar]
  27. Zenteno-Ruiz, F.S. Referencias botánicas, ecológicas y económicas del aprovechamiento del incienso (Clusia vel. sp. nov., Clusiaceae) en bosques montanos del Parque Nacional Madidi, Bolivia. Ecol. Boliv. 2007, 42, 148–156. [Google Scholar]
  28. Paredes, O.A.; Razo, Z.R.; Rodríguez, L.R.; Suárez, I.A. Diversidad de especies arbóreas y arbustivas del ejido El Puente, Mineral del Chico, Hidalgo. Rev. Iberoam. Cienc. 2019, 6, 93–105. [Google Scholar]
  29. Reyes-Ramos, A.; Cruz de León, J.; Martínez-Palacios, A.; Marc, L.P.C.; Ambriz-Parra, E.; Sánchez-Vargas, N.M. Caracteres ecológicos y dendrométricos que influyen en la producción de resina en Pinus oocarpa de Michoacán, México. Madera Bosques 2019, 25, 1–13. [Google Scholar] [CrossRef]
  30. Dormann, C.F.; Elith, J.; Bacher, S.; Buchmann, C.; Carl, G.; Carré, G.; García, M.J.R.; Gruber, B.; Lafourcade, B.; Leitão, P.J.; et al. Collinearity: A review of methods to deal with it and a simulation study evaluating their performance. Ecography 2013, 36, 27–46. [Google Scholar] [CrossRef]
  31. Schober, P.; Schwarte, L.A. Correlation coefficients: Appropriate use and interpretation. Anesth. Analg. 2018, 126, 1763–1768. [Google Scholar] [CrossRef] [PubMed]
  32. Akinwande, M.O.; Dikko, H.G.; Samson, A. Variance Inflation Factor: As a Condition for the Inclusion of Suppressor Variable(s) in Regression Analysis. Open J. Stat. 2015, 5, 754–767. [Google Scholar] [CrossRef] [Green Version]
  33. Wei, T.Y.; Simko, V. R Package “Corrplot”: Visualization of a Correlation Matrix (Version 0.84). 2017. Available online: https://github.com/taiyun/corrplot (accessed on 3 January 2022).
  34. Naimi, B.; Hamm, N.A.S.; Groen, T.A.; Skidmore, A.K.; Toxopeus, A.G. Where is positional uncertainty a problem for species distribution modelling? Ecography 2014, 37, 191–203. [Google Scholar] [CrossRef]
  35. R Core Team. R: A Language and Environment for Statistical Computing; R Foundation for Statistical Computing: Vienna, Austria, 2016; Available online: https://www.R-project.org/ (accessed on 3 August 2017).
  36. Chatterjee, S.; Hadi, A.S. Regression Analysis by Example; John Wiley & Sons: Hoboken, NJ, USA, 2006. [Google Scholar] [CrossRef]
  37. Booth, G.D.; Niccolucci, M.J.; Schuster, E.G. Identifying Proxy Sets in Multiple Linear Regression: An Aid to Better Coefficient Interpretation; Intermountain Research Station, USDA Forest Service: Ogden, UT, USA, 1994. [Google Scholar]
  38. Wu, W.; Zhang, L. Comparison of spatial and non-spatial logistic regression models for modeling the occurrence of cloud cover in north-eastern Puerto Rico. Appl. Geogr. 2013, 37, 52–62. [Google Scholar] [CrossRef]
  39. Breiman, L.; Friedman, J.H.; Olshen, R.A.; Stone, C.J. Classification and Regression Trees; Routledge: New York, USA, 1984. [Google Scholar] [CrossRef]
  40. Cutler, D.R.; Edwards, T.C., Jr.; Beard, K.H.; Cutler, A.; Hess, K.T.; Gibson, J.; Lawler, J.J. Random forests for classification in ecology. Ecology 2007, 88, 2783–2792. [Google Scholar] [CrossRef]
  41. Arpaci, A.; Malowerschnig, B.; Sass, O.; Vacik, H. Using multi variate data mining techniques for estimating fire susceptibility of Tyrolean forests. Appl. Geogr. 2015, 53, 258–270. [Google Scholar] [CrossRef]
  42. Jaafari, A.; Gholami, D.M.; Zenner, E.K. A Bayesian modeling of wildfire probability in the Zagros Mountains, Iran. Ecol. Inform. 2017, 39, 32–44. [Google Scholar] [CrossRef]
  43. Liaw, A.; Wiener, M. Classification and regression by randomForest. R News 2002, 2, 18–22. [Google Scholar]
  44. Townsend, J.T. Theoretical analysis of an alphabetic confusion matrix. Percept. Psychophys. 1971, 9, 40–50. [Google Scholar] [CrossRef]
  45. Kuhn, M. Building Predictive Models in R Using the caret Package. J. Stat. Softw. 2008, 28, 1–26. [Google Scholar] [CrossRef] [Green Version]
  46. McHugh, M.L. Interrater reliability: The kappa statistic. Biochem. Med. 2012, 22, 276–282. [Google Scholar] [CrossRef]
  47. Fleiss, J.L.; Levin, B.; Cho, P.M. Statistical Methods for Rates and Proportion; Wiley Series in Probability and Statistics; John Wiley & Sons: Hoboken, NJ, USA, 2003. [Google Scholar]
  48. Schmidt, A.; Niemeyer, J.; Rottensteiner, F.; Soergel, U. Contextual Classification of Full Waveform Lidar Data in the Wadden Sea. IEEE Geosci. Remote Sens. Lett. 2014, 11, 1614–1618. [Google Scholar] [CrossRef]
  49. Kuhn, S.; Egert, B.; Neumann, S.; Steinbeck, C. Building blocks for automated elucidation of metabolites: Machine learning methods for NMR prediction. BMC Bioinform. 2008, 9, 400. [Google Scholar] [CrossRef] [Green Version]
  50. Friedman, J.H. Greedy function approximation: A gradient boosting machine. Ann. Stat. 2001, 29, 1189–1232. [Google Scholar] [CrossRef]
  51. Guo, F.; Wang, G.; Su, Z.; Liang, H.; Wang, W.; Lin, F.; Liu, A. What drives forest fire in Fujian, China? Evidence from logistic regression and Random Forests. Int. J. Wildland Fire 2016, 25, 505–519. [Google Scholar] [CrossRef]
  52. Giménez, A.M.; Moglia, J.G.; Hernández, P.; Gerez, R. Anatomía de la Madera; Universidad Nacional de Santiago del Estero: Santiago del Estero, Argentina, 2005; 53p. [Google Scholar]
  53. Agrios, G.N. Plant Pathology; Elsevier; Academic Press: Amsterdam, The Netherlands, 2005; 635p. [Google Scholar] [CrossRef]
  54. Izquierdo-Bautista, H.; Domínguez-Domínguez, M.; Martínez-Zurimendi, P.; Velázquez-Martínez, A.; Córdoba-Ávalos, V. Problemática en los procesos de producción de las plantaciones de hule (Hevea brasiliensis Muell Arg.) en Tabasco, México. Trop. Subtrop. Agroecosyst. 2011, 14, 513–524. [Google Scholar]
  55. Franceschi, V.R.; Krokene, P.; Cristiansen, E.; Krekling, T. Anatomical and chemical defenses of conifer bark against bark beetles and other pests. New Phytol. 2005, 167, 353–376. [Google Scholar] [CrossRef]
  56. Purata, V.S.E.; León, M.M. Capítulo 3. La colecta de resina. In Uso y Manejo de los Copales Aromáticos: Resinas y Aceites; Purata Valverde, S.E., Ed.; Comisión Nacional para el Conocimiento y Uso de la Biodiversidad (CONABIO): Mexico City, Mexico, 2008; pp. 17–20. [Google Scholar]
  57. Cruz-Cruz, M.; Antonio-Gómez, V.M.; Rodríguez-Ortíz, G.; Vásquez-Barranco, I.G.; Lagunes-Rivera, L.; Hernández-Santiago, E. Resina y aceites esenciales de tres especies de copal del sur de Oaxaca, México. Rev. Mex. Agroecosist. 2017, 4, 12–23. [Google Scholar]
  58. Rodrigues, K.C.S.; Azevedo, P.C.N.; Sobreiro, L.E.; Pelissari, P.; Fett-Neto, A.G. Oleoresin yield of Pinus elliottii plantations in a subtropical climate: Effect of tree diameter, wound shape and concentration of active adjuvants in resin stimulating paste. Ind. Crops Prod. 2008, 27, 322–327. [Google Scholar] [CrossRef]
  59. Rojo, M.G.E.; Jasso, M.J.; Vargas, H.J.; Velázquez, M.A.; Palma, L.D.J. Predicción de la producción de látex en plantaciones comerciales de hule (Hevea brasiliensis müll.). Rev. Fitotec. Mex. 2003, 26, 183–190. [Google Scholar]
  60. Moreira, T.X. Variación Genética y Efecto de la Disponibilidad de Nutrientes en las Defensas Constitutivas e Inducidas de Pinus Pinaster Ait. Ph.D. Dissertation, Universidad de Vigo, Pontevedra, Spain, 2010. Available online: http://hdl.handle.net/10261/37055 (accessed on 8 April 2022).
Figure 1. Study area (Agua Escondida watershed, Puebla, Mexico) and location of the experimental site (Ejido San Juan Raboso within the Agua Escondida watershed).
Sustainability 14 08047 g001
Figure 2. Location of the 100 sampling units (Copal trees) in the study area.
Sustainability 14 08047 g002
Figure 3. Relationship between: (a) mtry and OOB error rate; (b) ntree and OOB error rate.
Sustainability 14 08047 g003
Figure 4. Value of the average decrease in precision and in Gini among the four most important descriptors of the final model.
Sustainability 14 08047 g004
Figure 5. Partial dependence plot for the explanatory model of Copal resin production based on low, medium and high categories as functions of condition, stem diameter, total height and diameter of secondary branch 2.
Sustainability 14 08047 g005
Table 1. Factors and indicators for estimating resin production in Copal trees.
Factor Indicator
A. Tree stem diameterFustal (3)Latizal (2)Vardascal (1)
> 35 cmBetween 25 and 35 cm < 25 cm
B. Tree heightHigh (3)Medium (2)Low (1)
> 200 cmBetween 150 and 200 cm < 150 cm
C. Diameter of secondary branchesThick (3)Intermediate (2)Thin (1)
> 20 cmBetween 15 and 20 cm < 15 cm
D. Tree conditionGood (3)Regular (2)Unsatisfactory (1)
Sum of indicatorsProductionDummy variable for resin production
10–12High2
7–9Medium1
4–6Low0
Table 2. Factors and indicators for estimating the condition of Copal trees.
Factor Indicator
A. State of stembarkGood (3)Regular (2)Unsatisfactory (1)
< 10 % cortex loss, no cavities > 10 % and < 50 % cortex loss, and one to two cavities > 50 % cortex loss and at least three cavities
B. Branch elongationHigh (3)Medium (2)Low (1)
> 15 cm of branch elongationBetween 5 and 15 cm of branch elongation < 5 cm of branch elongation
C. Branching structureGood (3) Regular (2)Unsatisfactory (1)
Main stem and secondary branches in good conditionMain stem and one dead, broken or absent secondary branchThe main stem and at least two secondary branches are broken, dead, or absent
D. Damage caused by pests, diseases, and epiphytesLow (3)Medium (2)High (1)
< 10 % Between 10% and 30% > 30 %
E. Coverage percentage of canopyGood (3)Regular (2) Unsatisfactory (1)
> 60 % Between 20 and 60% < 20 %
Sum of indicatorsConditionDummy variable for condition
12–15Good2
8–11Regular1
5–7Unsatisfactory0
Table 3. Performance and cross-validation of the final model.
Training DatabaseLowMediumHigh
Low900
Medium1320
High0034
Validation DatabaseLowMediumHigh
Low010
Medium184
High019
Publisher’s Note: MDPI stays neutral with regard to jurisdictional claims in published maps and institutional affiliations.

