1. Introduction
The word “paradigm” was first used in scientific debate by Thomas Kuhn in
The Structure of Scientific Revolutions italics because it’s a book title [
1]. A scientific paradigm is not simply the current theory, but an entire worldview; it refers to the network of conceptual, theoretical, and methodological commitments shared by a scientific community in a given field. It develops when predictions turn out to be accurate.
Kuhn also used the term paradigm in another sense, as a concrete achievement, an exemplar that can replace explicit rules as a basis for the solution of problems in a field. In this second sense, it denotes an element of the network, “the concrete problem-solutions which, employed as models or examples, can replace explicit rules as a basis for the solution of the remaining puzzles (problems)”.
A paradigm shift occurs, according to Kuhn, when scientists encounter anomalies, problems that are not solvable by known rules and procedures or equipment that fails to perform in the expected manner. When enough significant anomalies have accrued against a current paradigm, the scientific discipline is thrown into a state of crisis. During this crisis, new ideas, perhaps ones previously discarded, are tried and new achievements provide model problems and solutions. In the end a new paradigm is formed that gains its own new followers, and an intellectual battle takes place between the followers of the new paradigm and the holdouts of the old paradigm. After a given discipline has changed from one paradigm to another, this is called a scientific revolution or a paradigm shift.
The cycle—anomalies, crisis, paradigm shift—can be applied to all purposed systems that follow the same logic of theories. Whether in science [
1], in technology [
2], or in institutions [
3], the logic of development seems similar.
The first attempts to apply these concepts to urban mobility were made beginning in the 1990s by some economists and urban planners [
4,
5,
6,
7]. At that time, researchers and practitioners were sharing a paradigm to deal with the rapid automobilisation of urban transport. The enthusiasm for the new transport mode was lost when the application of the paradigm showed the first anomalies, mainly the side effects of new road infrastructures: induced demand, urban sprawl, increasing travel distance, more congestion. These were anomalies, unintended consequences, or violations of expectations that attracted the increasing attention of researchers, practitioners, and decision makers. The effects were explained through a better articulation of the theory [
8,
9] and a partial paradigm shift that delivered patchy changes in the applications [
10]. How the planners were seeing the problem can be found in a paper based on a case study of the Oslo western ring road [
11]. In recent years, the idea of a paradigm shift has focused on innovative technologies (car automation) and digital business models [
12], on congestion as a tool to limit traffic [
13], and on traffic safety [
14].
But urban mobility is more complicated and needs a more comprehensive interdisciplinary approach to find evidence of a paradigm shift. Urban transport is not reserved to a community of researchers and their theories. In this case, the paradigm is not only related to natural phenomena but to the social system, the constant evolution of technology where the citizens, the organisations, and the institutions are directly involved.
The paper aims first to demonstrate how the planning methods preferred by thousands of researchers, practitioners, and policymakers keep cities stuck in traffic—with millions of citizens willing to accept cost, congestion, pollution, and risks to safety and health. The second aim is to identify a paradigm shift emerging from the old and new problems of urban mobility that resist the repeated attempts at a solution. The problems are of different natures. Some originate from planning theory and, in agreement with Kuhn, are called anomalies; others are the result of transport technologies that produce adverse side effects on the health of humans and the planet; still others are the result of an evolutionary mismatch deriving from the inability of human beings to adapt to rapid changes in the urban environment. The paper is developed in three steps. The first step addresses the three areas of concern: the anomalies of the conventional paradigm of transport and traffic engineering, the adverse side effects of urban transport technologies, and the mismatches that arise from changes in our environment. The second step looks at the different pushes for changes: citizens’ preferences, the demographic effects, the return of the bicycle, digital transformation, and the effects of the pandemic. The paradigm shift emerges in the third step as the sum of methods and achievements in the three categories of problems developed by the community of academics, experts, practitioners, decision makers, and urban communities. The main result is a transition to sustainable urban transport achieved by increasing the quality of urban life and reducing dependence on automobiles.
2. Method
The search for a paradigm shift began with an extensive literature review of transport journals in order to identify and understand the problems. The first papers selected were those of Cervero [
5], Downs [
15], Goodwin [
16], and Mogridge [
9], who were the first to investigate, thirty-some years ago, the anomalies of the conventional paradigm of transport and traffic engineering theory. Next were selected recent papers with references to the earlier authors already noted, and backward snowballing was applied to some of the papers. The literature on the adverse effects of technologies is vast, but it is convergent in attributing the causes to the car-dominant mode of urban transport. The literature on mismatches is relatively new and confined to a few journals and authors. Combining perspectives and insights from different fields can provide critical knowledge of problems and gaps that cannot be solved by adjustment of existing instruments or by new instruments used in isolation and addressing the same old goals.
The research method of the paper continues with analyses of recent national and local surveys to identify changes in preferences over time as well as the effects of digital technologies and the pandemic on mobility. The analyses anticipate substantial change in the policy goals of the urban environment. A selection of innovative practices around the world used by hundreds of professionals, experts, and practitioners illustrates the concrete possibilities of completely different ways of dealing with the urban environment and mobility.
The last part of the paper is literature research in each of the three areas of concern for new achievements in the urban environment, technologies, and planning theories. It represents a new path for the transition, able to overcome the gaps between the status quo and sustainability. These achievements should have the status of model problems, with a shift in the usual goals of mobility growth, time saving by increasing speed, and freedom of modal choice, which translates into substantial policy change. They are selected and put into the three categories to use together in packages of interventions that enhance their synergetic relationships and increase the effectiveness and efficiency of policy interventions [
17]. They should reflect radical changes associated with an emergent paradigm shift, based on concrete theoretical and practical achievements and well-defined problems. The achievements [
1] that are sufficiently “unprecedented to attract an enduring group of adherents” and open-ended, with plenty of problems for the “redefined group of practitioners to resolve” represent a paradigm themselves and elements of a more general paradigm shift. A successful transition driven by the new paradigm should be supported by policy and institutional architecture [
18].
3. The Unresolved Problems of the Status Quo
3.1. The Anomalies of the Conventional Paradigm
The automobile began as a curiosity, a new-fangled invention, which soon began to replace the horse-drawn carriage and penetrate the market as a luxury. Within a few years, in 1908, the Ford Model T brought the car to “the great multitude”. It represented freedom and speed—until, with millions of vehicles clamouring for space, everybody was stuck in traffic.
Urban planning made the problem worse. In the second half of the twentieth century, it was marked by the functionalist stance that envisions the city as a collection of uses to be accommodated: residence, work, leisure, and the traffic systems that serve them. Activities should not mix; hence zoning and car-friendly urban planning are key elements of the functionalist city. There was resistance, but despite partial successes the development has been more complex and contradictory [
19].
Engineers were called in. Predictably, they took an intuitive, linear, practical approach:
Roads were congested; traffic was on the rise and public transport was losing users.
The main goal was to meet the growing demands of car traffic.
The method was linear and based on the predict-and-provide principle.
The paradigm used was based on the subdivision of an area into zones and on the four-step model with an evaluation procedure based on cost–benefit at the end. The engineers preferred not to think about the complexity of human behaviour. As in classical economics, users of the networks were presumed to be rational, well informed, without history, symmetrical in their evaluation of gains and losses, and able to optimise time and costs. Density of population and jobs and the mix of activities within each zone were assigned a uniformly distributed average value. Land use was an input of urbanists that transport planners transformed into intrazonal trips for the transport system to provide.
The four-step model succeeded because it supplied the response that everyone expected—more roads. Planning was an approach from above, and the pronouncements of experts were accepted more readily than today.
The concept of traffic as a fluid—which even attracted the attention of a Nobel laureate [
20]—changed the nature of cities. The results were radically altered allocation of urban space with new expressways, the removal of road space from pedestrians, bicyclists, and public transport, the enormous urban sprawls, the path-dependent developments in oil, the internal combustion engine (ICE) vehicles, with technological lock-in. But traffic keeps growing; cities were (and are) stuck in traffic; and the linear simplistic solution of traffic engineers (“more traffic, more roads”) becomes the problem. Everyone thinks first of the linear interpretation, even engineers. Evolution did not equip humans with the mental ability to handle the complex systems of modern cities [
21].
The first interpretations of traffic as a multi-loop non-linear feedback system, and the effects of induced traffic, date to the beginning of the 1960s. They included: the Law of Peak-Hour Expressway Congestion [
15] that states that “the opening of an expressway could conceivably cause traffic congestion to become worse instead of better, and automobile commuting times to rise instead of fall”; the vicious circle of growth of the automobile and decline of the bus [
16], and the black hole of road investments [
22]—a downward spiral (process of cumulative causation) as the quality of road transport gradually deteriorates.
In the end, all policies based on more road capacity seem to differ only in how quickly the congestion returns [
8]. The induced traffic compromises any urban transport planning strategy based on increasing road capacity; 40% of new capacity is used up immediately and 100% of it within four years [
23]. The same occurs with intelligent transport systems aimed at more efficient use of road capacity [
24]. Increasing capacity just increases congestion, due to its impact on public transport (PT) quality, with further worsening of the modal split [
9]. It is surprising that Braess’s paradox, according to which the addition of a new link to a road network can result in longer travel times, has received no attention in transport policies. It has figured only in the German theoretical literature [
25] and, after 37 years, also in the English-language literature [
26].
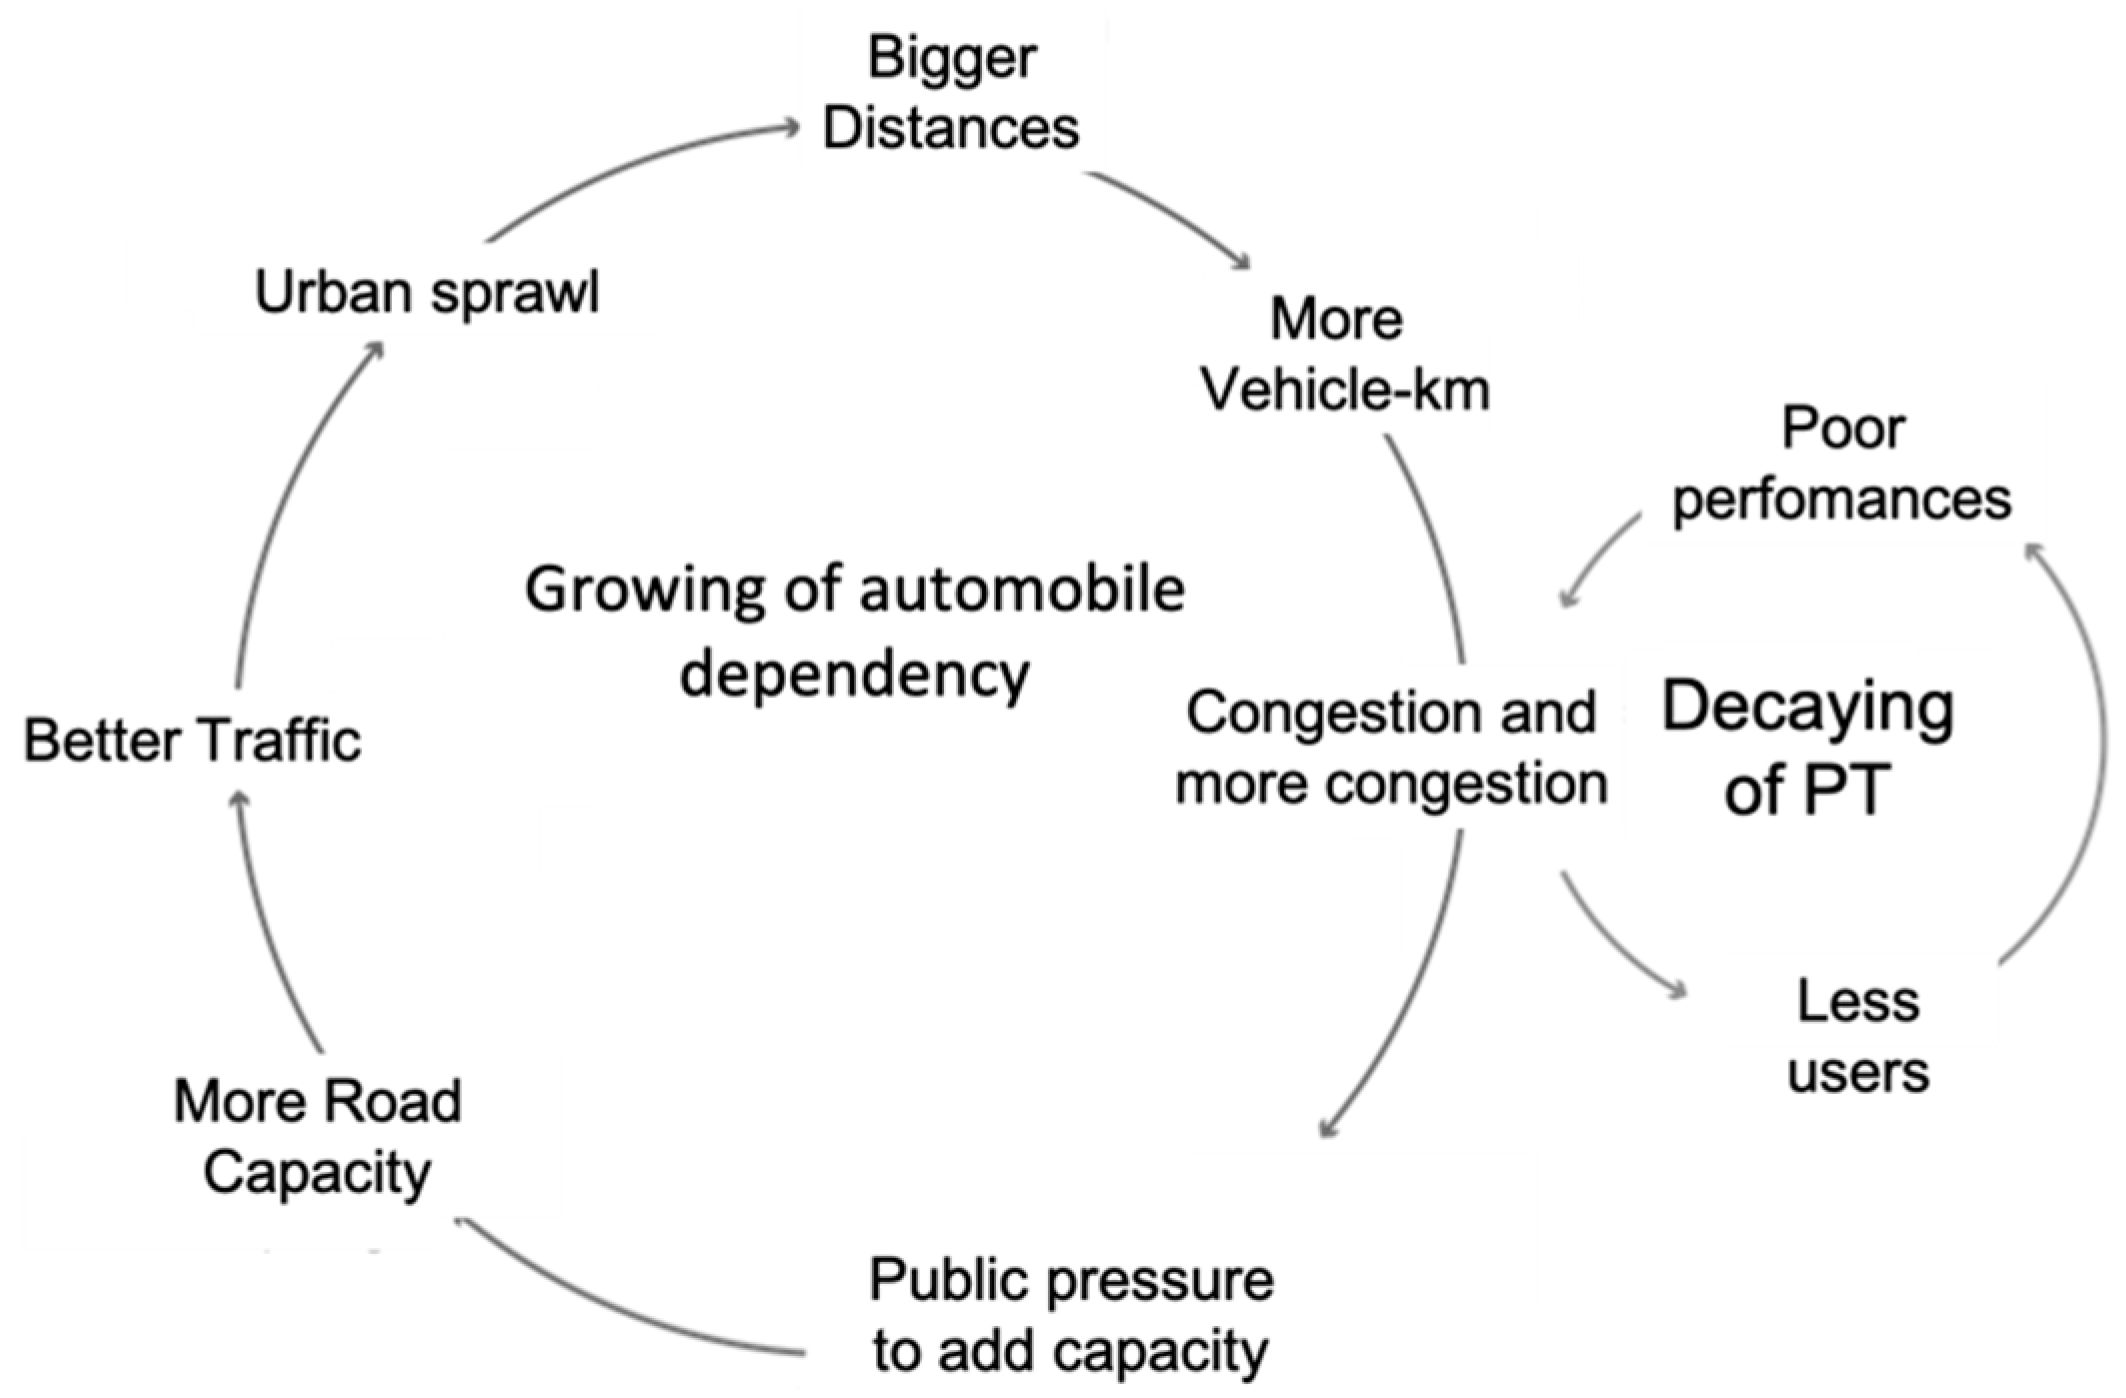
Figure 1 represents the phenomena described as two circular concatenated processes. The first is a continuous process of growth of dependence on the automobile, which influences the land use and generates the induced demand for more road transport. Consequently, in a second process, a cumulative decaying of PT begins. The four-step model, based on equilibrium assumptions, is unable to account for circular cumulative processes where growth encourages growth and decline leads to further decline.
3.2. Adverse Effects of Transport Technology
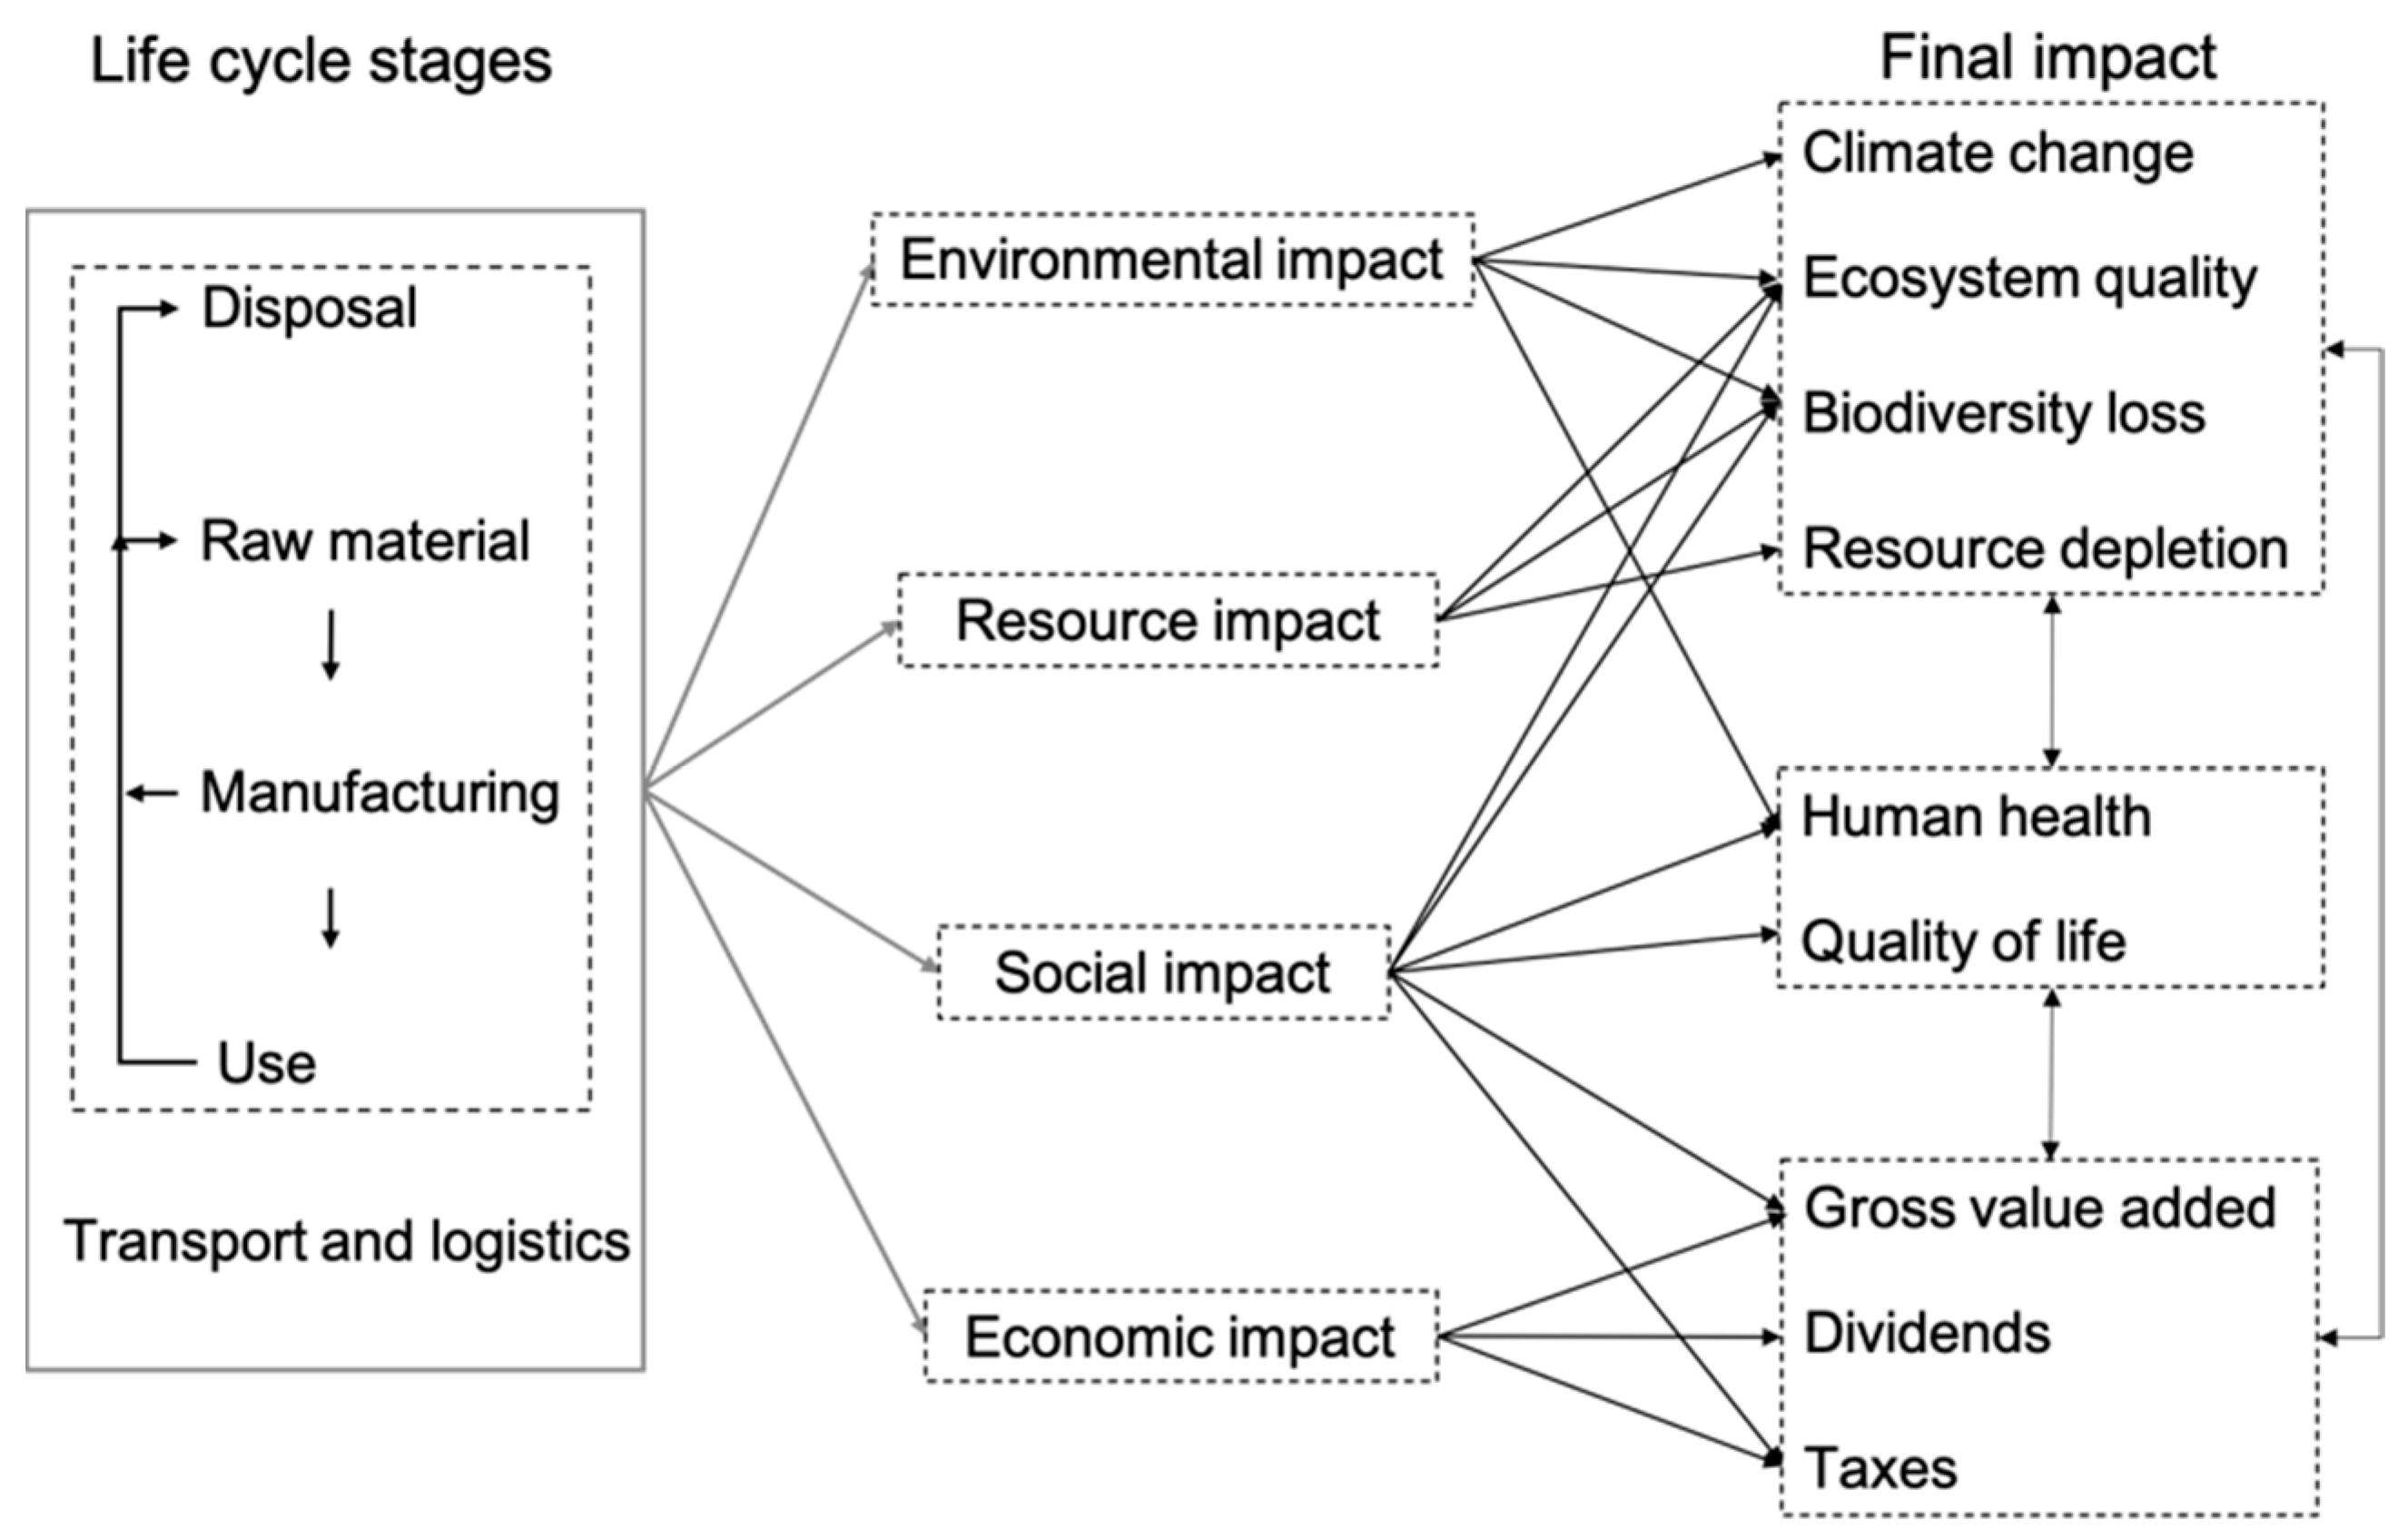
The adverse effects of a technology are its negative and unavoidable impacts in the automotive sustainability assessment framework shown in
Figure 2.
When new purposes arise and circumstances change, the existing technologies are pressed to deliver more and differently. Their supporters seek out internal replacement with better components, improved architecture, fine-tuning, and balancing to survive and compete. Additional components are added to work around its limitation. The technology becomes more complex and tends to be locked in. The mature technology performs better than its nascent rivals; it is supported by powerful interests, and so the old technology persists longer than it should. The technology is adapted and elaborated until it is strained beyond its limits. The overall cycle resembles Kuhn’s [
2] and represents very clearly the development and tenaciousness of ICE vehicles.
The assessments of impacts listed in
Figure 2 are based on the literature and interviews [
27], and are considered over the whole life of an automobile. Despite great progress, including the regulation of many of the impacts, the automobile is an inadequate technology and in profound crisis. Car pollutants cause immediate and long-term effects on the environment and are one of the major causes of global warming. Cars affect biodiversity through pervasive, incremental intrusion into the habitat such as that caused massively by urban sprawl. The environmental damage extends to soil, lakes, rivers, flora, fauna, and human health. Nitrous oxide reduces the ozone layer. Sulphur dioxide and nitrogen dioxide combine with rainwater to make acid rain. Particulates, hydrocarbons, carbon monoxide, and other pollutants are harmful to human health. Atmospheric pollution has both acute effects and chronic effects on every organ of the body [
28]. Energy, minerals, and land use are most affected. Reuse and recycling help reduce mineral depletion. Energy efficiency per passenger-km is 50 times lower in a car than on a bicycle, and transport consumes 26% of all extracted oil [
29].
The industrial complex, the numerous car lovers, and the political-institutional system maintain the status quo without regard to international accords on climate change. A dramatic example of the convergence of the three actors is the enormous increase of greenhouse gases (
Figure 3) that follows the fatal attraction of the SUV [
30], especially in the rich world, without any public reaction.
Mass exacerbates all the impacts: it increases rolling resistance, the need for road maintenance, wear on brakes, fuel consumption, and pollution. The sources of the particulate produced by traffic are mainly resuspension and brake and tire wear; exhaust gases account for only a fraction of the total and improve with the technology. Although electric vehicles (EV) eliminate exhaust gases and partially reduce the particulate with regenerative braking, lightweight EVs emit an estimated 11–13% less non-exhaust PM2.5 and 18–19% less PM10 than conventional vehicles. Heavier EVs reduce PM10 by only 4–7% and increase PM2.5 by 3–8% relative to conventional vehicles [
31].
Figure 4 shows the 2013–2016 trend of PM
10 in the road network of Greater London. The decline in emissions is only from exhaust.
The automobile has altered distances: everything is farther away or less accessible. Walking or cycling to shops, work, or school is often difficult and dangerous. In 2019, EU road accidents with fatalities numbered 22,660 and those with serious injuries 120,000, 38% of them in urban areas [
33]. Vulnerable road users accounted for 30% of the victims—yet Europe still boasts the best road safety record of any region in the world. The amount of space cars occupy is unsustainable for an urban environment; cars need more than 10 m
2 for parking and more than 100 m
2 on the road at 50 km/h [
34]. Traffic noise pollution is often underestimated as a health hazard, but the World Health Organization (WHO) ranks it second after atmospheric pollution.
“The paradigm of the modern transport systems is unsustainable in its current outputs of pollutants and GHG, toll on human health and dependence on oil” [
35], but it is very well rooted in the economies. It has multiplier effects on economic growth. The costs over the life cycle of the car contribute to profits, to taxes, and definitely to GDP.
The automobile industry represents a relatively small share of the overall size of OECD economies in terms of value added and employment. But this hides large variation across countries. It accounts for almost 4% of total output in Germany and 3% in the USA, whereas it is almost non-existent in several countries; 14 million Europeans work in the auto industry (directly and indirectly), accounting for more than 6% of all EU jobs.
The lifetime cost of driving a car is very high. For low-income groups it can represent an expense equal to that for housing [
36]. But citizens, policymakers, and planners underestimate the full private costs of car ownership as well as the social costs. Automobile subsidies and investments tend to be regressive. Those who drive less than average, mostly lower- and moderate-income people, subsidise those who drive more than average, generally high-income people.
3.3. Evolutionary Mismatch of People
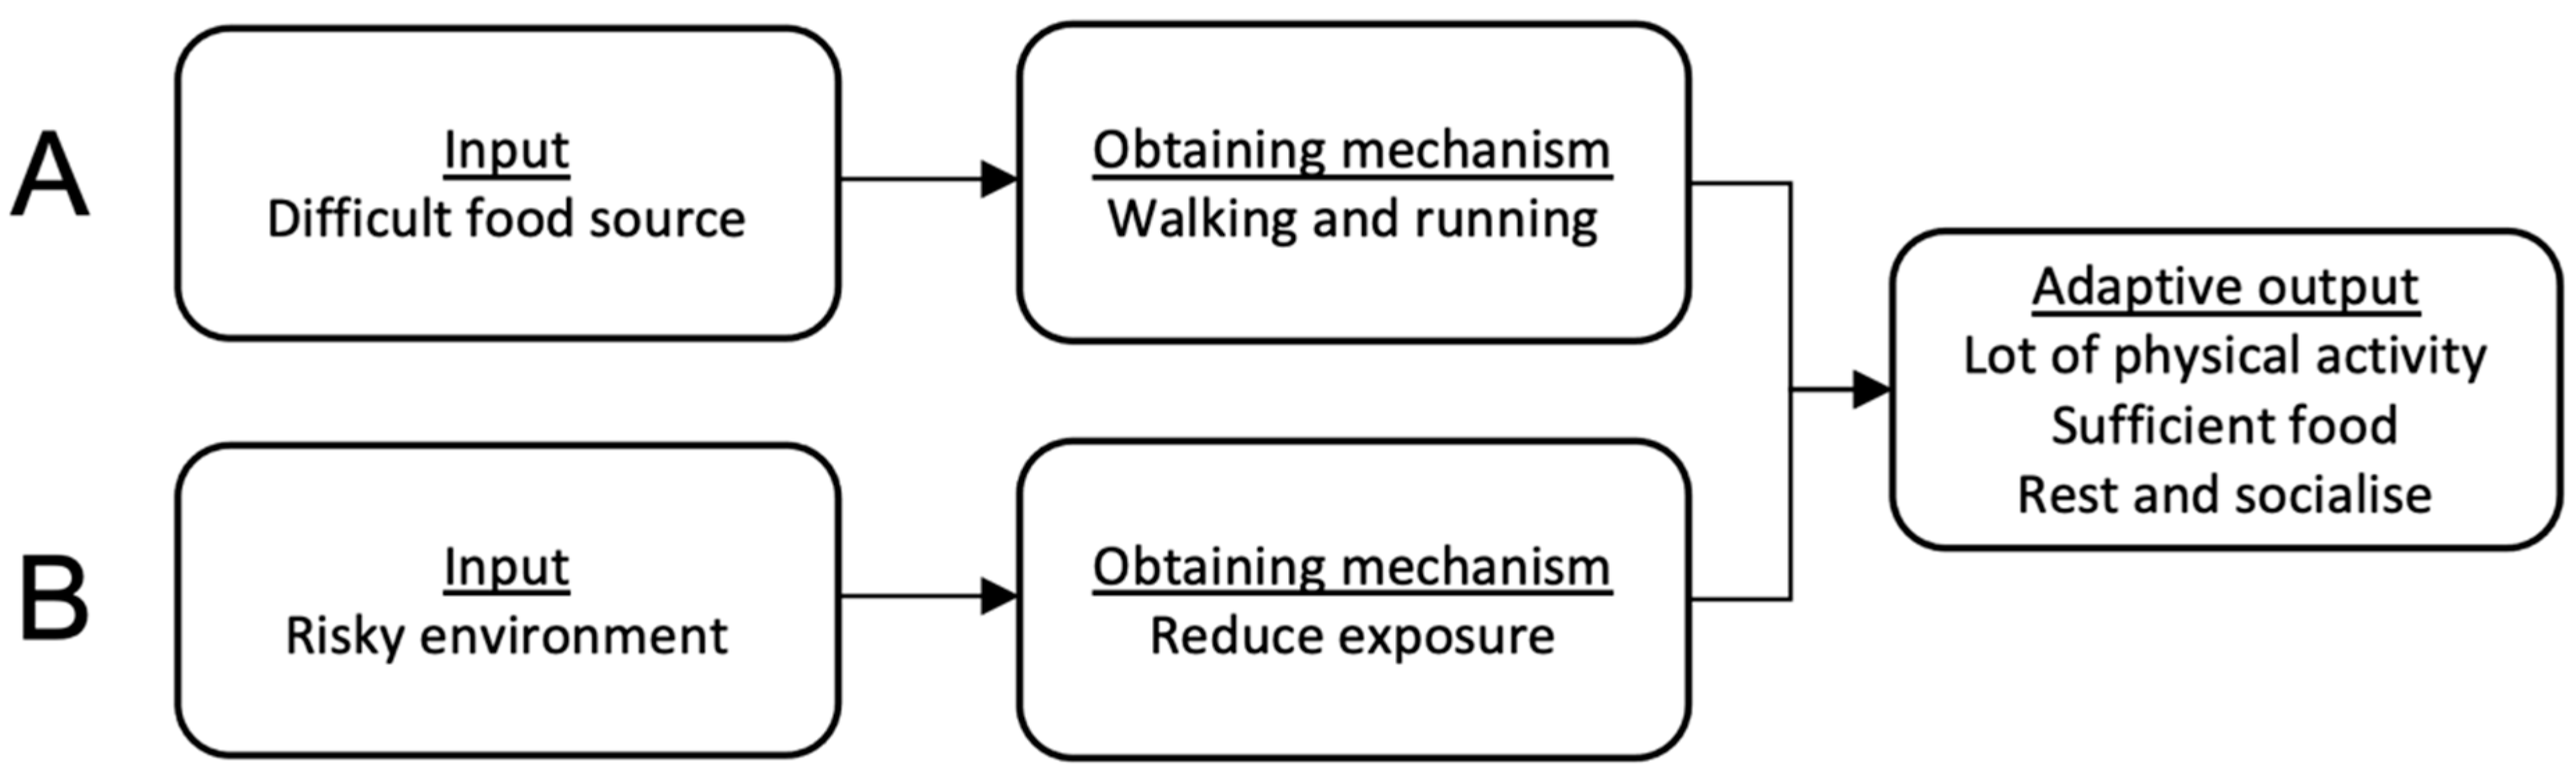
A mismatch exists when some feature of our modern environment does not match the ancestral conditions under which our bodies and minds slowly evolved over millions of years. Evolutionary psychology helps to identify and examine the mismatch, or wrong combination, between modern and ancestral contexts [
37]. Mismatch can arise in modern societies through human-induced changes. Two types of mismatches are “forced”, when a new environment is imposed on an organism, and “hijacked”, when a mechanism favours novel stimuli over stimuli that it evolved. A natural forced mismatch occurred when the ancestral environment changed from forest to savanna. The human lineage originated about 2.5 million years ago, and human bipedalism evolved as a direct result of human ancestors’ transition from an arboreal lifestyle to one on the savannas. To procure food, humans had to walk and run.
Walking, which exploits inverted pendulum motion, is very energy efficient [
38]. When humans foraged for food, mobility was not a demand derived to reach a destination, except a spring or a cache of stones. It was needed to eat. The few modern forager women average 9 km a day and men 14 km [
39]. Bipedalism made the search for food easier. The eyes were higher, so prey could be sighted and new areas, with less competition, discovered. The hands were free to carry food, use tools, and develop technology.
Despite this intense physical activity, the forager’s goal was to procure the needed calories with the least amount of work [
40]. Thus, a tendency to sedentariness has been transmitted as genetic heredity [
41], but not to conserve calories. Recent studies have shown a weak relationship between the level of physical activity and total energy consumption, a relatively stable physiological feature, more a product of our common genetic inheritance than of lifestyle [
42]. A recent hypothesis holds that keeping physical activity at the minimum level needed to procure food favoured survival because it reduced exposure to risks [
43].
Figure 5 illustrates the adaptive output of the two conflicting mechanisms.
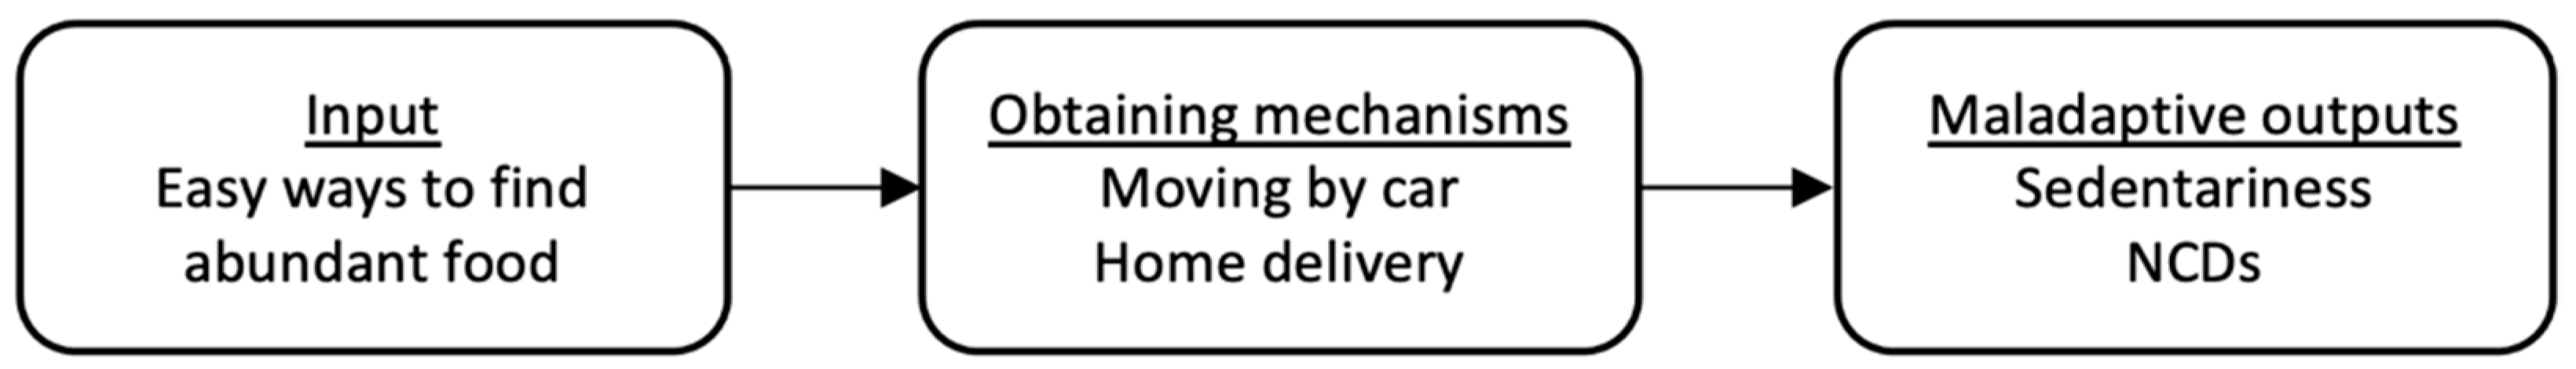
The adaptive output has always demanded enough physical activity to prevent the so-called noncommunicable diseases (NCDs), such as cardiocirculatory problems, diabetes, and some types of cancer [
43,
44,
45], but that is no longer true today.
Figure 6 shows the process from the changes in inputs in the modern context to the use of a new technology to move and the resulting maladaptive output.
Millions of years from the trees to the wheel, but only a few thousand from horseback and oxcarts to the railroad train and the Model T! Our stone-age brains have not had time to adapt to such dramatic changes. Furthermore, because damage to health usually appears only after the reproductive years, the genetic variants that promote sedentariness have no effects on selection. “People become addicted to human-created technologies that exploit our evolved preferences, and addiction is associated with a whole battery of adverse psychological and physical outcomes” [
46].
Rarely has technology provided as satisfying an answer as the car to the exigencies and motivations deriving from our genetic inheritance. The automobile overcomes the physiological limitations of human locomotion and satisfies the desire to be sedentary and at the same time our need to speed. The car is a consummate status symbol, and competing for status is implanted in us by evolution. It provides protection in environments perceived as unsafe, potentially a key aspect explaining the popularity of SUVs [
47].
However, car drivers are physiologically and psychologically inadequate to the act of driving, and the faster they go, the greater the gap. The enormous tribute of deaths and injuries make the automobile an unprecedented example of the mismatch between humans and technology. The faster we go, the worse our peripheral vision. Running on foot at speeds up to 30 km/h, humans can see a nearby prey or a predator to either side. A driver going 50 km/h cannot see a pedestrian or a bicycle next to the car.
Calculating the distance and speed of a car ahead to observe a safety distance strains our depth perception beyond its limit, and the limits may be even lower depending on age and physical condition.
Humans find it hard to perceive danger in speed because evolution has not prepared us for high speeds and their risks. When we do not use our own energy, exert our legs, and feel our heartbeat and breath accelerate, our brain does not grasp how fast we are going. This is why we can still be afraid of spiders and snakes, but we can blithely travel at more than 100 km/h. Because we like speed, but we also like to sit in a comfortable chair, the car seems perfect, but it is a mismatch. Physical activity increases creativity, productivity, learning, and determination, but sedentary behaviour is now epidemic [
45,
48].
4. The Push for Change
4.1. Preferences Change over Time
The automobile as means of urban transport par excellence, after almost a century of continuous growth, seems to have peaked and begun to decline in cities with medium-high per capita income [
49]. At the same time, public transport (PT) and active transport (AT), that is, walking and pedaling, are in a growth phase. Another important tendency is the return of residents and work to the city, in areas where alternative transport to the automobile exists and is competitive. Those who are outside the city, in zones served by rail transport, find it advantageous and are using it more and more. These tendencies began before the 2008 financial crisis and continued with little sign of reversal [
50] until the pandemic.
4.1.1. The Car Has Peaked
The use of the automobile grew in the middle of the 20th century, when public transport was in free fall; car use peaked at the beginning of the 21st century and has begun to decline with the revival of PT in dedicated lanes [
50].
This phenomenon of stabilisation and successive decline affected all developed countries. An example is the decline of motor vehicle traffic in the main metropolitan counties of the UK, between two and four points in the period 2006–2013, and London, with almost 10 points. The causes of this tendency are multiple: revival of public transport and demographic, economic, cultural, and technological effects. The variations are strongly dependent on age. Whereas persons aged over 60 took 10% more trips per capita on average, those aged 35–59 reduced them by 8%, and younger people by almost 20%. The greatest reductions occurred in the largest towns with the best public transport and highest density [
51].
4.1.2. The Demographic Effects
Young people are less likely today to seek a driving license [
52,
53].
Figure 7 gives the percentage of young people aged 16–19 with driving license from 1967 to 2018 in the United States. After the peak in 1983, there was a decline of tens of percentage points up to 2018. The phenomenon is general in developed countries and results in a reduction in trips. Young people drive less; the maximum of trips occurs at age 50. Car use discriminates by income, age, and gender. Women make only 40% as many trips as men.
Many reasons are cited for this disaffection with the car, such as, in the UK, the decline in private home ownership, increased urbanisation, increased used of information communication technology (ICT), rise of pro-environmental attitudes, decline in cars as status symbols, rise of shared mobility, and social media [
54].
4.1.3. The Return of the Bike
The rebirth of the bicycle, after the heavy decline in the years after the end of the Second World War, began in the 1970s in the dense areas of all the great cities of the Western world [
55]. The movement spread from the centre to the peripheries of the big cities and to the centre of medium-sized cities. It should also be noted that, despite the increase in cycling, the overall impact has so far been in general relatively modest in terms of long-term changes in transport demand: in 2018, bicycles represented only 2.5% of all trips in London, even though bike trips had increased 2.6 times since 2000.
The tendency is a further sign of the decline in car dependence and contributes with economical and efficacious solutions to sustainability and to overcoming the sedentary epidemic. However, adding an electric motor to the bike can cancel out the advantages of physical exercise and favour speed at the expense of safety. When destinations are near, the choice of AT is favoured, which respects the tendency to have a constant time budget for travel [
56,
57].
4.1.4. Digital Transformation
Digital technologies allow more socialising at a distance more sustainably [
58]. The new places for virtual socialising have become a major component of the popular culture. They dominate life today with infinite interactions. They facilitate relations with anyone in the world via text messages, photos, and videos, all exchanged instantly at minimal cost. They influence the lifestyle of young people, who can share their thoughts and feelings with their contemporaries instantly. This has created a fracture between the rapidity of virtual contact and the slowness of physical contact. The change that is occurring is less car, greater attraction of the neighbourhood, and virtual connections.
A first group of applications utilise the virtual connection for teaching, lectures, meetings, remote working, and many other services that provide certificates, forms, and books. A second group is B2C e-commerce, which brings a sharp reduction of trips for shopping and of distance travelled [
59], but increases goods transport.
The gains in time thanks to the constancy of the time dedicated to the trips have rebound effects confirmed by two studies. The first showed that, when teleworkers travel less often for work, they tend to travel more often for other reasons [
60]. A tangible consequence of this, and of remote working in particular, is the congestion reduction from Monday to Friday and the spread of congestion to Saturday and Sunday. Another study, in Newark, New Jersey (USA), found that vehicle use has not fallen off at all with the growth of online shopping [
61]. The hypothesis is that persons spend the time saved on other things, such as visiting friends. The intervention needed should orient such activity locally and on AT or PT.
4.2. Mobility in the Time of Coronavirus
The tendencies towards decline of automobile dependence were accentuated during the 2020 coronavirus lockdown. In the UK, of 20,000 persons interviewed [
62], 22% indicated that after the pandemic they will drive less, 24% of those over age 65; 36% will walk, pedal, and run more; 51% will drive as before; and only 1% will drive more.
At the same time millions of users abandoned public transport. It was a sort of natural experiment to assess equity and auto dependence in urban transport. The ‘access for all’ without discrimination as to income, physical ability, housing location, mode of travel, or any other factor was not respected [
63]. All the groups at risk of transport disadvantage, particularly women and old people, were also more likely to report difficulties while avoiding public transit.
The global mayors’ COVID-19 recovery task force, of the C40
cities network, have committed to healthier, more equitable, and more sustainable cities. The coronavirus has been shown to be more aggressive where the air is polluted with fine dust and nitrogen oxide [
64,
65]. But the newest, most important factor is social media. Young people have been the first to grasp the opportunities revealed by the COVID pandemic. Moreover, the automobile has rightly been seen for what it really is: not a tool for socialising but a cocoon for social distancing.
4.3. The Innovation of the Urban Interventions
Hundreds of professionals, experts, and researchers have combined their efforts to reduce dependence on the automobile and encourage PT and AT. The results are numerous innovative interventions. The four main types are:
Redevelopment of neighbourhoods with activities and services nearby, accessible on foot and by disabled people, giving priority to pedestrian and bicycle routes and keeping car routes and parking to the margins;
Development of dense and multifunctional settlements: residences, offices, shopping, and cultural venues, around public transport nodes, transit-oriented development, with distances suitable for pedestrians or cyclists;
Elimination of large central arteries and redevelopment with green social spaces, cultural and sport activities, priority to public transport, and pedestrian and bike routes;
Innovation in the system of urban distribution with non-polluting transport, distribution centres served by rail if possible, and attention to recycling.
Italy has been closing historic centres to traffic since the 1960s. In Europe there are interesting examples in the Nordic capitals of Copenhagen, Helsinki, Oslo, and Stockholm. The interventions emphasised PT accessibility with new metros, trams, and dedicated bus lanes, while keeping traffic at least 250 m from the protected zone and parking areas mostly at the margins. The closing has favoured AT and the distribution of goods, including e-commerce. The result has been a revitalisation of the centre, now a pleasant place to socialise, with shops, cultural activities, services, and offices.
For many years now, major road links in city centres [
66] have successfully been eliminated. In the 1990s, San Francisco (USA) removed significant segments of urban roads, the Embarcadero Freeway and the Central Freeway, which launched the revitalisation of the surrounding areas and led to a 60% drop in traffic. New York has removed traffic on parts of Broadway. In Asia, Seoul’s broad Cheonggye freeway was removed between 2003 and 2005. Examples in Europe include (among many others) the Georges Pompidou freeway in Paris, the M-30 in Madrid, the seafront drive in Naples, and the Via dei Fori Imperiali, with the Colosseum, in Rome. Various attempts have been made to return urban freight to rail [
67,
68]. Paris offers an example of interventions to distribute goods once again by rail and navigable canals [
69].
5. Achievements as Elements of a Paradigm Shift
These achievements should have the status of model problems, with a shift in the usual goals of growth of mobility, time saving by increasing speed, freedom of modal choice—which translates into substantial policy change. They are selected to solve the three main problems: mismatches that arise from changes in our environment to which we have not adapted; the negative impacts of technologies; and finally, the failure of existing rules, procedures, and conventional methods of planning to solve problems of increasing complexity. They can put together a package of interventions that enhance their synergetic relationships and increase the effectiveness and efficiency of policy interventions [
15]. They should reflect radical changes, based on concrete theoretical and practical achievements and well-defined problems. The achievements [
1] that are sufficiently “unprecedented to attract an enduring group of adherents” and open-ended, with plenty of problems for the “redefined group of practitioners to resolve” represent paradigms themselves and elements of a more general paradigm shift.
It emerges as the sum of exemplary solutions developed by the community of academics, experts, practitioners, decision makers, and urban communities. The new approach is more balanced and holistic. The most promising solutions are presented here, grouped by the causes each address: matching human nature; innovation to reduce the impacts of technologies; and rethinking planning methods.
5.1. Matching Human Nature
5.1.1. City of Neighbourhoods
Humans have a natural inclination towards the natural environment; this is called biophilia, love of living things [
70]. Therefore, patterns of urbanisation should enhance and restore the natural environment, reduce pollution and stress, and create socially and economically mixed districts to improve the overall quality of life for residents and visitors and nudge them [
71] towards physical activity. Air pollution may lead to less walking or cycling and greater willingness to rely on the protected and controlled environments provided by the automobile.
To encourage activity and oppose the natural sedentary habits, it is not enough to provide a walkable neighbourhood with a centre, high street, and public space. Traffic and parking must be kept at the margins. Mobility patterns are strongly influenced by the proximity of parking space. The nearer a car is parked to the home, the more often it is used.
The percentage of individuals who accept walking a given distance to reach their car or PT stop is given in
Figure 8. The curves were estimated in Vienna. If the area is attractive, the acceptance of longer walks can be increased by 70%, from 220 m to 380 m (to hold the acceptance level of 50% pedestrians).
Many other studies confirm the effect of distance not only on transport [
73,
74,
75] but also on services, shopping, and recreation [
76]. About 80% of people are willing to walk up to 300 m to a destination for recreation; they will ride a highly efficient and healthful bicycle even farther. These distances can increase in relation to the facility, safety, and amenity of the places traversed.
A pedestrian-friendly car-free zone encourages people to walk longer distances and increases the density of potential destinations because less space is used for cars. This has the double positive effects of increasing walking and reducing motorised travel. Many cities around the world are already working in this direction. The most important example is Paris, with its 15-min-city plan [
77].
5.1.2. Transform the Roads
Transformation of the roads is complementary to the city of neighbourhoods [
78]. Such transformations, as in Seoul and Rome, have often been met initially with resistance from the citizens, associations, politicians, and even traffic experts, who fear the intervention will cause congestion. The roads to transform are neighbourhood streets, the most invasive roads, and congested roads. Because congestion can reduce flow almost to zero, it actually prepares the road to be utilised by more efficient transport modes (e.g., BRT and tram) and sustainable modes (e.g., walking and bicycling), and for recreational activities, as in Seoul or Rome.
Transformation of roads is supported by research. In the UK at the end of the 1990s, a study commissioned by London Transport and the Department of the Environment, Transport, and Regions (DETR) to understand the empirical evidence of the effects of the reduction of road capacity on traffic levels detected several diminutions of traffic after the intervention at different intervals of time [
8].
The capacity reduction, in some 100 cases, led to an unweighted average reduction in traffic on the treated road or area of 41% [
79]. Further studies have confirmed the symmetry of the effects. A new road increases traffic; removal reduces it and calls into question the ability of the conventional models to reproduce human behaviour and the opportunity to use them for transport policy choices [
80].
Local businesses often oppose traffic-reduction measures for fear that their customers will go elsewhere, to more accessible (by car) parts of the city, especially large shopping malls, which, however, could contribute to urban sprawl as well as depopulation and gradual decline of downtown areas. Yet, as such cities as Paris, Berlin, New York, Copenhagen, Madrid, Oslo, Seoul, and many others have shown, pedestrian-friendly downtown areas attract business and forestall urban decline.
The quality of the environment and life is affected by traffic, with increasing costs caused by congestion, poor air quality, unacceptable levels of noise, and a weakened sense of neighbourhood and local community [
81]. With traffic reduction, attractive and popular public areas can be created. If these are properly planned, there is, contrary to what might be expected [
80], not traffic chaos but rather less air pollution and noise [
82] and greater satisfaction with the quality of public space. The vast majority of owners do not want to restore the previous situation [
83].
The solution to the redesign of cities, the transformation of roads, and the containment of the automobile is not to shift more passengers to expensive and ineffective public transport, mostly funded by taxpayers. The main directions of change are to reduce distances to services, to decrease motorised mobility, to give more reserved space to public transport, and to facilitate active transport and access for everybody.
5.1.3. Circular Economy and Logistics
Our brain adapted to life in an environment where there was, in principle, enough for all, without worrying about how the surroundings were left—a terrible mismatch today, with depletion of resources gradually destroying the planet. The many tiny or big contributions of seven billion people have collectively resulted in an irreversible problem—a textbook example of “the tragedy of the commons” [
84]. Yet individuals do not always act selfishly; they may also have some regard for the interests of others and the natural environment. Countless success stories attest that communities can overcome the tragedy of the commons without much coercion. What is needed is an effective method proposed by the circular economy for the successful management of resources [
85] combined with the four Is: information, identity, institutions, and incentives [
86].
Under the circular economy, any product planned to satisfy the requirements of the end user must also be planned to last, to be repaired, to be recycled, and possibly to become a service rather than a property. This is an application of the performance economy [
87] whereby the producers maintain ownership of the goods and sell their use as a service. For example, Michelin tires can be paid for on the basis of kilometres driven. The tread is replaced and ultimately recycled by Michelin.
The relations between suppliers and producers in the (global) supply chains no longer concentrate mainly on the production processes and final product, but must be planned to close the cycles successfully.
Figure 9 shows the three levels of strategies of increasing circularity. The highest level of circularity is to refuse some functions, rethink the use of a product, and reduce the consumption of raw materials and energy to extract and transform them. The general principle is higher levels of circularity correspond to less consumption of natural resources and environmental pressure.
Logistics is relevant for all levels of the circular economy. Cities should optimise logistics by reducing waste and operators’ costs for recyclables management. Planning better cities requires that all the facilities related to reuse and recycling are in close proximity to avoid transporting materials over long distances, unless to exploit empty return and scale economies.
The circular system will be better than the linear throw-away system only as long as the extra transport emissions are offset by decreased emissions at the end-of-life stage of the product and by the replacement of primary materials and new products.
5.2. Reduce the Impacts of Transport Technology
The automobile and ICE vehicles in general affect the efficiency of urban transport in several areas, including the use of space, the health and safety of people, the depletion of natural resources, disposal, and climate change. The need to change has opened several opportunity niches for technological innovation. The most popular and the best funded is the electric vehicle. Slowly, as the fleet is renewed, it will help mitigate problems of local emissions with beneficial effects on human health, but it will do nothing to make people less sedentary. Another opportunity niche to move efficiently in an urban context is micromobility, a range of light and small devices, including bicycles and e-bicycles. Replacing car trips with micromobility radically reduces all the impacts. However, sometimes micromobility replaces modes that are more energy efficient [
89]. The game changer technologies of transport are related to demand management, mobility as a service (MaaS), and road safety.
5.2.1. Demand Management
The automobile began as a luxury for the few. When it became mass produced, the number of car drivers freely using the roads led to an excessive, economically inefficient use that degrades road performance, raises costs, and exacerbates pollution. Traffic congestion is another case of the tragedy of the commons.
The classical solution is a congestion charge, which can work, but it has two political weaknesses. Urban roads have always been a common good managed by the public administration. If we pay to use something, it is not ours. The collective loss of the common good makes the charge politically very difficult to implement [
90]. The second weakness raises serious ethical concerns: should we be allowed to pay to pollute and to harm other people? In this way are favoured the deep CO
2e emissions inequalities between individuals [
91].
There is, however, an alternative whereby the road remains a common good, but regulated for efficient functioning. The road user is informed in advance of roads that have exceeded a certain threshold of congestion and harmful pollution and is told to stay away. Drivers who ignore the order are monitored by cameras or on-board devices and will be fined after a certain number of infractions. The fines must be high enough and numerous enough to discourage driving when congestion or pollution is over the limit. A system of rewards (e.g., reduced fares) could be used to offset this expense, for example, for users who opt to use PT instead of their cars, an efficient mode that uses only a fraction of the available road space per passenger [
90]. This solution favours PT, which is no longer trapped in congestion and is thus competitive with the speed of a car. This solution imposes a fine, not a charge. Although nobody likes fines for double parking or speeding, the public accepts them because they punish actions against the common good. There are no political consequences, but there is less traffic and pollution and more trips on alternative, more sustainable transport.
5.2.2. Mobility as a Service (MaaS)
Digitalisation dematerialises the economy, allowing sharing, an application of the performance economy [
87], which for transport means shared vehicle services. Economic change and digital technologies are driving transformative change in the transport sector. The digital economy poses new regulatory challenges that must be addressed, including competition relating to digital platforms, digital data and infrastructures, workforce development, social protection, and tax policies.
Mobility as a Service is a transition from mobility being satisfied by a dominant car ownership model to a service model where mobility needs are met by a multimodal transport service from multiple operators along with information in real time provided by smartphone. The development of MaaS is driven by the younger generation’s travel behaviour, less dominated by car ownership than by their interest in digital technologies, particularly their smartphones. Owning a car is no longer a “must have” lifestyle choice, and the younger generations are keener to have access to mobility with a card than owning a car.
Many owned cars could be replaced by fewer shared cars integrated into a MaaS.
To be effective in reducing the number of automobiles and the resulting resource and space wastage, a future MaaS must be constructed on several propositions.
MaaS should be supported by a public governance within solid transport economics and urban planning legislation to establish an effective and fair means for coordination and balance between public and private transport economic results, between regulation and private ordering regimes, and between private transport service providers (TSPs) and public mass transit.
MaaS should give priority to the transport modes with the best space-time efficiency indicators. The most efficient transport modes are train, metro, light rail, and BRT. Carsharing provides a more efficient use of cars, with less time idle, but does not help circulation. The different forms of carsharing in MaaS should be limited, complementary, and integrated with mass transit to lessen its impact on traffic.
The efficiency of public transport is dependent on its accessibility, the acceptance of walking distances to and from public transport stops. The stops should be centrally located in the neighbourhoods; traffic, parking, and carsharing should be at the edges. Shared cars should have to be returned to their parking lots, not hailed along the street. This rule will be very important with the future autonomous cars and can be justified not only to avoid an advantage for the less efficient mode, but also to avoid the obstacles to traffic presented by boarding and alighting passengers.
As behavioural economics has shown, many people stick with a system’s default choices [
71]. MaaS should thus show by default the most sustainable combination of modes for any user request. It could go further and suggest alternative destinations reachable in the neighbourhood by active transport.
5.2.3. Road Safety
Accidents are caused by a mismatch between human and technology. Compiling official statistics in which the fault is attributed to the driver in 90% of accidents does not improve safety; rather, it dismisses it. Technology can help to reduce the number of private motor vehicles with sharing and make them safer.
One way to improve road safety is to reduce exposure to traffic, the principal risk factor [
14]. Safety policies thus give priority to the management of transport demand, which is where most of the interventions noted above are directed. The change could not be more radical. On the one hand, mobility is centred on motorised traffic and humans are responsible for accidents. On the other, humans are at the centre of mobility and the traffic itself is responsible for the accidents.
Another way is to account for human limits of perception and reaction, fatigue and age, and to put the driver in optimal conditions to reduce mistakes and the gravity of consequences. This is the Vision Zero approach to road accidents, based on the simple fact that we are human and will always make mistakes [
92].
Driver assistance technologies improve safety. Some are designed to detect a possible collision and warn the driver; others are designed actually to take action to avoid a crash, by automatically braking or steering the vehicle if the driver does not do so.
Some driver assistance technologies can already reduce crashes. Front crash prevention systems have been shown to reduce front-to-rear crashes. Lane departure warning, blind spot detection, and rear crash prevention also show real-world benefits. The findings are based on a total exposure, or sample size, of nearly 6 million insured vehicle years [
93]. The UK Department of Transport expects 40% of new cars sold in the UK by 2035 to be capable of degrees of self-driving, Advanced Driver Assist Systems (ADAS) level 3 and 4, with a significant reduction in accidents [
94]. We should not wait for tomorrow’s technology when solutions are ready and needed today. A consolidated application such as intelligent speed adaptation (ISA) in urban areas would make speed limits variable spatially and temporally in relation to real time conditions of traffic and weather and would monitor vehicles automatically.
There are two ways to achieve the vision of a safe road that can reinforce each other—today with ADAS and in the future with autonomous vehicles (AV).
One is pushed by the market. The automotive industry appears up to the task. Many new cars today have competing ADAS implementations, and there are several pilots with AV. The insurance companies are now beginning to look into how this could change the way they do business. Tesla Insurance is a good example of the new way. It collects data on driver’s behaviour and the performance of its technology in real time so it can estimate individualised risk of accidents and repair costs accurately, rewarding good behaviour and technology costs with a lower insurance premium. The automotive industry can promote safety through innovative devices. Consumers can be encouraged to accept the technology by insurance rates that reward their investment in such devices as well as good driver behaviour. Government can regulate and incentivise their adoption.
The second way is pushed by authorities, who are recognising the effectiveness of ADAS and are making a number of safety features compulsory in new vehicles. A cautious approach will gradually remotely monitor the driver and gradually remove the driver’s functions to accompany the evolution towards autonomous vehicles and thus resolve the mismatch between human and the present technology.
There is, however, strong resistance to proceeding. An example are the EU new regulations on speed assistance, introduced in summer 2021.
The European Automobile Manufacturers’ Association (ACEA), in its GSR Fact Sheet, defined ISA as “systems that actively prevent drivers from exceeding the speed limit”; and yet it did not support the system on grounds that it gave too many false warnings due to incorrect road signs or outdated information and because cameras cannot anticipate all scenarios. ACEA instead supported speed limit information and warning (SLIW) systems as an effective alternative.
As a result of substantial lobbying, manufacturers can replace ISA with SLIW, a system that informs the driver that the speed limit is being exceeded but that does not support the driver in remaining in compliance with the limit. According to a study conducted by the University of Leeds (
https://environment.leeds.ac.uk/download/downloads/id/5102/isa_interface_studyaccessible.pdf. accessed on 11 January 2022), this reduces the saving of lives and serious injuries.
5.3. Rethinking Planning Methods
5.3.1. More-Human Decision Making
Rational behaviour and the theory of utility have dominated for several decades as normative and descriptive models of the decision-making process in economics, but since the 1990s evolutionary [
95] and behavioural [
96] psychologists have been seriously discussing them.
Recent transport models have utilised these concepts to modify the rational behaviour of classical economics. Regarding choice of route, one line of research has looked at network equilibrium in terms of reference points: it is accepted that the individual is sensitive to losses and gains rather than to the absolute values of the disutilities. The equilibrium is stochastic in that an individual perception of the disutility is assumed. The stochastic equilibrium of the networks has been treated with both exogenously [
97] and endogenously [
98,
99] defined reference points. Equilibrium has been analysed with dependence on a reference and with static and predictive user information systems in the context of Advanced Traveller Information Systems (ATIS) [
100]. A parallel line of research has considered the choice of route in situations of uncertainty, that is, when each route is associated with a distribution of probability of the times presumed known by the user. In other words, the choice is between one route with high uncertainty and low average time and another route with low uncertainty and high average time. In this case ‘prospect theory’ has been applied, which, unlike ‘reference dependence theory’, considers not only loss aversion but also the different attitude regarding the risk of losses and risk of gains with studies of the equilibrium with exogenous [
101] and endogenous [
102] reference points.
5.3.2. Accessibility Planning for Sustainability
In the old paradigm, transport planning has been based on the objectives of increasing capacity to accommodate the growing mobility, to reduce time and cost, and to give freedom of modal choice [
13]. The modern world, however, no longer has mobility needs. Mobility is mainly a derived demand to satisfy
accessibility to services, employment, and markets.
The practice of planning land use and transport in an integrated way is receiving growing attention. Focusing on accessibility in transport planning is an interdisciplinary way of thinking that can produce better solutions and, more importantly, can help decision makers frame better objectives [
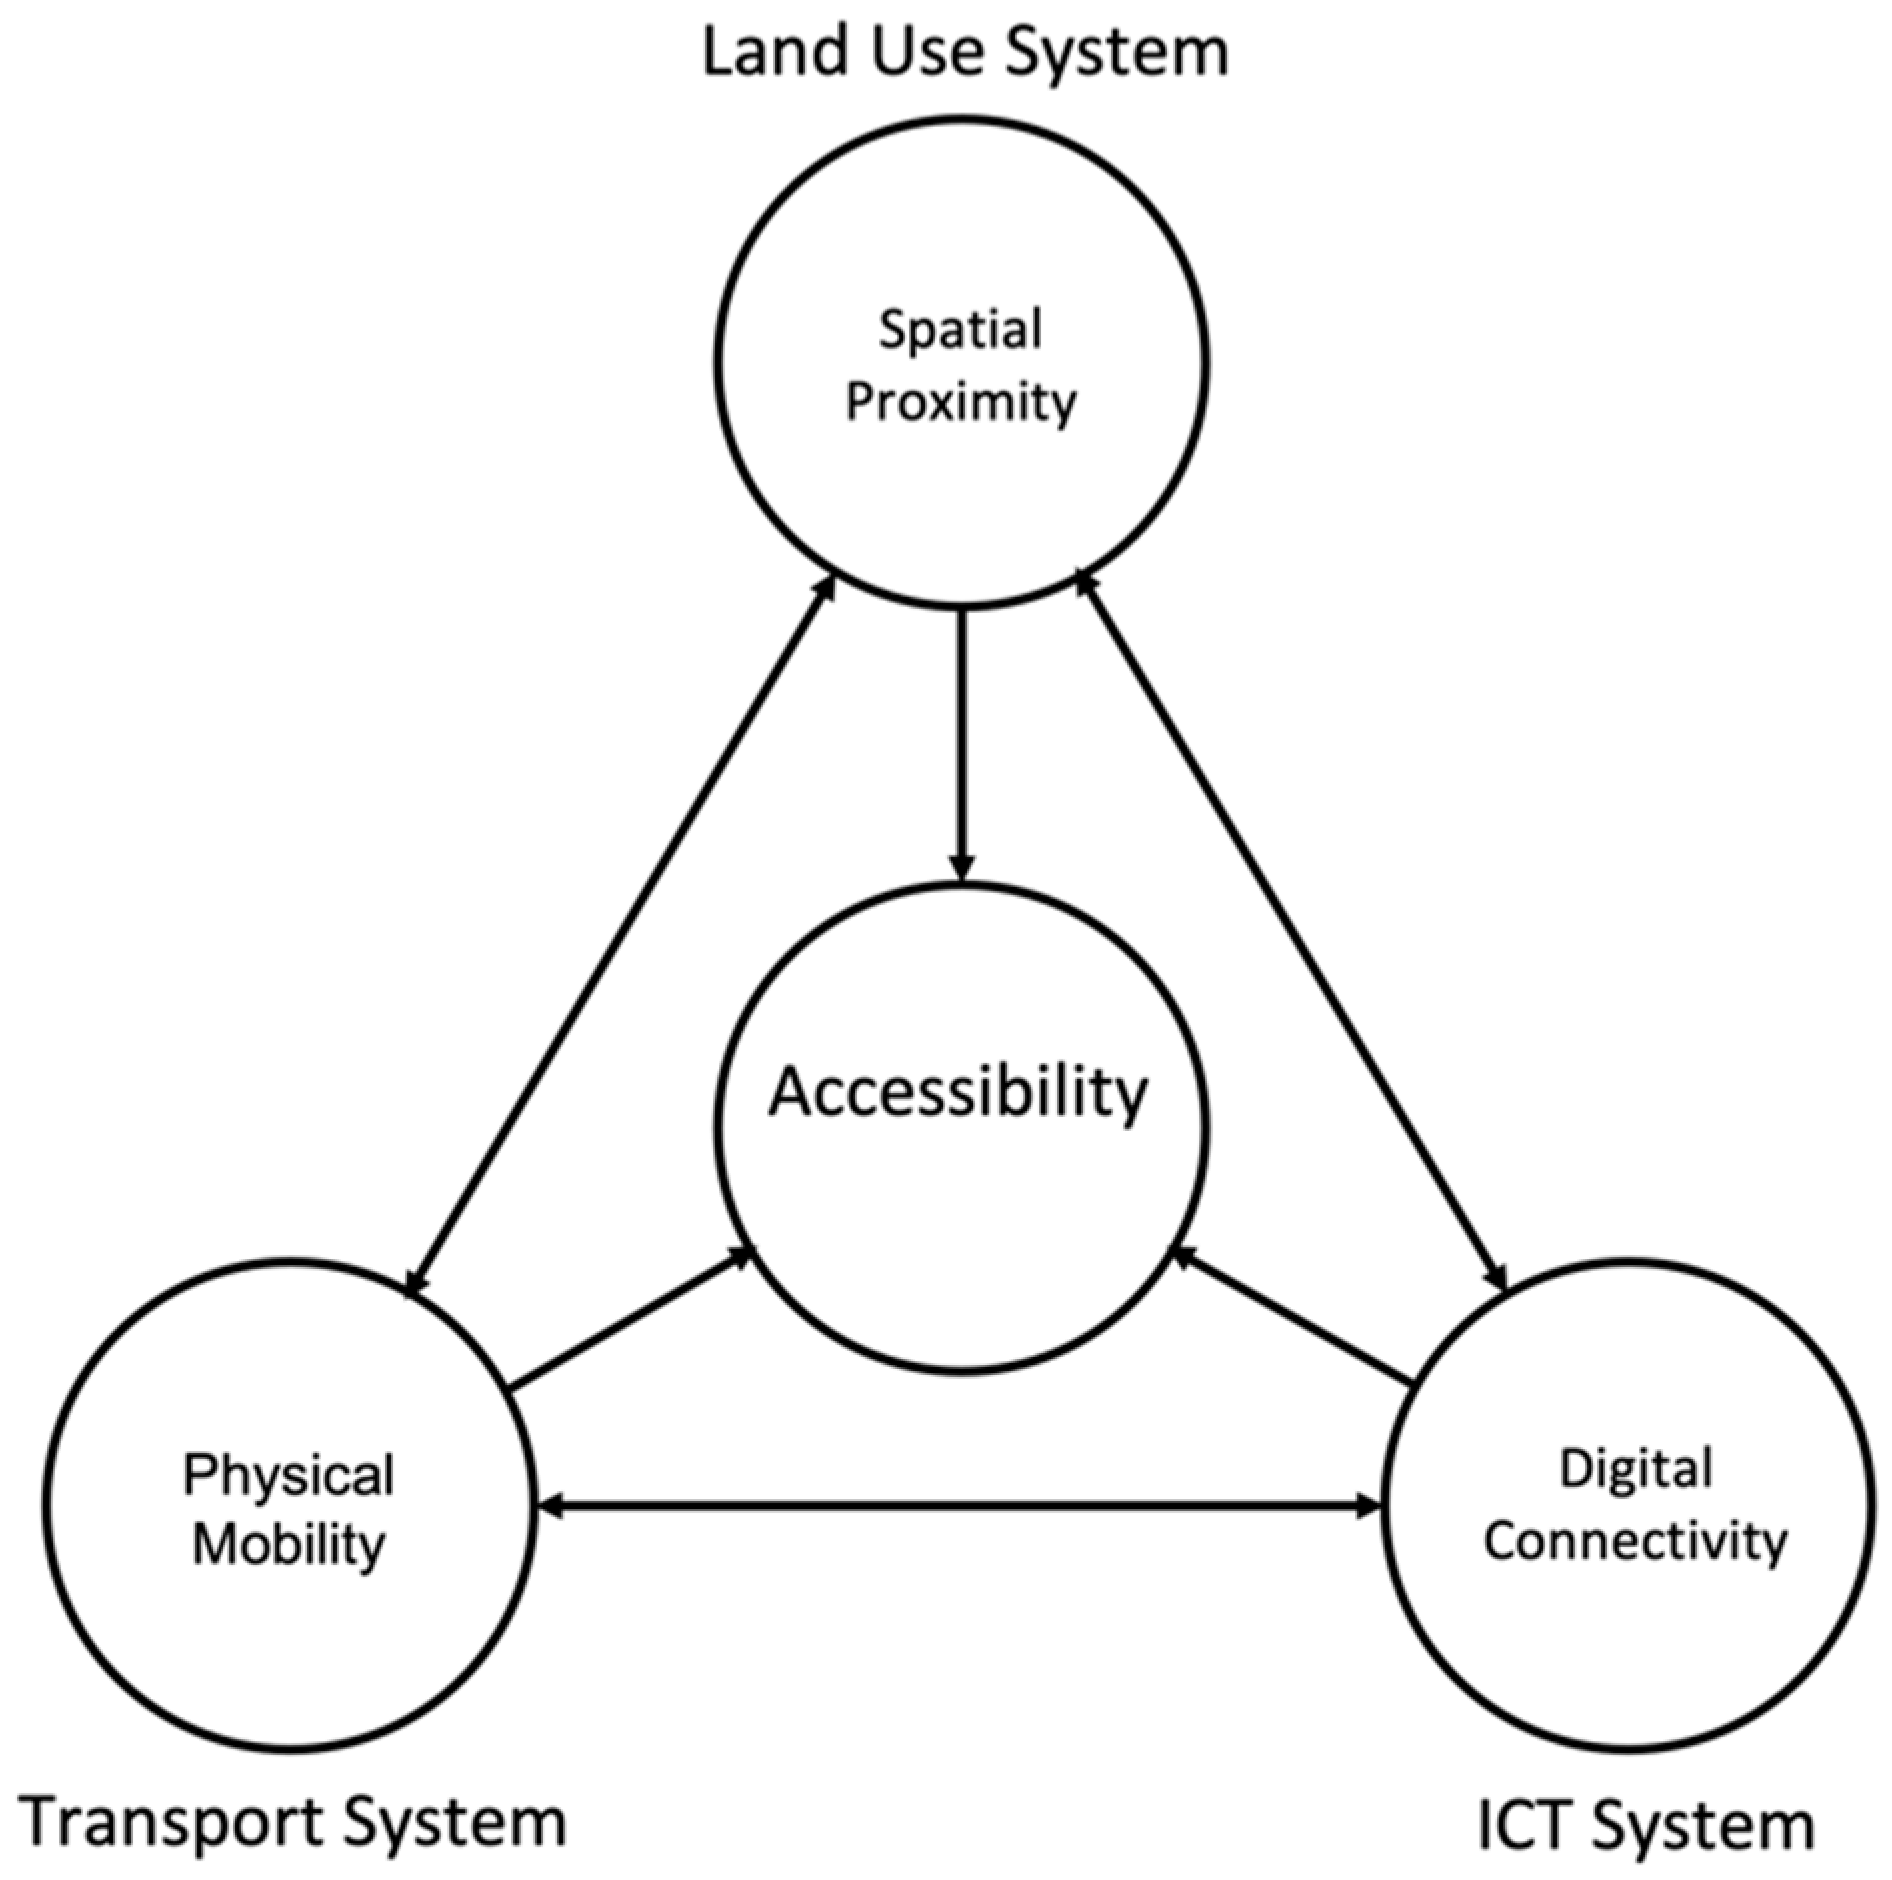
103]. Access is what is critical for social and economic prosperity. Access is not only dependent on physical mobility but also on spatial proximity of needed destinations and on digital connectivity Therefore a well-balanced urban plan can reduce physical mobility, in terms of distances per number of trips, without losing accessibility.
Figure 10 shows how physical mobility, digital connectivity, and spatial proximity interrelate and provide accessibility.
The planning process consists of three main steps plus a preliminary phase in which, to the extent possible, transport and location are made irrelevant. This would be through digital access to services (digital documents, information, library), work (remote working), and shopping (e-commerce). The first step is to subdivide the urban area into spatial data units to analyse the accessibility and mobility situation at the neighbourhood and city levels with the peripheral areas. The second step builds scenarios and develops a vision with broad social, economic, and environmental goals for a sustainable plan. The third step of the planning process has two parts. The first is local, related to destinations of proximity reachable on foot or by bicycle inside the neighbourhood; the second is urban, related to the main destinations and motorised transport. The two are closely coordinated to give coherent solutions.
Making neighbourhoods small scale (that is, small enough for essential destinations to be reached easily on foot, by bicycle, or by micromobility) is becoming a priority in the planning process. The city as a whole is sustainable only if its parts are sustainable. The main objective of local planning is to transform the neighbourhood into a livable area with a mix of destinations to maximise internal trips with AT and minimise external trips with motorised transport. The neighbourhoods are built around services, opportunities, and public transport hubs and corridors. Traffic and parking are kept at the edge of the area.
The reduction of the city to neighbourhoods where frequent needs can be reached in at most 15 min by AT does not preclude the existence of a hierarchy of more singular or important destinations (e.g., hospitals or government offices) throughout the entire urban area. The plan must, as a priority, improve accessibility to these destinations by PT and must place new area-level destinations on public transport hubs.
A recent study [
105] showed how the frequency of trips from home is inversely proportional to the distance to the destination. The plan, operating on two levels, satisfies high-frequency proximity trips with AT and less-frequent ones, to rare and specialised destinations, with motorised transport. The principle is maximum accessibility with less mobility and more sustainable transport [
106].
5.3.3. Participatory Planning
To achieve a paradigm shift towards sustainable transport, urban and transport planning requires more public involvement, larger group participation, and sometimes a politician with a vision as initiator of change.
Sustainable transport is a social as well as a technical challenge. Lifestyle and behavioural changes need to be made. It is important to build public support and understanding, with people-centred approaches, to increase acceptance and willingness to actively support and participate in new plans and policies.
Citizens and stakeholders can be involved in urban planning in three main activities:
All empower and involve the citizens and stakeholders in a participatory governance to reach the vision and the objectives of the plan. The first focuses on decision making through discussion, consultation, and information and on how citizens’ and stakeholders’ views and interests can be included. The second focuses on how citizens and stakeholders can improve the solutions by providing additional information on local conditions that planners may not have. They can find a better balance between push and pull interventions and implementability and can facilitate behavioural changes. The third is a constant evaluation of the results, whether pilot, to improve the final design, or at full scale.
These three aspects of participation are interlinked. If people are engaged in decision making and in designing interventions, this may also provide a stronger basis for acceptance and behaviour change.
Public participation should be organised by government or other institutions (top-down initiatives) and by communities and members of the public themselves (bottom-up initiatives). Citizens and stakeholders all have important and different roles to play in overcoming key barriers to interventions and in empowering different groups. The inclusion of diverse public perspectives and value positions can enhance responsiveness to citizens’ concerns and better take account of people’s contexts and experiences. For this to be effective, however, it is vitally important to include and empower otherwise marginalised groups.
Public participation is the basis for social support for political action, and this will likely lead to less confrontation, resistance, and public distrust in developing and implementing the plan. It also provides political confidence that the public wants government to act and implement the designed interventions. Indeed, research has shown that politicians and government officials highly value interactions with citizens through participatory processes. Successful participation can assure citizens and stakeholders that their actions are not isolated and can create effective change with collective efficacy.
A key activity in decision making is the assessment of the interventions or packages of interventions to choose the alternative most likely to help achieve the plan vision and objectives. The use of traditional cost benefit analysis (CBA) has become too problematic. Monetisation leads to incomplete costs and benefits. The excessive prevalence in the benefits of time savings is questioned on the basis of the induced traffic [
57,
107,
108,
109], the longer distances travelled, the use of travelled time, and the time budget [
56]. The additivity of costs and benefits with enough time saving can offset negative environmental and social impacts. The discounting of future benefits seriously diminishes long-term environmental impacts [
110]. CBA usually overlooks issues of distribution and equity. It reinforces existing problems of inequity and environmental damage, rewards the higher-income groups with new infrastructure and services, and, after decades, gives very little contribution to important policy goals—on climate change, social equity, and in developing attractive urban areas. CBA is a procedure for experts; it is applied at the end when the solutions are ready to be implemented, so there is no room for an active participation in the planning process.
An alternative is to base the assessment on the effective behaviour of the users, which implies that the benefits should derive from accessibility. Recently the International Transport Forum (ITF) has dedicated a report to supporting this position [
111].
An elegant measure of the benefits of accessibility deriving from integrated transport and land-use interventions may derive from logsum accessibility obtained from the models of choice of modality/destination [
112]. The logsum expresses the variation in users’ well-being following variations in the attributes of price and quality of the alternatives, when the choice of the alternatives is represented through a logit model [
113].
The benefits of accessibility can also be established on the basis of the variations in property values, which can be captured to finance public transport [
114]. Other benefits include the agglomeration economy, positive externalities that arise out of the interactions of firms and employees, which are made possible by spatial proximity.
Recently in the UK the National Infrastructure Commission (NIC) used a new multi-criteria analysis (MCA) approach for a large rail investment [
115]. The traditional transport user benefits, which mainly take the form of a reduction in time costs, have been replaced with improvements in productivity and access to city centres, in connectivity between the big cities and towns, in environmental impacts, in potential investment in land around stations, and in consumer amenities arising from higher city densities made possible by urban rail transport investment [
116].
Unlike CBA, MCA can manage many goals, objectives, and impacts, on urban and suburban scales, quantitative and qualitative information, intangibles, and soft impacts. In order not to be arbitrary, MCA needs a transparent decision process with participation of the citizens and stakeholders, for whom it should remain comprehensible and interesting from the outset to the final decision [
117]. The choice of MCA as assessment method is central in the context of shifting the paradigm towards more collaborative planning approaches based on citizens’ and stakeholders’ participation [
118].
A promising solution for innovative participation of large heterogeneous groups in planning activities is crowdsourcing, an online technology that enables planning organisations to reach large numbers of people at the scale and speed needed to collect information, facilitating group decision-making and intervention designing. The main reasons that online participatory tools are becoming popular are:
They facilitate information flow, faster interactions, and quicker public participation, without a high cost;
They assist the planning organisations in finding innovative solutions to assign tasks to participants or collect feedback from both sides;
They collect data from monitored passive users of the services or from users as active agents who experience the services, collect and elaborate opinions, and suggest possible improvements.
6. Policy Paradigm
Policymakers have a framework of ideas and standards that specifies the problems they want to address, the goals of their policy, and the instruments with which to attain them. This is a policy paradigm. It represents a framework of how society should be and how it functions, and in contrast what should be considered social problems [
3]. The achievements are the basis for new issues, problems, interests, goals, and remedies involved in policymaking to formulate a new policy paradigm to move in the direction of a sustainable urban transport.
The process of change is not easy, fast, or linear. It follows a sort of Kuhn cycle represented in
Figure 11.
At the beginning, the status quo is sustained by the strength of the prevailing policy paradigm that transformed cities through auto-centric planning. All the changes to adjust the policy are inside the old paradigm. They can change the quantities (e.g., more road) or the instruments (e.g., road pricing). These, called first- and second-order changes, are cases of “normal policymaking, namely of a process that adjusts policy without challenging the overall terms of a given policy paradigm” [
3].
However, the problems accumulated. In a few years the auto-centric cities were stuck in traffic, with road fatalities, pollution, and many non-communicable human diseases. There were different kinds of reaction to the problems: concealing, framing, relentless providing more of the same, stretching the limits of the paradigm, and finally experimenting new ways. The former may be successful, not so much in resolving the problems as in stopping the need for change, or they can fail, and the latter begin to attract more attention. In this case a new paradigm made up of the successful exemplars begins to coexist with the old in all or part of the urban areas but does not lead to immediate extensive changes, but to experimentations, pilot studies with new visions, goals, and instruments. It begins a process of social learning with a broad participation and conflicts to reject or accept the new goals and techniques.
The changing views of experts play a role, but with conflicting opinions. The authority to implement the new paradigm will depend on the officials and on the institutional framework, on the resources available, and on exogenous factors. Success also depends on the preparedness of the interest groups, on their ability to promote and to secure the endorsement of those in power. The policymakers must make the final decision, also considering feasibility and acceptability.
Policymaking will be effective when the new policy paradigm has the strong commitment of local policymakers, because without them there will be no concrete implementations. Its supporters need to have authority over policymaking and the new paradigm must be institutionalised.
But the replacement of the old, failed paradigm will be slow. As Max Planck, cited by Kuhn, dramatically put it, “a new scientific truth does not triumph by convincing its opponents and making them see the light, but rather because its opponents eventually die, and a new generation grows up that is familiar with it”. Centuries earlier, Machiavelli explained the difficulty of change: “There is nothing more difficult to manage, more dubious to accomplish, or more doubtful of success … than to initiate a new order of things. The reformer has enemies in all those who profit from the old order and only lukewarm defenders in all those who would profit from the new order”.
The new paradigm would encounter many barriers aimed to reinforce the status quo with positive feedback. That is, established solutions tend to lock in. The changes follow a path-dependent model where they are constrained by existing knowledge, institutions, and organisations to be slow and incremental. A strong disturbance of the status quo, a shock such as new technology applications or long-term concerns about climate change, may function as a catalyst and may make possible and desirable substantial changes through new paths led by a new paradigm. Barriers and conflicting interests can be overcome with a strong political leadership supported by citizens and civil society, and with international and national transfer of knowledge and resources for a long-term transition.
7. Conclusions
The conventional planning method of predict and provide keeps cities stuck in a sort of path dependency where people are attracted to certain aspects of modern urban life, namely, sedentary behaviour and travelling by car, by their genetic heritage. People are simultaneously drawn to stay put (and safe) and to travel fast. Yet associated with this behaviour are many mismatches because our bodies and brains have not adapted to modern urban life and the many adverse effects produced by transport technologies. Nevertheless, some changes are appearing, especially in young people, in the urban realisations and transformations that prefigure new planning goals and methods.
Evidence exists that a paradigm shift is under way thanks to many different achievements of the combined efforts of scientists, researchers, practitioners, and policymakers. It takes the form of an ecological transition to sustainable urban transport operating in three different directions. First, the city must be adapted to human nature, with better accessibility for pedestrians of all kinds and bicycles, in a pleasant environment with restricted car access. Second, advanced technologies and regulations are needed to minimise negative externalities, such as energy consumption, congestion, pollution, lack of physical activity, road accidents, and social inequalities, and hence to improve sustainability. Third, the interventions should form a package in the context of an urban transport plan that is more balanced, holistic, and participatory in relation to a wide range of social, cultural, and environmental issues. Participation and communication permit social learning, indispensable to balance the genetic inheritance with personal experiences and culture, and the political process to formulate, establish, and institutionalise the new policy paradigm by interaction among social groups, political institutions, policymakers, and public opinion.
All the findings and the new paradigm are based on concrete applications that prove how it can be applied in practice with attention to the transferability of the experiences.
Although this research has produced many important findings, they are still in the empirical phase of collection and selection of achievements. Lengthy and extensive work is needed for a systematic structured approach. The achievements of the new paradigm are outstanding, permanent, and open. It can attract many researchers, practitioners, and policymakers. The new paradigm can gain dominance through successes proved in the field. Thus, it is fundamental to improve knowledge to increase acceptance and provide opportunities for applications in practice. The first is mainly the job of universities and research centres. The second depends on the commitments of policymakers to allow and facilitate applications and to deliver new institutions and resources in support of the new paradigm.

