1. Introduction
The food system is one of the key contributors to climate change [
1]. To reduce environmental pressure of food system on earth resources, a shift toward more sustainable dietary patterns, along with improvements in food production and large reductions in food loss and waste, is needed [
2,
3]. Sustainable diets are defined by The Food and Agriculture Organization of the United Nations (FAO) being as environmentally respectful, nutritionally adequate and healthy, economically fair and affordable, and culturally acceptable [
4]. Plant-based diets are defined as diets that “include wholegrains, legumes, nuts and an abundance and variety of fruits and vegetables” and “can include moderate amounts of eggs, dairy, poultry and fish; and small amounts of red meat”, and are recognized as more sustainable diets than current Western ones [
5]. Among plant-based products, the plant-based “dairy-like” (PBDL) category includes products that are designed to be similar to dairy products in term of organoleptic characteristics (color, texture, mouthfeel, etc.) and usage (e.g., with breakfast cereals, in coffee, for cooking, eaten as a dessert). PBDL products include plant-based (PB) drinks (almond, rice, and oat drinks), PB desserts (resembling dairy dessert creams), and plant-based dairy alternatives (PBDAs). PBDAs are designed to have a nutritional composition similar to dairy (protein quantity and quality; calcium, vitamin B2, vitamin B12, and vitamin D fortification) in addition to similar organoleptic and usage characteristics. PBDL products are experiencing fast growth worldwide, e.g., in France where purchased quantities at least doubled between 2015 and 2018 [
6]; however, when compared to dairy products, PBDL products remain rarely consumed [
7].
PBDL consumers declare that one of their key reasons for choosing plant-based products is perceived healthier status and positive impact on the environment [
8,
9,
10]. Indeed, PBDL products have been reported to have a lower impact on several environmental indicators (carbon impact, total land use (not considering the type of land), energy use, nitrogen footprint, eutrophication, and acidification) on a weight basis than dairy products [
11,
12]. Several PBDL products provide nutritional characteristics similar to cow’s milk [
11,
12,
13]. However, evaluating the sustainability of an individual food on its own is not relevant, as no single food can provide all essential nutrients and instead needs to be combined with others to constitute a healthy diet. Evaluating the contribution of individual foods to sustainable diets is more in line with the sustainable diet concept.
Diet optimization is an appropriate tool to explore solutions that seek to improve the sustainability of diets, as it allows multi-dimensional issues to be addressed simultaneously [
14]. The aim is to find the optimal combination of foods as defined by an objective function for a population, a subpopulation, or an individual in order to fulfil a set of constraints related to nutrition, environment, cultural acceptability, and/or cost. Optimization studies conducted on average food consumption have indicated that reducing the carbon impact of diets by more than 30% while ensuring nutritional adequacy may impair the acceptability of dietary changes [
14]. Optimizing diet individually (i.e., building one optimization model per person) rather than for a population or subpopulation enables individual food habits to be taken into account. In addition, an entire sample of individual optimized diets is generated, thereby enabling statistical tests to be run on variations between observed and optimized food quantities.
The objective of this study was to explore what the role of PBDL products could be defined within a mathematically-derived more sustainable diet for a given population. We used multi-criteria mathematical optimization of individual diets [
15] applied to a representative sample of French adults to assess whether PBDL products would be present in optimized diets. More sustainable optimized diets were developed for each individual, and were defined as theoretical diets that simultaneously addressed the dimensions of cultural acceptability (i.e., the diet was designed to be as close as possible to the existing individual’s diet), health (i.e., nutritionally adequate), and the environment (i.e., the diet was designed to have a 30% reduced carbon impact).
2. Materials and Methods
2.1. Dietary Data
The actual dietary data used for this study (referred to as the observed diets) were obtained from the French seven-day dietary record in the Individual and National Study on Food Consumption (INCA2), conducted by the French Agency for Food, Environmental, and Occupational Health and Safety (ANSES) between December 2005 and May 2007 in samples of French adults and children [
16]. The samples were obtained using a multi-stage cluster sampling technique established by the French National Institute for Statistics and Economic Studies (INSEE), and were made representative of the French population through stratification (region of residence and size of urban area) and use of the quota method (age, sex, household size, and socio-professional status of head of household). The sampling frame was approved by the French National Commission on Informatics and Liberty (Commission Nationale de l’Informatique et des Libertés). These analyses are based on the adult sample (
n = 2624). Under-reporters identified using the Goldberg method [
17] were removed from the analyses (
n = 706), as were 55 individuals who reported dietary intake for less than seven days. The final sample was composed of 1863 individuals, including 1111 women and 752 men, representative of the French population. Because recommended nutrient levels are different for men and women, analyses were stratified by gender.
2.2. Nutritional Composition and Carbon Impact Data
Individual dietary nutrient intake and carbon impact were estimated by matching food consumption data from the INCA2 study with the previously described SUStable database, which contains the nutritional composition and carbon impact of 212 frequently consumed French foods (covering 84% of the total adult energy intake) [
18]. The nutritional composition of SUStable foods was obtained from the French nutritional composition database (French Information Center on Food Quality, CIQUAL;
n = 1300 foods) and their carbon impact was obtained from a database of 402 foods built previously by the environmental consultancy firm BIO by Deloitte [
19]. The SUStable database already contained four PBDL products; two others were added for this study in order to illustrate the recent diversification of the product offerings in this market compared with the survey period. The nutritional composition and carbon impact of these six PBDL products can be found in
Supplemental Table S1, and were consolidated using Alpro
® (European market leader in PBDL products) internal data as well as the existing literature [
12]. Matching INCA2 food consumption data with the updated SUStable database enabled estimation of the nutrient intake and carbon impact of each individual diet.
2.3. Food Categorization
The categorization of 212 foods into seven groups and 33 subgroups was adapted from Gazan et al. [
18] to reflect the focus of this study on PBDL products (
Supplemental Table S2). PBDL products were split into three different categories: PBDAs, PB desserts, and PB drinks. PBDAs included three food types: soy-based drinks, soy-based alternatives to plain yogurt, and soy-based alternatives to fruit yogurt. PB desserts included only one food item, soy-based desserts. PB drinks included two foods, almond-based drinks and oat-based drinks.
Each PBDL product category was further divided into different food groups and subgroups. As a result of their nutritional similarity to dairy products, the PBDA category was assigned to the “dairy products and alternatives” group, which was thus composed of the Milk, Yogurt, Cheese, and PBDA subgroups. Due to the intended moment of consumption and presence of added sugars, the PB desserts category was included in the “dairy desserts and alternatives” subgroup of the “sweetened and salty products” group. Due to low protein content, the PB drinks category was included in the “sweetened drinks” subgroup within the “water and drinks” group.
2.4. Nutritional Quality Indicators
The nutritional quality of the observed diets was assessed using three previously described nutritional quality indicators: mean adequacy ratio (MAR), mean excess ratio (MER), and solid energy density (SED) [
20]. In short, the MAR was estimated for each individual diet as the mean percentage of daily recommended intakes for 23 key nutrients to favor, the MER was calculated for each diet as the mean daily percentage of maximum recommended values for three nutrients to limit, and the SED was calculated for each diet by dividing energy intake by ingested weight for solid food only.
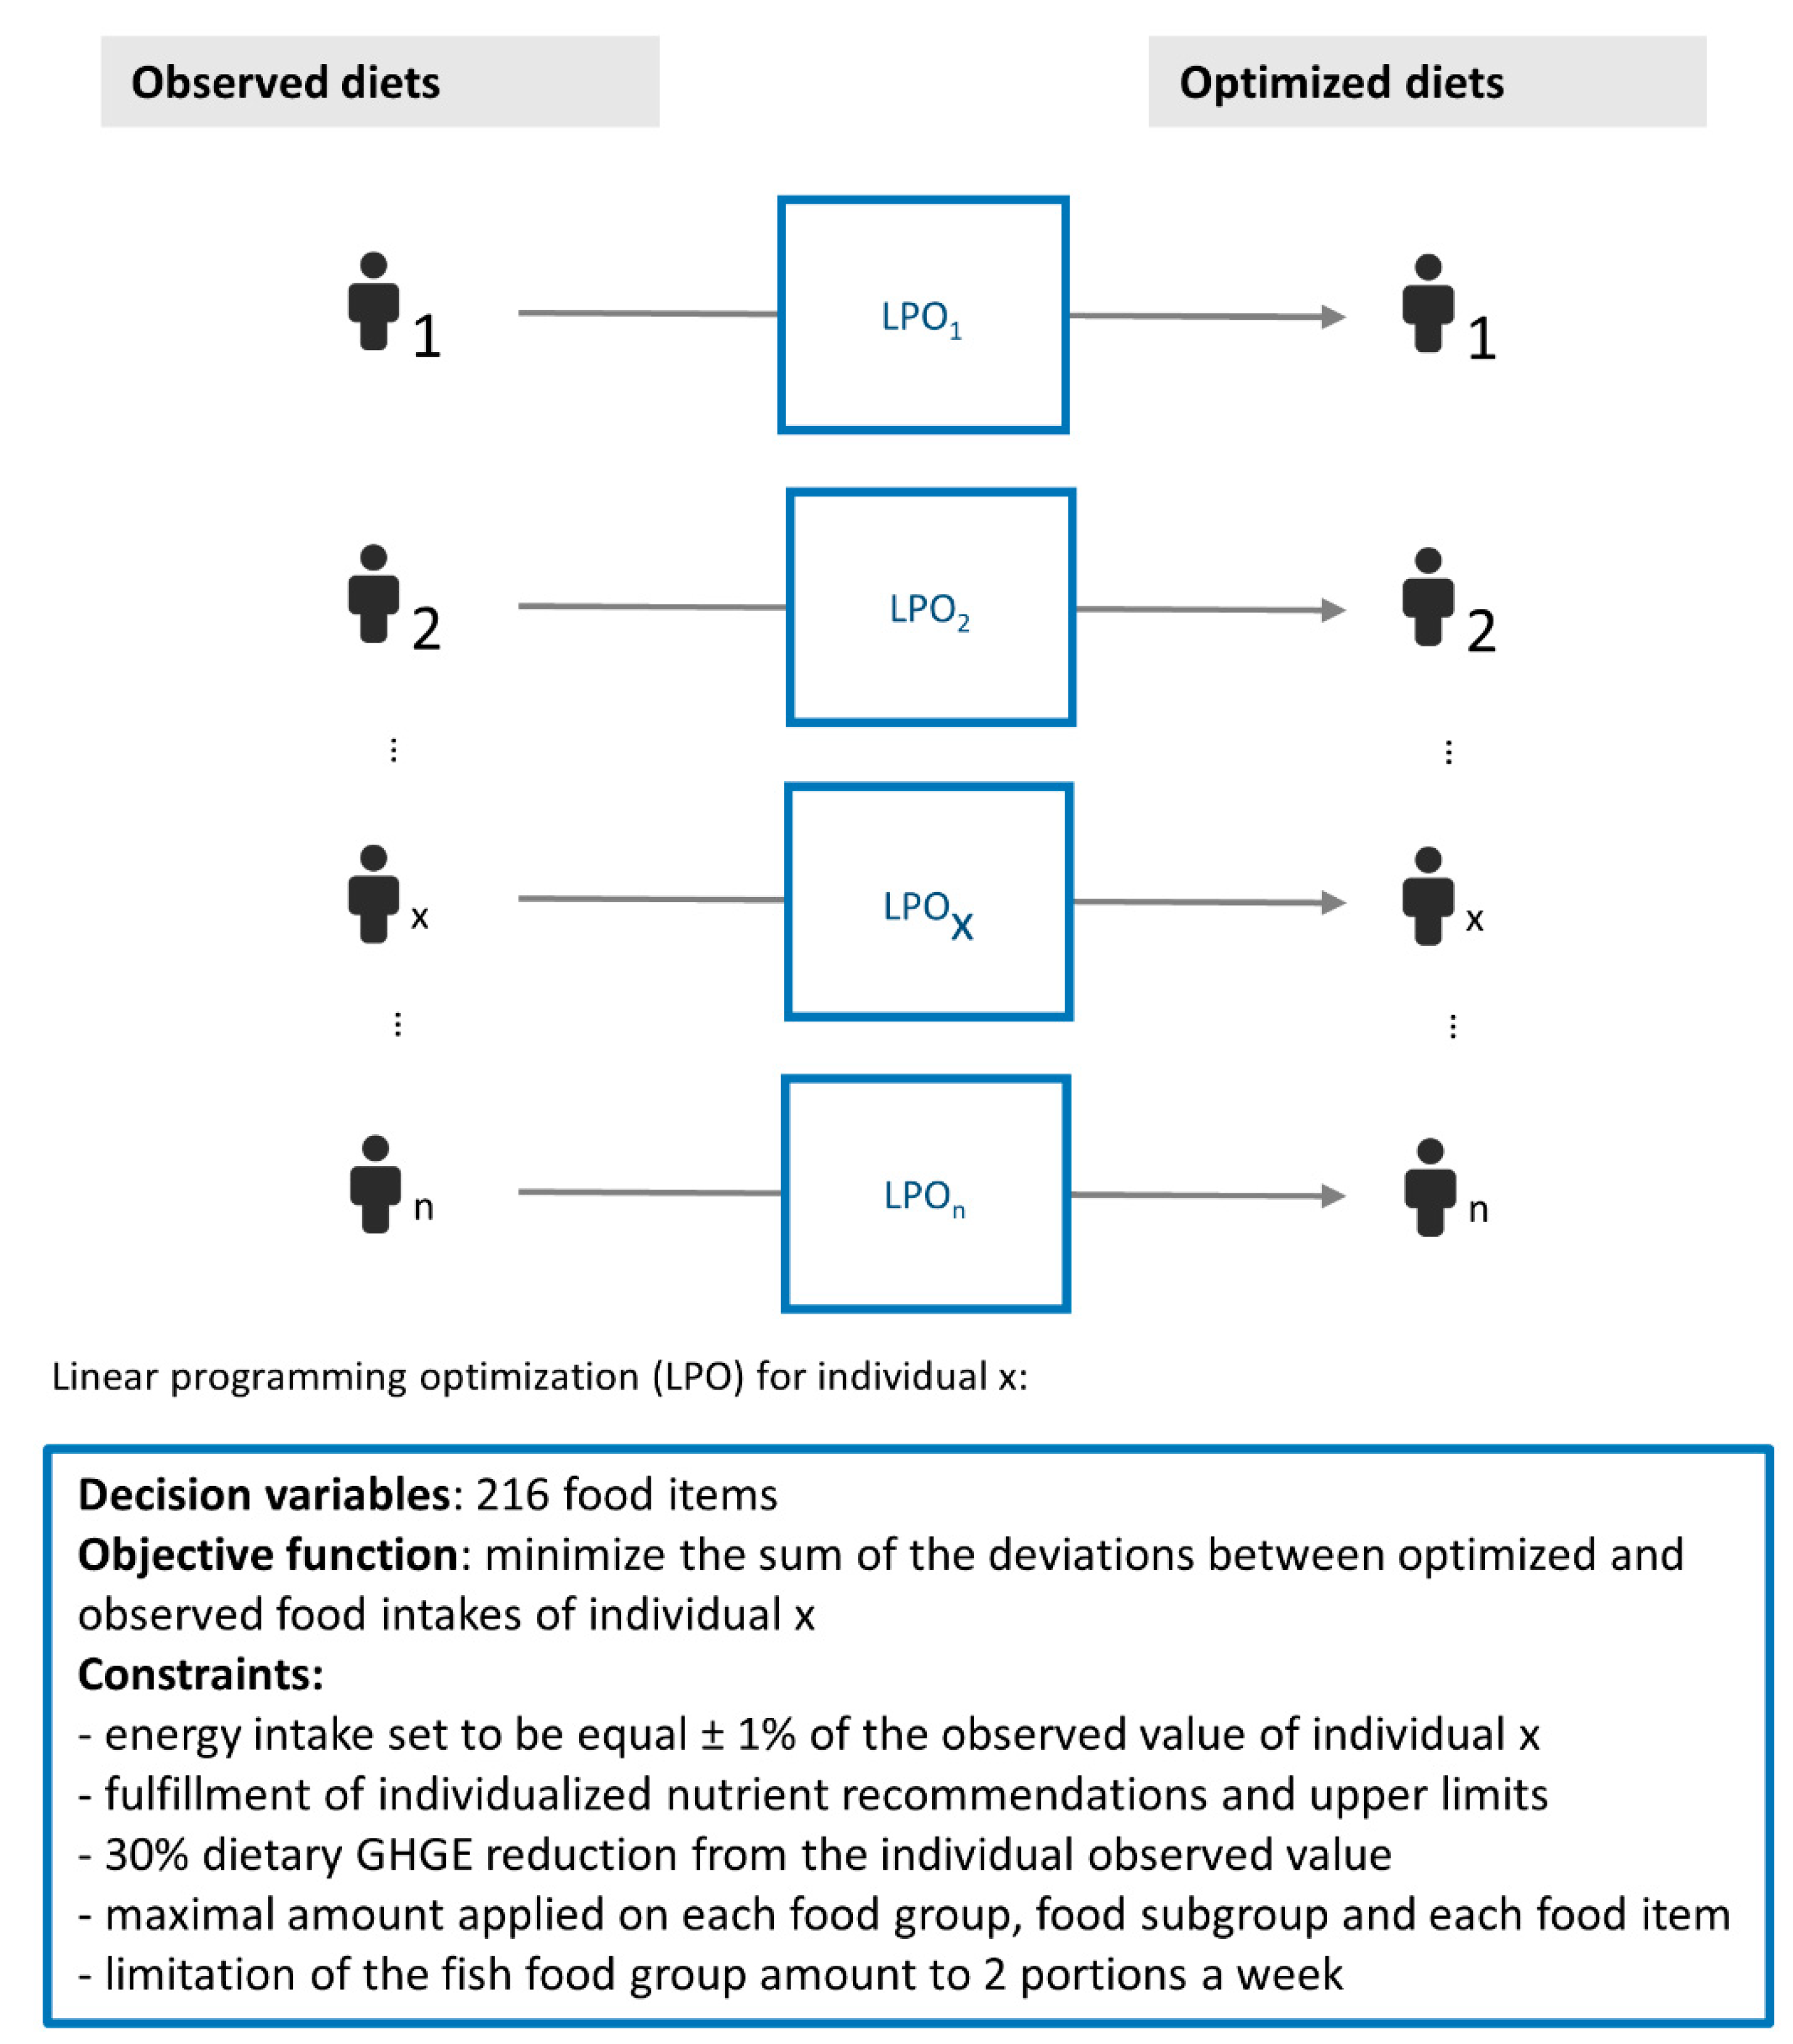
2.5. Diet Optimization
For each individual, a multi-criteria linear programming model was developed in order to design each individual’s optimized diet (
Figure 1).
The model aims to achieve nutritional adequacy (i.e., achievement of recommended intakes, corresponding to intakes at the level of recommendations for each of the 34 nutrients and for each individual) with a 30% reduction in diet carbon impact (constraints of the model) while staying as close as possible to the corresponding observed diet (objective function of the model) and giving access to a broader list of foods (variables of the model) than those already consumed by each individual. Each parameter (variables, objective function, and constraints) is described more precisely below.
2.6. Variables and Objective Function of the Model
In order to address cultural acceptability, the optimal diet for an individual was designed to be as close as possible to the observed one in terms of food quantities. Therefore, mathematically, the objective function that was minimized was as follows:
where, for an individual
i,
is the optimized quantity of food
j and
the observed one.
can be either null (if not present in the individual’s observed diet) or not null (if already consumed). N is the number of food variables available for the optimization, corresponding to the total number of foods consumed in the entire population sample. If not already consumed in the observed diet, liver, “foie gras”, oysters, bottled water, and fortified sweetened breakfast cereals were excluded due to high frequency of avoidance, seasonal availability, high price or high and multiple fortification level, as was the case in previous studies [
15,
21,
22].
2.7. Model Constraints
In order to address the health dimension of the sustainable diet concept, nutritional adequacy was ensured by applying constraints on dietary content in terms of macronutrients, water, seven fatty acids, ten minerals, ten vitamins, free sugars, cholesterol, and total dietary fibers (
Supplemental Table S3). These constraints were based on the French RDAs (Recommended Dietary Allowances) for fibers, vitamins, and minerals (except sodium) [
23], and were supplemented by the EFSA’s scientific opinion on the adequate intake of water as a nutrient [
24] and the Nordic Nutrient Recommendations for sodium [
25], because of the absence of equivalent recommendations in France. Moreover, WHO guidelines on proteins [
26], fats (including total fats, alpha-linoleic acid, linoleic acid, DHA plus EPA, omega 3, PUFA and SFA), carbohydrates, cholesterol, and free sugars [
27] were used, as was the case in a previous optimization-based study showing that fulfilling French values for those nutrients was difficult even at the population level [
28]. Vitamin D adequacy is not easily achieved with common foods. Putting a constraint on vitamin D intake might lead to unrealistic optimized diets; therefore, as was the case in previous studies, we did not constrain it in the present study [
29]. Energy content in each optimized diet was set as being ±1% of the energy content in each individual observed diet.
In order to address the environmental dimension of the sustainable diet concept, a 30% carbon impact reduction constraint was applied for each individual diet. Thirty percent (30%) was selected as a reduction target because a previous study indicated that a more drastic carbon impact reduction would imply non-acceptable dietary changes [
30].
In addition to nutritional and environmental constraints, acceptability constraints on foods, food groups, and subgroup quantities were used in the model to ensure that optimized diets stayed within the range of diets actually consumed by the general French adult population, thereby addressing the cultural dimension of the sustainable diet concept. Even if the objective function minimizes the distance to amounts of foods in observed diet, optimization might lead to a quantity for a given food that can be considered as culturally unacceptable. In order to limit this risk a maximum amount was set for each food, defined as the 95th percentile of the intake distribution among consumers of this specific food and for each gender separately. The 95th percentile of soy-based drinks was applied as a maximal amount for almond-based drinks and oat-based drinks, as these two foods were not present in the observed diets. Maximum amounts were set for food groups and subgroups as well, and were defined as the 95th percentile of the intake distribution calculated for the whole population, including both consumers and non-consumers of those specific groups and subgroups and for each gender separately. Observed 95th percentile was 0 for the PBDA subgroup because it was consumed by less than 5% of the INCA2 population in 2006–2007. As the objective of the study was focused on PBDL, the maximal amount constraint for PBDA subgroup was removed; concerning PB drinks and PB desserts products, as they are included in “sweetened drinks” and “dairy desserts and alternatives” subgroups, respectively, they were constrained by the 95th percentile of their respective subgroups. As recommended by the ANSES [
28], an additional constraint was set to limit the maximal quantity of fish and seafood (including marine and freshwater fish and shellfish) to two portions per week (200 g) in order to take toxicological risk into account.
2.8. Model (In)Feasibility
Variables and constraints define an area of possible solutions in which the objective function will select the optimized one. However, it is possible that given the variables and constraints in question, there may be no possible solution for a specific individual. This situation is called “infeasibility”, and is an interesting parameter to follow; for example, it has been previously demonstrated using the optimization approach that US 2010 Dietary Guidelines for sodium were incompatible with potassium guidelines and with nutritionally adequate diets [
31]. In this study, we will assess the feasibility rate, which means the percentage of subjects whose individual diet were able to be optimized.
2.9. PBDL Product Tracking Sub-Populations
In order to better understand the changes caused by diet modelling, sub-populations of individuals were identified based on the presence or absence of at least one PBDL product in their optimized diets, and based on the novelty (or not) of said presence vs. their observed diets (
Table 1).
Four sub-populations, called “PBDL product tracking sub-populations”, were defined:
OptStillNoPB: sub-population of individuals with no PBDL product in their observed and optimized diets
OptAddedPB: sub-population of individuals with no PBDL product in their observed diet and with at least one PBDL product addition in their optimized diet
OptStillPB: sub-population of individuals with at least one PBDL product in both their observed and optimized diets
OptNoMorePB: sub-population of individuals with at least one PBDL product in their observed and not in their optimized diet.
2.10. Statistical Analysis
First, the nutritional quality, carbon impact, and energy intake of the observed diets were compared between individuals consuming at least one PBDL product (i.e., PBDL consumers) and individuals consuming none (i.e., non-consumers) using general linear models (GLMs) adjusted for age, family status, educational level, physical activity level. and total energy intake.
Second, the percentage of subjects whose individual diet could be optimized (feasibility rate) was estimated. For those individuals where optimization was possible, dietary changes due to optimization were analyzed by comparing the observed food quantities with the optimized ones. As compared samples (i.e., observed individual food quantities vs. optimized individual food quantities) were dependent upon each other (same individuals in both samples), quantities were compared using a mixed model to account for repeated measurements. Composite mixed dishes were decomposed by ingredient for this analysis.
Third, statistical analyses were performed between PBDL product tracking sub-populations (OptStillNoPB, OptAddedPB, OptStillPB and OptNoMorePB). Energy intake and observed and optimized food group quantities were compared between sub-populations using GLMs adjusted for age, family status, educational level, and physical activity level. Observed and optimized quantities were compared using a mixed model to account for repeated measurements. Comparisons were performed after summing dairy products (Milk, Yogurt, and Cheese) and all PBDL products (PBDAs, PB desserts, and PB drinks). Diet optimization and statistical analyses were performed using SAS version 9.4 (SAS Institute, Cary, NC, USA), and an α of 5% was used for all statistical tests. Diet optimization was performed using proc OPTMODEL.
2.11. Sensitivity Analysis
Two independent sensitivity analyses were performed. The first aimed to assess the impact of fortification on the selection of PBDL products by the model; the second aimed to assess to what extent adding (as decision variables) only PBDL products to the list of foods already consumed by the individual could help achieve nutritional adequacy with a 30% carbon impact reduction.
In the first sensitivity analysis, the model was run again by modifying the nutritional composition of PBDL products to remove fortification. The vitamin D content and vitamin B12 content in PBDL products were set to 0 µg/100 g, while calcium and riboflavin were set to 12 mg/100 g and 0.01 mg/100 g, respectively, as reported for the unfortified soy-based drink in the French food composition table [
32].
In the second sensitivity analysis, two additional diet optimization models were run: one allowing only access to foods already consumed by the individual (mathematically, the number of variables N in equation (1) was reduced to the number of foods currently consumed by the individual), and the other allowing foods already consumed by the individual plus PBDL products. All the other parameters of the original model were kept unchanged. The feasibility rate was compared between the original model and these two additional models using McNemar’s test. Equations for the nutritional, environmental, and acceptability constraints as well as the objective functions used (main analysis and sensitivity analysis) are presented in
Supplemental File S1.
3. Results
The nutritional quality, carbon impact and energy intake of the observed diets were compared between PBDL consumers and non-consumers. Then, among feasible diets the dietary changes due to optimization were analyzed. The energy intake as well as the observed and optimized food group quantities were compared between PBDL product tracking sub-populations.
3.1. Description of Observed Diets
A total of 2.5% of men (
n = 19) and 7.3% of women (
n = 81) reported having consumed PBDL products in their dietary record. Because a very low percentage of men consumed PBDL products, all the results displayed in the core manuscript focus on women. However, the results for men are available in
Supplemental Tables S8 and S9, Figures S1–S3.
Table 2 shows the nutritional characteristics and carbon impact of the diets of PBDL product consumers vs. non-consumers. PBDL product consumers were older, more frequently had a partner and no children, and had a higher educational and physical activity level than non-consumers (
Supplemental Table S4).
Mean energy intake and mean dietary carbon impact (approx. 3684 g CO2 eq/d) did not differ significantly between PBDL product consumers and non-consumers. When compared to non-consumer women, female PBDL product consumers had diets with higher nutritional quality, as evidenced by a higher MAR, a lower MER, a lower energy density, and a higher number of different consumed foods (a proxy of diversity).
Results for men were very similar to those obtained for women (
Supplemental File Table S8). One difference was the carbon impact of diets, which was lower for PBDL product consumers than for non-consumers in men. Another difference between men and women involved nutritional quality indicators, which were not significantly different between PBDL product consumers and non-consumers in men, while they were in women.
3.2. Description of Optimized Diets
The feasibility rate (i.e., the percentage of individuals for whom an optimized diet could be designed) of the model was 97% (n = 1077) in women and 98% (n = 739) in men, for a total feasible sample of 1816 individuals. All of the following results involve the 1077 women for whom it was possible to design an optimized diet with the model.
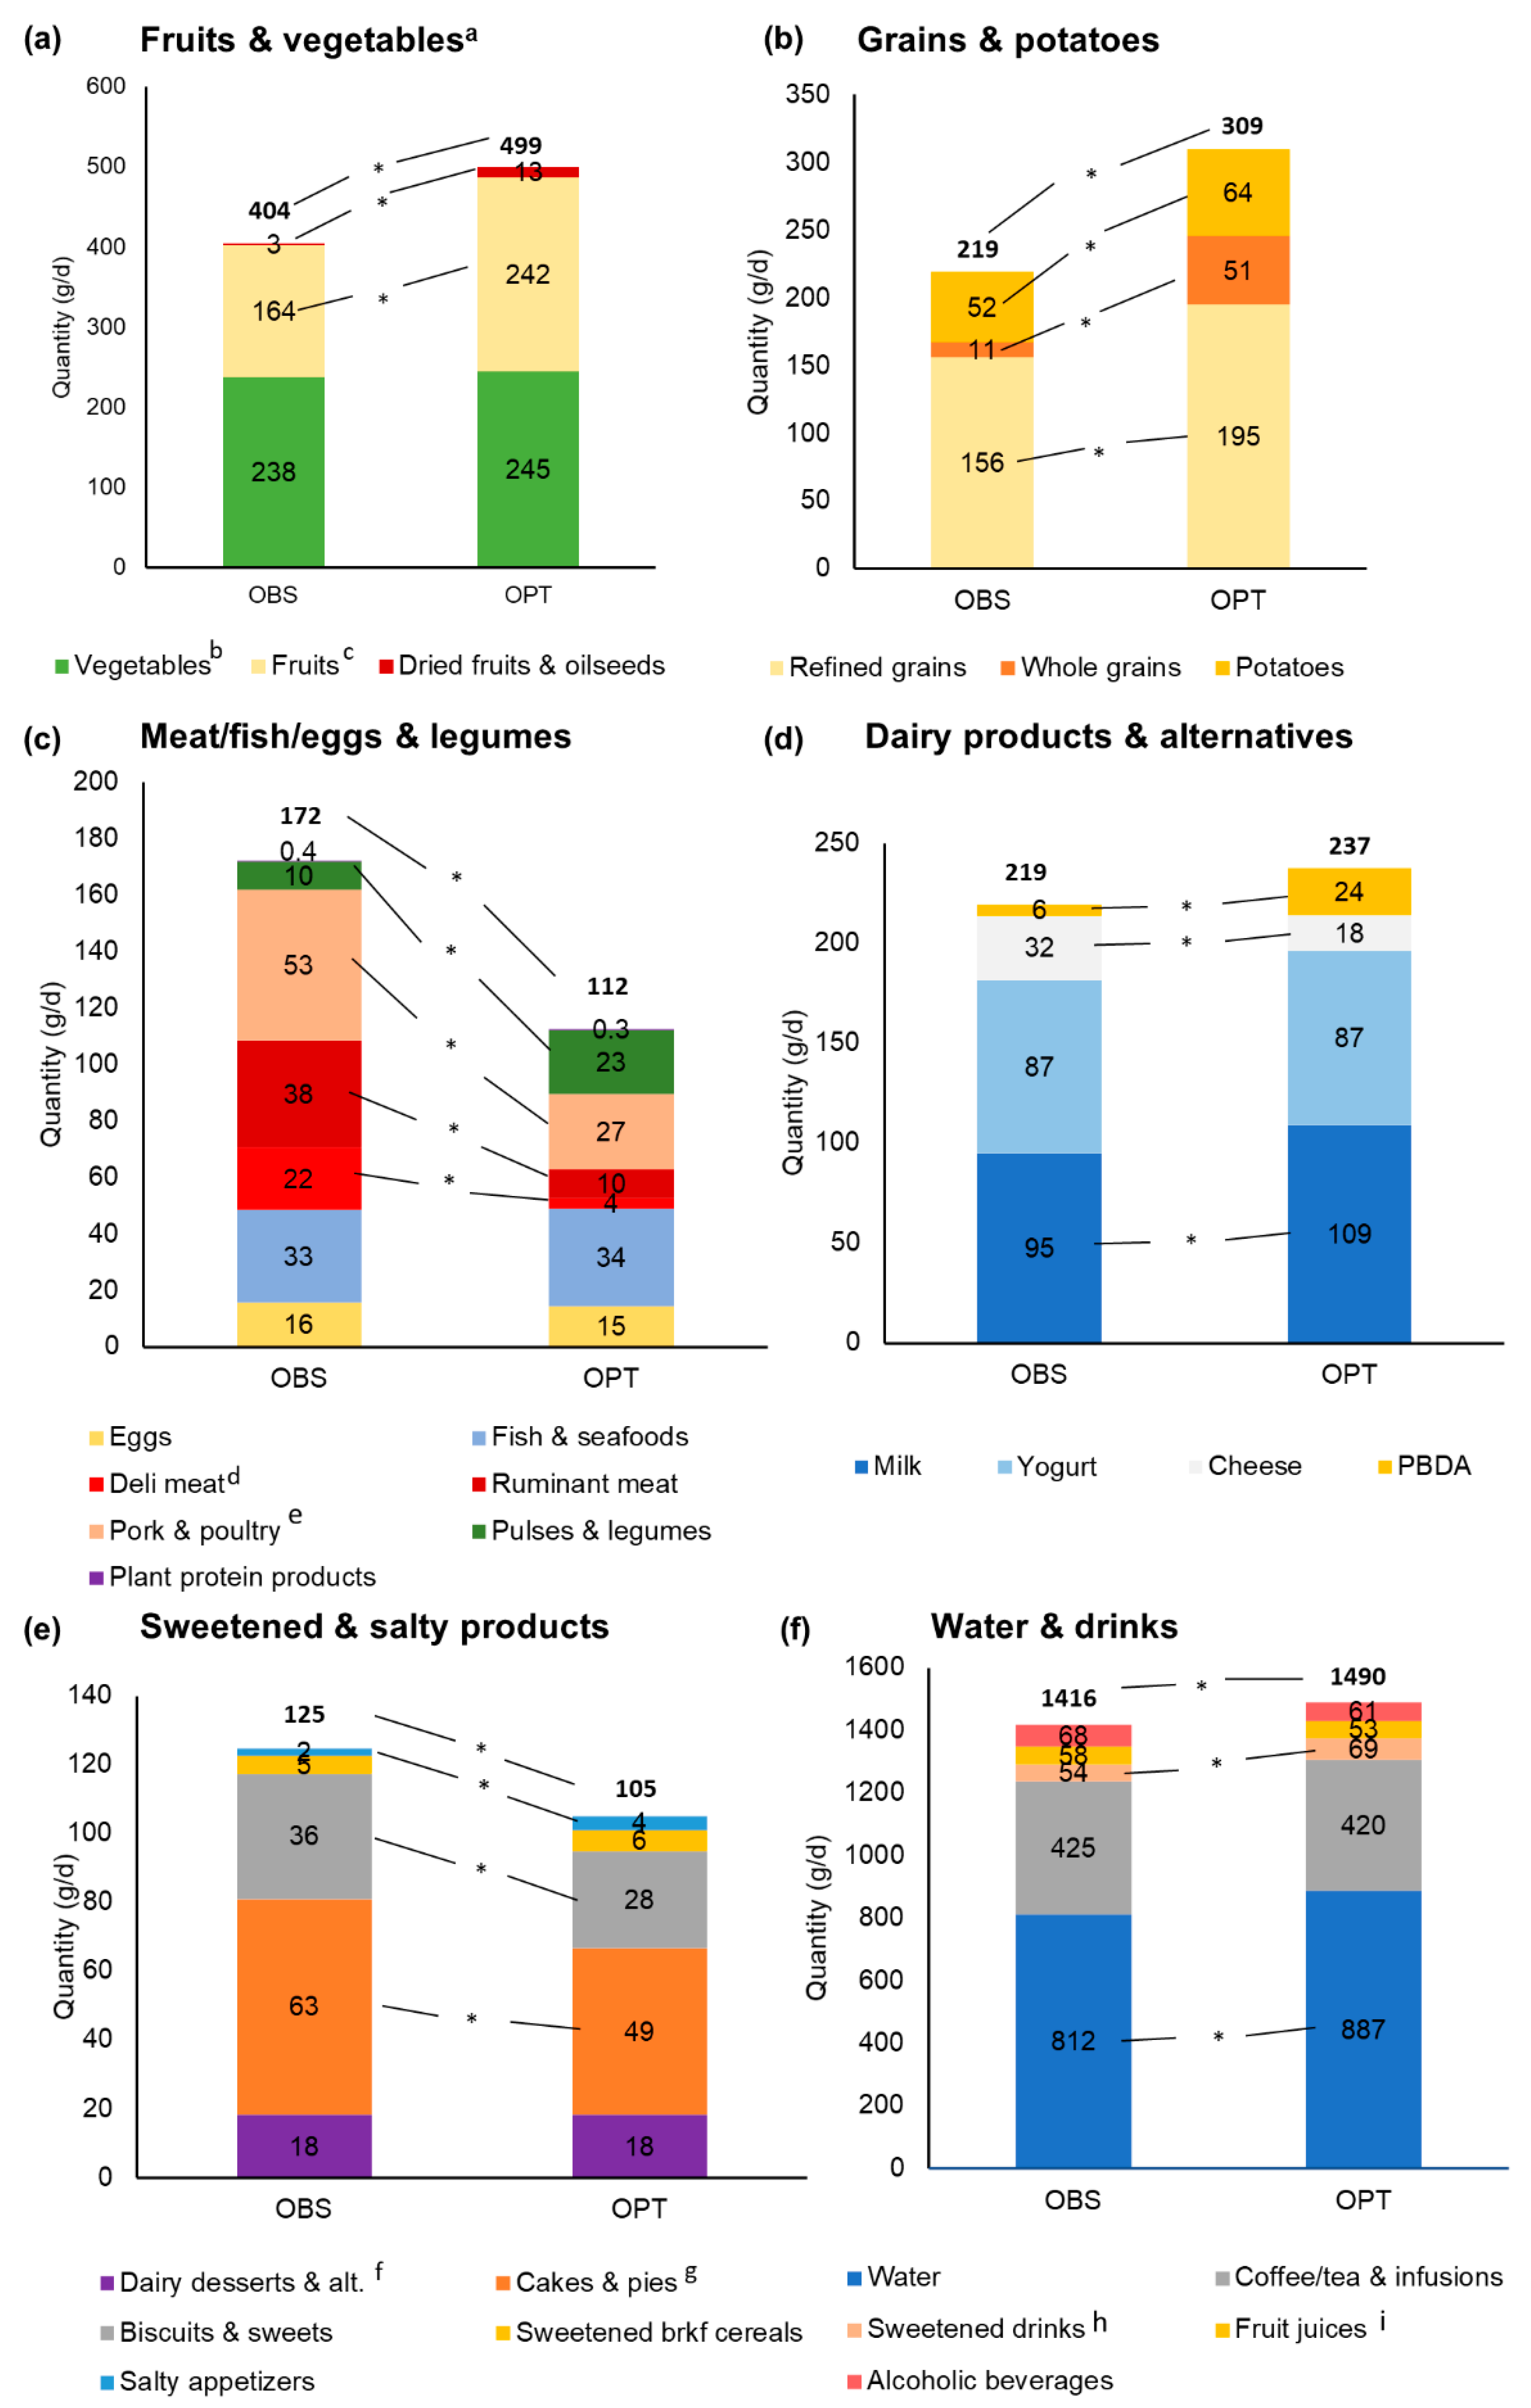
Figure 2 shows the mean quantities of food groups and subgroups in the observed and optimized diets.
The “fruits and vegetables” and “grains and potatoes” groups increased overall. The “meat/fish/eggs/legumes” group decreased due to the decrease in “ruminant meat”, “deli meat” and “pork and poultry” (“fish and seafood” and “eggs” remained constant). The “sweetened and salty products” group decreased. The “dairy products and alternatives” group remained constant, while within this group “cheese” decreased, “milk” and “PBDA” increased, and “yogurt” remained constant.
In men (
Supplemental Figure S1), dietary changes induced by the model were comparable with the results in women.
3.3. Contribution of Dairy and PBDL Products to Optimized Diets
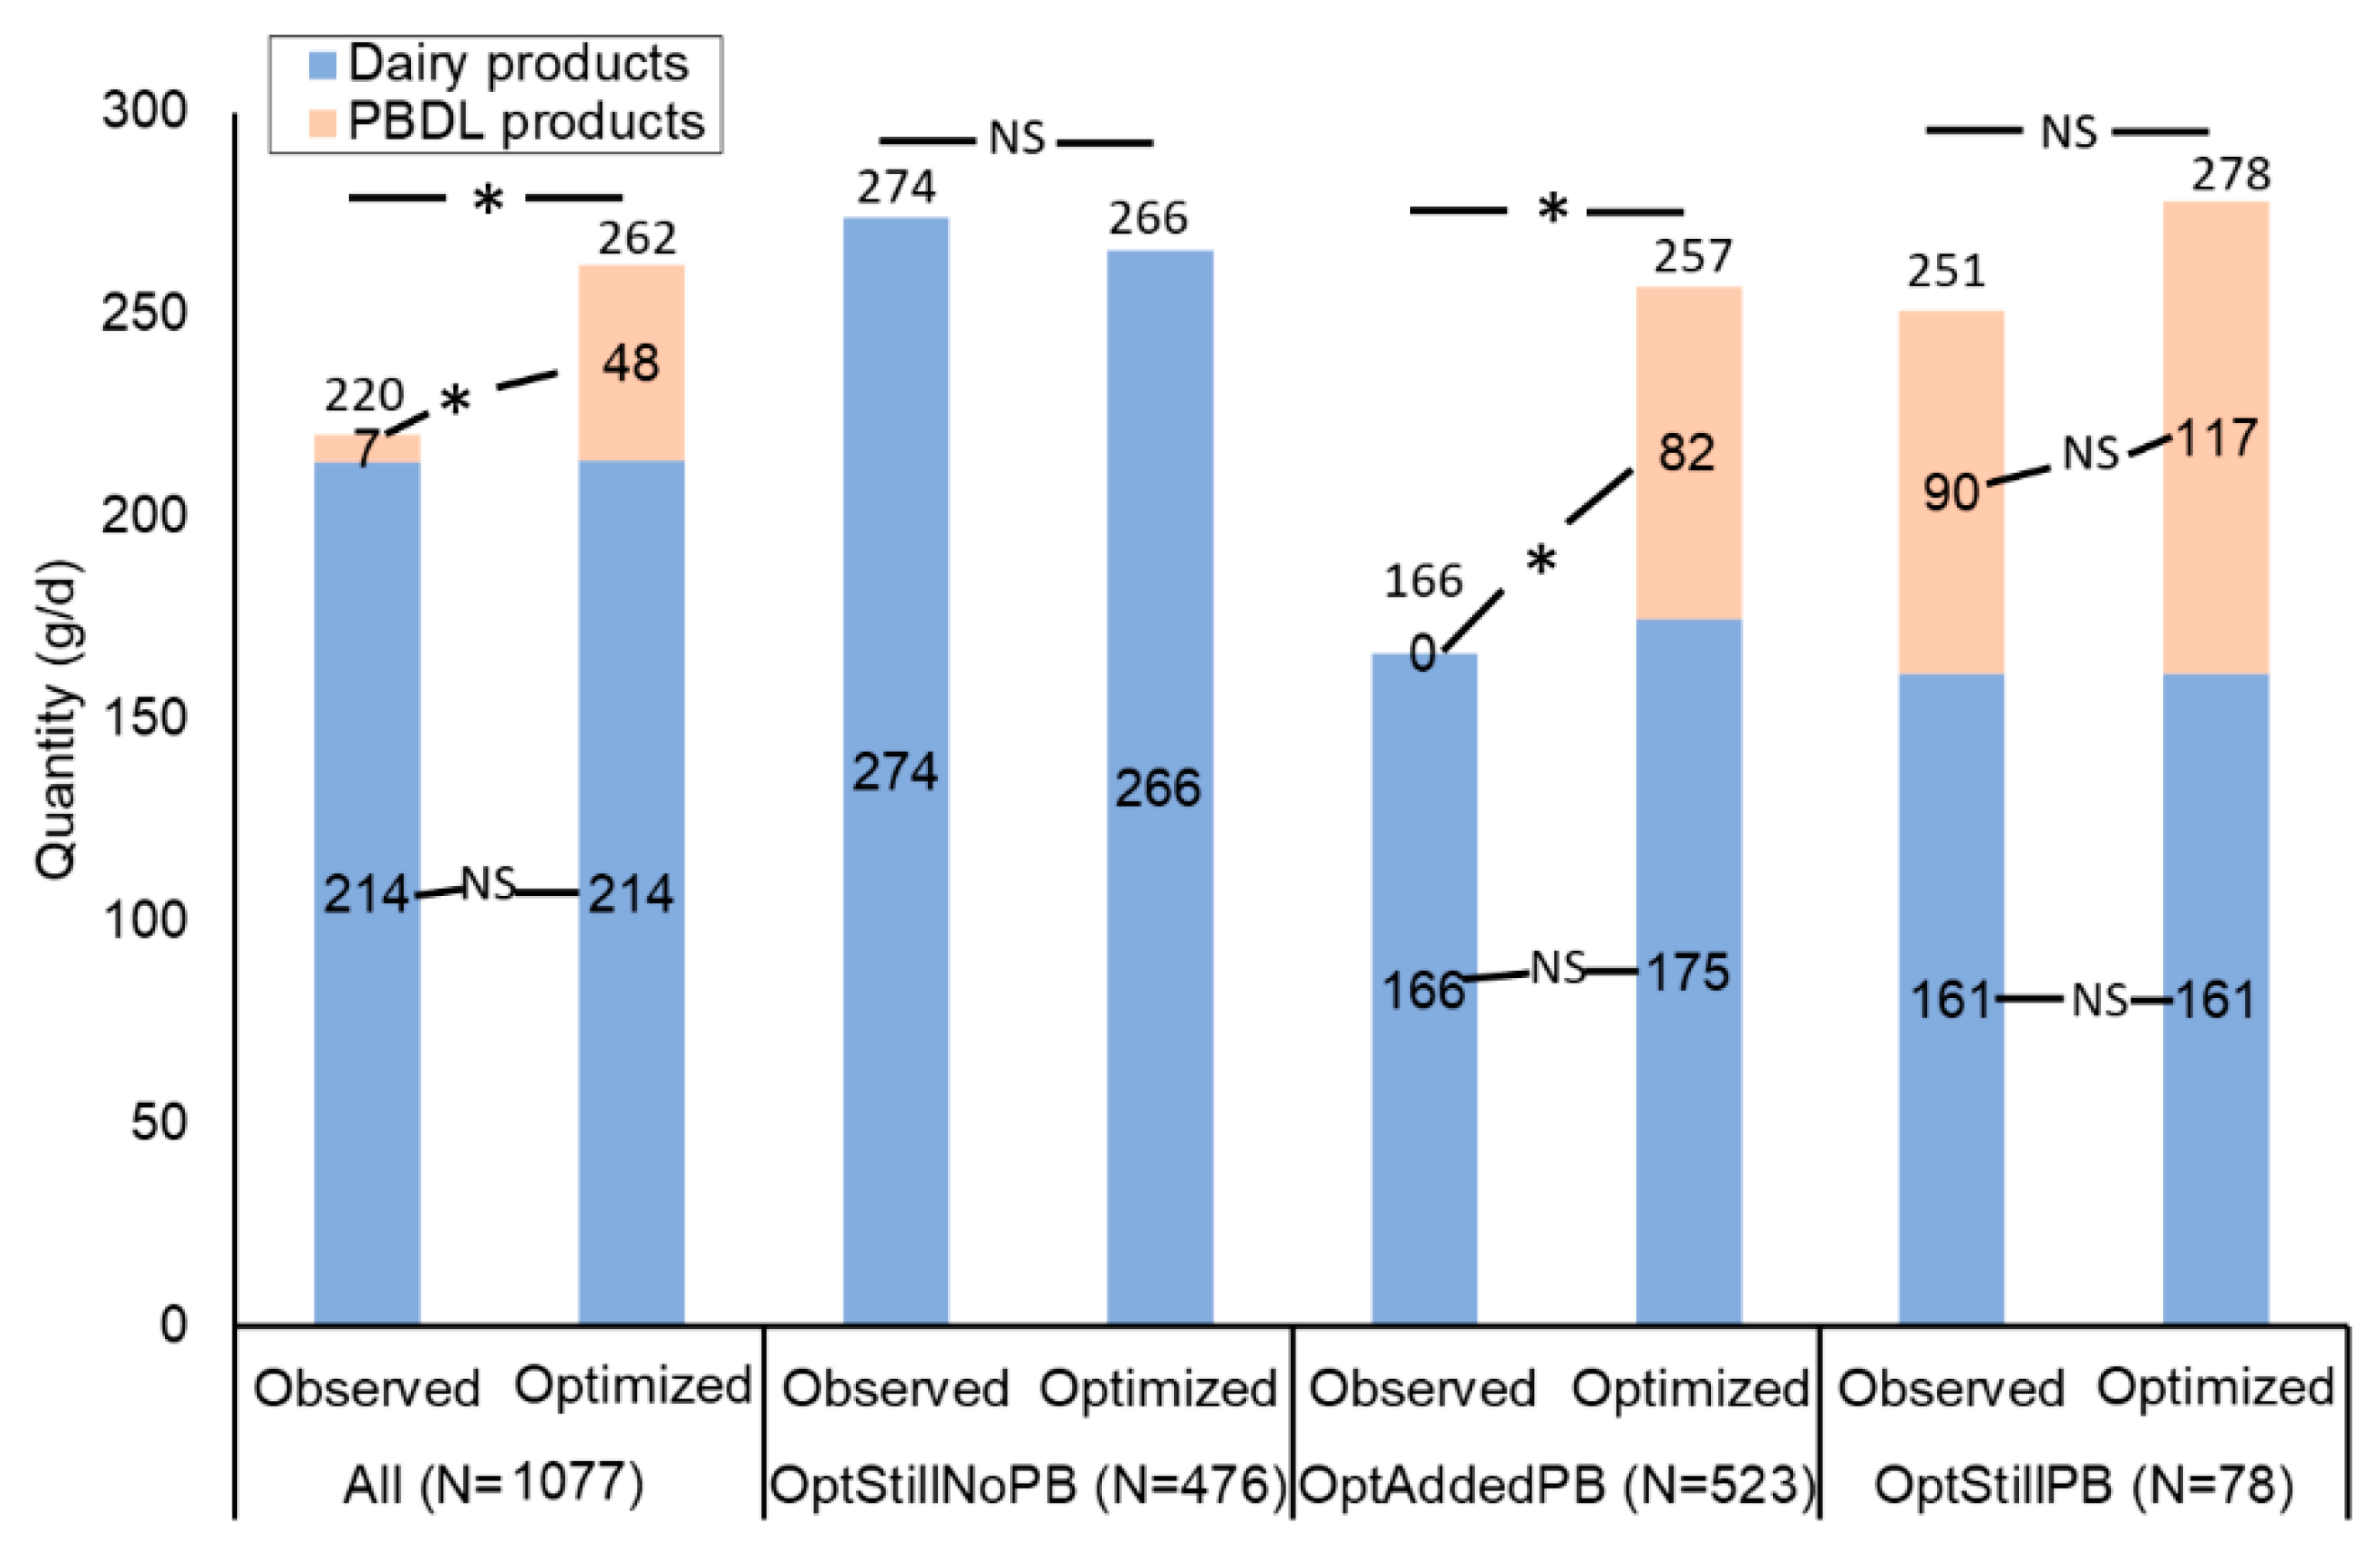
The four sub-populations defined for PBDL product tracking (OptStillPB, OptAddedPB, OptNoMorePB and OptStillNoPB) contained 78, 523, one, and 476 women, respectively. As the sub-population OptNoMorePB contained only one subject, it was left out of subsequent analyses.
Among optimized diets, 55.7% contained PBDL products either because they were introduced as a new food (OptAddedPB, 48.5%) or because they were maintained by the model (OptStillPB, 7.2%). Approximately 44.3% were optimized diets with no PBDL products (OptStillNoPB).
Table 3 compares the energy and food contents of the observed and optimized diets according to PBDL product tracking sub-populations (Opt
StillNoPB, Opt
StillPB or Opt
AddedPB), with a focus on dairy products (“milk”, “yogurt”, and “cheese”) and on the three PBDL product categories (PBDAs, PB desserts, and PB drinks).
Supplemental Table S5 displays the same information as
Table 3 for all food groups and subgroups.
Women for whom PBDL products were introduced as a new food in their optimized diet (OptAddedPB sub-population) were characterized by lower observed caloric intakes than the two other sub-populations (1756 kcal/d in OptAddedPB vs. 2001 kcal/d in OptStillPB and 2119 kcal/d in OptStillNoPB). In the “dairy products and alternatives” group, no significant subgroup variation was found for OptStillNoPB and OptStillPB subpopulations except for a decrease in cheese. However, for women for whom PBDL products were introduced as a new food (OptAddedPB), most “dairy products and alternatives” subgroups changed significantly; “milk” increased from 65.0 to 88.8 g/day, “cheese” decreased from 30.0 to 17.1 g/day, and “PBDA” increased from 0 to 34.9 g/day.
Figure 3 shows the total amount of dairy products (summing “milk”, “yogurt”, and “cheese”) and PBDL products in the observed and optimized diets in both the overall sample and according to PBDL product tracking sub-populations.
The total amount of dairy products plus PBDL products (i.e., summing milk, yogurt, cheese, PBDAs, PB desserts, and PB drinks) significantly increased, from 220 g/d in observed diets to 262 g/d in optimized ones. The increase was mainly due to the introduction of or the increase in PBDL products, as the amount of dairy products (i.e., sum of milk, yogurt, and cheese) did not differ between observed and optimized diets (214 g/d, p = 0.951). Women with no PBDL products in their observed and optimized diets (OptStillNoPB) already had a high quantity of dairy products in their observed diet (above 270 g/d). Women for whom PBDL products were introduced as a new food in their optimized diet (OptAddedPB) initially had the lowest consumption of dairy products in their observed diet (166 g/d). Moreover, in women with PBDL products in both their observed and optimized diets (OptStillPB), the total quantity of dairy products and PBDL products was maintained overall. In optimized diets, the total amount of dairy products plus PBDL products was similar in all three sub-populations of women (average amounts of 266 g/d in OptStillNoPB, 278 g/d in OptStillPB and 257 g/d in OptAddedPB, p-value = 0.205).
3.4. Sensitivity Analyses
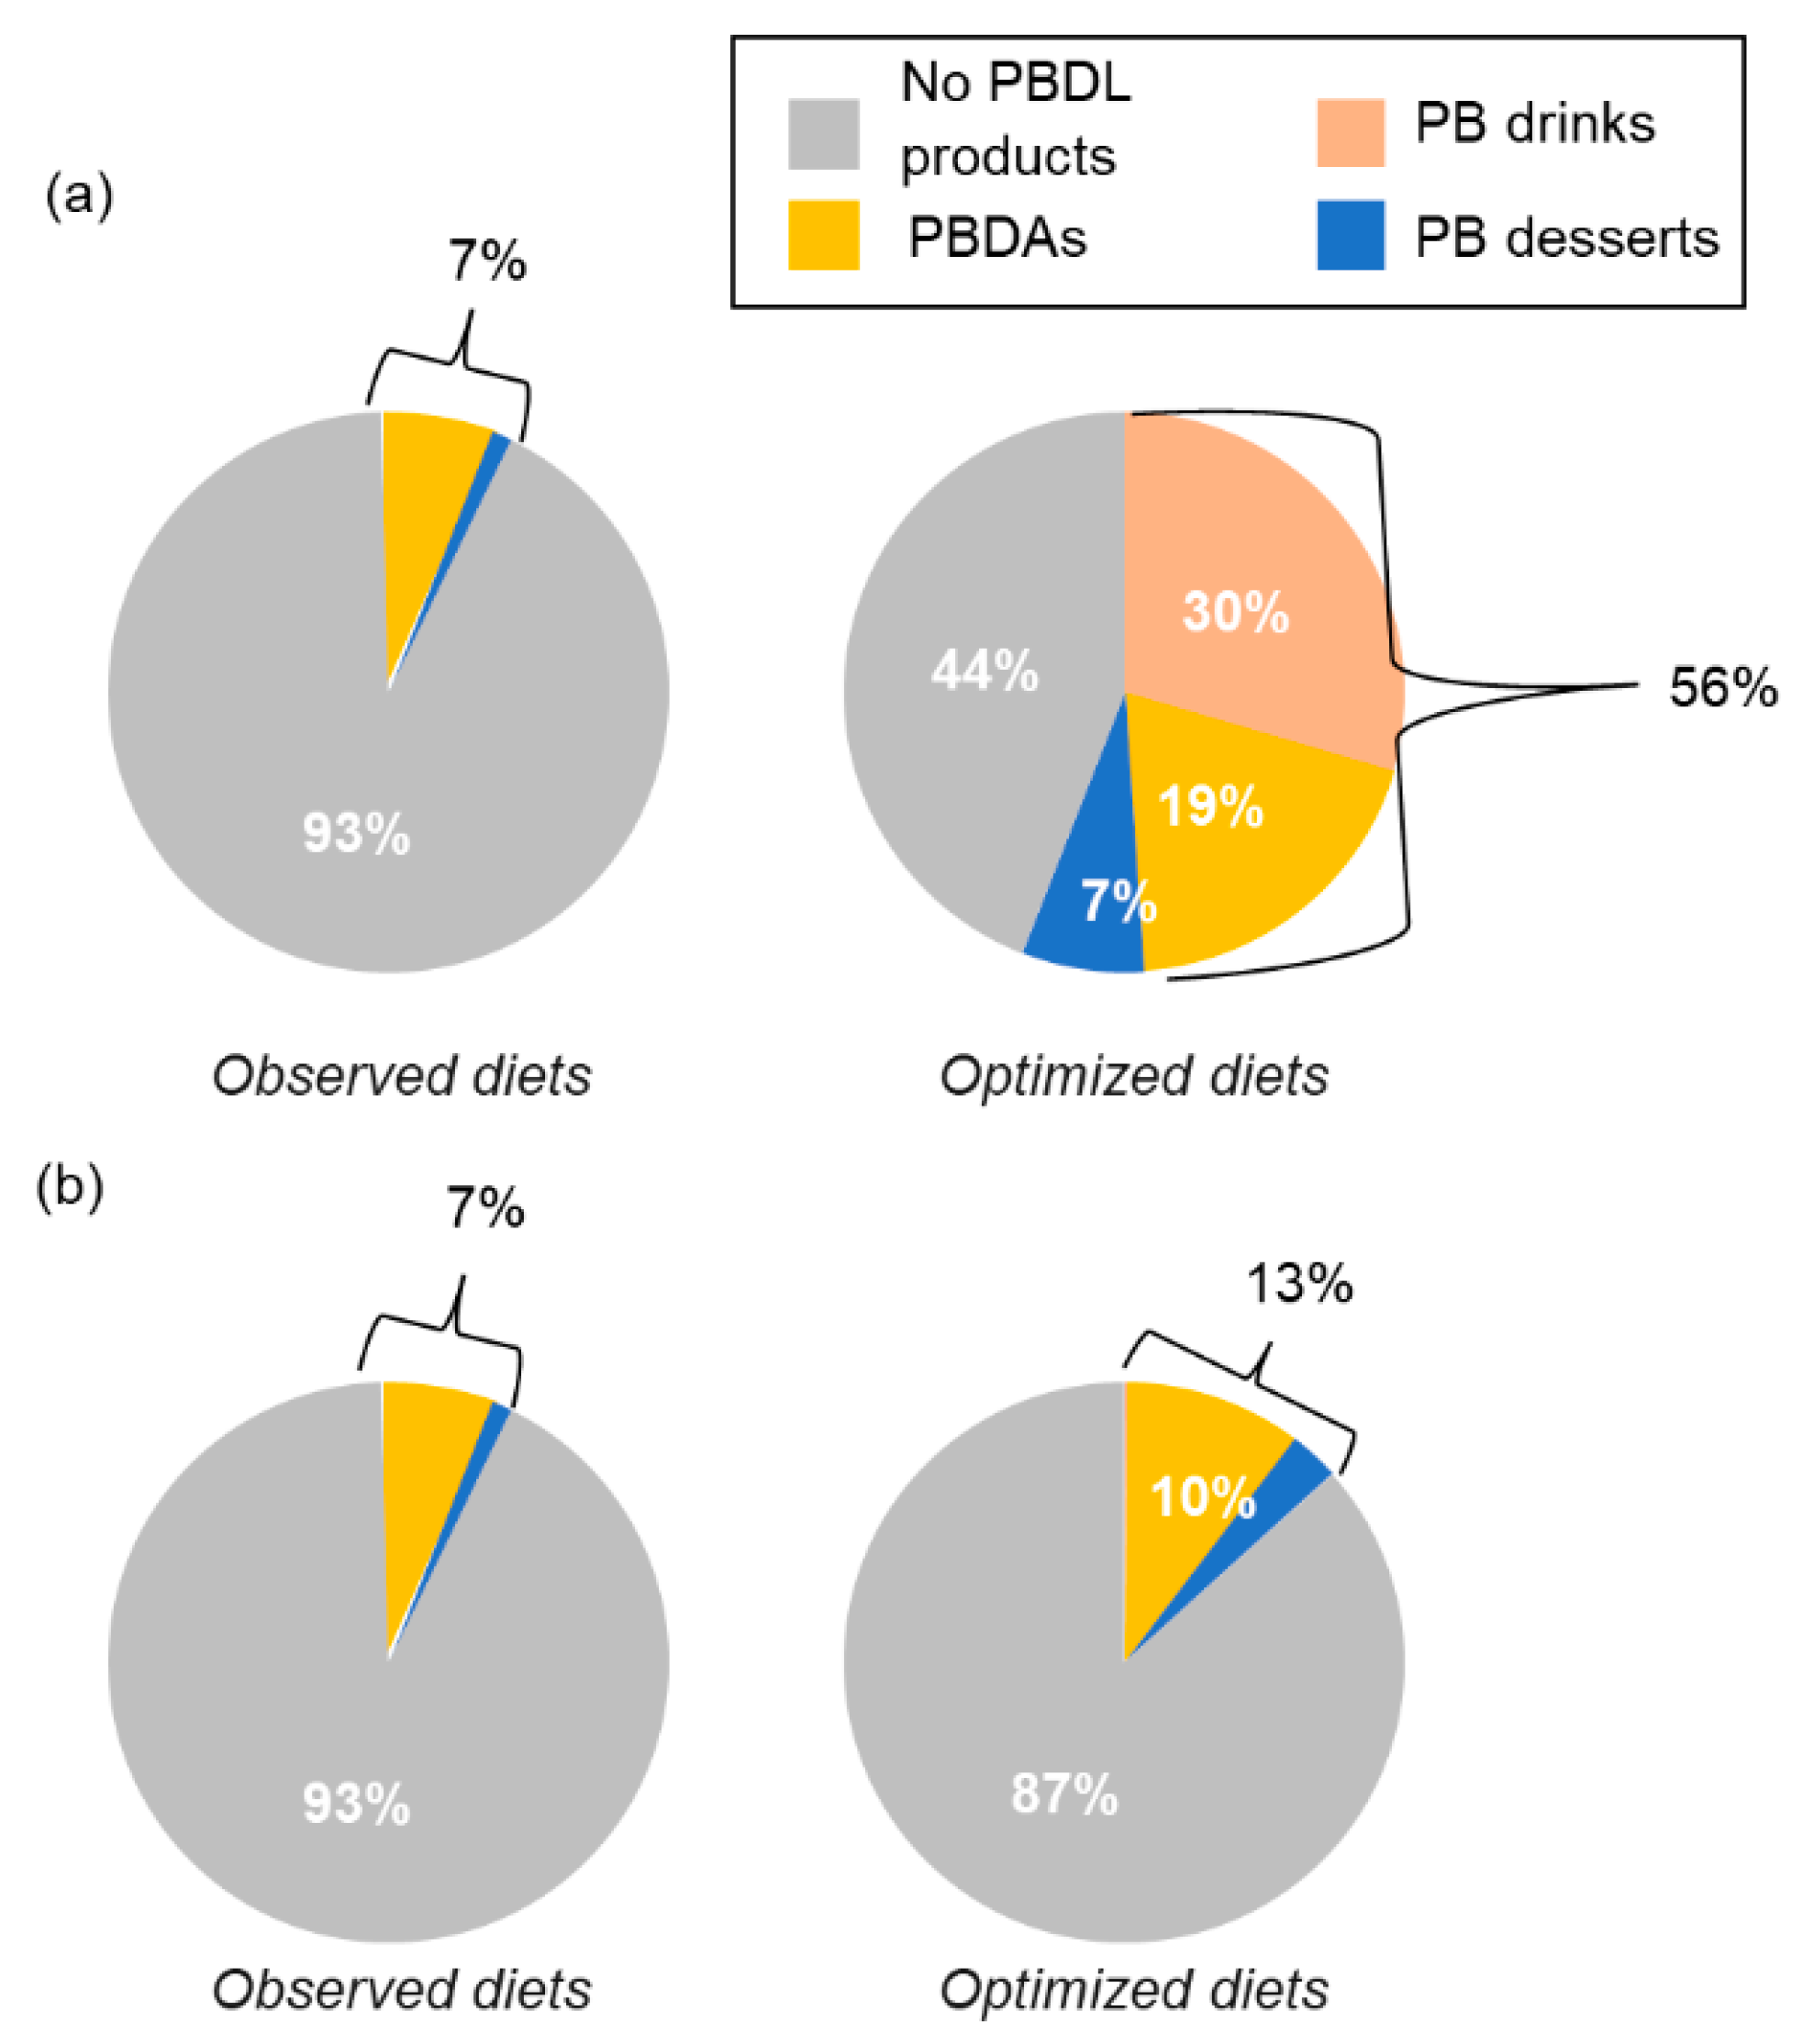
The first sensitivity analysis examined the impact of fortification on the introduction of PBDL products in optimized diets.
When fortification was removed from PBDL products (
Figure 4b), the percentage of optimized diets containing PBDL products was only 13% (vs. 56% when fortified; see
Figure 4a). Removing fortification of PBDL products had a limited impact on the other food group and subgroup changes (
Supplemental Table S6). The main change was that the increase of milk in optimized diets was higher when PBDL products were not fortified than when they were.
In men (
Supplemental Figure S3), the impact of fortification on the presence of PBDL products in optimized diets was comparable to that in women.
The second sensitivity analysis examined the impact on the feasibility rate of adding PBDL products only to the list of foods already consumed by an individual. The feasibility rate was 25.9% when only currently-consumed foods were introduced in optimized diets. When PBDL products were introduced in all optimized diets, the feasibility rate increased to 35.0%.
In men (
Supplemental Figure S3), feasibility rates resulting from the original and sensitivity analysis models were comparable with the results obtained for women.
4. Discussion
Fully in line with the guiding principles provided by the FAO [
5] and with other studies on sustainable diets [
33,
34,
35], more sustainable optimized diets in this study were composed of a higher amount of plant-based foods (fruits, vegetables, whole grains, nuts, and seeds) and a reduced amount of meats (especially red meat) than current observed diets. This study can thus provide an additional argument supporting the shift towards more plant-based diets in Western countries. The specificity of this study was its focus on PBDL products as plant-based foods with recent tremendous growth in the Western food market. The ability of these products to be part of a sustainable diet is poorly documented. In our study, observed diets containing PBDL products showed better nutritional quality, although their carbon impact was not lower than that of observed diets not containing PBDL products. Diet optimization results showed that in more sustainable diets total dairy products are maintained with a shift amongst the dairy products, and PBDL products (when fortified) are added for a large proportion of women. This suggests that both dairy and fortified PBDL products may facilitate the achievement of more sustainable diets. Indeed, the stable contribution of dairy in more sustainable diets is consistent with previous studies conducted with different European populations and/or methodologies [
30,
36,
37]. In addition, the quantity of dairy in optimized diets (214 g/d) is in line with the recommended intake of dairy foods (two servings/day, with recommended serving of 150 mL for milk, 125 g for yogurt, and 30 g for cheese) in the opinion of the French High Council for Public Health (Haut Conseil de la Santé Publique-HCSP) revision of the 2017–2021 French Nutrition and Health Programme dietary guidelines [
38].
Regarding PBDL products, we identified two studies based on food consumption surveys reporting their contribution to diets with good sustainability characteristics [
39,
40]. First, using five national dietary surveys (France, the United Kingdom, Sweden, Italy and Finland), Vieux et al. [
39] used multiple factor analysis and agglomerative hierarchical clustering that identified six clusters of individuals based on their nutrient intakes and the carbon impact of their diets. One of the clusters was considered to be more sustainable because it was composed of individuals with good nutritional quality (based on MAR, MER and energy density) and decreased carbon impact (minus 15%) when compared with the whole sample. This cluster contained diets with the highest amount of PBDL products (9.35 g/day). In the same study [
39], the authors directly selected individuals with high MAR, low MER, and low energy density compared with their respective median value [
20]; the results showed that PBDL products were higher in the diets of those individuals than in the rest of the sample.
Secondly, Ridoutt et al. [
40] selected individuals from the Australian Health Survey with diets having both higher nutritional quality and lower carbon impact (−43%) than others. In adult women, those diets contained 1.47 servings/day of dairy and alternatives. In the present study, when expressing the quantity of dairy products and alternatives in the more sustainable optimized diets in a unit comparable to Ridoutt et al. we obtain a total of 1.52 servings (0.44 servings of milk, 0.45 of cheese, 0.43 of yogurt, 0.12 of PBDAs, and 0.08 of plant-based drinks), which is very close to the 1.47 servings in the “high quality, low carbon impact” group of individuals from the Ridoutt study. Nevertheless, neither the study conducted by Vieux et al. nor the one conducted by Ridoutt et al. is fully comparable to this one. Those studies identified self-selected diets based on their existing nutritional and environmental characteristics, while in this study the diets studied were theoretical nutritionally adequate diets with a 30% carbon impact reduction designed with multicriteria optimization. On the one hand, optimized diets are theoretical, as their cultural acceptability cannot be guaranteed. On the other hand, full nutritional adequacy cannot be ensured when identifying diets that are more sustainable than others among existing ones. Nevertheless, reaching similar conclusions (in terms of dairy and PBDL product quantities) with different data and different methods is reassuring concerning the relevance of our findings. It has been recently shown in the framework of a simulation study that evaluated the impact of like-for-like substitution of dairy with PBDAs on the nutrient composition of UK diets that PBDAs do not provide the same nutritional benefits as dairy [
41]. Using an alternative methodology and taking carbon impact into account, our results confirm the message that PBDAs cannot be considered as a nutritional replacement for dairy.
As shown by Mäkinen et al. [
11], the ability of PBDL products to contribute to healthy diets partly depends on their fortification levels. Similarly, we have shown that the contribution level of PBDL products in optimized diets is dependent on their fortification. The fortification strategy thus seems to be of importance in increasing the ability of PBDL products to be part of sustainable diets.
Another result of our study is that new foods not currently consumed by an individual need to be added to the diet in order to design a diet that both complies with nutritional recommendations and has a reduced carbon impact. This result has already been documented in previous studies with and without environmental constraints [
42,
43]. Another result is that while only allowing PBDL products to be added increased the feasibility rate for a part of the sample, for most individuals it was not sufficient to derive a nutritionally adequate diet with reduced carbon impact.
While many studies have used linear programming to design optimized diets that comply with nutrient recommendations and/or environmental targets at the population level, only a few have applied the algorithm at the individual level. The strengths of this approach have been documented by Gazan et al. [
14], and are further emphasized in this paper. Individual diet modelling provides more relevant and more robust results because it enables taking individual preferences into account, can estimate the percentage of people for whom designing an optimized diet is feasible, and allows statistical analyses to be performed in order to test the variations between individual observed and optimized diets. To the best of our knowledge, only one other study has used multi-criteria individual linear programming to design nutritionally adequate diets while reducing carbon impact [
43]. That study was based on NDNS (National Diet and Nutrition Survey in the United Kingdom) data consisting of a four-day dietary diary. Nevertheless, the authors applied different optimization models from those used in this paper, thus making it difficult to compare with this study.
One limitation of this study is that certain characteristics of the sustainable diet concept were not considered. In particular, the economic dimension was not considered because of the lack of data on food prices. Including food prices in our models would have enabled controlling the cost of optimized diets, an important characteristic of sustainable diets [
30]. Moreover, within the environmental dimension we used only the carbon impact metric, which is not sufficient to represent the entire dimension. Other metrics, such as water footprint and impact on biodiversity, should complement it. In September 2020, a consolidated French database named Agribalyse was released [
44]; it is the first free access database of environmental impact indicators for food items produced and consumed in France. It would be valuable to repeat these analyses with the metrics provided in this new database (land use, acidification, water use, fine particles, etc.) in addition to carbon impact. Food can have varying impacts depending on the environmental sustainability metrics selected (carbon impact, water footprint, nitrogen fixation, land use, eutrophication, etc.), depending on location and agricultural practices [
45]. Therefore, other studies including other environmental metrics need to be performed in order to explore how PBDL products can play a role in improving sustainability of diets, as such metrics were not available at the time of the present study. Even if the acceptability of dietary changes was considered by minimizing the distance to individuals’ observed food quantities and introducing constraints to force optimized diets to remain within the ranges of food quantity already observed, the acceptability of the proposed dietary changes by the models was not ensured, as INCA2 participants were not offered their own optimized diet in an intervention study. On average, in women’s optimized diets the summed weight of the food items for which consumption is increased went up by 467 g/day, and the summed weight of the food items for which consumption is decreased went down by 290 g/day (
Supplemental Table S7). In other words, an average total variation of 757 g (467 + 290) was the smallest effort needed in order to meet nutritional adequacy while reducing the diet’s carbon impact by 30%. An intervention study would be needed to test how acceptable such dietary changes would be in real life. Shifting the individual optimization approach from a methodology to conduct public health research to a tool able to provides tailored dietary advice has been previously demonstrated in a PhD thesis, leading to an innovative prototype [
46]. This tool must be further developed by testing it in intervention studies in order to assess the acceptability of dietary advice based on it.
It should be noted that the food consumption data used in this study are fourteen years old, creating doubt regarding potential shifts in dietary patterns over more recent years which might affect real-world interpretation of these results. However, a French report evaluating food habit changes between 2006 and 2015 [
47] indicates that there were no major changes during this period. A more recent national dietary survey was conducted in 2014–2015 (INCA3) [
48]; however, data were only made available in 2020, after the start of this study. INCA2 and INCA3 studies were not conducted with the same methodology, and are thus not fully comparable, although we were able to verify that the prevalence of PBDL product consumers remained low (4.2% in women and 2.3% in men) and that the amounts consumed remained similar (102 g in women and 139 g in men).
We chose to present only the results obtained for women here, because of very low consumption of PBDL products in men. Moreover, it is more difficult to optimize nutritionally adequate diets in women because their energy intake is lower than in men, while their recommended nutritional intake levels are either similar or higher (e.g., in adults over age 55, the RDA for calcium is 1200 mg/day for women and 900 mg/day for men). To design more sustainable optimized diets, the algorithm thus required selection of foods with the best compromise between energy density, nutrient density, and carbon impact. Most of the results indicate the same trends in both genders. In particular, the analysis showed that both men and women for whom PBDL products were introduced in optimized diets (OptAddedPB) had lower observed energy intakes on average, showing that PBDL products can facilitate diet sustainability in these sub-populations.
Data from Kantar Worldpanel [
6] indicate that in 2018 the amount of PBDL products purchased in France was far smaller than that of dairy products (96% vs. 4%). However, penetration rates of plant-based alternatives to milk, yogurt, and desserts increased by 56%, 71%, and 76%, respectively, between 2015 and 2018, while remaining stable for dairy products (−0.5%). These signs indicate that PBDL products could become an important part of diets in the coming years.


 ,
, 


