
Design of a Lifecycle-Oriented Environmental and Economic Indicators Framework for the Mechanical Manufacturing Industry

 ,
,  ,
,  , , ,
, , ,
Abstract
:1. Introduction
2. Materials and Methods
2.1. State of the Art Analysis
2.1.1. Inventory Indicators
2.1.2. Impact Indicators
2.1.3. Economic Indicators
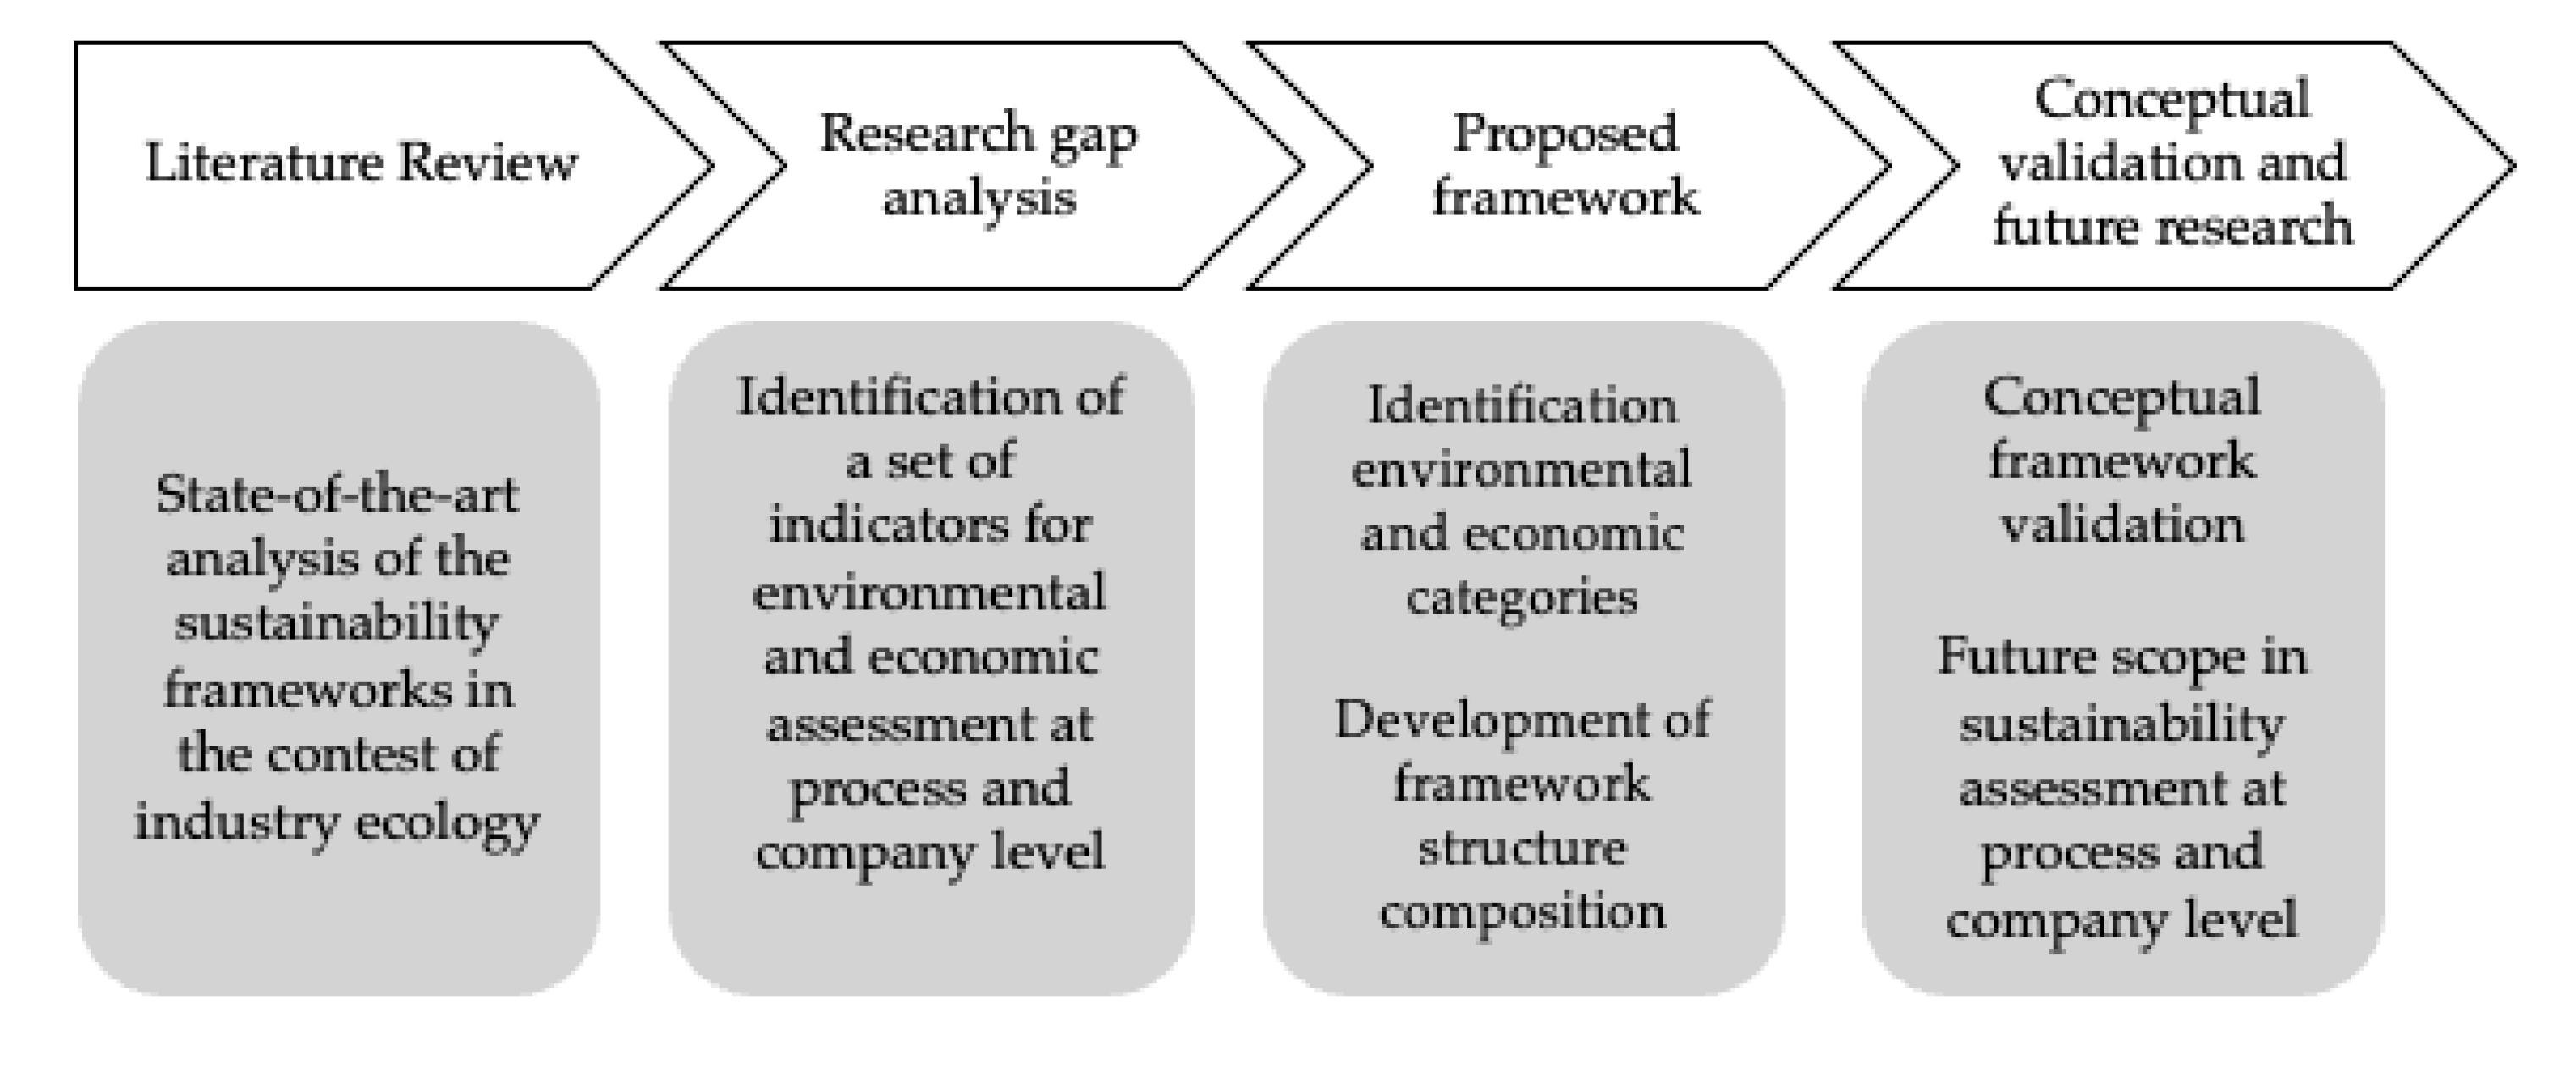
2.2. Methodology for Framework Development
3. Design of the Framework of Indicators
3.1. Definition of the Reference Indicators List
3.2. Indicator’s List Filtering Based on Requirements
Indicator’s List Filtering Based Industrial Workshops
3.3. Structuring KPIs and PIs in a Framework
3.3.1. Inventory Indicators
Direct Waste
Direct Emissions
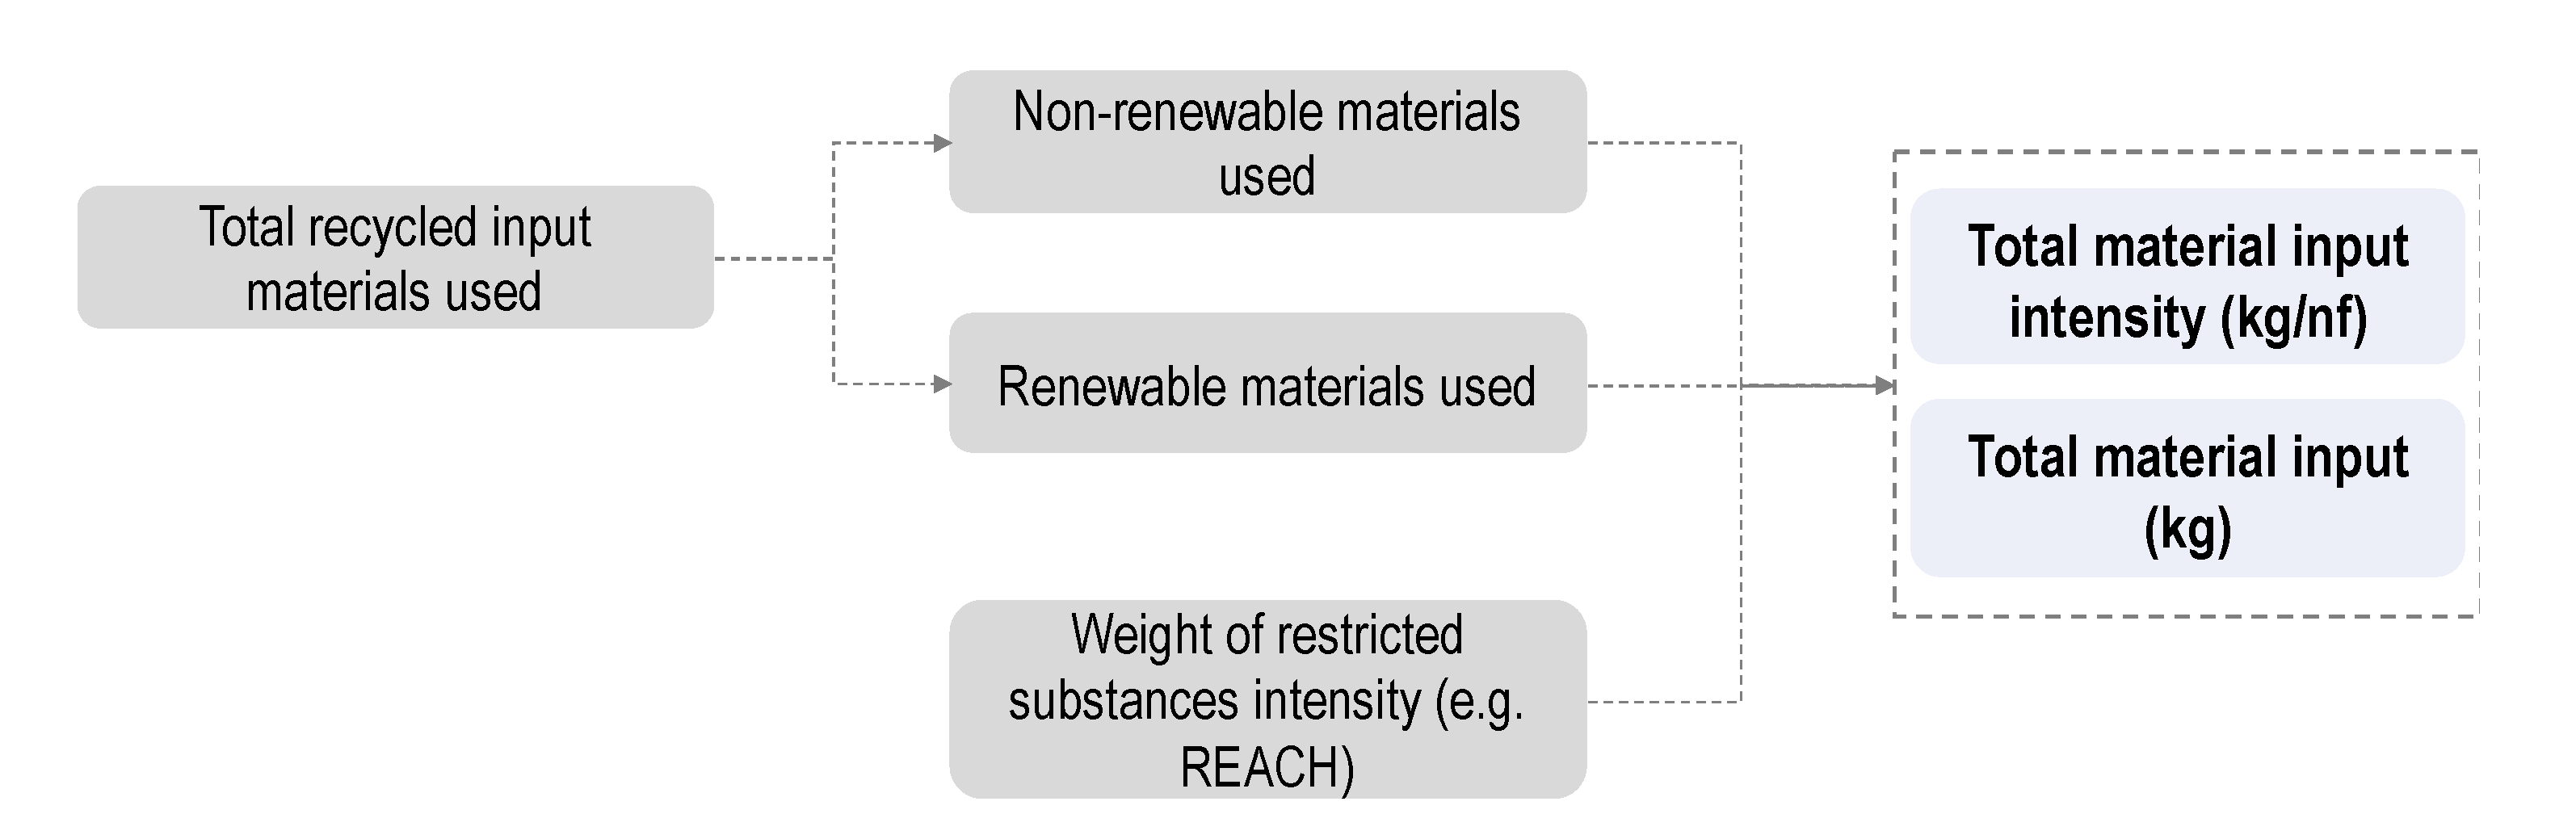
Direct Inputs Materials
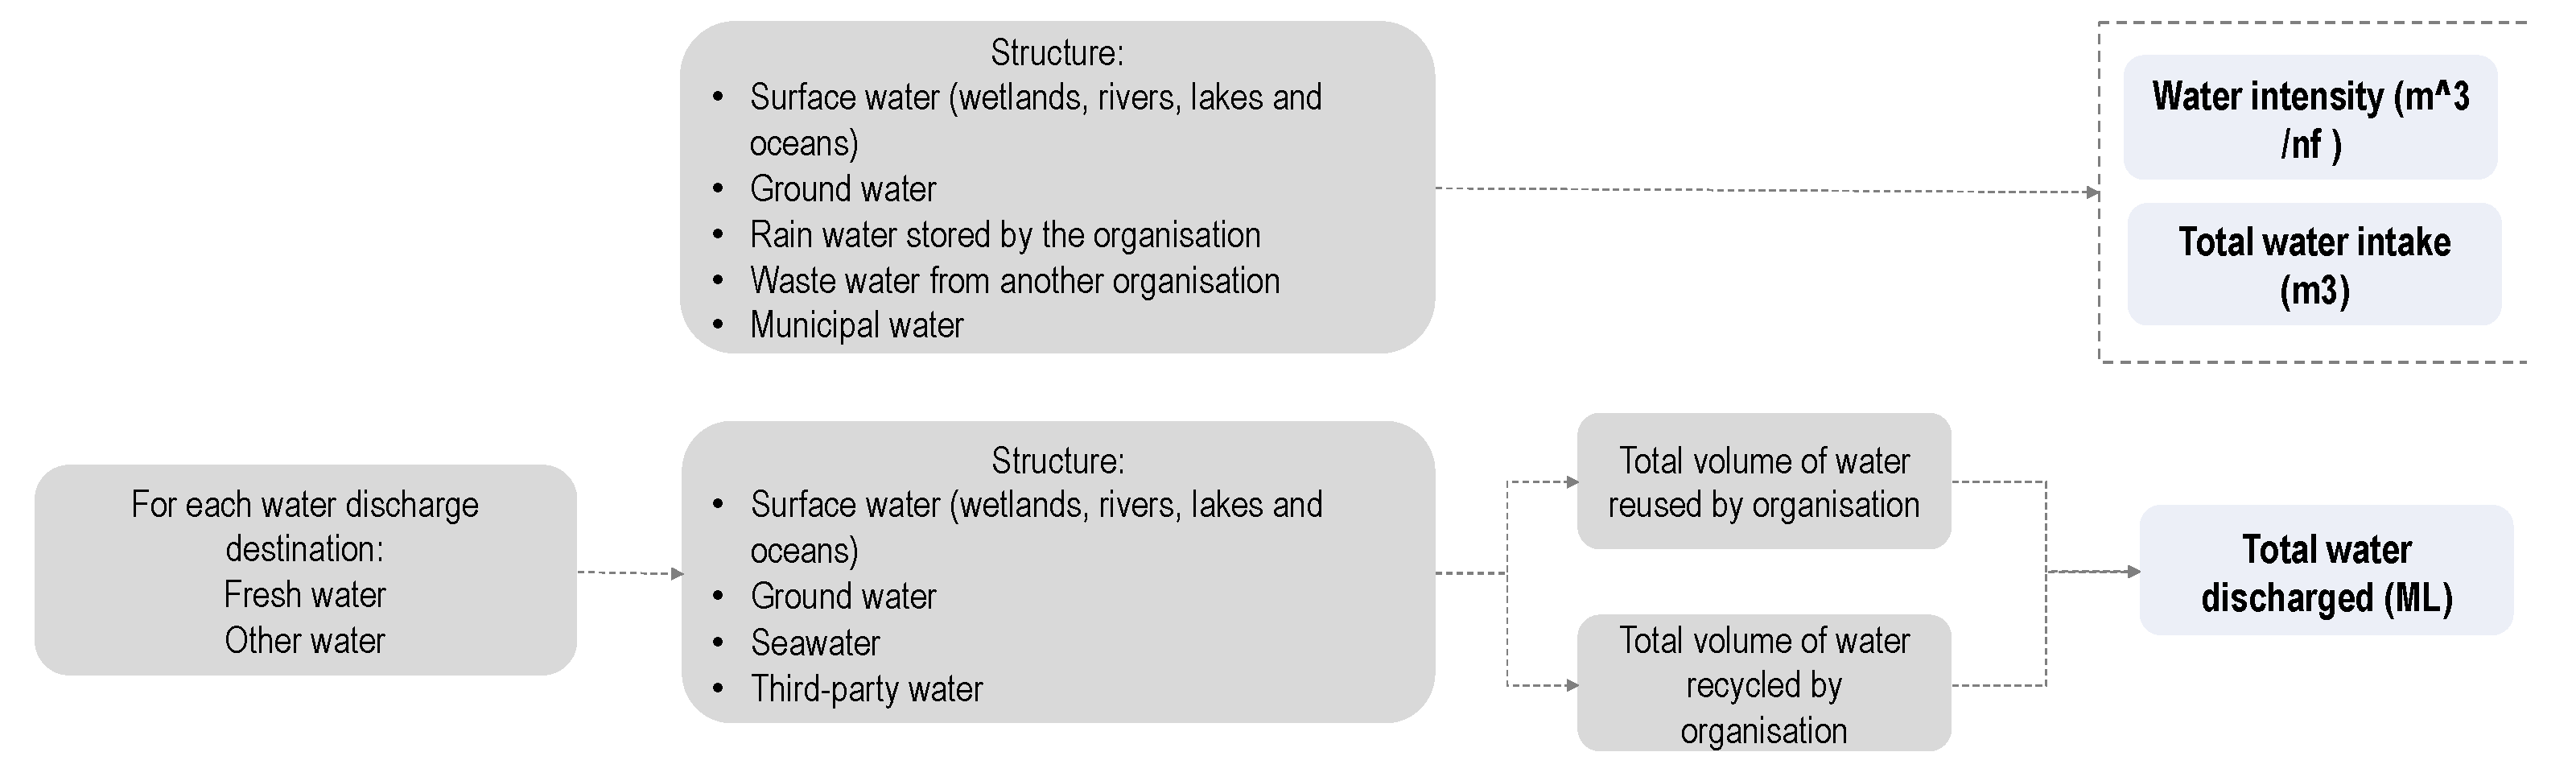
Direct Water
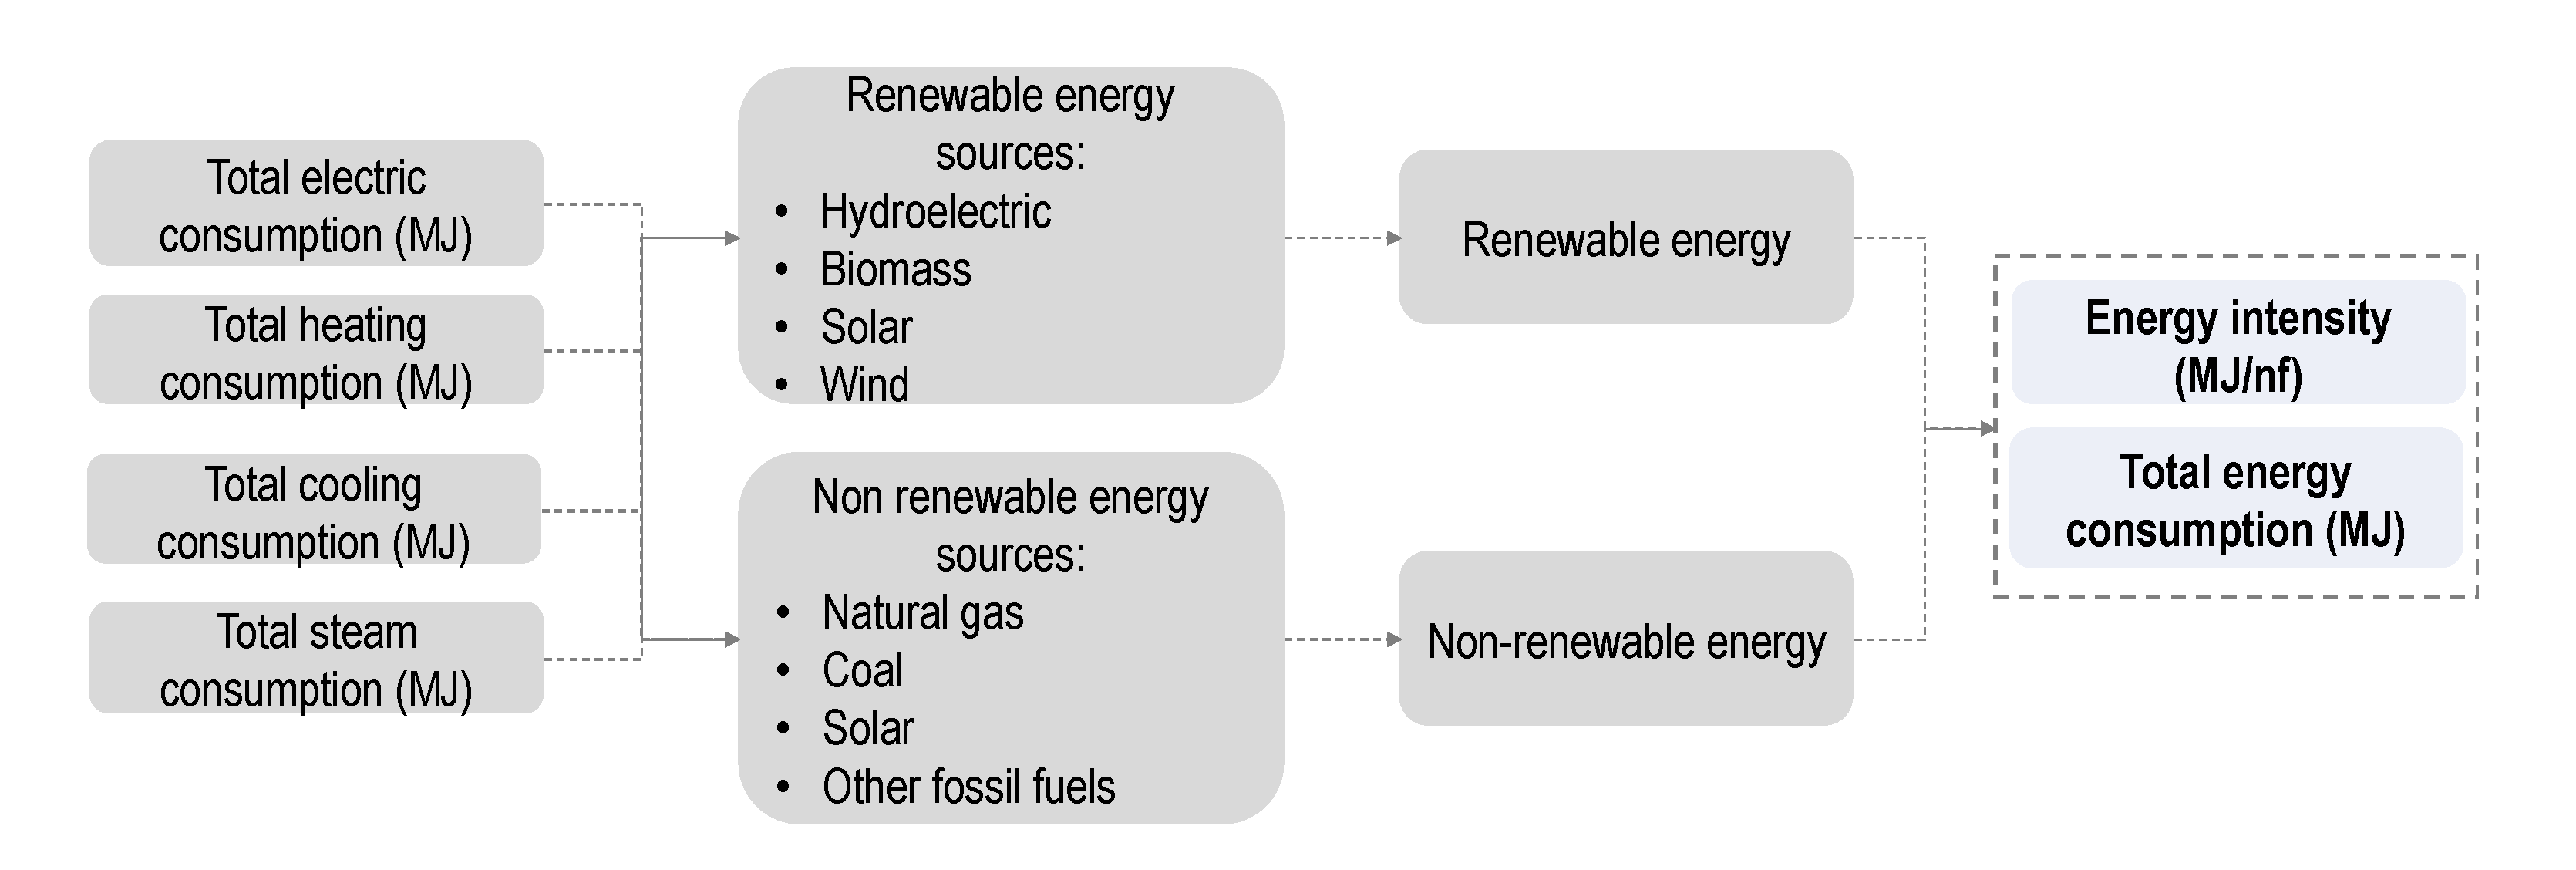
Direct Energy
3.3.2. Impact Indicators
3.3.3. Economic Indicators
3.4. The Framework
4. Discussion and Conclusions
Author Contributions
Funding
Institutional Review Board Statement
Informed Consent Statement
Data Availability Statement
Acknowledgments
Conflicts of Interest
References
- Meet the 2020 Consumers Driving Change. Available online: https://www.ibm.com/thought-leadership/institute-business-value/report/consumer-2020 (accessed on 23 December 2021).
- Bansard, J.; Schröder, M. International Institute for Sustainable Development Photo: NASA (CC0 1.0) STILL ONLY ONE EARTH: Lessons from 50 Years of UN Sustainable Development Policy the Sustainable Use of Natural Resources: The Governance Challenge Key Messages and Recommendations. 2021. Available online: https://www.iisd.org/articles/sustainable-use-natural-resources-governance-challenge (accessed on 23 December 2021).
- Sustainable Manufacturing|US EPA. Available online: https://www.epa.gov/sustainability/sustainable-manufacturing (accessed on 27 December 2021).
- Sustainable Manufacturing and Eco-Innovation: Towards A Green Economy; OECD Publications, 2009; Available online: https://www.oecd.org/env/consumption-innovation/42957785.pdf (accessed on 23 December 2021).
- Enablers and Barriers of Sustainable Manufacturing: Results from a Survey of Researchers and Industry Professionals|Elsevier Enhanced Reader. Available online: https://reader.elsevier.com/reader/sd/pii/S2212827115000451?token=FF95A14AB4696F363AC62CAC5826E88796F548D65E9D698D5F1EDD39FCE7C44D85E4E146E3201F38633A5CC41DFD9498&originRegion=eu-west-1&originCreation=20220130142630 (accessed on 23 December 2021).
- Hariyani, D.; Mishra, S. Organizational enablers for sustainable manufacturing and industrial ecology. Clean. Eng. Technol. 2022, 6, 100375. [Google Scholar] [CrossRef]
- Yadav, G.; Kumar, A.; Luthra, S.; Garza-Reyes, J.A.; Kumar, V.; Batista, L. A framework to achieve sustainability in manufacturing organisations of developing economies using industry 4.0 technologies’ enablers. Comput. Ind. 2020, 122, 103280. [Google Scholar] [CrossRef]
- Why Is Sustainable Manufacturing So Important? Available online: https://www.rpo-manufacturing.com/blog/sustainable-manufacturing (accessed on 27 December 2021).
- OECD Sustainable Manufacturing Indicators—OECD. Available online: https://www.oecd.org/innovation/green/toolkit/oecdsustainablemanufacturingindicators.htm (accessed on 23 December 2021).
- Sustainable Manufacturing Indicator Repository (SMIR)|NIST. Available online: https://www.nist.gov/services-resources/software/sustainable-manufacturing-indicator-repository-smir#:~:text=The%20Sustainable%20Manufacturing%20Indicator%20Repository,13%20publicly%20available%20indicator%20databases (accessed on 23 December 2021).
- Sarkar, P.; Joung, C.B.; Carrell, J.; Feng, S.C. Sustainable manufacturing indicator repository. Proc. ASME Des. Eng. Tech. Conf. 2011, 2, 943–950. [Google Scholar] [CrossRef]
- Single Market for Green Products—Environment—European Commission. Available online: https://ec.europa.eu/environment/eussd/smgp/dev_methods.htm (accessed on 27 December 2021).
- 2030 Climate Target Plan. Available online: https://ec.europa.eu/clima/eu-action/european-green-deal/2030-climate-target-plan_en (accessed on 27 December 2021).
- CO₂ and Greenhouse Gas Emissions—Our World in Data. Available online: https://ourworldindata.org/co2-and-other-greenhouse-gas-emissions (accessed on 27 December 2021).
- Peruzzini, M.; Pellicciari, M. Models of impact for sustainable manufacturing. Adv. Transdiscipl. Eng. 2016, 4, 145–154. [Google Scholar] [CrossRef]
- Brundage, M.P.; Chang, Q.; Li, Y.; Arinez, J.; Xiao, G. Sustainable Manufacturing Performance Indicators for a Serial Production Line. IEEE Trans. Autom. Sci. Eng. 2016, 13, 676–687. [Google Scholar] [CrossRef]
- Amrina, E.; Yusof, S.M. Key performance indicators for sustainable manufacturing evaluation in automotive companies. In Proceedings of the 2011 IEEE International Conference on Industrial Engineering and Engineering Management, Singapore, 6–9 December 2011; pp. 1093–1097. [Google Scholar] [CrossRef] [Green Version]
- May, G.; Taisch, M.; Prabhu, V.V.; Barletta, I. Energy related key performance indicators-state of the art, gaps and industrial needs. IFIP Adv. Inf. Commun. Technol. 2013, 414, 257–267. [Google Scholar] [CrossRef] [Green Version]
- Kara, S.; Honke, I.; Kaebernick, H. An integrated framework for implementing sustainable product development. In Proceedings of the Fourth International Symposium on Environmentally Conscious Design and Inverse Manufacturing, Eco Design, Tokyo, Japan, 12–14 December 2005; Volume 2005, pp. 684–691. [Google Scholar] [CrossRef]
- Koplin, J.; Seuring, S.; Mesterharm, M. Incorporating sustainability into supply management in the automotive industry—the case of the Volkswagen AG. J. Clean. Prod. 2007, 15, 1053–1062. [Google Scholar] [CrossRef]
- Vachon, S.; Klassen, R.D. Environmental management and manufacturing performance: The role of collaboration in the supply chain. Int. J. Prod. Econ. 2008, 111, 299–315. [Google Scholar] [CrossRef]
- Herrmann, C.; Zein, A.; Thiede, S.; Bergmann, L.; Bock, R. Bringing sustainable manufacturing into practice-the machine tool case. In Proceedings of the 6th Global Conference on Sustainable Production Development and Life Cycle Engineering, Busan, Korea; pp. 272–277. Available online: https://ris.utwente.nl/ws/portalfiles/portal/228163559/Herrmann2008bringing.pdf (accessed on 22 December 2021).
- Ladd, S.; Badurdeen, F. Supplier sustainability evaluation and selection. In Proceedings of the 2010 Industrial Engineering Research Conference, Cancun, Mexico, 5–9 June 2010; pp. 1–6. [Google Scholar]
- El-Haggar, S.M. Sustainability of Industrial Waste Management. En: Sustainable Industrial Design and Waste Management. J. Environ. Prot. 2017, 8. Available online: https://www.scirp.org/(S(lz5mqp453edsnp55rrgjct55))/reference/referencespapers.aspx?referenceid=1999031 (accessed on 30 June 2021).
- Bae, H.; Smardon, R.S. Indicators of Sustainable Business Practices. Available online: www.intechopen.com (accessed on 22 December 2021).
- ISO—ISO 14040:2006—Environmental Management—Life Cycle Assessment—Principles and Framework. Available online: https://www.iso.org/standard/37456.html (accessed on 30 June 2021).
- ISO. ISO 15663 Petroleum, Petrochemical and Natural Gas Industries—Life Cycle Costing; Published by International Organization for Standardization; 2021; Available online: www.iso.org (accessed on 15 December 2021).
- IEC. IEC 60300-3-3: Application Guide—Life Cycle Costing; International Electrotechnical Commission, 2017; Available online: https://webstore.iec.ch/publication/31206 (accessed on 28 December 2021).
- ISO. ISO 15686-5:2017—Buildings and Constructed Assets—Service Life Planning—Part 5: Life-Cycle Costing. Available online: https://www.iso.org/standard/61148.html (accessed on 28 December 2021).
- Hoogmartens, R.; van Passel, S.; van Acker, K.; Dubois, M. Bridging the gap between LCA, LCC and CBA as sustainability assessment tools. Environ. Impact Assess. Rev. 2014, 48, 27–33. [Google Scholar] [CrossRef]
- Chofreh, A.G.; Goni, F.A. Review of Frameworks for Sustainability Implementation. Sustain. Dev. 2017, 25, 180–188. [Google Scholar] [CrossRef]
- Winroth, M.; Almström, P.; Andersson, C. Sustainable indicators at factory level-a framework for practical assessement. In Proceedings of the IIE Annual Conference. Proceedings. Institure of Industrial and Systems Engineers (IISE), Orlando, FL, USA, 19–22 May 2012; Available online: https://research.chalmers.se/publication/155756 (accessed on 23 December 2021).
- Huang, A.; Badurdeen, F. Sustainable Manufacturing Performance Evaluation: Integrating Product and Process Metrics for Systems Level Assessment. Procedia Manuf. 2017, 8, 563–570. [Google Scholar] [CrossRef]
- Shuaib, M.; Seevers, D.; Zhang, X.; Badurdeen, F.; Rouch, K.E.; Jawahir, I.S. Product sustainability index (ProdSI): A metrics-based framework to evaluate the total life cycle sustainability of manufactured products shuaib. Prodsi framework to evaluate product sustainability. J. Ind. Ecol. 2014, 18, 491–507. [Google Scholar] [CrossRef]
- Tan, H.X.; Yeo, Z.; Ng, R.; Tjandra, T.B.; Song, B. A sustainability indicator framework for Singapore small and medium-sized manufacturing enterprises. Procedia CIRP 2015, 29, 132–137. [Google Scholar] [CrossRef]
- Donnelly, A.; Jones, M.; O’Mahony, T.; Byrne, G. Selecting environmental indicator for use in strategic environmental assessment. Environ. Impact Assess. Rev. 2007, 27, 161–175. [Google Scholar] [CrossRef]
- Hristov, I.; Chirico, A. The role of sustainability key performance indicators (KPIs) in implementing sustainable strategies. Sustainability 2019, 11, 5742. [Google Scholar] [CrossRef] [Green Version]
- Park, K.; Kremer, G.E.O. Text mining-based categorization and user perspective analysis of environmental sustainability indicators for manufacturing and service systems. Ecol. Indic. 2017, 72, 803–820. [Google Scholar] [CrossRef]
- Fan, C.; Carrell, J.D.; Zhang, H.C. An investigation of indicators for measuring sustainable manufacturing. In Proceedings of the 2010 IEEE International Symposium on Sustainable Systems and Technology, Arlington, VA, USA, 17–19 May 2010. [Google Scholar] [CrossRef]
- Lucato, W.C.; Santos, J.C.d.; Pacchini, A.P.T. Measuring the sustainability of a manufacturing process: A conceptual framework. Sustainability 2018, 10, 81. [Google Scholar] [CrossRef] [Green Version]
- Joung, C.B.; Carrell, J.; Sarkar, P.; Feng, S.C. Categorization of indicators for sustainable manufacturing. Ecol. Indic. 2013, 24, 148–157. [Google Scholar] [CrossRef]
- Tarquinio, L.; Raucci, D.; Benedetti, R. An investigation of Global Reporting Initiative performance indicators in corporate Sustainability Reports: Greek, Italian and Spanish evidence. Sustainability 2018, 10, 897. [Google Scholar] [CrossRef]
- GRI Standards. Available online: https://www.globalreporting.org/standards/ (accessed on 30 June 2021).
- STANDARD, G.R.I. GRI-301-Materials-2016. Available online: https://www.globalreporting.org/standards/media/2130/italian-gri-301-materials-2016.pdf (accessed on 23 December 2021).
- STANDARD, G.R.I. GRI-302-Energy-2016. Available online: https://www.globalreporting.org/standards/media/2131/italian-gri-302-energy-2016.pdf (accessed on 23 December 2021).
- STANDARD, G.R.I. GRI-303-Water-2018. Available online: https://www.globalreporting.org/standards/media/1909/gri-303-water-and-effluents-2018.pdf (accessed on 23 December 2021).
- STANDARD, G.R.I. GRI-305-Emissions-2016. Available online: https://www.globalreporting.org/standards/media/1012/gri-305-emissions-2016.pdf (accessed on 23 December 2021).
- STANDARD, G.R.I. GRI-306-Waste-2020. Available online: https://www.globalreporting.org/standards/media/2573/gri-306-waste-2020.pdf/ (accessed on 23 December 2021).
- Errigo, A.; Choi, J.K.; Kissock, K. Techno-Economic-Environmental impacts of industrial energy assessment: Sustainable industrial motor systems of small and medium-sized enterprises. Sustain. Energy Technol. Assess. 2022, 49, 101694. [Google Scholar] [CrossRef]
- Menghi, R.; Papetti, A.; Germani, M.; Marconi, M. Energy efficiency of manufacturing systems: A review of energy assessment methods and tools. J. Clean. Prod. 2019, 240, 118276. [Google Scholar] [CrossRef]
- Mousavi, S.; Kara, S.; Kornfeld, B. A hierarchical framework for concurrent assessment of energy and water efficiency in manufacturing systems. J. Clean. Prod. 2016, 133, 88–98. [Google Scholar] [CrossRef]
- Arvidsson, R.; Svanström, M. A framework for energy use indicators and their reporting in life cycle assessment. Integr. Environ. Assess. Manag. 2016, 12, 429–436. [Google Scholar] [CrossRef] [Green Version]
- Mayer, F.D.; Brondani, M.; Carrillo, M.C.V.; Hoffmann, R.; Lora, E.E.S. Revisiting energy efficiency, renewability, and sustainability indicators in biofuels life cycle: Analysis and standardization proposal. J. Clean. Prod. 2020, 252, 119850. [Google Scholar] [CrossRef]
- Coroiu, M.; Chindris, M. Energy efficiency indicators and methodology for evaluation of energy performance and retained savings. In Proceedings of the 49th International Universities Power Engineering Conference (UPEC), Cluj-Napoca, Romania, 2–5 September 2014. [Google Scholar]
- Wu, L.-M.; Chen, B.-S. Modeling of energy efficiency indicator for semiconductor industry. In Proceedings of the 2007 IEEE International Conference on Industrial Engineering and Engineering Management, Singapore, 2–4 December 2007. [Google Scholar] [CrossRef]
- Thiede, S. Energy Efficiency in Manufacturing Systems; Springer Science & Business Media: Berlin, Germany, 2012. [Google Scholar] [CrossRef]
- PEF and OEF: Assessment of Environmental Performance of Products, Services and Organisations—IMQ. Available online: https://www.imq.it/en/green-services-and-solutions/assessment-of-environmental-performance-pef-and-oef-solutions (accessed on 2 July 2021).
- Pelletier, N.; Allacker, K.; Manfredi, S.; Chomkhamsri, K.; de Souza, D.M. Organisation Environmental Footprint (OEF) Guide Institute for Environment and Sustainability (IES) Organisation Environmental Footprint Guide—CONSOLIDATED VERSION Organisation Environmental Footprint Guide. 2012. Available online: https://ec.europa.eu/environment/eussd/pdf/footprint/OEF%20Guide_final_July%202012_clean%20version.pdf (accessed on 2 December 2021).
- Manfredi, S.; Allacker, K.; Chomkhamsri, K.; Pelletier, N.; de Souza, D.M. Product Environmental Footprint (PEF) Guide Institute for Environment and Sustainability (IES) Product Environmental Footprint Guide, Consolidated Version; 2012. Available online: https://ec.europa.eu/environment/eussd/pdf/footprint/PEF%20methodology%20final%20draft.pdf (accessed on 28 December 2021).
- EPD International. Available online: https://www.environdec.com/home (accessed on 2 July 2021).
- ISO. ISO 14025:2006—Environmental Labels and Declarations—Type III Environmental Declarations—Principles and Procedures. Available online: https://www.iso.org/standard/38131.html (accessed on 28 December 2021).
- The PCR|EPD International. Available online: https://www.environdec.com/product-category-rules-pcr/the-pcr (accessed on 28 December 2021).
- Linke, B.S.; Corman, G.J.; Dornfeld, D.A.; Tönissen, S. Sustainability indicators for discrete manufacturing processes applied to grinding technology. J. Manuf. Syst. 2013, 32, 556–563. [Google Scholar] [CrossRef] [Green Version]
- Amrina, E.; Vilsi, A.L. Key Performance Indicators for Sustainable Manufacturing Evaluation in Cement Industry. Procedia CIRP 2015, 26, 19–23. [Google Scholar] [CrossRef] [Green Version]
- Patil, H.R.; Channappa; Javalagi, M. Analysis of Key Performance Indicators for Sustainable Manufacturing in Sugar Industry Using Analytical Hierarchy Process. Indian J. Eng. Mater. Sci. (IJEMS) 2020, 27, 959–963. [Google Scholar]
- Akbar, M.; Irohara, T. Scheduling for sustainable manufacturing: A review. J. Clean. Prod. 2018, 205, 866–883. [Google Scholar] [CrossRef]
- Daniela, M.K.; Pigosso, C.A.; McAloone, T.C. Towards the ex-ante sustainability screening of circular economy initiatives in manufacturing companies: Consolidation of leading sustainability-related performance indicators. J. Clean. Prod. 2019, 241, 118318. [Google Scholar] [CrossRef]
- Andersson, E.; Thollander, P. Key performance indicators for energy management in the Swedish pulp and paper industry. Energy Strategy Rev. 2019, 24, 229–235. [Google Scholar] [CrossRef]
- Dočekalová, M.P.; Kocmanová, A. Composite indicator for measuring corporate sustainability. Ecol. Indic. 2016, 61, 612–623. [Google Scholar] [CrossRef]
- Zarte, M.; Pechmann, A.; Nunes, I.L. Indicator framework for sustainable production planning and controlling. Int. J. Sustain. Eng. 2019, 12, 149–158. [Google Scholar] [CrossRef]
- Kocmanova, A.; Docekalova, M.P.; Simanaviciene, Z. Corporate sustainability measurement and assessment of Czech manufacturing companies using a composite indicator. Eng. Econ. 2017, 28, 88–100. [Google Scholar] [CrossRef] [Green Version]
- Steffen, W.; Noone, K.J. Planetary Boundaries: Exploring the Safe Operating Space for Humanity [Internet] UNLOCK-Understanding Local Government Drivers for Sustainable Consumption View Project Climate Adaptation Governance in a Globalising World View Project, 960. Available online: https://www.researchgate.net/publication/284146060 (accessed on 23 December 2021).
- Bey, N. Life Cycle Management. Life Cycle Assess. Theory Pract. 2018, 519–544. [Google Scholar] [CrossRef]


| Abbreviation | Definition |
|---|---|
| CAPEX | Capital Expenditure |
| CBS | Cost Breakdown Structure |
| DSS | Decision Support System |
| EPA | US Environmental Protection Agency |
| EPD | Environmental Product Declaration |
| EPIs | Energy Performance Indicators |
| GHG | Greenhouse Gases |
| GRI | Global Reporting Initiative |
| IoT | Internet of Things |
| KPI | Key Performance Indicators |
| LCA | Life Cycle Assessment |
| LCC | Life Cycle Costing |
| LCCA | Life Cycle Cost Assessment |
| LCEA | Life Cycle Energy Assessment |
| LCI | Life Cycle Inventory |
| LCIA | Life Cycle Impact Assessment |
| NIST | National Institute of Standards and Technology |
| NPV | Net Present Value |
| O&M | Operation and Maintenance |
| OECD | Organization for Economic Cooperation and Development |
| OEF | Organization Environmental Footprint |
| OPEX | Operational Expense |
| PCRs | Product Category Rules |
| PEF | Product Environmental Footprint |
| ProdSI | Product Sustainability Index |
| REACH | Registration, Evaluation, Authorization and Restriction of Chemicals |
| SMEs | Small Medium Enterprises |
| SMIR | Sustainable Manufacturing Indicator Repository |
| SoA | State of the Art |
| TBL | Triple Bottom Line |
| Author (Year) | Sustainability Dimensions | Decision-Making Levels | Industrial Relevance Validation | |||||
|---|---|---|---|---|---|---|---|---|
| Environmental | Social | Economic | Strategic | Tactical | Operational | |||
| Process | Corporate | |||||||
| Hahn et al. (2015) | ✓ | ✓ | ✓ | ✓ | ✓ | ✓ | ||
| Laurenti et al. (2016) | ✓ | ✓ | ✓ | ✓ | ✓ | |||
| Panagiotakopoulos et al. (2016) | ✓ | ✓ | ✓ | ✓ | ✓ | ✓ | ||
| Gallotta et al. (2016) | ✓ | ✓ | ✓ | ✓ | ||||
| Winroth et al. (2012) [32] | ✓ | ✓ | ✓ | ✓ | ✓ | ✓ | ||
| Huang and Badurdeen (2017) [33] | ✓ | ✓ | ✓ | ✓ | ✓ | ✓ | ✓ | |
| Tan et al. (2015) [35] | ✓ | ✓ | ✓ | ✓ | ✓ | ✓ | ||
| Donnelly et al. (2007) [36] | ✓ | ✓ | ||||||
| Hristov and Chirico (2019) [37] | ✓ | ✓ | ✓ | ✓ | ✓ | |||
| Park and Kremer (2017) [38] | ✓ | ✓ | ✓ | |||||
| Fan et al. (2010) [39] | ✓ | ✓ | ✓ | ✓ | ✓ | ✓ | ✓ | |
| Lucato et al. (2018) [40] | ✓ | ✓ | ✓ | ✓ | ✓ | ✓ | ||
| Joung et al. (2011) [41] | ✓ | ✓ | ✓ | ✓ | ✓ | ✓ | ✓ | |
| Arvidsson and Svanström (2016) [52] | ✓ | ✓ | ✓ | |||||
| Mayer et al. (2020) [53] | ✓ | ✓ | ✓ | |||||
| Coroiu and Chindris (2014) [54] | ✓ | ✓ | ||||||
| Li-Ming Wu and Chen (2007) [55] | ✓ | ✓ | ||||||
| Impact Category | Impact Category Indicator | Unit | Characterization Model |
|---|---|---|---|
| Climate change, total | Radiative forcing as global warming potential (GWP100) | kg CO2 eq. | Baseline model of 100 years of the IPCC (based on IPCC 2013) |
| Ozone depletion | Depletion | kg CFC-11 eq. | Steady-state ODPs as in (WMO 2014 + integrations) |
| Human toxicity, cancer | Comparative Toxic Unit for humans (CTUh) | CTUh | USEtox model 2.1 (Fankte et al., 2017) |
| Human toxicity, non-cancer | Comparative Toxic Unit for humans (CTUh) | CTUh | USEtox model 2.1 (Fankte et al., 2017) |
| Particulate matter | Impact on human health | Disease incidence | PM method recommended by UNEP (UNEP 2016) |
| Ionizing radiation, human health | Human exposure efficiency relative to U235 | kBq U235 eq. | Human health effect model as developed by Dreicer et al. 1995 (Frischknecht et al., 2000) |
| Photochemical ozone formation, human health | Tropospheric ozone concentration increase | kg NMVOC eq. | LOTOS-EUROS model (Van Zelm et al., 2008) as implemented in ReCiPe 2008 |
| Acidification | Accumulated Exceedance (AE) | mol H + eq. | Accumulated Exceedance (Seppälä et al., 2006, Posch et al., 2008) |
| Eutrophication, terrestrial | Accumulated Exceedance (AE) | mol N eq. | Accumulated Exceedance (Seppälä et al., 2006, Posch et al., 2008) |
| Eutrophication, freshwater | Fraction of nutrients reaching freshwater end compartment (P) | kg P eq. | EUTREND model (Struijs et al., 2009) as implemented in ReCiPe |
| Eutrophication, marine | Fraction of nutrients reaching marine end compartment (N) | kg N eq. | EUTREND model (Struijs et al., 2009) as implemented in ReCiPe |
| Ecotoxicity, freshwater | Comparative Toxic Unit for ecosystems (CTUe) | CTUe | USEtox model 2.1 (Fankte et al., 2017) |
| Land use | Soil quality index Biotic production Erosion resistance Mechanical filtration Groundwater replenishment | Dimensionless (pt) kg biotic production kg soil m3 water m3 groundwater | Soil quality index based on LANCA (Beck et al., 2010 and Bos et al., 2016) |
| Water use | User deprivation potential (deprivation-weighted water consumption) | m3 H2O eq. | Available Water Remaining (AWARE) as recommended by UNEP, 2016 |
| Resource use, minerals and metals | Abiotic resource depletion (ADP ultimate reserves) | kg Sb eq. | CML 2002 (Guinée et al., 2002) and van Oers et al., 2002. |
| Resource use, fossils | Abiotic resource depletion—fossil fuels (ADP-fossil) | MJ | CML 2002 (Guinée et al., 2002) and van Oers et al., 2002 |
| Impact Category | Impact Category Indicator | Unit | Characterization Model |
|---|---|---|---|
| Climate change, total | Global Warming Potential | kg CO2 eq. | GWP100, CML 2001 baseline |
| Photochemical ozone formation, human health | Photochemical oxidant formation potential | kg NMVOC eq. | POFP, LOTOS-EUROS as applied in ReCiPe, 2008 |
| Acidification | Accumulated potential | kg SO2 eq. | AP, CML 2001 non-baseline (fate not included) |
| Eutrophication, freshwater | Eutrophication potential | kg PO43-eq. | EP, CML 2001 baseline |
| Water use | Water Scarcity Footprint (WSF) | m3 H2O eq. | AWARE Method: WULCA recommendations on characterization model for WSF 2015, 2017 |
| Resource use, minerals and metals | Abiotic depletion potential—elements | kg Sb eq. | ADP elements, CML 2001 baseline |
| Resource use, fossils | Abiotic depletion potential—fossil fuels | MJ | ADP fossil fuels, CML 2001 baseline |
| Nr | Indicator | Source |
|---|---|---|
| 1 | Total emissions | Amrina & Vilsi, 2015 [64] |
| 2 | Emissions of ozone depleting substances | Amrina & Vilsi, 2015 [64] |
| 3 | Emissions of GHG | Amrina & Vilsi, 2015 [64] |
| 4 | Sulphur dioxides (SOx emissions) | Chengcheng Fan et al., 2010 [39] |
| 5 | Nitrogen oxides (NOx emissions) | Chengcheng Fan et al., 2010 [39] |
| 6 | Percentage of waste generated | Hristov and Chirico, 2019 [37] |
| 7 | Percentage of hazardous material | Chengcheng Fan et al., 2010 [39] |
| 8 | Percentage of reusable/recycled material | H. X. Tan et al., 2015 [35] |
| 9 | Percentage of waste recycled off/on site | Hristov and Chirico, 2019 [37] |
| 10 | Renewable material use | Fan et al., 2010 [39] |
| 11 | Non-renewable material use | Fan et al., 2010 [39] |
| 12 | Weight of restricted substances intensity | OECD Sustainable Manufacturing Indicators [9] |
| 13 | Recycled/reused content of material inputs | OECD Sustainable Manufacturing Indicators [9] |
| 14 | Energy intensity | Andersson and Thollander, 2019 [68]/GRI 302 |
| 15 | Electricity consumption | OECD Sustainable Manufacturing Indicators [9] |
| 16 | Gas consumption rate | OECD Sustainable Manufacturing Indicators [9] |
| 17 | Natural cover | OECD Sustainable Manufacturing Indicators [9] |
| 18 | Water intensity | OECD Sustainable Manufacturing Indicators [9] |
| 19 | Waste intensity | OECD Sustainable Manufacturing Indicators [9] |
| 20 | Emissions intensity | OECD Sustainable Manufacturing Indicators [9] |
| 21 | Renewable energy rate | Winroth et al., 2012 [32] |
| 22 | Renewable electric sources rate | Winroth et al., 2012. [32] |
| 23 | Resource efficiency | Park and Kremer, 2017 [38] |
| 24 | Specific energy consumption | Coroiu and Chindris, 2014 [54] |
| 25 | Energy savings | Coroiu and Chindris, 2014 [54] |
| 26 | Energy waste | Mayer et al., 2020 [53] |
| 27 | Net energy indicator | Mayer et al., 2020 [53] |
| 28 | Cumulative energy demand | Arvidsson and Svanström, 2016 [52] |
| 29 | Non-renewable energy demand | Arvidsson and Svanström, 2016 [52] |
| 30 | Fossil energy use | Arvidsson and Svanström, 2016 [52] |
| 31 | Primary fossil energy use | Arvidsson and Svanström, 2016 [52] |
| 32 | Secondary energy use | Arvidsson and Svanström, 2016 [52] |
| 33 | Energy saving potential | Coroiu and Chindris, 2014 [54] |
| 34 | Total energy consumption | GRI 302: Energy 2016 [45] |
| 35 | Energy efficiency | Sebastian Thiede, 2012 [56] |
| 36 | Energy ratio | Mayer et al., 2020; [53] |
| 37 | Output renewability | Mayer et al., 2020; [53] |
| 38 | Total weight or volume of materials input | GRI 301 [44] |
| 39 | Total material input intensity | GRI 301 [44] |
| 40 | Recycled input materials | GRI 301 [44] |
| 41 | Total energy consumption | GRI 302 [45] |
| 42 | Electricity consumption | GRI 302 [45] |
| 43 | Heating consumption | GRI 302 [45] |
| 44 | Cooling consumption | GRI 302 [45] |
| 45 | Steam consumption | GRI 302 [45] |
| 46 | Percentage of renewable energy consumption generated by the following sources: (i) hydroelectric, (ii) biomass, (iii) solar, (iv) wind | GRI 302 [45] |
| 47 | Percentage of non-renewable energy consumption generated by the following sources: (i) natural gas, (ii) coal, (iii) other fossil fuels | GRI 302 [45] |
| 48 | Reduction in energy consumption | GRI 302 [45] |
| 49 | Total volume of water withdrawn | GRI 303 [46] |
| 50 | Percentage of water withdrawn from the following sources: (i) surface water, (ii) ground, (iii) water, (iv)seawater, (v) third-party water | GRI 303 [46] |
| 51 | Total volume of water recycled and reused by the organization | GRI 303 [46] |
| 52 | Total water discharge | GRI 303 [46] |
| 53 | Percentage of water discharge to the following sources: (i) surface water, (ii) ground, (iii) water, (iv)seawater, (v) third-party water | GRI 303 [46] |
| 54 | Percentage of fresh water (≤1000 mg/L Total Dissolved Solids) discharge for each destination | GRI 303 [46] |
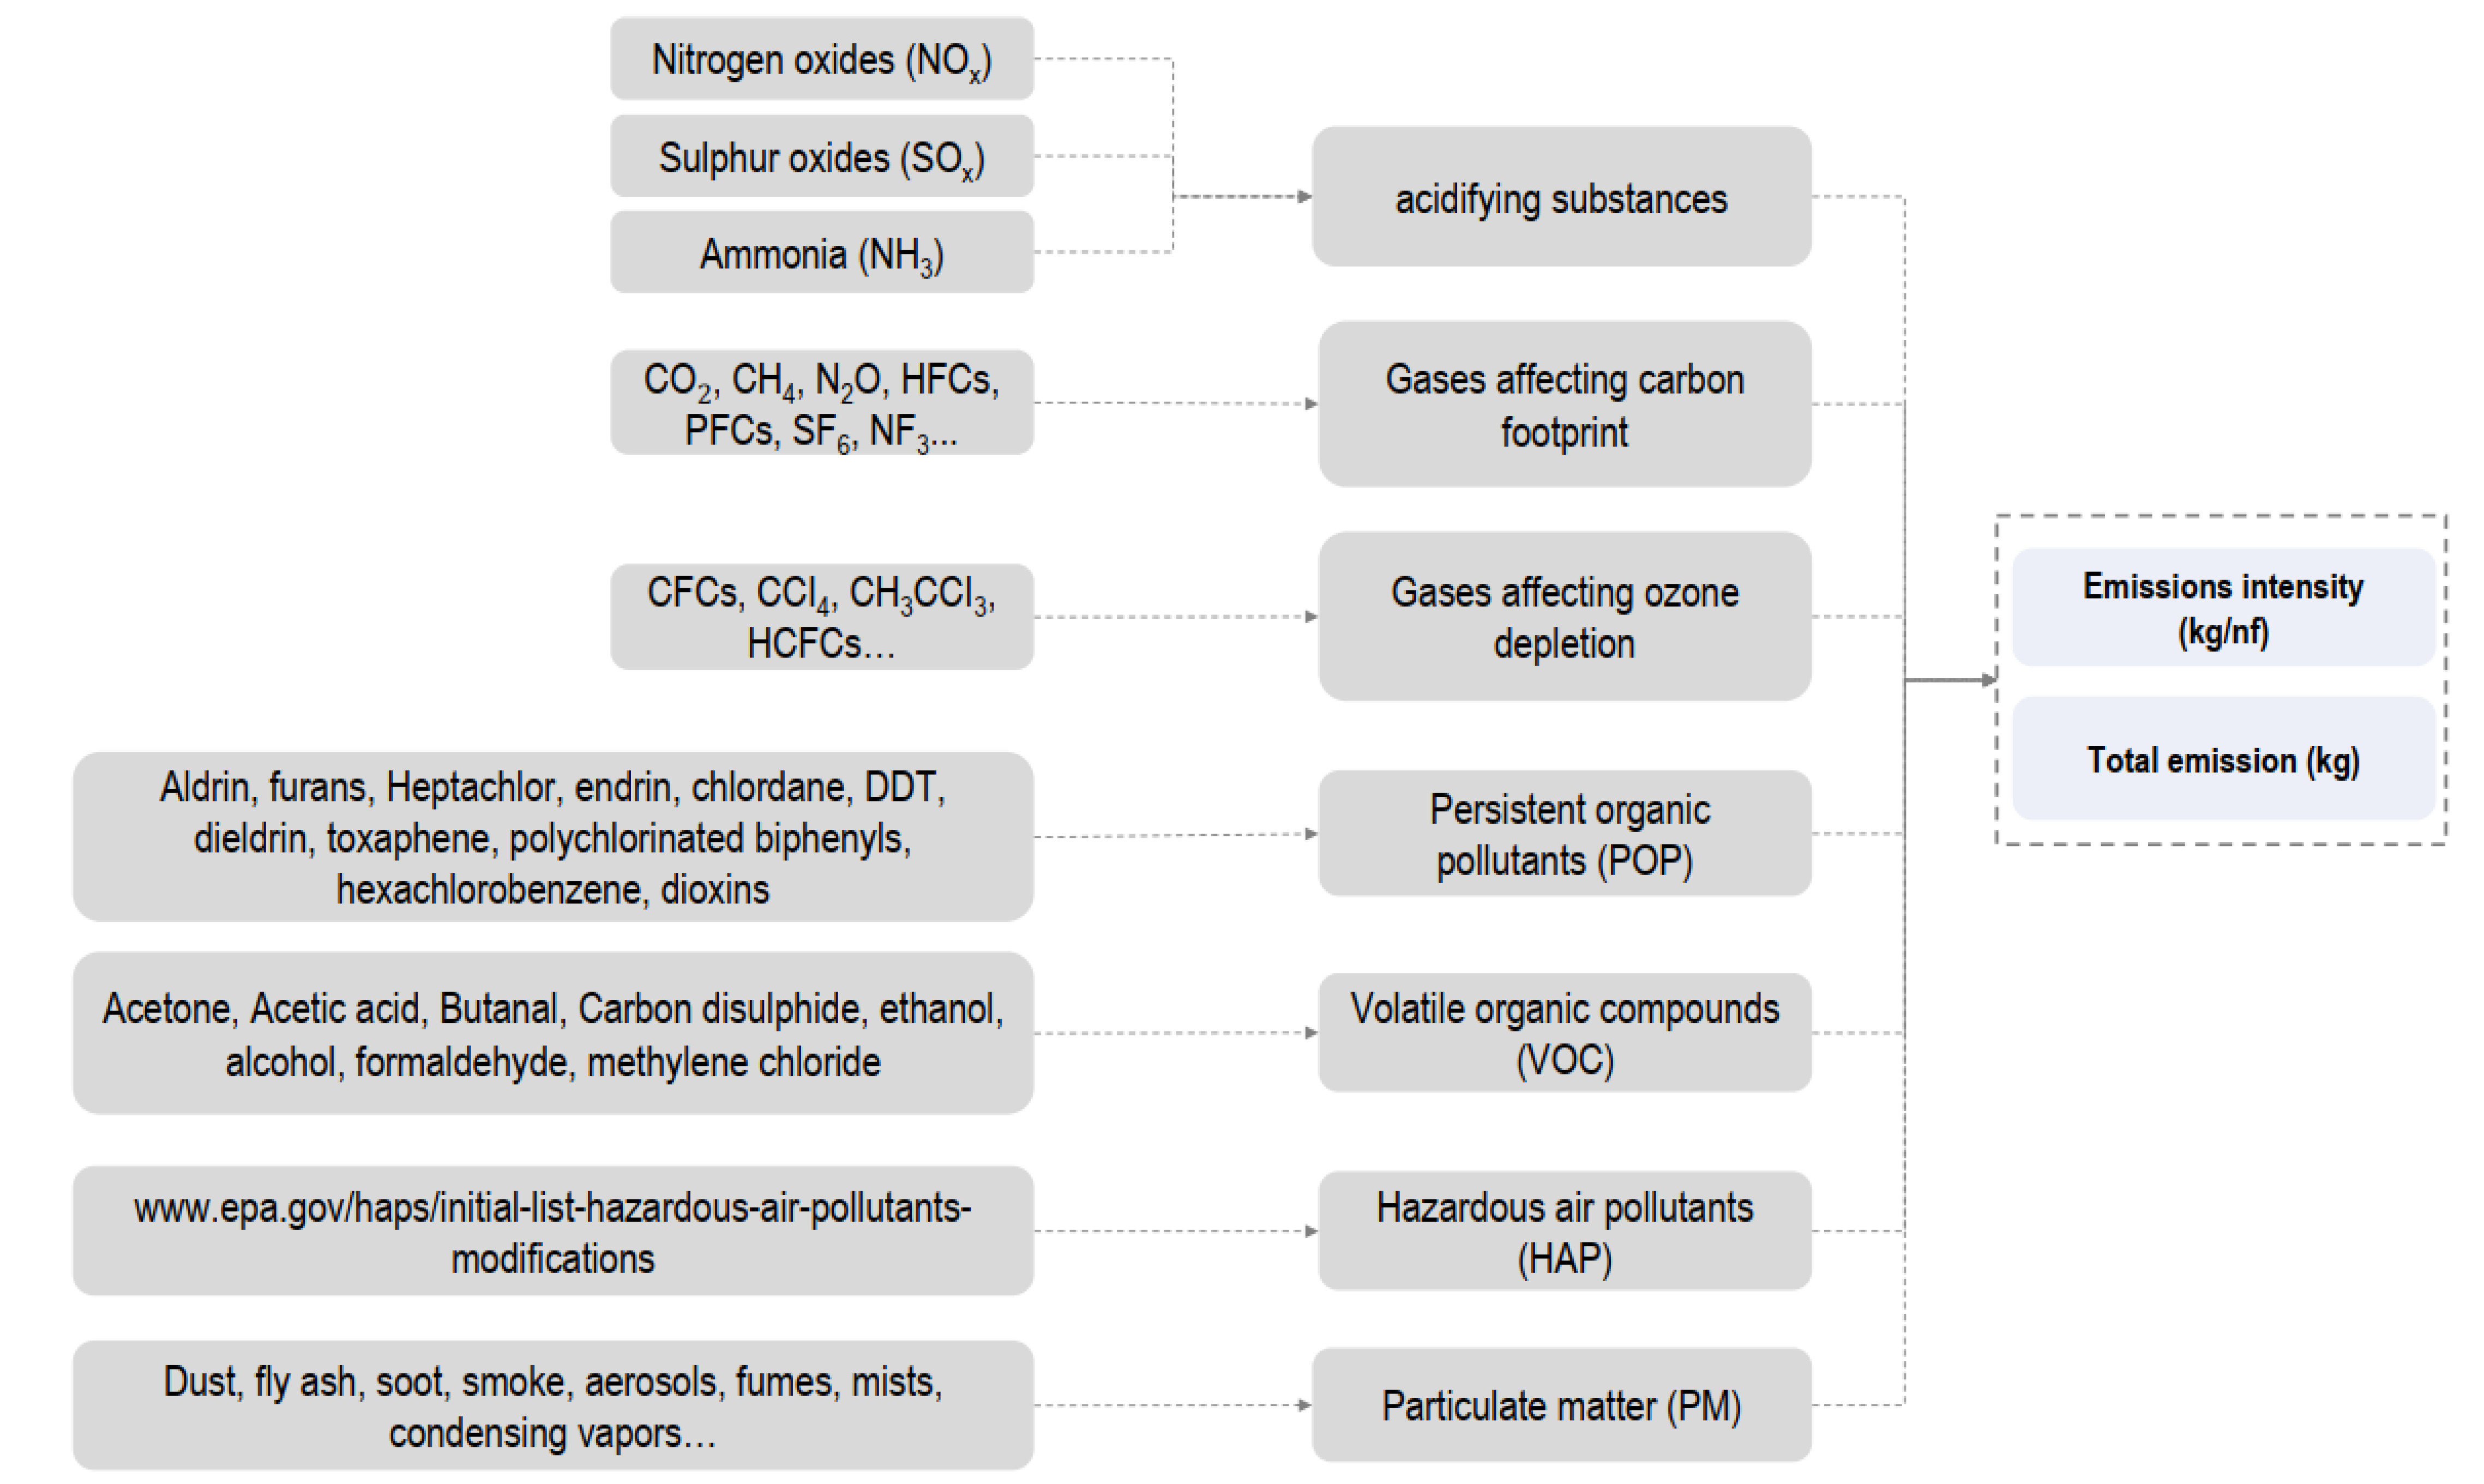
| 55 | Acidifying substances | GRI 305 [47] |
| 56 | Gases affecting climate change (GHG) | GRI 305 [47] |
| 57 | Gases affecting ozone depletion (ODS) | GRI 305 [47] |
| 58 | Persistent organic pollutants (POP) | GRI 305 [47] |
| 59 | Volatile organic compounds (VOC) | GRI 305 [47] |
| 60 | Hazardous air pollutants (HAP) | GRI 305 [47] |
| 61 | Particulate matter (PM) | GRI 305 [47] |
| 62 | Total weight of waste generated | GRI 306 [48] |
| 63 | Percentage structure of waste generated (plastic, paper, metals) | GRI 306 [48] |
| 64 | Waste diverted from disposal preparation for reuse, recycling, other recovery operations | GRI 306 [48] |
| 65 | Percentage of hazardous waste diverted from disposal (for each category) | GRI 306 [48] |
| 66 | Percentage of non-hazardous waste diverted from disposal (for each category) | GRI 306 [48] |
| 67 | Percentage of hazardous waste reused | GRI 306 [48] |
| 68 | Percentage of hazardous waste recycled | GRI 306 [48] |
| 69 | Percentage of hazardous waste sent to other recovery operations | GRI 306 [48] |
| 70 | Percentage of non-hazardous waste reused | GRI 306 [48] |
| 71 | Percentage of non-hazardous waste recycled | GRI 306 [48] |
| 72 | Percentage of non-hazardous waste sent to other recovery operations | GRI 306 [48] |
| 73 | Percentage of waste diverted form disposal recovered on/off site (for each category) | GRI 306 [48] |
| 74 | Waste directed to disposal Incineration (with energy recovery) Incineration (without energy recovery) Landfilling Other disposal operations | GRI 306 [48] |
| 75 | Percentage of non-hazardous waste directed to disposal | GRI 306 [48] |
| 76 | Percentage of hazardous waste directed to disposal | GRI 306 [48] |
| 77 | Percentage of waste directed to landfilling, incinerator, or other recovery operations | GRI 306 [48] |
| 78 | Percentage of waste directed to other disposal operation | GRI 306 [48] |
| 79 | Percentage of hazardous waste disposed on site | GRI 306 [48] |
| 80 | Percentage of non-hazardous waste disposed on site | GRI 306 [48] |
| Nr | Indicator | Source |
|---|---|---|
| 81 | Rate of employees that are shareholders | Hristov and Chirico, 2019 [37]. |
| 82 | Employee satisfaction rate | Hristov and Chirico, 2019 [37]. |
| 83 | Employee turnover rate | Hristov and Chirico, 2019 [37]. |
| 84 | Accident rate | Hristov and Chirico, 2019 [37]. |
| 85 | Time of employees working in dangerous workplaces | Hristov and Chirico, 2019 [37]. |
| 86 | Noise level | Hristov and Chirico, 2019 [37]. |
| 87 | Equality rate | Hristov and Chirico, 2019 [37]. |
| 88 | Labor intensity | Hristov and Chirico, 2019 [37]. |
| 89 | Percentage of participants in social initiatives | Hristov and Chirico, 2019 [37]. |
| 90 | Absenteeism | Hristov and Chirico, 2019 [37]. |
| 91 | Rate of employees that are shareholders | Winroth et al., 2012 [32] |
| 92 | Employee satisfaction rate | Winroth et al., 2012 [32] |
| 93 | Employee turnover rate | Dočekalová and Kocmanová, 2016 [69] |
| 94 | Noise level in terms of decibel (db) | Akbar and Irohara, 2018 [66] |
| 95 | Percentage of days of absence over the total number of working days | Akbar and Irohara, 2018 [66] |
| 96 | Accident rate | Akbar and Irohara, 2018 [66] |
| 97 | Time of employees working at risky workplace | Zarte et al., 2019 [70] |
| 98 | Gender equality rate—balance of male to female ratio | Dočekalová and Kocmanová, 2016 [69] |
| 99 | Labor intensity | Linke et al., 2013 [63] |
| 100 | Number of initiatives at national and local level | Hristov and Chirico, 2019 [37]. |
| 101 | Total workforce by employment type, employment contract, and region, broken down by gender | GRI 400: Social Disclosures |
| 102 | Total number and rate of new employee hires and employee turnover by age group, gender, and region | GRI 400: Social Disclosures |
| 103 | Benefits provided to full-time employees that are not provided to temporary or part-time employees, by significant locations of operation | GRI 400: Social Disclosures |
| 104 | Return to work and retention rates after parental leave, by gender | GRI 400: Social Disclosures |
| 105 | Percentage of employees covered by collective bargaining agreements | GRI 400: Social Disclosures |
| 106 | Minimum notice period(s) regarding operational changes, including whether it is specified in collective agreements | GRI 400: Social Disclosures |
| 107 | Percentage of total workforce represented by informal joint management–worker health and safety committees that help monitor and advise on occupational health and safety programs | GRI 400: Social Disclosures |
| 108 | Rates of injury, occupational diseases, lost days, and absenteeism, and total number of work-related fatalities, by region and by gender | GRI 400: Social Disclosures |
| 109 | Education, training, counseling, prevention, and risk-control programs in place to assist workforce members, their families, or community members regarding serious diseases | GRI 400: Social Disclosures |
| 110 | Health and safety topics covered in formal agreements with trade unions | GRI 400: Social Disclosures |
| 111 | Average hours of training per year per employee by gender, and by employee category | GRI 400: Social Disclosures |
| 112 | Programs for skills management and lifelong learning that support the continued employability of employees and assist them in managing career endings | GRI 400: Social Disclosures |
| 113 | Percentage of employees receiving regular performance and career development reviews, by gender | GRI 400: Social Disclosures |
| 114 | Composition of governance bodies and breakdown of employees per employee category according to gender, age group, minority group membership, and other indicators of diversity | GRI 400: Social Disclosures |
| 115 | Ratio of basic salary and remuneration of women to men by employee category, by significant locations of operation | GRI 400: Social Disclosures |
| Nr. | Indicator | Source |
|---|---|---|
| 116 | Radiative forcing as global warming potential (GWP100) | Baseline model of 100 years of the IPCC (based on IPCC 2013) |
| 117 | Ozone Depletion Potential | Steady-state ODPs as in (WMO 2014 + integrations) |
| 118 | Comparative Toxic Unit for humans (CTUh) | USEtox model 2.1 (Fankte et al., 2017) |
| 119 | Comparative Toxic Unit for humans (CTUh) | USEtox model 2.1 (Fankte et al., 2017) |
| 120 | Impact on human health | PM method recommended by UNEP (UNEP 2016) |
| 121 | Human exposure efficiency relative to U235 | Human health effect model as developed by Dreicer et al., 1995 (Frischknecht et al., 2000) |
| 122 | Tropospheric ozone concentration increase | LOTOS-EUROS model (Van Zelm et al., 2008) as implemented in ReCiPe 2008 |
| 123 | Accumulated Exceedance (AE) | Accumulated Exceedance (Seppälä et al., 2006, Posch et al., 2008) |
| 124 | Accumulated Exceedance (AE) | Accumulated Exceedance (Seppälä et al., 2006, Posch et al., 2008) |
| 125 | Fraction of nutrients reaching freshwater end compartment (P) | EUTREND model (Struijs et al., 2009) as implemented in ReCiPe |
| 126 | Fraction of nutrients reaching marine end compartment (N) | EUTREND model (Struijs et al., 2009) as implemented in ReCiPe |
| 127 | Comparative Toxic Unit for ecosystems (CTUe) | USEtox model 2.1 (Fankte et al., 2017) |
| 128 | Soil quality index Biotic production Erosion resistance Mechanical filtration Groundwater replenishment | Soil quality index based on LANCA (Beck et al., 2010 and Bos et al., 2016) |
| 129 | User deprivation potential (deprivation-weighted water consumption) | Available Water Remaining (AWARE) as recommended by UNEP, 2016 |
| 130 | Abiotic resource depletion (ADP ultimate reserves) | CML 2002 (Guinée et al., 2002) and van Oers et al., 2002. |
| 131 | Abiotic resource depletion—fossil fuels (ADP-fossil | CML 2002 (Guinée et al., 2002) and van Oers et al., 2002 |
| 132 | Global Warming Potential | GWP100, CML 2001 baseline |
| 133 | Photochemical oxidant formation potential | POFP, LOTOS-EUROS as applied in ReCiPe 2008 |
| 134 | Accumulated potential | AP, CML 2001 non-baseline (fate not included) |
| 135 | Eutrophication potential | EP, CML 2001 baseline |
| 136 | Water Scarcity Footprint (WSF) | AWARE Method: WULCA recommendations on characterization model for WSF 2015, 2017 |
| 137 | Abiotic depletion potential—Elements | ADP elements, CML 2001, baseline |
| 138 | Abiotic depletion potential—Fossil fuels | ADP fossil fuels, CML 2001, baseline |
| Nr. | Indicator | Source |
|---|---|---|
| 139 | Return of equity (ROE) | Kocmanova et al., 2017b [71]. |
| 140 | Return on assets (ROA) | Kocmanova et al., 2017b [71]. |
| 141 | Return on sale (ROS) | Kocmanova et al., 2017b [71]. |
| 142 | Return on capital employed (ROCE) | Kocmanova et al., 2017b [71]. |
| 143 | Return on Investment (ROI) | Kocmanova et al., 2017b [71]. |
| 144 | Net Present Value (NPV) | Kocmanova et al., 2017b [71]. |
| 145 | Present Value of Costs (PVC) | Kocmanova et al., 2017b [71]. |
| 146 | Internal Rate of return IRR (%) | Kocmanova et al., 2017b [71]. |
| 147 | Pay Back Period (years) | Kocmanova et al., 2017b [71]. |
| 148 | Discounted Pay Back Period (years) | Kocmanova et al., 2017b [71]. |
| 149 | Total life cycle costs and cost savings (LCC) | Kocmanova et al., 2017b [71]. |
| 150 | CAPEX | Kocmanova et al., 2017b [71]. |
| 151 | OPEX (direct) | Kocmanova et al., 2017b [71]. |
| 152 | OPEX (indirect) | Kocmanova et al., 2017b [71]. |
| 153 | Lost revenue through production losses | Kocmanova et al., 2017b [71]. |
| 154 | Productivity | Kocmanova et al., 2017b [71]. |
| 155 | OEE (overall equipment effectiveness: availability, performance, quality) | Kocmanova et al., 2017b [71]. |
| 156 | Delivery precision | Kocmanova et al., 2017b [71].; Winroth et al., 2012 [32] |
| 157 | Percentage of money for the purchase from local suppliers | Kocmanova et al., 2017b [71]. |
| 158 | Market demand and growth | Kocmanova et al., 2017b [71]. |
| 159 | Investments in environmental certification (ISO 9001, ISO 14001, ISO 50001, UNE 166,002 and OHSAS 18001) | Kocmanova et al., 2017b [71]. |
| 160 | Asset turnover | Dočekalová and Kocmanová, 2016 [69] |
| 161 | Inventory turnover | Dočekalová and Kocmanová, 2016 [69] |
| 162 | Net profit margin | Akbar and Irohara, 2018 [66]. |
| 163 | Total cost of ownership | Hristov and Chirico, 2019 [37]. |
| Number | Indicator |
|---|---|
| 3 | Emissions of GHG |
| 2 | Emissions of ozone depleting substances |
| 6 | Percentage of waste generated |
| 7 | Percentage of hazardous materials |
| 8 | Percentage of reusable/recycled materials |
| 9 | Percentage of waste recycled off/on site |
| 21 | Renewable energy rate |
| 22 | Renewable electric sources rate |
| 23 | Resource efficiency |
| 11 | Non-renewable materials intensity |
| 12 | weight of restricted substances intensity |
| 18 | Water intensity |
| 14 | Energy intensity |
| 17 | Natural cover |
| 28 | Cumulative energy demand |
| 29 | non-renewable cumulative energy demand |
| 30 | Fossil energy use |
| 31 | Primary fossil energy use |
| 32 | Secondary energy use |
| 27 | Net energy indicator |
| 33 | Energy saving potential |
| 25 | Energy savings |
| 24 | Specific energy consumption |
| 34 | Total energy consumption |
| 36 | Energy ratio |
| 35 | Energy efficiency (1) |
| 35 | Energy efficiency (2) |
| 37 | Output renewability |
| 63 | Percentage of plastic/paper/metals |
| 64 | Percentage of waste diverted from disposal |
| 65 | Percentage of hazardous waste diverted from disposal |
| 66 | Percentage of non-hazardous waste diverted from disposal |
| 67 | Percentage of hazardous waste reused |
| 68 | Percentage of hazardous waste recycled |
| 69 | Percentage of hazardous waste sent to other recovery operations |
| 70 | Percentage of non-hazardous waste reused |
| 71 | Percentage of non-hazardous waste recycled |
| 72 | Percentage of non-hazardous waste sent to other recovery operations |
| 73 | Percentage of waste reused on site |
| 73 | Percentage of waste recycled on site |
| 73 | Percentage of waste recovered on site |
| 74 | Percentage of waste directed to disposal |
| 76 | Percentage of hazardous waste directed to disposal |
| 75 | Percentage of non-hazardous waste directed to disposal |
| 77 | Percentage of hazardous waste directed to incinerator |
| 77 | Percentage of hazardous waste directed to landfilling |
| 77 | Percentage of hazardous waste directed to other disposal operations |
| 77 | Percentage of non-hazardous waste directed to incinerator |
| 77 | Percentage of waste directed to landfilling |
| 78 | Percentage of waste directed to other disposal operation |
| 79 | Percentage of hazardous waste disposed on site |
| 80 | Percentage of non-hazardous waste disposed on site |
| 55 | Percentage of acidifying substances |
| 56 | Percentage of greenhouse gases (GHG) |
| 57 | Percentage of ozone depleting substances (ODS) |
| 58 | Percentage of persistent organic pollutants (POP) |
| 59 | Percentage of volatile organic compounds (VOC) |
| 60 | Percentage of hazardous air pollutants (HAP) |
| 61 | Percentage of particulate matter (PM) |
| 10 | Percentage renewable materials used |
| 11 | Percentage of non-renewable materials used |
| 40 | Percentage of total recycled input materials |
| 10 | Percentage of restricted substances (e.g., REACH) |
| 50 | Percentage of water withdrawn from the following sources: (i) surface water, (ii) ground, (iii) water, (iv)seawater, (v) third-party water |
| 51 | Percentage of water reused/recycled by the organization |
| 53 | Percentage of water discharge to the following sources: (i) surface water, (ii) ground, (iii) water, (iv)seawater, (v) third-party water |
| 54 | Percentage of fresh water (≤1000 mg/L Total Dissolved Solids) discharge for each destination |
| 46 | Percentage of renewable energy consumption generated by the following sources: (i) hydroelectric, (ii) biomass, (iii) solar, (iv) wind |
| 47 | Percentage of non-renewable energy consumption generated by the following sources: (i) natural gas, (ii) coal, (iii) other fossil fuels |
| 15 | Total electric consumption |
| 43 | Total heating consumption |
| 44 | Total cooling consumption |
| 45 | Total steam consumption |
| Nr | Indicator | Formula | Unit |
|---|---|---|---|
| 62 | Total waste generated | - | kg |
| 19 | Waste intensity | kg/nf | |
| 63 | Percentage of plastic/paper/metals | % |
| Nr | Indicator | Formula | Unit |
|---|---|---|---|
| 64 | Percentage of waste diverted from disposal | % | |
| 65 | Percentage of hazardous waste diverted from disposal | % | |
| 66 | Percentage of non-hazardous waste diverted from disposal | % | |
| 67 | Percentage of hazardous waste reused | % | |
| 68 | Percentage of hazardous waste recycled | % | |
| 69 | Percentage of hazardous waste sent to other recovery operations | % | |
| 70 | Percentage of non-hazardous waste reused | % | |
| 71 | Percentage of non-hazardous waste recycled | % | |
| 72 | Percentage of non-hazardous waste sent to other recovery operations | % | |
| 73 | Percentage of waste reused on site | % | |
| 73 | Percentage of waste recycled on site | % | |
| 73 | Percentage of waste recovered on site | % |
| Nr | Indicator | Formula | Unit |
|---|---|---|---|
| 74 | Percentage of waste directed to disposal | % | |
| 76 | Percentage of hazardous waste directed to disposal | % | |
| 75 | Percentage of non-hazardous waste directed to disposal | % | |
| 77 | Percentage of hazardous waste directed to incinerator | % | |
| 77 | Percentage of hazardous waste directed to landfilling | % | |
| 77 | Percentage of hazardous waste directed to other disposal operations | % | |
| 77 | Percentage of non-hazardous waste directed to incinerator | % | |
| 77 | Percentage of waste directed to landfilling | % | |
| 78 | Percentage of waste directed to other disposal operation | % | |
| 79 | Percentage of hazardous waste disposed on site | % | |
| 80 | Percentage of non-hazardous waste disposed on site | % |
| Nr | Indicator | Formula | Unit |
|---|---|---|---|
| 1 | Total emissions | - | kg |
| 20 | Emissions intensity | kg/nf | |
| 55 | Percentage of acidifying substances | % | |
| 56 | Percentage of greenhouse gases (GHG) | % | |
| 57 | Percentage of ozone depleting substances (ODS) | % | |
| 58 | Percentage of persistent organic pollutants (POP) | % | |
| 59 | Percentage of volatile organic compounds (VOC) | % | |
| 60 | Percentage of hazardous air pollutants (HAP) | % | |
| 61 | Percentage of particulate matter (PM) | % |
| Nr | Indicator | Formula | Unit |
|---|---|---|---|
| 38 | Total material input | - | kg |
| 39 | Total material input intensity | kg/nf | |
| 10 | Percentage of renewable materials used | % | |
| 11 | Percentage of non-renewable materials used | % | |
| 40 | Percentage of total recycled input materials | % | |
| 10 | Percentage of restricted substances (e.g., REACH) | % |
| Nr | Indicator | Formula | Unit |
|---|---|---|---|
| 49 | Total water intake | - | ML |
| 18 | Water intensity | ML/nf | |
| 50 | Percentage of water withdrawn from the following sources: (i) surface water, (ii) ground, (iii) water, (iv) seawater, (v) third-party water | % |
| Nr | Indicator | Formula | Unit |
|---|---|---|---|
| 52 | Total water discharge | - | ML |
| 51 | Percentage of water reused/recycled by the organization | % | |
| 53 | Percentage of water discharge to the following sources: (i) surface water, (ii) ground, (iii) water, (iv) seawater, (v) third-party water | % | |
| 54 | Percentage of fresh water (≤1000 mg/L Total Dissolved Solids) discharge for each destination | % |
| Nr | Indicator | Formula | Unit |
|---|---|---|---|
| 34 | Total energy consumption | - | MJ |
| 14 | Energy intensity | MJ/nf | |
| 21 | Percentage of renewable energy consumption | % | |
| 46 | Percentage of renewable energy consumption generated by the following sources: (i) hydroelectric, (ii) biomass, (iii) solar, (iv) wind | % | |
| 29 | Percentage of non-renewable energy consumption | % | |
| 47 | Percentage of non-renewable energy consumption generated by the following sources: (i) natural gas, (ii) coal, (iii) other, fossil fuels | ||
| 15 | Total electric consumption | - | MJ |
| 43 | Total heating consumption | - | MJ |
| 44 | Total cooling consumption | - | MJ |
| 45 | Total steam consumption | - | MJ |
| Impact Category | Impact Category Indicator | Unit | Characterization Model | PEF/OEF | EPD |
|---|---|---|---|---|---|
| Climate change, total | Radiative forcing as global warming potential (GWP100) | kg CO2 eq. | Baseline model of 100 years of the IPCC (based on IPCC 2013)/GWP100, CML 2001 Baseline | X | X |
| Ozone depletion | depletion | kg CFC-11 eq. | Steady-state ODPs as in (WMO 2014 + integrations) | X | |
| Human toxicity, cancer | Comparative Toxic Unit for humans (CTUh) | CTUh | USEtox model 2.1 (Fankte et al., 2017) | X | |
| Human toxicity, non-cancer | Comparative Toxic Unit for humans (CTUh) | CTUh | USEtox model 2.1 (Fankte et al., 2017) | X | |
| Particulate matter | Impact on human health | disease incidence | PM method recommended by UNEP (UNEP 2016) | X | |
| Ionizing radiation, human health | Human exposure efficiency relative to U235 | kBq U235 eq. | Human health effect model as developed by Dreicer et al., 1995 (Frischknecht et al., 2000) | X | |
| Photochemical ozone formation, human health | Tropospheric ozone concentration increase | kg NMVOC eq. | LOTOS-EUROS model (Van Zelm et al., 2008) as implemented in ReCiPe 2008/POFP, LOTOS-EUROS as applied in ReCiPe 2008 | X | X |
| Acidification | Accumulated Exceedance (AE) | mol H + eq./kg PO43 eq. | Accumulated Exceedance (Seppälä et al. 2006, Posch et al., 2008)/AP, CML 2001 non-baseline (fate non included) | X | X |
| Eutrophication, terrestrial | Accumulated Exceedance (AE) | mol N eq. | Accumulated Exceedance (Seppälä et al. 2006, Posch et al., 2008) | X | |
| Eutrophication, freshwater | Fraction of nutrients reaching freshwater end compartment (P) | kg P eq. | EUTREND model (Struijs et al., 2009) as implemented in ReCiPe | X | |
| Eutrophication, marine | Fraction of nutrients reaching marine end compartment (N) | kg N eq. | EUTREND model (Struijs et al., 2009) as implemented in ReCiPe | X | |
| Ecotoxicity, freshwater | Comparative Toxic Unit for ecosystems (CTUe) | CTUe | USEtox model 2.1 (Fankte et al., 2017) | X | |
| Land use | Soil quality index Biotic production Erosion resistance Mechanical filtration Groundwater replenishment | Dimensionless (pt) kg biotic production kg soil m3 water m3 groundwater | Soil quality index based on LANCA (Beck et al., 2010 and Bos et al. 2016) | X | |
| Water use | User deprivation potential (deprivation-weighted water consumption) | m3 H2O eq. | Available Water Remaining (AWARE) as recommended by UNEP, 2016/AWARE Method: WULCA recommendations on characterization model for WSF 2015, 2017 | X | X |
| Resource use, minerals and metals | Abiotic resource depletion (ADP ultimate reserves) | kg Sb eq. | CML 2002 (Guinée et al., 2002) and van Oers et al. 2002/ADP elements, CLM 2001, baseline | X | X |
| Resource use, fossils | Abiotic resource depletion–fossil fuels (ADP-fossil) | MJ | CML 2002 (Guinée et al., 2002) and van Oers et al. 2002/ADP fossil fuels, CML 2001, baseline | X | X |
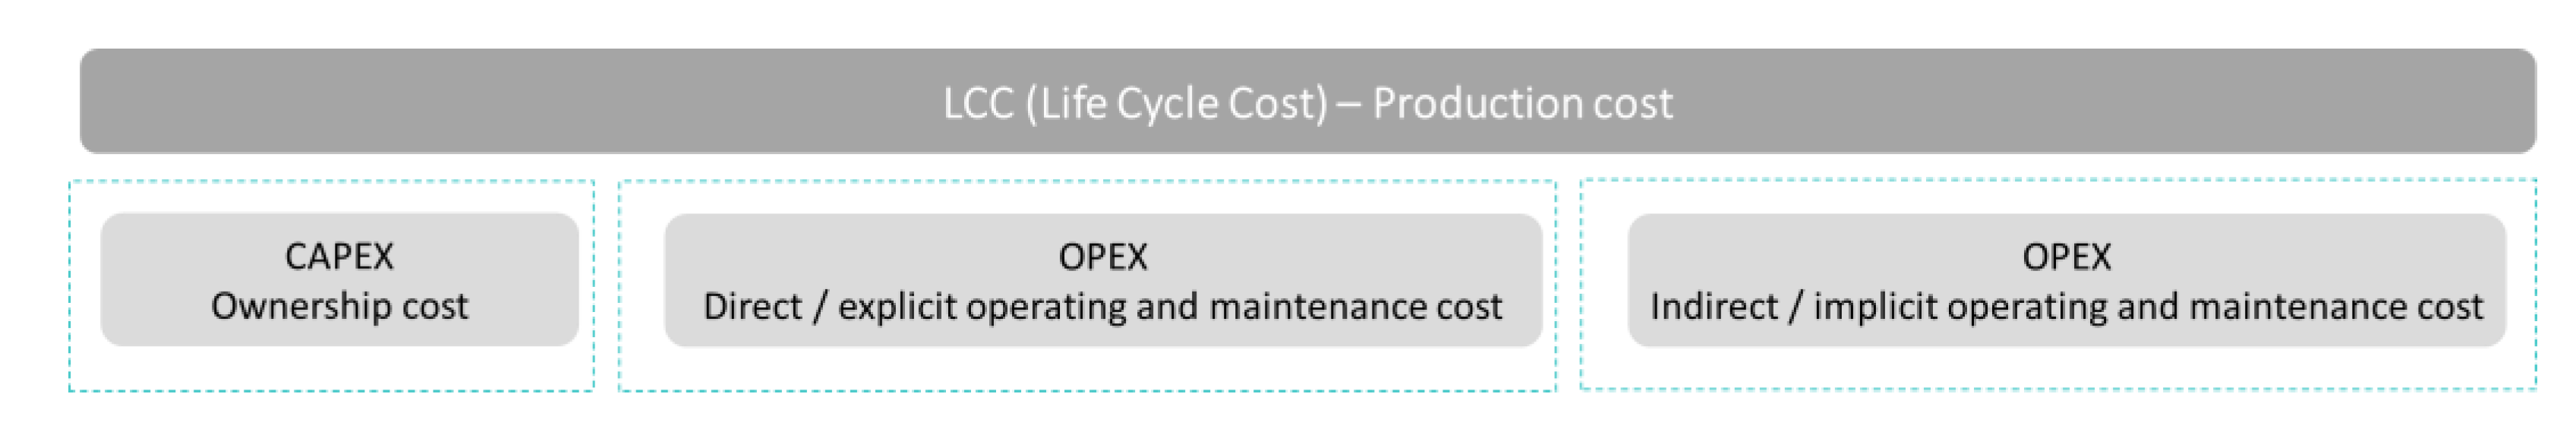
| CAPEX | Direct OPEX | Indirect OPEX |
|---|---|---|
| Depreciation/annualized investment cost for production assets (€/a). Major asset enhancements and replacements during lifetime (€). Asset retirement cost (€). Facilities capital cost. Miscellaneous ownership costs. | Material and component cost (€/a). Production personnel labor cost (€/a). Energy cost (€/a). Other consumables (€/a). Scheduled maintenance (€/a). Corrective maintenance (€/a). | Internal quality cost (€/a). Inventory cost (€/a). External quality cost (€/a). Human errors (€/a). |
| Nr | Indicator | Formula | Unit |
|---|---|---|---|
| 62 | Total waste generated | - | kg |
| 19 | Waste intensity | kg/nf | |
| 1 | Total emissions | - | kg |
| 20 | Emissions intensity | kg/nf | |
| 38 | Total material input | - | kg |
| 39 | Total material input intensity | kg/nf | |
| 49 | Total water intake | - | ML |
| 18 | Water intensity | ML/nf | |
| 52 | Total water discharge | - | ML |
| 34 | Total energy consumption | - | MJ |
| 14 | Energy intensity | MJ/nf | |
| 116 | Radioactive forcing as global warming potential (GWP100) | LCA methodology | kg CO2 eq. |
| 123 | Accumulated exceedance | LCA methodology | kg PO43 eq |
| 129 | User deprivation potential (deprivation-weighted water consumption) | LCA methodology | m3 H2O eq. |
| 122 | Tropospheric ozone concentration increase | LCA methodology | kg NMVOC eq. |
| 137 | Abiotic depletion potential—Elements | LCA methodology | kg Sb eq. |
| 138 | Abiotic depletion potential—Fossil fuels | LCA methodology | MJ |
| 150 | CAPEX | Ownership cost | € |
| 151 | OPEX | Direct/explicit operation and maintenance cost | € |
| 152 | OPEX | Indirect/implicit operation and maintenance cost | € |
Publisher’s Note: MDPI stays neutral with regard to jurisdictional claims in published maps and institutional affiliations. |
© 2022 by the authors. Licensee MDPI, Basel, Switzerland. This article is an open access article distributed under the terms and conditions of the Creative Commons Attribution (CC BY) license (https://creativecommons.org/licenses/by/4.0/).
Share and Cite
Barni, A.; Capuzzimati, C.; Fontana, A.; Pirotta, M.; Hänninen, S.; Räikkönen, M.; Uusitalo, T. Design of a Lifecycle-Oriented Environmental and Economic Indicators Framework for the Mechanical Manufacturing Industry. Sustainability 2022, 14, 2602. https://doi.org/10.3390/su14052602
Barni A, Capuzzimati C, Fontana A, Pirotta M, Hänninen S, Räikkönen M, Uusitalo T. Design of a Lifecycle-Oriented Environmental and Economic Indicators Framework for the Mechanical Manufacturing Industry. Sustainability. 2022; 14(5):2602. https://doi.org/10.3390/su14052602
Chicago/Turabian StyleBarni, Andrea, Claudio Capuzzimati, Alessandro Fontana, Marco Pirotta, Saara Hänninen, Minna Räikkönen, and Teuvo Uusitalo. 2022. "Design of a Lifecycle-Oriented Environmental and Economic Indicators Framework for the Mechanical Manufacturing Industry" Sustainability 14, no. 5: 2602. https://doi.org/10.3390/su14052602
APA StyleBarni, A., Capuzzimati, C., Fontana, A., Pirotta, M., Hänninen, S., Räikkönen, M., & Uusitalo, T. (2022). Design of a Lifecycle-Oriented Environmental and Economic Indicators Framework for the Mechanical Manufacturing Industry. Sustainability, 14(5), 2602. https://doi.org/10.3390/su14052602