Article

Evaluation of Resilience in Historic Urban Areas by Combining Multi-Criteria Decision-Making System and GIS, with Sustainability and Regeneration Approach: The Case Study of Tehran (IRAN)

by
Seyed Mohammad Haghighi Fard
* and
Naciye Doratli
Faculty of Architecture, Eastern Mediterranean University, Via Mersin 10, 99628 Famagusta, Turkey
*
Author to whom correspondence should be addressed.
Sustainability 2022, 14(5), 2495; https://doi.org/10.3390/su14052495
Submission received: 14 January 2022 / Revised: 12 February 2022 / Accepted: 17 February 2022 / Published: 22 February 2022

Abstract

:
Historic urban areas are the beating heart of the city, but neglecting them can lead to low resilience. Therefore, paying attention to their regeneration can create a sustainable city. The purpose of this study was to determine the resilience of neighborhoods in Tehran and evaluate effective criteria for the resilience increase. In this study, to evaluate the resilience of Tehran, initially, 18 criteria were considered. Then, using the Delphi technique, 14 criteria among them were selected for final analysis. Using the AHP multi-criteria decision-making method, the importance of each criterion was determined. Using GIS capabilities, the parameters map was prepared, and by combining the prepared maps with AHP weights, a resilience map was created. Finally, 20 neighborhoods with the lowest resilience were identified as priorities for stabilization and regeneration measures, and the criteria status used in them was examined. Results showed that deteriorated urban areas (19.53%) and construction materials (18.51%) were the most important criteria. Non-resilience areas were generally in the southern half of the city. 78% of 20 selected neighborhoods had deteriorated urban areas, while only 14% of the city deteriorated. Finally, by examining the criteria in neighborhoods with the lowest resilience, suggestions were made to regeneration, sustainability, and increase the resilience of these neighborhoods.

1. Introduction

Nowadays, urban resilience has become one of the most important topics due to the center of human accumulation in the city and the impact of resilience on urban areas [1,2,3,4]. The concept of resilience quickly found its place in the urban sustainability literature [5]. Urban resilience is often associated with the terms of sustainability, smart city, regeneration, etc. [6,7].
The word “resilience” is etymologically derived from the Latin word resilience, which means “to return, recoil” [8]. Resilience in the dictionary is the ability to return to the original state after a stressful and unusual situation [9]. The concept of resilience originates from ecology and refers to “a measure of the durability of systems and their ability to maintain stability in the face of change and turbulence and to maintain the same relationship between population or state variables” [10,11].
In recent scientific studies, ideas such as resilient communities, resilient livelihoods, and resilient community building have been widely used [12]. Since resilience is used in different fields, it has its own definitions in each scientific field. Some of these definitions include the definition in the environment [13], social sciences and the city [2], agricultural sciences and biology [14], engineering [15], and management [16]. However, one of the oldest and most complete definitions of resilience is to refer to resilience as “the ability of systems and their components to respond to internal or external disturbances which, after a recovery period, retain their essential characteristics” [17,18]. As Walker et al. stated [19], a resilient system is defined by two major characteristics: its ability to absorb changes and difficulties, as well as its ability to evolve, adjust, and endure while maintaining its fundamental structure and functions.
Urban regeneration is a comprehensive and integrated approach to solving urban problems in the region that is the goal of the operation, which ultimately leads to sustainable economic, physical, social, and environmental development [20]. It can be said that regeneration is a stage after determining resilience and in order to increase the resilience of areas with low resilience. Increasing attention to urban sustainability is affecting urban regeneration policy and performance [21]. Urban regeneration has been a sustainable theme in globalization and urbanization from developing to developed countries [22,23,24]. Nowadays, the term “urban regeneration” as a general term; includes other concepts such as revitalization, rehabilitation, reconstruction, and empowerment [25]. Social organizations use a combination of economic, environmental, cultural, and social activities to regenerate their communities sustainably [26]. Urban regeneration in traditional environments transforms the meanings embedded in social and cultural environments in these places [27].
The historic urban area is one of the main components of the urban system that takes care of social, economic, housing, transportation, security, and leisure needs, which, if not addressed, causes wear and inefficiency of this sector [28]. Historic urban areas, such as other types of cultural heritage, have significant values [29]. Built heritage has not only architectural and cultural value of construction but also cultural and anthropological cultural activities with their own characteristics [30,31]. The population of cities in developing countries is increasing every day [32], which makes it difficult to provide services to them [33,34]. Additionally, it causes the formation and continuation of an area of the city as a deteriorated urban area [35,36,37] which hinders a dynamic and continuous process of development in the city [38].
Disaster management and efforts to reduce risk in the historical areas are important for two reasons: (1) the value of historical heritage (2) and their economic and social role [39]. Damage causes inefficiency and physical deterioration of the city, which is a negative point [40,41]. In addition, historical regions have their own dynamics [42,43], so the revitalization of historical areas leads to the socio-economic development of these areas [29,44]. Residents of these buildings are from low-income and society disadvantaged groups who usually do not receive sufficient services and attention after a tragic event such as an earthquake [45].
Numerous studies have been conducted on urban resilience. Mahmodinia et al. [46] evaluated the resilience of the historical context of Yazd. They were using AHP measurement and layer composition in GIS to determine that the western and southern parts of Yazd city are in a bad situation of resilience. Rostami et al. [47] prepared resilience maps in GIS software by using Kendall’s W Ranks test in SPSS software and assigning appropriate weight to each of the indicators and has been analyzed. The results showed that the indicators of grading, age of buildings, quality of buildings, building structure, and permeability are effective in reducing the resilience of this area. In another study, Moaddab and Amini Hosseini [48] examined the indicators affecting the resilience of the historical parts of the city (with emphasis on old markets). By using the AHP method, it showed that: (1) The use of the building; (2) economic value of property and goods inside the shops; and (3) adaptability and dynamism of different groups for post-earthquake recovery are three important criteria in the resilience of old markets during an earthquake.
Historic urban areas are social-ecological systems, which are complex and adaptive to changing conditions. Throughout their evolution process, just like cities of which they are part, they can adapt and transform themselves without losing their essence, and after stages of crisis—a destructive incidence, such as a natural disaster, a war, an invasion, etc., they come back to an equilibrium, albeit a new one, which allows them to bounce back again. This evokes the concept of the adaptive cycle, which is a model with a focus of attention upon processes of destruction and reorganization and a crucial concept under the resilience theory. However, beyond the inherent scope and qualities of resilience, historic urban quarters are affected by specific vulnerabilities, in terms of different types and intensities of obsolescence, among which functional and locational ones can be considered as the most prominent, due to their negative impact on the performance of the area. Considering their inherent qualities as well as the vulnerabilities that historic urban quarters are faced with, their revitalization can be defined as an adaptation and transformation process. This brings the area to a new equilibrium, where the place assets are protected and the deterioration and decay are mitigated.
The concept of resilience is becoming increasingly important despite the many challenges that disrupt its implementation [49]. Nowadays, natural disasters and humanitarian actions are considered unpredictable urban threats [50]. Thus, improving the conditions of urban resilience infrastructure helps to recover the impacts inherent to disasters [50,51,52]. Urban resilience is a broad concept that encompasses all aspects of the city. The most fundamental issue in the discussion of resilience is the issue of regeneration of non-resilient areas. In this regard, considering that it is effective to determine the resilience of several criteria, it is necessary to use a multi-criteria decision-making system to determine the priority of each of the criteria. Finally, combining the results of this section with spatial information layers using the capability of GIS can provide a complete ranking of the resilience of urban areas and neighborhoods for regeneration. This research seeks to answer some basic questions: (1) What parameters are effective in determining the resilience of Tehran? (2) How important is each of the effective criteria in determining the resilient and non-resilient neighborhoods of Tehran? (3) Are the historical areas of the city resilient? (4) What is the status of effective criteria in resilient and non-resilient areas? Furthermore, according to the study of resilience in the historical context of Iranian cities, it was found that the historical areas of the cities in Iran are often non-resilient, so the hypothesis is formed that the historical areas of Tehran are not resilient. Therefore, this research seeks to answer this hypothesis.
One of the interesting areas of research can be the comparison of different methods and data to find the best method or data [53,54] (Rozenstein and Karnieli, 2011; Hashmi et al., 2019). Simultaneous use of data and conventional methods is also another part of the research [55,56] (Maleki et al., 2017; Alqurashi and Kumar, 2013), which are about the methods used in this research. The combination of these methods has been used for various applications [57,58,59] (Li et al., 2007; Kamali et al., 2017; Bagheri et al., 2021), as well as parts of these methods used in urban resilience research [60,61,62,63] (Banica et al., 2017; Ghajari et al., 2017; Zhang et al., 2019; Tayyab, 2021). Therefore, combining these methods to assess urban resilience can be an interesting topic. The purpose of this study is to rank the neighborhoods of Tehran in terms of resilience to determine the priority of regeneration using a combination of the Delphi and AHP methods and GIS capabilities.

2. The Study Area

Tehran is located in the southern slope of the Alborz Mountain range at 51° to 51° and 40 min east longitude and 35 degrees and 30 min to 35 degrees and 51 min north latitude [64,65]. Tehran is the capital of Iran with a population of more than ten million and is one of the largest cities in West Asia [66]. The city of Tehran consists of 22 districts and 376 neighborhoods. According to field surveys, the deteriorated urban areas are mostly in districts 10, 11, 12, and 17. On the other hand, districts 2, 5, 21, and 22 have the least deteriorated urban areas. (Figure 1) shows the study area.
In recent years, many studies have been conducted on Tehran resilience in various aspects, including Moghadas et al. [67], which focused on urban flood resilience and demonstrated that districts 6 and 22 were the most resilient and district 1 had the lowest resilience. Rezaei et al. [68] examined the resilience of Tehran from the perspective of the earthquake, with the Qeytariyeh neighborhood having the highest resilience and the Qala-e-Marghi neighborhood having the lowest. In addition, Azadeh [69] showed how improving the quality and efficiency of the rail transportation system affects the increase of resilience in Tehran. Finally, Lak et al. [70] demonstrated there is a negative correlation between neighborhood resilience and the number of coronary arteries.

3. Methodology

The research method of this study was analytical-descriptive, where the purpose was practical. The research stage included documentary and library research (further understanding of the subject, understanding of effective criteria, understanding of methods), field studies (understanding of the study area and communication with experts), and spatial (preparation of layers of spatial information and spatial processes).

3.1. Criteria Set

Preliminary criteria were determined by reviewing similar research and interviewing Iranian experts (due to the case study area in Iran). As aforementioned, resilience has many dimensions because it is used in different disciplines. However, the criteria were chosen to cover a significant range of urban resilience. Dimensions of urban resilience fall into five categories: physical, natural, economic, organizational, and social [71]. Based on these five dimensions of resilience and reviewing related research, eighteen criteria to determine the resilience of neighborhoods and areas of Tehran are presented in (Table 1).

3.2. Delphi Technique

Delphi is an iterative process for integrating expert consensus [90]. Delphi is a way to reach a consensus of group opinion based on the opinion of expert group members on a particular issue or problem [91]. The three main features of the Delphi technique are members’ anonymity for each other, receiving feedback, and iteration [92]. Using a single method for research in many studies reduces the efficiency of the final results and does not correspond to reality, and on the other hand, the combination of methods often improves the results. This is also true for combining multi-criteria and Delphi decision-making. The advantage of including the Delphi method with other MCDM methods is that it can initially reduce the number of indicators and decision time [93] (Wudhikarn, 2018). AHP analysis, without considering multiple methodologies (such as the simultaneous use of the Delphi approach and AHP analysis), can lead the research in the wrong direction [94] (Kim and Kumar, 2009).
In this study, the Delphi technique was used to determine the final criteria for the resilience of Tehran neighborhoods. Experts were asked to determine how important the criteria are in the discussion of resilience (in a range of seven from absolutely significant to absolutely insignificant). The criteria with the required score are then used in the final analysis (with a significance or score higher than 4). Questionnaire forms were provided to researchers who had similar research (as mentioned earlier in the criteria determination section, due to the case study in Iran, Iranian experts were used in this section). For the number of members participating in the Delphi panel in scientific research, different numbers have been used, such as 43 [95] (Iden et al., 2011), 441 [96] (Lindeman, 1975), and even 32,000. The research showed with the increase in the number of qualified experts; results are reduced [97] (Markmann et al., 2021). Due to the fact that in this study, only university experts in Iran who had similar research (making the available statistical population smaller) were used. There were 42 university experts that participated in the Delphi panel. Experts ranged in age from 25 to 65, with 24 men and 18 women. The information of the participants in the Delphi panel is presented in Table 2. Furthermore, the number of repetitions and feedback to obtain homogeneous results in this study was three times.

3.3. Analytic Hierarchy Process (AHP)
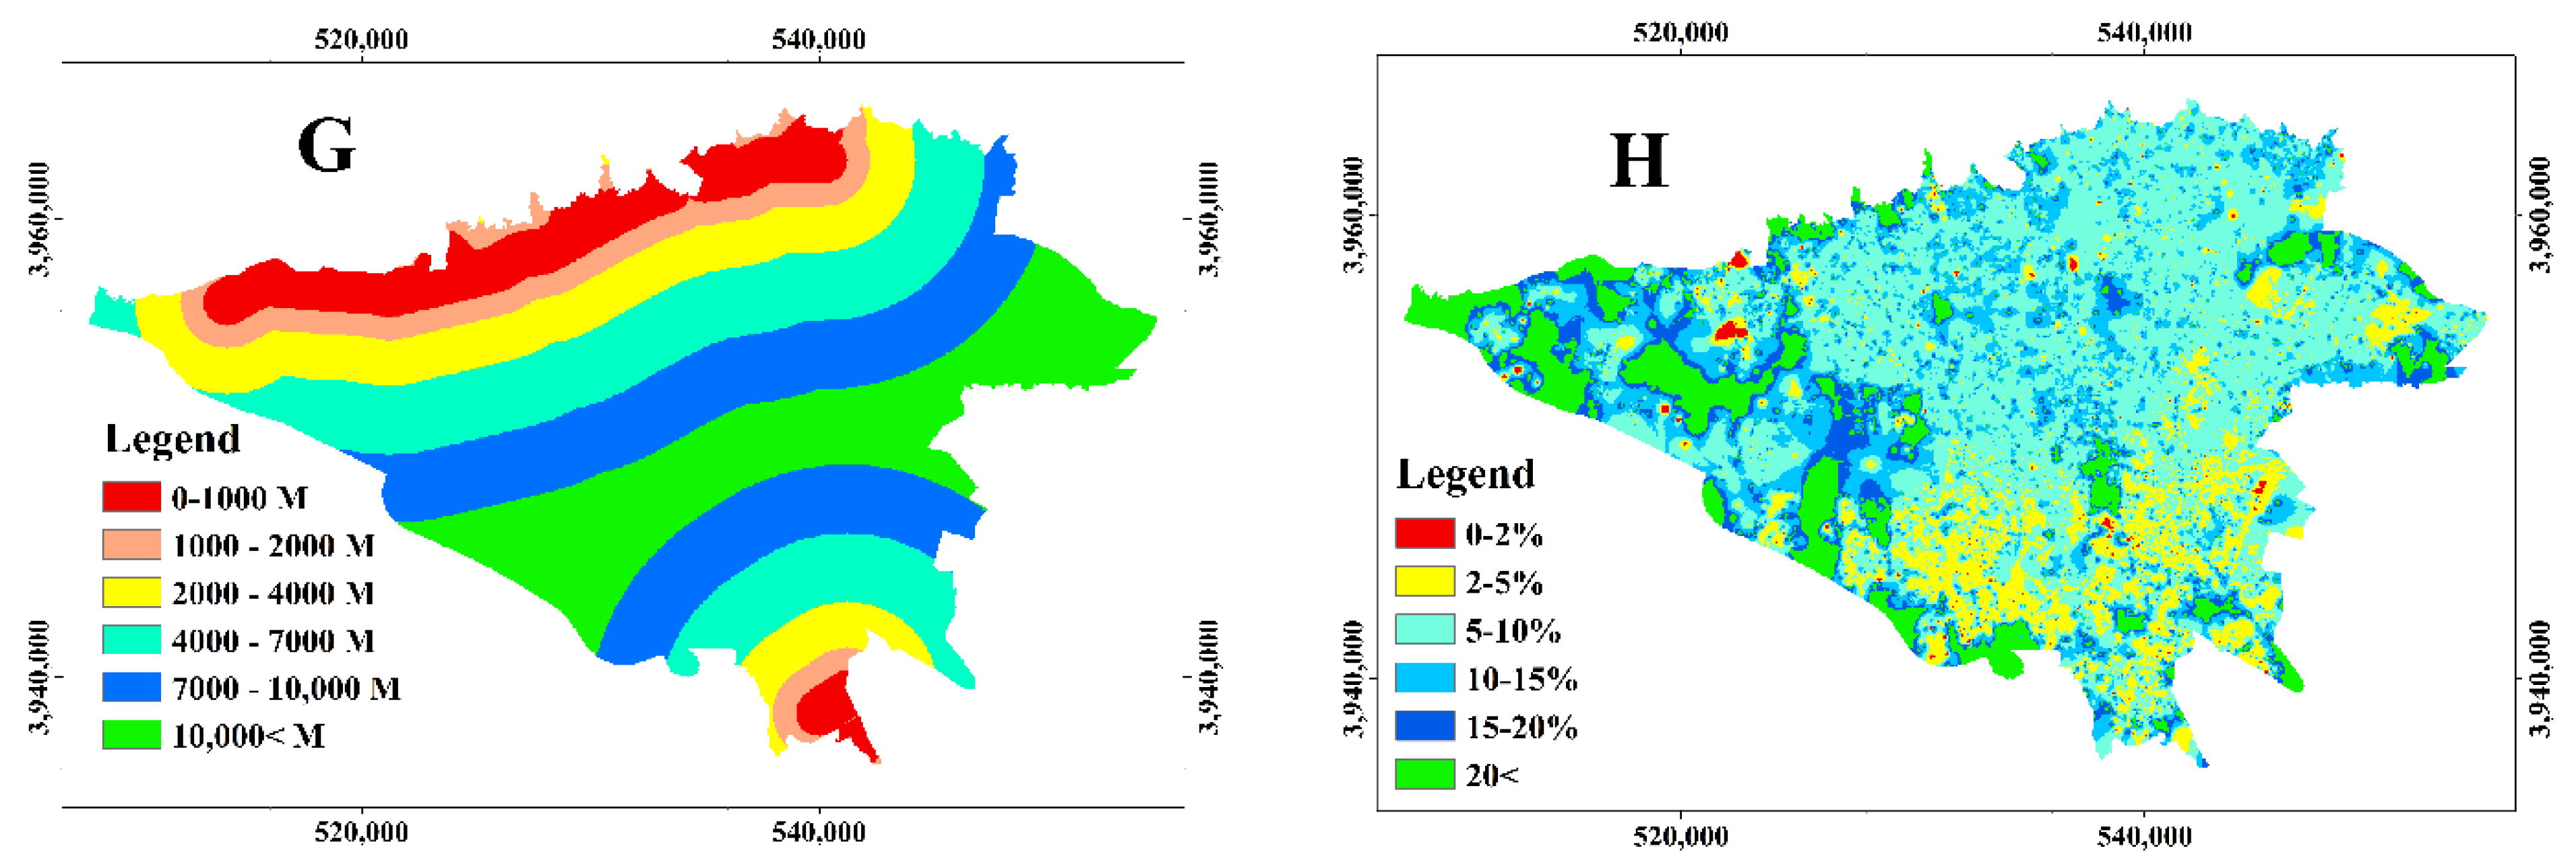
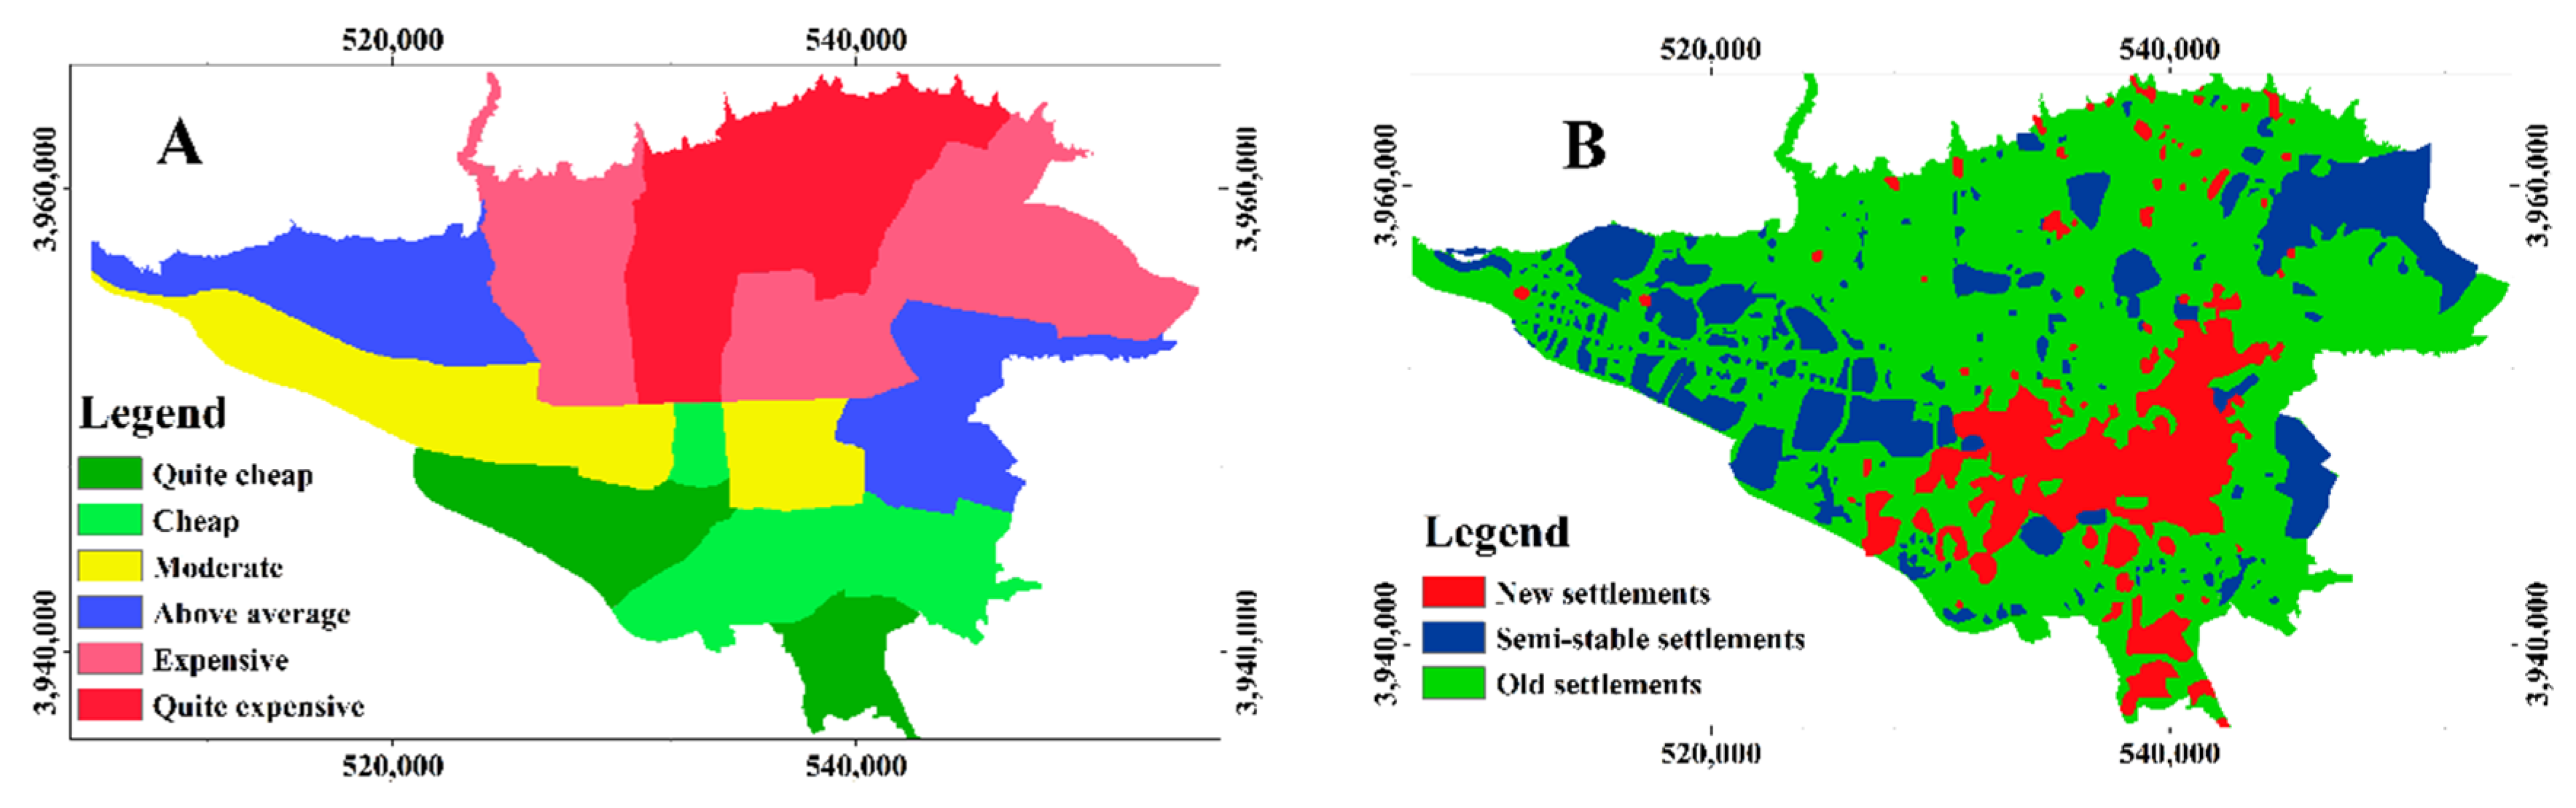
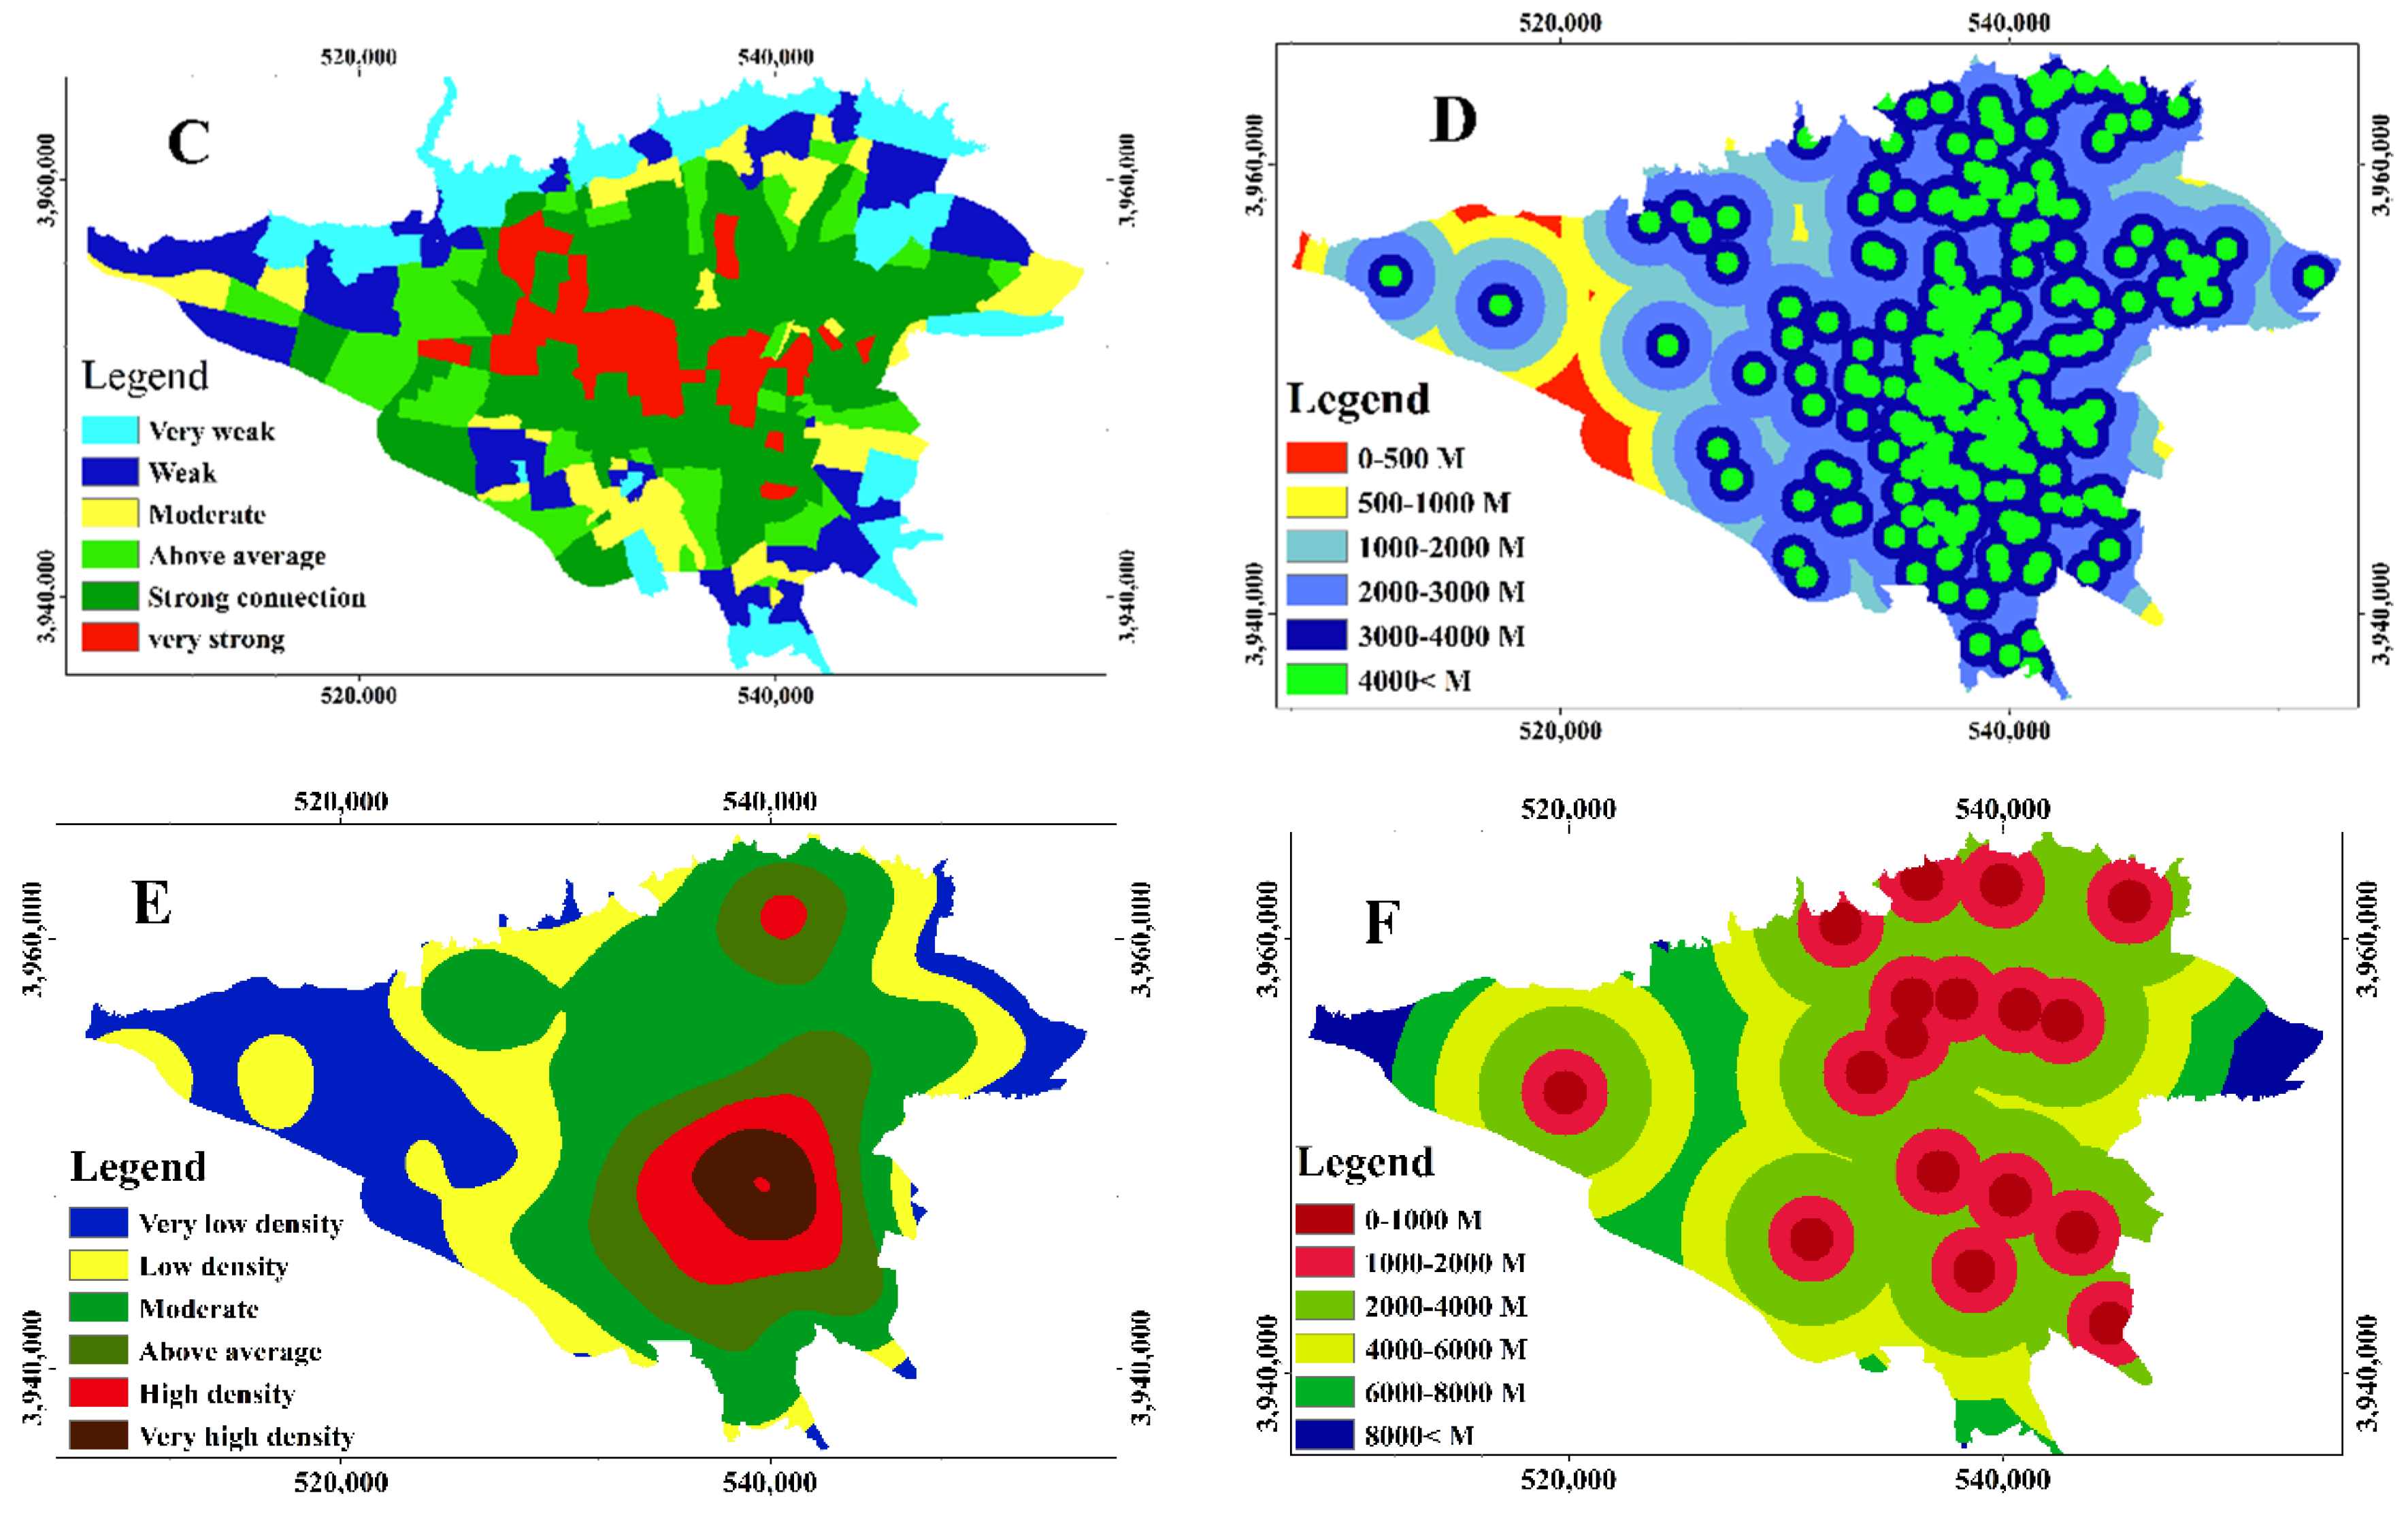
After identifying the criteria, a method is needed to integrate expert evaluations in order to find the best result [98]. A set of objects that are compared in pairs must be homogeneous. That is, the priority of the most important criterion should not be more than 9 times from the least important criterion [99]. The preference in this 9-point scale is presented in (Table 3) [100,101]. The number of AHP experts in scientific research is not specified [102,103,104] (Saaty, 1989; Saaty, 2008; Saaty a Shang, 2011). However, in a study with this statistical population, it was estimated between 3 and 200 people. This showed that if the number of experts exceeds 50, the amount of expertise will decrease, but in statistical populations (number of experts) with less than 50, experts should be specialized [105] (Tsyganok et al., 2012). Given that the experts in this study were experts who published research on resilience, 21 experts were used in the AHP department, which was different from the Delphi experts (the specialties matched, but the people were different). The age range of experts was between 25 and 65, which were 8 women and 13 men.
Duplex comparisons are performed in the form of a “pairwise comparison matrix” and that matrix is determinant by Equation (1).
A = [ A 11 A 12 A 1 n A 21 A 22 A 2 n A n 1 A n n ]
In the above matrix, the amount of preferences from xi to xj is set for 0 < aij. More precisely, according to Saaty’s theory, each array of the matrix represents the approximate ratio between two weights (Equation (2)).
Aijwi/wj   ∀
That is, if the arrays of the matrix represent exactly the ratio between the weights, the matrix A is in the form of Equation (3).
A = ( W i W j ) n n = [ W 1 / W 1 W 1 / W 2 W 1 / W n W 2 / W 1 W 2 / W 2 A 2 n W n / W 1 W n / W 2 A n n ]
Considering Equations (1) and (3) to the matrix, we arrive at Equation (4) so that aij = 1/aji and matrix A can be expressed in a simple and rewritten form below.
A = [ 1 A 12 A 1 n 1 / A 12 1 A 2 n 1 / A 1 n 1 / A 2 n 1 ]
Then, calculate the CI consistency index and CR consistency ratio using Formulas (5) and (6) to confirm the effectiveness of the A comparison matrix.
CI =   λ m a x n 1
CR = C I R I
where n is the number of matrix A, RI is the mean of the random index and can be determined by Table 4. If CR < 0.1, the comparison matrix meets the compatibility standard [106,107]. Comparisons are standard if the compatibility rate is 0.1 or less. The RI for a number of different criteria is presented in (Table 4).
The arithmetic mean method was used to calculate the weights [108]. The arithmetic mean is in accordance with Equation (7).
A = 1 n i = 0 n ai
where:
A = arithmetic mean
n = number of values
ai = data set values

3.4. Data Map

Spatial analysis requires spatial information. For this reason, in order to convert the spatial data of the criteria into spatial information, relevant analysis is required. These analyzes are common in some criteria and different in others. Table 5 summarizes the method of preparing spatial information for the criteria used. Note that in the case of the effectiveness, if it is a (+) in front of the criterion, that is, an increase in the amount of that criterion increases the productivity, but if it is a (−) sign, it means that the productivity rises by increasing the criterion. For example, the greater the distance from the fault, the greater the resilience, but the greater the distance from the fire station, the lower the resilience. Regarding land use and type of construction materials (−/+), resilience depends on the type of land use and the type of building materials.

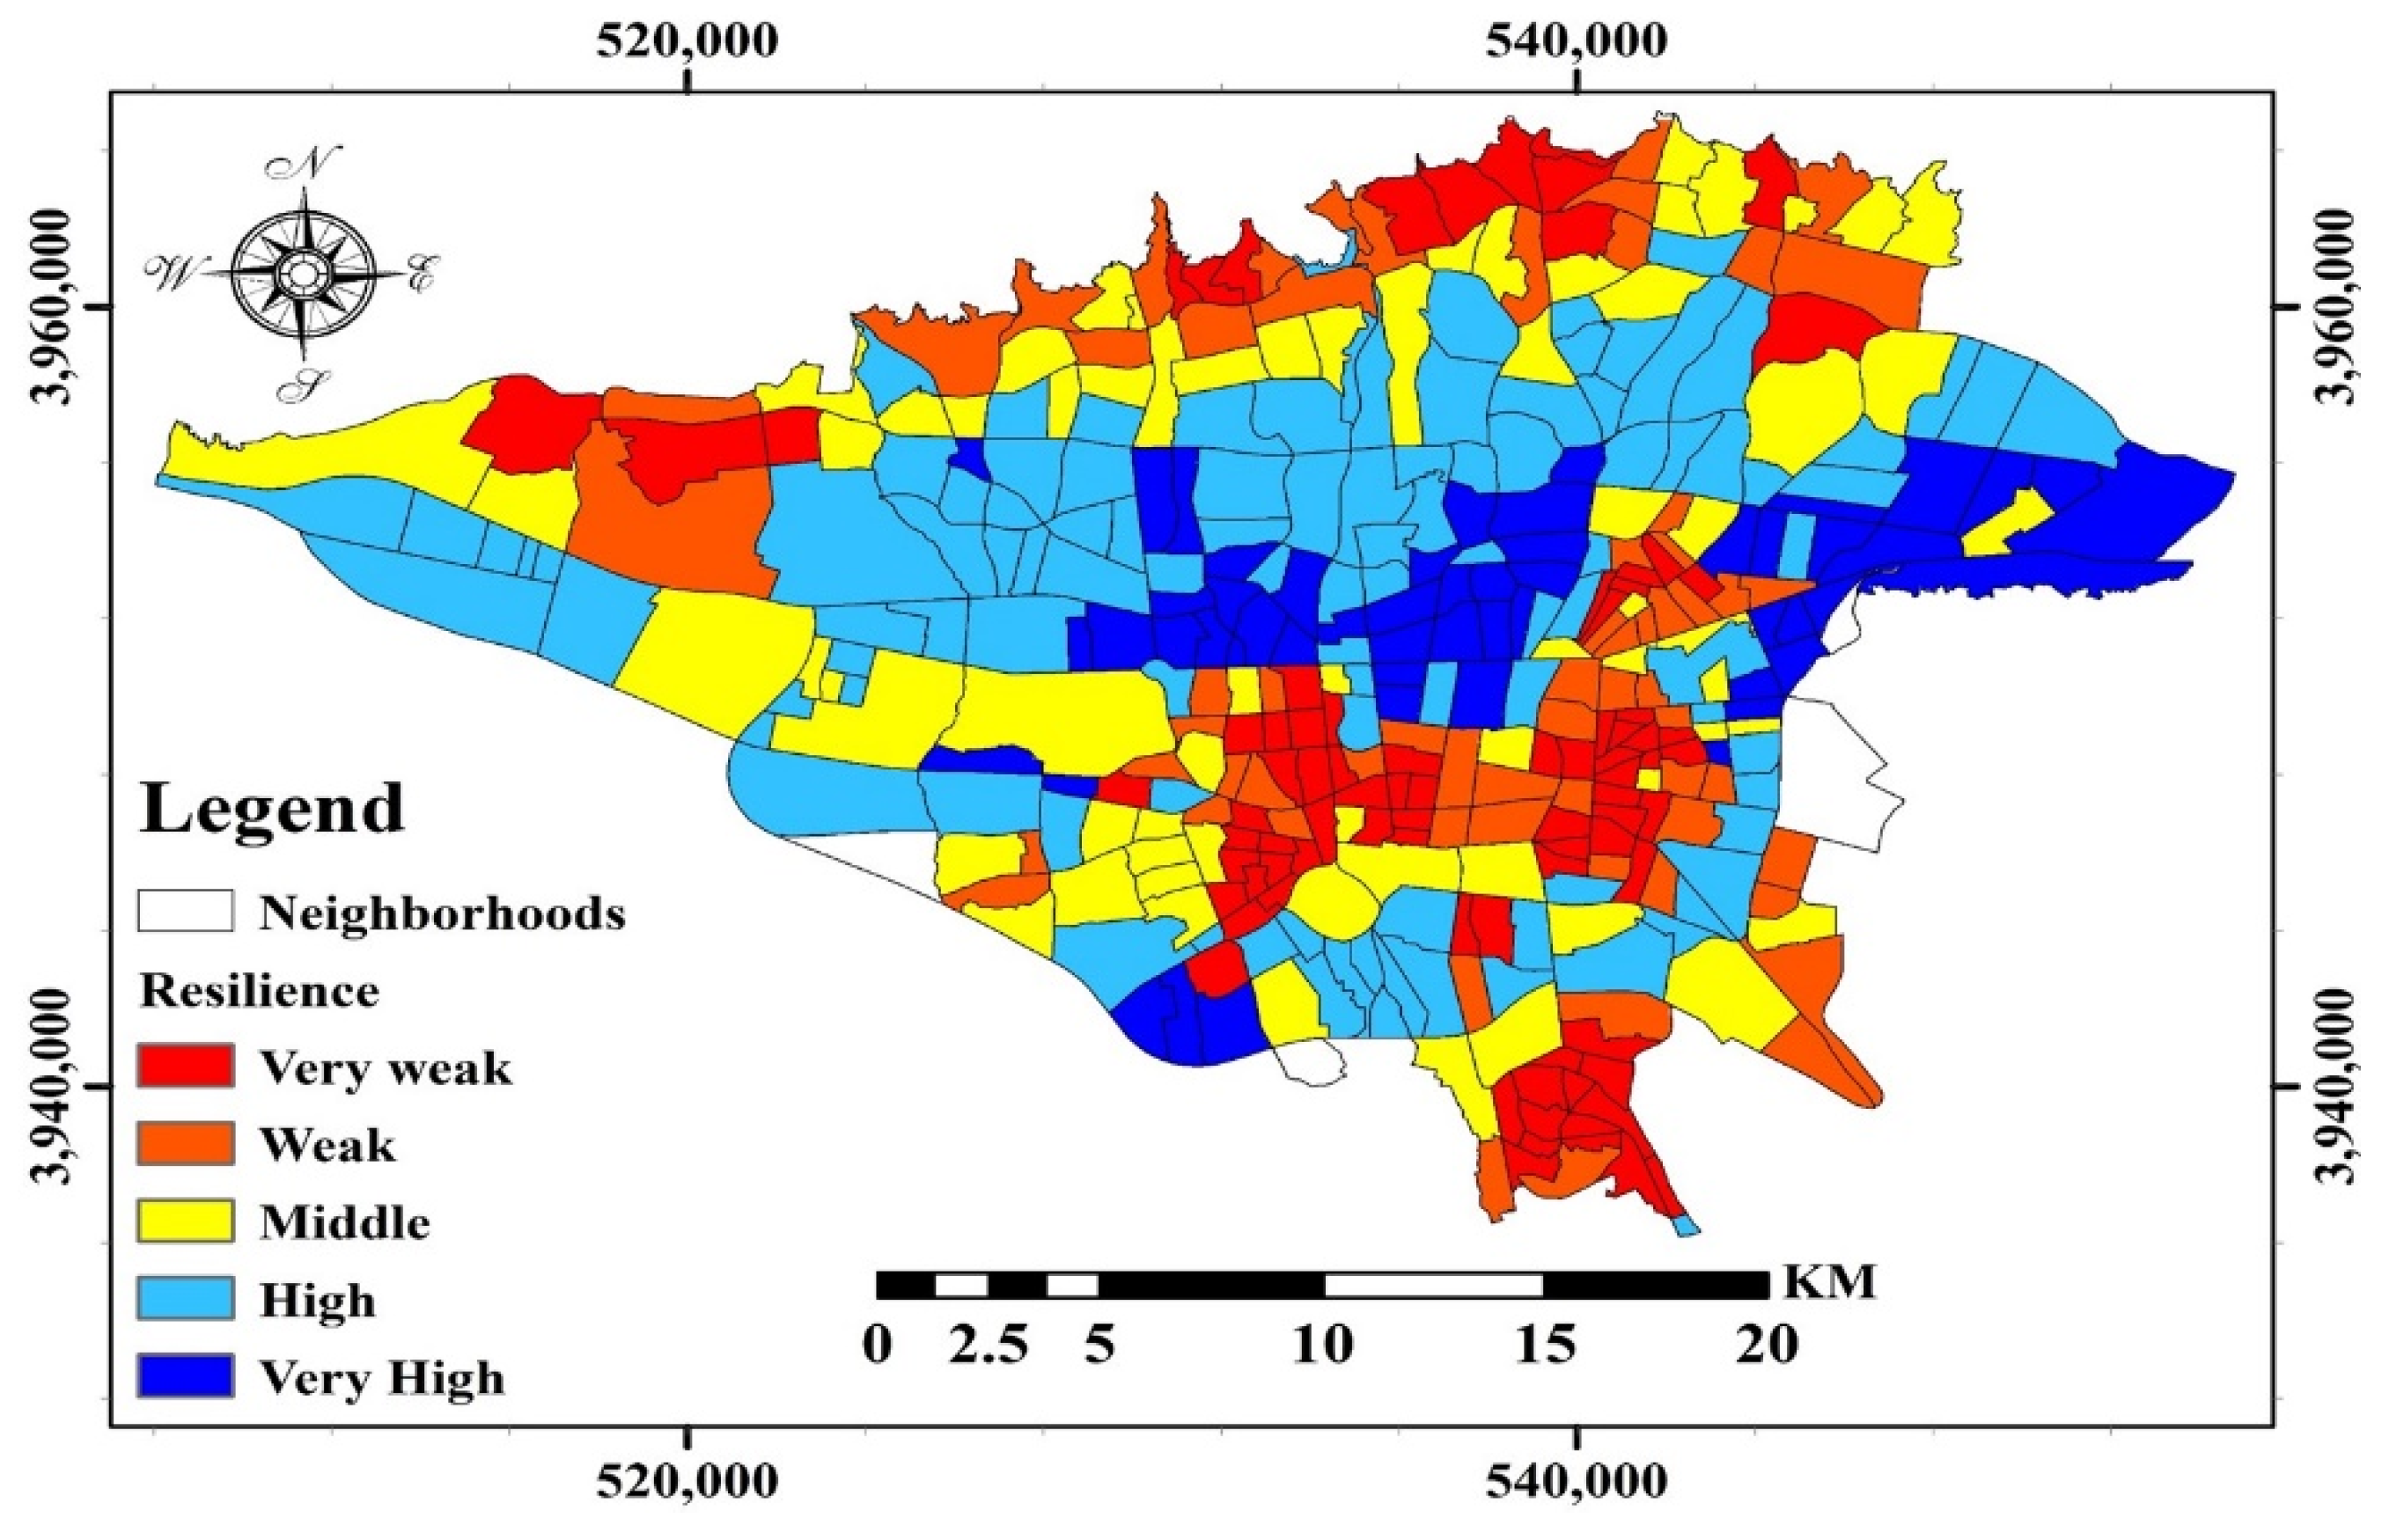
3.5. Resilience Map and Ranking of Neighborhoods and for Regeneration

In the final step, by combining the spatial reclassed layers with the weights determined by the AHP method, a weighted map of the criteria was created. The layers were reclassified according to how they affected resilience (Table 5). The Xu method was used for reclassification, which divides the layers into five classes using mean parameters and standard deviation [117] (Xu et al., 2011). The reclassification method of this method is presented in Table 6. By combining all the weighted layers, a resilience map was created. The weighted linear combination (WLC) method was used to combine the layers. The WLC is the most common technique in multi-criteria evaluation analysis. In this method, the weights obtained from AHP are multiplied in the parameter map, and finally, all the weighted layers are added together [118,119,120] (Rahmani et al., 2015; Aydi et al., 2016; Zarin et al., 2021). Finally, using spatial statistics analysis, the ranking of resilience was determined, and, consequently, the regeneration operation was prioritized. Spatial statistics information is such that according to the prepared resilience map, the average value of each neighborhood in GIS is calculated; the higher the average, the more resilience, and vice versa. The lower the resilience (lower average), the greater the priority of regeneration and vice versa. Figure 2 shows the methodology of the research method used in this research.

4. Results

In this section, the results obtained from the implementation of the method on the data will be presented. In the first step, the criteria that passed the Delphi technique filter will be presented. The results of this section will determine what the focus of the research is on the processing of which spatial data, based on which the resilience ranking is determined, and, consequently, the neighborhoods to be regeneration. The final criteria for passing the Delphi technique filter to be used in the final analysis are presented in Table 7.
According to Table 7, 14 final criteria were selected. According to the results obtained from the experts and the Delphi technique, the three criteria of land surface temperature, income level, and education level did not meet the required criteria compared to other criteria, and the criterion of street width was also excluded from the final analysis from the point of view of experts, due to the overlap with the criterion of Space Syntax. Then, 14 final criteria were entered into the AHP decision-making system. Table 8 is a pairwise comparison matrix of criteria that were compared according to experts.
Doing steps of the AHP method [121], the final weight of the criteria was determined, which is presented in Table 9. According to this table, the age of the building with a weight of 19.53% is the most important criterion, and then the quality of construction materials with 18.5% is in the second place. Furthermore, according to experts, green space per capita is the least important criterion.
To investigate the validity of the results, the CR value should be calculated, which should be less than 0.1. First, the amount of CI should be calculated, which was equal to CI = 0.141795. Then, considering that 14 criteria were used, and RI is equal to 1.57 for 14 criteria, by dividing the CI by RI, we have CR = 0.090315. Given that CR is less than 0.1, the matrix is compatible.
In the next step, the criteria map was prepared according to the methods and data mentioned above, which are shown in Figure 3 and Figure 4.
The population density map (a) in six floors shows that the density is in the residential blocks, which according to the map, the population density is higher in the west and the city center. The building materials map shows that more than half of the city has good building materials (70–90% of the blocks have durable building materials). Furthermore, a large part of the city has very good building materials, with only some parts in the center of the city where less than 50% of the blocks have suitable building materials. The household density map is also very much in line with the population density map. Green space per capita shows that about 70% of the city has a green space per capita of 0 to 3 m, and a large part of the city in the center towards the outskirts of the city has a green space per capita of 0 to 1 m. In the west of the city, green space per capita reaches its highest level.
The city center to the north is often land use used for residential purposes, and the outskirts of the city are often used for mixed uses (residential-commercial, residential-industrial, etc.) or other uses such as industrial, commercial, tourism. In the city center, towards the outskirts (except the West), the sex ratio is in favor of men, but the sex ratio in the West indicates a greater number of women. In general, according to statistical data, the population of men in Tehran is more than women. The distance from the fault is shown in the six classes. According to the map, the distance from the fault is north and south of the city at a distance of less than 1000 m. The further north and south we move towards the center, the greater the distance from the fault. The population ratio map (population ratio of 0–14 people and people over 65 years to the total population) shows that most of the city level is covered by 5–10%, but the western margin is more than 20%.
Figure 4 shows the final section of the criteria map. The housing price map shows the north and south of the city show the two poles of wealth and poverty, so the term north of the city is known as a symbol of wealth and south of the city as a symbol of poverty in Tehran. The deteriorated urban areas (historic urban areas) map of Tehran shows that the deteriorated urban areas of the city are mainly in the center of Tehran and tend to the south, and there are scattered blocks in the northern part of the city. Space syntax is more in the center of the city (sloping to the west), and the closer to the outskirts of the city, the weaker the communication of the space syntax becomes. The distribution of medical spaces in the center is much higher than in other places, and the educational spaces in the west of the city are much less than in the east of the city. The situation and density of educational uses are very similar to the distribution of medical spaces, and there are more educational spaces in the center and south of the city, and east of Tehran has much more educational spaces than the west. Fire centers are also scattered in the west of Tehran, but like educational and medical spaces, it is not very crowded only in the central part, and there are many fire centers in the south, as well as in the north of the city.
In the next step, the layers were reclassified based on the importance of intrinsic values and the importance of the intrinsic value of layers in recycling. The reclassified data layers are then obtained by multiplying the weighted data layers by the AHP method by calculating the weights. Finally, the weighted layers were combined, and a flexibility map was obtained. Figure 5 shows the resilience map of Tehran based on the criteria used.
Tehran’s resilience map shows that non-resilience neighborhoods are often concentrated in three areas: (a) South of the city, (b) all over the north of the city (from northeast to the northwest), and (c) the southern part of the city center. In opposite, the resilient areas are often in two areas: (a) northern part of the city center (b) eastern zone. According to the results obtained in the resilience map, it is clear that the number of non-resilient and unstable neighborhoods is much higher than resilient neighborhoods. The proximity of unstable areas to non-resilience areas creates the problem that by making negative changes in one or more criteria, these areas also increase the sum of non-resilience areas. Looking at the resilience map of Tehran in Figure 5 and comparing it with the map of deteriorated areas, or in other words, the map of the age of the building, Figure 4B shows that there is a great deal of correspondence between these two maps. The more detailed investigation shows that the vicinity of unstable areas with these neighborhoods will make more deteriorated and unlivable urban areas in the coming years if the extensive renovation is not formed.
Table 10 demonstrates the ranking of 20 neighborhoods with the highest resilience and 20 neighborhoods with the lowest resilience. According to this table, the neighborhoods of Iranshahr, Valiasr Square, the University of Tehran, Ghaem Magham-Sanai, and Ismailabad are the five neighborhoods with the highest resilience. On the other hand, Sartakht, Valiabad, Jalili, Dilman, and Shahid Ghayuri neighborhoods were the five neighborhoods with the lowest resilience, respectively. This table shows the 20 neighborhoods with the lowest resilience; this includes priorities for the regeneration process (from 357 to 376).
The point to be noted is that the status of criteria in neighborhoods that have low resilience and need to be rehabilitated should be determined and compared with the general situation of the city to determine the roadmap for regeneration and increased resilience. (Table 11) shows the status of the criteria used throughout the city and the 20 neighborhoods with the lowest resilience.
Table 11 shows that in terms of deteriorated urban areas (C1), there is a huge difference between the whole city and 20 neighborhoods in need of regeneration. More than 78 percent of non-resilience neighborhoods are deteriorated urban areas, compared with less than 15 percent for the city as a whole. In terms of population density, there is not much difference between the city (249) and the selected areas (291). Regarding the average distance from the fault, the average distance from the fault in the whole city is 2.2 km less than the selected areas. The parameter that has the most difference is the age ratio. The sensitive population (less than 15 years and more than 65 years) in selected areas is about 13 times. Regarding the other parameters, the space syntax in the city is 1.5 times better than the areas in need of regeneration. The building materials reported were 85% of the whole city, and 68% of the selected areas had good quality materials. The average property price on a scale of 22 (number of areas of Tehran) is about 10 for the whole city and 18.67 for selected areas (1 was the highest price and 22 was the lowest price). The per capita green space in the whole city is about five times that of the selected areas, and for the land use criterion, 39% of the whole city has residential use (residential only), which is 51% for the selected areas. The selected areas were in a better position than the city in the two parameters of sex ratio and distance to medical centers. For the remaining criteria, there is not much difference between the two areas, although the situation of 20 selected neighborhoods in these criteria is also worse than the average of the whole city.

5. Conclusions

Nowadays, cities are known as the largest place of human community and also the most attractive place to attract a population. For this reason, cities and their living conditions have attracted the attention of many researchers. These studies include: urban quality of life [122,123], urban growth [124,125], urban crime [126,127], urban economy [128,129], and urban climate [130,131]. If we consider all the criteria together, we will reach resilience, sustainability, and urban regeneration.
The aim of this study was to investigate the resilience of Tehran and consequently prioritize neighborhoods in terms of sustainability and regeneration. The Delphi technique helped identify and screen the most effective criteria. This technique helps to avoid reviewing and processing criteria that have a significant impact on the goal, which saves time and money spent on projects and research. The use of the Delphi technique caused the four criteria of income level, education level, street width, and land surface temperature, which had lower priority compared to other parameters, not to be considered in the final analysis.
The results of the AHP analysis on the data showed that the most important criterion in the resilience of Tehran was first the building age and then the building materials. This indicates that in the discussion of regeneration of non-resilience neighborhoods, the historic urban areas should be regenerated first, and during the regeneration process, high-quality construction materials should be utilized so that the neighborhoods achieve an acceptable level of resilience and sustainability. On the other hand, green space per capita, sex composition, and age composition had the least impact. One solution to increase per capita green space in areas where extensive change is not possible in the city can be the use of green roofs [132]. However, even if the other two factors had high effects, it was very difficult to make spatial changes in these two factors. Among the 14 criteria used, the distance from the fault does not change at all, and then the sex composition and age composition, which is very difficult to make spatial changes in these parameters. Regarding the other criteria, the changes are more or less applicable.
The final results revealed that if we divide the city into two parts, north and south, all 20 neighborhoods with the lowest resilience were located in the south of the city. This is evident in the beliefs and even the discourse of the citizens, who consider the south of the city as a symbol of poverty, low quality of life, lack of urban health, and low citizenship rights, and the opposite is true for the north of the city [133]. More interestingly, all 20 neighborhoods had the highest priority for regeneration in the deteriorated areas of the city, which shows the importance of regeneration in the historic urban areas.
The final analysis of the criteria in Table 9 showed that 78% of the buildings in the 20 non-resilience neighborhoods had deteriorated urban areas while being only 14% for the city buildings (of which 20 selected neighborhoods are part). The criterion that had the most difference was the age ratio, where the sensitive age group in non-resilience neighborhoods was about 13 times the whole city. This often stems from the birth rate in slums and their turning into Child labor. The status of the criteria is determined according to Table 9. However, the point to be noted, given the large difference in property prices in the north and south of the city, is that the government can adjust this criterion by enacting laws and structures, and by adjusting this criterion, we will see a change in some other criteria, such as age and sex ratio.
Finally, some suggestions can be made as a roadmap for future research. One of these suggestions is to re-measure the resilience status by changing the number of criteria, in other words, increasing or decreasing the criteria. Another suggestion for research is that by improving the criteria of non-resilience neighborhoods and performing re-analysis, changes in their degree of resilience can be measured. The results of this research can help managers to know how much change in what parameters can create a sustainable city. Furthermore, by using other multi-criteria decision-making methods and matching its results with this research, higher levels of reliability can be achieved.

Author Contributions

Conceptualization, S.M.H.F. and N.D.; methodology, S.M.H.F.; software, S.M.H.F.; validation, S.M.H.F.; formal analysis, S.M.H.F.; investigation, S.M.H.F.; resources, S.M.H.F.; data curation, S.M.H.F.; writing—original draft preparation, S.M.H.F.; writing—review and editing, N.D.; visualization, S.M.H.F.; supervision, N.D.; project administration, S.M.H.F. and N.D.; funding acquisition, S.M.H.F. All authors have read and agreed to the published version of the manuscript.

Funding

This research received no external funding.

Institutional Review Board Statement

Not applicable.

Informed Consent Statement

Not applicable.

Data Availability Statement

Not applicable.

Conflicts of Interest

The authors declare no conflict of interest.

References

  1. Leichenko, R. Climate change and urban resilience. Curr. Opin. Environ. Sustain. 2011, 3, 164–168. [Google Scholar] [CrossRef]
  2. Meerow, S.; Newell, J.P.; Stults, M. Defining urban resilience: A review. Landsc. Urban Plan. 2016, 147, 38–49. [Google Scholar] [CrossRef]
  3. Leitner, H.; Sheppard, E.; Webber, S.; Colven, E. Globalizing urban resilience. Urban Geogr. 2018, 39, 1276–1284. [Google Scholar] [CrossRef]
  4. Glaeser, E.L. Urban resilience. Urban Stud. 2022, 59, 3–35. [Google Scholar] [CrossRef]
  5. Sharifi, A.; Yamagata, Y. Resilient urban planning: Major principles and criteria. Energy Procedia 2014, 61, 1491–1495. [Google Scholar] [CrossRef] [Green Version]
  6. Lopez, L.J.R.; Castro, A.I.G. Sustainability and resilience in smart city planning: A Review. Sustainability 2021, 13, 181. [Google Scholar] [CrossRef]
  7. Feliciotti, A.; Romice, O.; Porta, S. Urban regeneration, masterplans, and resilience: The case of Gorbals, Glasgow. Urban Morphol. 2017, 21, 61–79. [Google Scholar]
  8. Garcia-Dia, M.J.; DiNapoli, J.M.; Garcia-Ona, L.; Jakubowski, R.; O’Flaherty, D. Concept analysis: Resilience. Arch. Psychiatr. Nurs. 2013, 27, 264–270. [Google Scholar] [CrossRef]
  9. Merriam-Webster Dictionary. Available online: https://www.merriam-webster.com/dictionary/resilience#:~:text=1%20%3A%20the%20ability%20to%20become,%2C%20pressed%2C%20bent%2C%20etc (accessed on 7 January 2022).
  10. Sennett, R.A. Building and Dwelling: Ethics for the City; Farrar, Straus and Giroux: New York, NY, USA, 2018. [Google Scholar]
  11. Abastante, F.; Lami, I.M.; La Riccia, L.; Gaballo, M. Supporting Resilient Urban Planning through Walkability Assessment. Sustainability 2020, 12, 8131. [Google Scholar] [CrossRef]
  12. Manyena, S.B. The concept of resilience revisited. Disasters 2006, 30, 433–450. [Google Scholar] [CrossRef]
  13. McPhearson, T.; Andersson, E.; Elmqvist, T.; Frantzeskaki, N. Resilience of and through urban ecosystem services. Ecosyst. Serv. 2015, 12, 152–156. [Google Scholar] [CrossRef]
  14. Mehmood, A. Of resilient places: Planning for urban resilience. Eur. Plan. Stud. 2016, 24, 407–419. [Google Scholar] [CrossRef] [Green Version]
  15. Spaans, M.; Waterhout, B. Building up resilience in cities worldwide–Rotterdam as participant in the 100 Resilient Cities Programme. Cities 2017, 61, 109–116. [Google Scholar] [CrossRef] [Green Version]
  16. Kammouh, O.; Noori, A.Z.; Taurino, V.; Mahin, S.A.; Cimellaro, G.P. Deterministic and Fuzzy-Based Methods to Evaluate Community Resilience Based on The Peoples Framework. Earthq. Eng. Eng. Vib. 2018, 17, 261–275. [Google Scholar] [CrossRef]
  17. Knaapen, A.M.; Seiler, F.; Schilderman, P.A.; Nehls, P.; Bruch, J.; Schins, R.P.; Borm, P.J. Neutrophils cause oxidative DNA damage in alveolar epithelial cells. Free. Radic. Biol. Med. 1999, 27, 234–240. [Google Scholar] [CrossRef]
  18. Dimelli, D. Planning resilient cities: The case of Chania. UPLanD-J. Urban Plan. Landsc. Environ. Des. 2020, 5, 65–76. [Google Scholar]
  19. Walker, B.; Gunderson, L.; Kinzig, A.; Folke, C.; Carpenter, S.; Schultz, L. A handful of heuristics and some propositions for understanding resilience in social-ecological systems. Ecol. Soc. 2006, 11, 13. [Google Scholar] [CrossRef]
  20. Roberts, P.; Sykes, H. (Eds) Urban Regeneration: A Handbook; Sage: New York, NY, USA, 1999. [Google Scholar]
  21. Korkmaz, C.; Balaban, O. Sustainability of urban regeneration in Turkey: Assessing the performance of the North Ankara Urban Regeneration Project. Habitat Int. 2020, 95, 102081. [Google Scholar] [CrossRef]
  22. Barnett, J. The Elusive City: Five Centuries of Design, Ambition and Miscalculation; HarperCollins Publishers: New York, NY, USA, 1986. [Google Scholar]
  23. Li, X.; Hui, E.C.; Chen, T.; Lang, W.; Guo, Y. From Habitat III to the new urbanization agenda in China: Seeing through the practices of the “three old renewals” in Guangzhou. Land Use Policy 2019, 81, 513–522. [Google Scholar] [CrossRef]
  24. Li, X.; Zhang, F.; Hui, E.C.M.; Lang, W. Collaborative workshop and community participation: A new approach to urban regeneration in China. Cities 2020, 102, 102743. [Google Scholar] [CrossRef]
  25. Izadi, M.S.; Moshaver, M.K.; Sajjadzadeh, H.; Tavassoli, M. Locating urban catalyst projects in inefficient urban textures with the regeneration approach: A case study on Tehran. J. Hist. Cult. Art Res. 2018, 7, 136–151. [Google Scholar] [CrossRef]
  26. Bailey, N. The role, organisation and contribution of community enterprise to urban regeneration policy in the UK. Prog. Plan. 2012, 77, 1–35. [Google Scholar] [CrossRef]
  27. Ujang, N.; Zakariya, K. The notion of place, place meaning and identity in urban regeneration. Procedia-Soc. Behav. Sci. 2015, 170, 709–717. [Google Scholar] [CrossRef] [Green Version]
  28. Sarvar, H. Identification worn-out urban textures based on the physical parameters Case Study: Region One Tabriz city. Sustain. City 2019, 2, 1–14. [Google Scholar]
  29. Najd, M.D.; Ismail, N.A.; Maulan, S.; Yunos, M.Y.M.; Niya, M.D. Visual preference dimensions of historic urban areas: The determinants for urban heritage conservation. Habitat Int. 2015, 49, 115–125. [Google Scholar] [CrossRef]
  30. Ortega, A.E. Multiscale Information Management for Historic Districts’ Energy Retrofitting: A Framework, a Methodology, a Model. Ph.D. Thesis, Universitat Politècnica de Catalunya, Barcelona, Spain, 2015. [Google Scholar]
  31. Egusquiza, A.; Ginestet, S.; Espada, J.C.; Flores-Abascal, I.; Garcia-Gafaro, C.; Giraldo-Soto, C.; Escadeillas, G. Co-creation of local eco-rehabilitation strategies for energy improvement of historic urban areas. Renew. Sustain. Energy Rev. 2021, 135, 110332. [Google Scholar] [CrossRef]
  32. Sekkat, K. Urban concentration and poverty in developing countries. Growth Change 2017, 48, 435–458. [Google Scholar] [CrossRef] [Green Version]
  33. Ghasemi, K.; Hamzenejad, M.; Meshkini, A. The spatial analysis of the livability of 22 districts of Tehran Metropolis using multi-criteria decision-making approaches. Sustain. Cities Soc. 2018, 38, 382–404. [Google Scholar] [CrossRef]
  34. Ghasemi, K.; Hamzenejad, M.; Meshkini, A. An analysis of the spatial distribution pattern of social-cultural services and their equitable physical organization using the TOPSIS technique: The case-study of Tehran, Iran. Sustain. Cities Soc. 2019, 51, 101708. [Google Scholar] [CrossRef]
  35. Rahnama, M.R.; Naderi, R.A.; Zafaranlo, A. Organizing the old urban texture by SWOT method (The case study: Naderi Hill in Shirvan). Indian J. Fundam. Appl. Life Sci. 2014, 4, 466–479. [Google Scholar]
  36. Amini, M.; Saremi, H.; Ghalibaf, M. The role of urban governance in the urban worn texture regeneration process, case study: District 12 of Tehran. Geogr. Res. Q. J. 2018, 33, 202–217. [Google Scholar] [CrossRef] [Green Version]
  37. Sarvari, H.; Mehrabi, A.; Chan, D.W.; Cristofaro, M. Evaluating urban housing development patterns in developing countries: Case study of Worn-out Urban Fabrics in Iran. Sustain. Cities Soc. 2021, 70, 102941. [Google Scholar] [CrossRef]
  38. Alipour-Nakhi, A.; Ahmari, N.; Rezaei, S. Renovation and rehabilitation strategies for worn-out texture of Ab-Anbar-no District in Sari using SWOT technique. Open J. Geol. 2016, 6, 270. [Google Scholar] [CrossRef] [Green Version]
  39. Granda, S.; Ferreira, T.M. Assessing vulnerability and fire risk in old urban areas: Application to the historical centre of Guimaraes. Fire Technol. 2019, 55, 105–127. [Google Scholar] [CrossRef]
  40. Nikookar, M.; Ahmadi, N. Analysis of the performance characteristics of Borujerd worn-out textures using SWOT. Cumhur. Üniversitesi Edeb. Fakültesi Bilimleri Derg. 2015, 36, 4035–4048. [Google Scholar]
  41. Samiei, A.; Sayafzadeh, A. Analysis of the worn-out tissues characteristics and providing of intervention pattern, case study: Eslamshahr city, Tehran. Curr. Urban Stud. 2016, 4, 267. [Google Scholar] [CrossRef] [Green Version]
  42. Tiesdell, S.; Heath, T.; Oc, T. Revitalising Historic Urban Quarters; Routledge: Oxfordshire, UK, 2013. [Google Scholar]
  43. Doratli, N.; Hoskara, S.O.; Fasli, M. An analytical methodology for revitalization strategies in historic urban quarters: A case study of the Walled City of Nicosia, North Cyprus. Cities 2004, 21, 329–348. [Google Scholar] [CrossRef]
  44. Rodwell, D. Conservation: Background. In Conservation and Sustainability in Historic Cities; Blackwell Publishing: Chennai, India; Singapore, 2007; pp. 1–22. [Google Scholar]
  45. Sadeghi, J.; Oghabi, M.; Sarvari, H.; Sabeti, M.S.; Kashefi, H.; Chan, D. Identification and Prioritization of Seismic Risks in Urban Worn-Out Textures Using Fuzzy Delphi Method. Environ. Eng. Manag. J. (EEMJ) 2021, 20, 1035–1046. [Google Scholar]
  46. Mahmodinia, M.; Sarami, H.; Ramesht, M.-H.; Taghvae, M. Evaluation of Resilience of Historical Texture to Natural Hazards (Earthquake) (Case Study: Yazd City). Q. J. Hum. Geogr. 2021, 13, 638–654. (In Persian) [Google Scholar]
  47. Rostami, M.H.; Tebiyan, S.Z.; Khandan, M. Resilience Analysis of Historical Regions in Shiraz using Geographic Information System (GIS). J. Shahr-E-Tabavar 2020, 2, 53–66. (In Persian) [Google Scholar]
  48. Moaddab, R.; Hosseini, K.A. An investigation on effective dimensions and indicators in measuring resilience of historic-commercial urban fabrics against earthquake with a special view to traditional Bazaars. Environ. Manag. Hazards 2020, 7, 265–280. (In Persian) [Google Scholar]
  49. Serre, D.; Barroca, B.; Balsells, M.; Becue, V. Contributing to urban resilience to floods with neighbourhood design: The case of Am Sandtorkai/Dalmannkai in Hamburg. J. Flood Risk Manag. 2018, 11, 69–83. [Google Scholar] [CrossRef]
  50. Ribeiro, P.J.G.; Gonçalves, L.A.P.J. Urban resilience: A conceptual framework. Sustain. Cities Soc. 2019, 50, 101625. [Google Scholar] [CrossRef]
  51. Jabareen, Y. The risk city resilience trajectory. In The Risk City; Springer: Dordrecht, The Netherlands, 2015; pp. 137–159. [Google Scholar]
  52. Rose, A. Resilience, and sustainability in the face of disasters. Environ. Innov. Soc. Transit. 2011, 1, 96–100. [Google Scholar] [CrossRef]
  53. Rozenstein, O.; Karnieli, A. Comparison of methods for land-use classification incorporating remote sensing and GIS inputs. Appl. Geogr. 2011, 31, 533–544. [Google Scholar] [CrossRef]
  54. Hashmi, S.; Maleki, M.; Jomezade, B.; Hazeh, S.; Bagheri, K. Potential Evaluation of SMA and NSMA Methods Implementation to Extract Sub-pixel Impervious Surfaces from Landsat 8 Imagery (OLI), (Case Study: Sari). Geogr. Thought 2019, 10, 115–138. [Google Scholar]
  55. Maleki, M.; Tavakkolisabour, S.M.; Arjmand, B.; Rahmati, M. Simultaneous Analysis of Radar Look Angel and Placement of Features to Identification of Terrain Feature (Mianrahan Basin in West of Iran). Int. J. Landsc. Plan. Archit. 2017, 3, 1–10. [Google Scholar]
  56. Alqurashi, A.; Kumar, L. Investigating the use of remote sensing and GIS techniques to detect land use and land cover change: A review. Adv. Remote Sens. 2013, 2, 193–204. [Google Scholar] [CrossRef] [Green Version]
  57. Li, Z.W.; Zeng, G.M.; Zhang, H.; Yang, B.; Jiao, S. The integrated eco-environment assessment of the red soil hilly region based on GIS—A case study in Changsha City, China. Ecol. Model. 2007, 202, 540–546. [Google Scholar] [CrossRef]
  58. Kamali, M.; Alesheikh, A.A.; Borazjani, S.A.; Jahanshahi, A.; Khodaparast, Z.; Khalaj, M. Delphi-AHP and weighted index overlay-GIS approaches for industrial site selection case study: Large extractive industrial units in Iran. J. Settl. Spat. Plan. 2017, 8, 99–105. [Google Scholar] [CrossRef]
  59. Bagheri, M.; Ibrahim, Z.Z.; Mansor, S.; Manaf, L.A.; Akhir, M.F.; Talaat, W.I.A.W.; Pour, A.B. Land-Use Suitability Assessment Using Delphi and Analytical Hierarchy Process (D-AHP) Hybrid Model for Coastal City Management: Kuala Terengganu, Peninsular Malaysia. ISPRS Int. J. Geo-Inf. 2021, 10, 621. [Google Scholar] [CrossRef]
  60. Banica, A.; Rosu, L.; Muntele, I.; Grozavu, A. Towards urban resilience: A multi-criteria analysis of seismic vulnerability in Iasi City (Romania). Sustainability 2017, 9, 270. [Google Scholar] [CrossRef] [Green Version]
  61. Ghajari, Y.E.; Alesheikh, A.A.; Modiri, M.; Hosnavi, R.; Abbasi, M. Spatial modelling of urban physical vulnerability to explosion hazards using GIS and fuzzy MCDA. Sustainability 2017, 9, 1274. [Google Scholar] [CrossRef] [Green Version]
  62. Zhang, X.; Song, J.; Peng, J.; Wu, J. Landslides-oriented urban disaster resilience assessment—A case study in ShenZhen, China. Sci. Total Environ. 2019, 661, 95–106. [Google Scholar] [CrossRef]
  63. Tayyab, M.; Zhang, J.; Hussain, M.; Ullah, S.; Liu, X.; Khan, S.N.; Al-Shaibah, B. GIS-Based Urban Flood Resilience Assessment Using Urban Flood Resilience Model: A Case Study of Peshawar City, Khyber Pakhtunkhwa, Pakistan. Remote Sens. 2021, 13, 1864. [Google Scholar] [CrossRef]
  64. Hosseini, A.; Pourahmad, A.; Pajoohan, M. Assessment of institutions in sustainable urban-management effects on sustainable development of Tehran: Learning from a developing country. J. Urban Plan. Dev. 2016, 142, 05015009. [Google Scholar] [CrossRef]
  65. Bokaie, M.; Zarkesh, M.K.; Arasteh, P.D.; Hosseini, A. Assessment of urban heat island based on the relationship between land surface temperature and land use/land cover in Tehran. Sustain. Cities Soc. 2016, 23, 94–104. [Google Scholar] [CrossRef]
  66. Nojedehi, P.; Heidari, M.; Ataei, A.; Nedaei, M.; Kurdestani, E. Environmental assessment of energy production from landfill gas plants by using Long-range Energy Alternative Planning (LEAP) and IPCC methane estimation methods: A case study of Tehran. Sustain. Energy Technol. Assess. 2016, 16, 33–42. [Google Scholar] [CrossRef]
  67. Moghadas, M.; Asadzadeh, A.; Vafeidis, A.; Fekete, A.; Kötter, T. A multi-criteria approach for assessing urban flood resilience in Tehran, Iran. Int. J. Disaster Risk Reduct. 2019, 35, 101069. [Google Scholar] [CrossRef]
  68. Rezaei, M.R.; Rafieian, M.; Hosseini, S.M. Measurement, and evaluation of physical resilience of urban communities against earthquake (Case study: Tehran neighborhoods). Hum. Geogr. Res. 2015, 47, 609–623. [Google Scholar]
  69. Azadeh, A.; Salehi, V.; Kianpour, M. Performance evaluation of rail transportation systems by considering resilience engineering factors: Tehran railway electrification system. Transp. Lett. 2018, 10, 12–25. [Google Scholar] [CrossRef]
  70. Lak, A.; Hakimian, P.; Sharifi, A. An evaluative model for assessing pandemic resilience at the neighborhood level: The case of Tehran. Sustain. Cities Soc. 2021, 75, 103410. [Google Scholar] [CrossRef] [PubMed]
  71. Ostadtaghizadeh, A.; Ardalan, A.; Paton, D.; Jabbari, H.; Khankeh, H.R. Community disaster resilience: A systematic review on assessment models and tools. PLoS Curr. 2015, 7, 423–468. [Google Scholar] [CrossRef] [PubMed]
  72. Wardekker, J.A.; de Jong, A.; Knoop, J.M.; van der Sluijs, J.P.J.T.F.; Change, S. Operationalizing a resilience approach to adapting an urban delta to uncertain climate changes. Technol. Forecast. Soc. Chang 2010, 77, 987–998. [Google Scholar] [CrossRef] [Green Version]
  73. Ahern, J. From fail-safe to safe-to-fail: Sustainability and resilience in the new urban world. Landsc. Urban Plan. 2011, 100, 341–343. [Google Scholar] [CrossRef] [Green Version]
  74. Liao, K.H. A theory on urban resilience to floods—A basis for alternative planning practices. Ecol. Soc. 2012, 17, 48. [Google Scholar] [CrossRef]
  75. Dhar, T.K.; Khirfan, L. A multi-scale and multi-dimensional framework for enhancing the resilience of urban form to climate change. Urban Clim. 2017, 19, 72–91. [Google Scholar] [CrossRef]
  76. Wallace, D.; Wallace, R. Urban systems during disasters: Factors for resilience. Ecol. Soc. 2008, 13, 18. [Google Scholar] [CrossRef] [Green Version]
  77. Pelling, M.; Manuel-Navarrete, D. From resilience to transformation: The adaptive cycle in two Mexican urban centers. Ecol. Soc. 2011, 16, 11. [Google Scholar] [CrossRef] [Green Version]
  78. Brown, A.; Dayal, A.; Rumbaitis Del Rio, C. From practice to theory: Emerging lessons from Asia for building urban climate change resilience. Environ. Urban. 2012, 24, 531–556. [Google Scholar] [CrossRef] [Green Version]
  79. Bilal, M.; Nichol, J.E.; Bleiweiss, M.P.; Dubois, D. A Simplified high resolution MODIS Aerosol Retrieval Algorithm (SARA) for use over mixed surfaces. Remote Sens. Environ. 2013, 136, 135–145. [Google Scholar] [CrossRef]
  80. Jiménez-Muñoz, J.C.; Sobrino, J.A.; Skoković, D.; Mattar, C.; Cristóbal, J. Land surface temperature retrieval methods from Landsat-8 thermal infrared sensor data. IEEE Geosci. Remote Sens. Lett. 2014, 11, 1840–1843. [Google Scholar] [CrossRef]
  81. Stanvliet, R.; Parnell, S. The contribution of the UNESCO biosphere reserve concept to urban resilience. Manag. Environ. Qual. Int. J. 2006, 17, 437–449. [Google Scholar] [CrossRef]
  82. Pierce, J.C.; Budd, W.W.; Lovrich Jr, N.P. Resilience and sustainability in US urban areas. Environ. Politics 2011, 20, 566–584. [Google Scholar] [CrossRef]
  83. Toubin, M.; Laganier, R.; Diab, Y.; Serre, D. Improving the conditions for urban resilience through collaborative learning of Parisian urban services. J. Urban Plan. Dev. 2015, 141, 05014021. [Google Scholar] [CrossRef]
  84. Boix, R.; Rausell, P.; Abeledo, R. The Calatrava model: Reflections on resilience and urban plasticity. Eur. Plan. Stud. 2017, 25, 29–47. [Google Scholar] [CrossRef]
  85. Suárez-Orozco, C.; Motti-Stefanidi, F.; Marks, A.; Katsiaficas, D. An integrative risk and resilience model for understanding the adaptation of immigrant-origin children and youth. Am. Psychol. 2018, 73, 781. [Google Scholar] [CrossRef]
  86. Vallance, S.A. Urban resilience: Bouncing back, coping, thriving. In Proceedings of the Australian and New Zealand Disaster and Emergency Management Conference, Brisbane, Australia, 16–18 April 2012. [Google Scholar]
  87. Friend, R.; Moench, M. What is the purpose of urban climate resilience? Implications for addressing poverty and vulnerability. Urban Clim. 2013, 6, 98–113. [Google Scholar] [CrossRef]
  88. Galderisi, A. Urban Resilience: A framework for empowering cities in face of heterogeneous risk factors. A|Z ITU J. Fac. Archit. 2014, 11, 36–58. [Google Scholar]
  89. Ziervogel, G.; Pelling, M.; Cartwright, A.; Chu, E.; Deshpande, T.; Harris, L.; Zweig, P. Inserting rights and justice into urban resilience: A focus on everyday risk. Environ. Urban. 2017, 29, 123–138. [Google Scholar] [CrossRef] [Green Version]
  90. Friend, R.; Jarvie, J.; Reed, S.O.; Sutarto, R.; Thinphanga, P.; Toan, V.C. Mainstreaming urban climate resilience into policy and planning; reflections from Asia. Urban Clim. 2014, 7, 6–19. [Google Scholar] [CrossRef]
  91. Lynn, M.R.; Layman, E.L.; Englebardt, S.P. Nursing administration research priorities: A national Delphi study. JONA J. Nurs. Adm. 1998, 28, 7–11. [Google Scholar] [CrossRef] [PubMed]
  92. Hsu, C.C.; Sandford, B.A. The Delphi technique: Making sense of consensus. Pract. Assess. Res. Eval. 2007, 12, 10. [Google Scholar]
  93. Wudhikarn, R. Improving the intellectual capital management approach using the hybrid decision method. J. Intellect. Cap. 2018, 19, 670–691. [Google Scholar] [CrossRef]
  94. Kim, D.Y.; Kumar, V. A framework for prioritization of intellectual capital indicators in R&D. J. Intellect. Cap. 2009, 10, 277–293. [Google Scholar]
  95. Iden, J.; Tessem, B.; Päivärinta, T. Problems in the interplay of development and IT operations in system development projects: A Delphi study of Norwegian IT experts. Inf. Softw. Technol. 2011, 53, 394–406. [Google Scholar] [CrossRef]
  96. Lindeman, C.A. Delphi survey of priorities in clinical nursing research. Nurs. Res. 1975, 24, 434–441. [Google Scholar] [CrossRef]
  97. Markmann, C.; Spickermann, A.; von der Gracht, H.A.; Brem, A. Improving the question formulation in Delphi-like surveys: Analysis of the effects of abstract language and amount of information on response behavior. Futures Foresight Sci. 2021, 3, e56. [Google Scholar] [CrossRef]
  98. Taleb Pour, A.; Bastaminezhad, M. Iran’s development model design by using Delphi method. J. Econ. Dev. Sociol. 2020, 9, 253–283. (In Persian) [Google Scholar]
  99. Deng, X.; Hu, Y.; Deng, Y.; Mahadevan, S. Supplier selection using AHP methodology extended by D numbers. Expert Syst. Appl. 2014, 41, 156–167. [Google Scholar] [CrossRef]
  100. Saaty, T.L. Decision making—The analytic hierarchy and network processes (AHP/ANP). J. Syst. Sci. Syst. Eng. 2004, 13, 1–35. [Google Scholar] [CrossRef]
  101. Al-Harbi, K.M.A.S. Application of the AHP in project management. Int. J. Proj. Manag. 2001, 19, 19–27. [Google Scholar] [CrossRef]
  102. Saaty, T.L. Group decision making and the AHP. In The Analytic Hierarchy Process; Springer: Berlin/Heidelberg, Germany, 1989; pp. 59–67. [Google Scholar]
  103. Saaty, T.L. Decision making with the analytic hierarchy process. Int. J. Serv. Sci. 2008, 1, 83–98. [Google Scholar] [CrossRef] [Green Version]
  104. Saaty, T.L.; Shang, J.S. An innovative orders-of-magnitude approach to AHP-based mutli-criteria decision making: Prioritizing divergent intangible humane acts. Eur. J. Oper. Res. 2011, 214, 703–715. [Google Scholar] [CrossRef]
  105. Tsyganok, V.V.; Kadenko, S.V.; Andriichuk, O.V. Significance of expert competence consideration in group decision making using AHP. Int. J. Prod. Res. 2012, 50, 4785–4792. [Google Scholar] [CrossRef]
  106. Maleki, M.; Rahmati, M.; Sadidi, J.; Babaee, E. Landslide risk zonation using AHP method and GIS in Malaverd catchment, Kermanshah, Iran. In Proceedings of the International Conference on Geospatial Information Research (GI Research 2014), Tehran, Iran, 15–17 November 2014; pp. 15–17. [Google Scholar]
  107. Han, Y.; Wang, Z.; Lu, X.; Hu, B. Application of AHP to road selection. ISPRS Int. J. Geo-Inf. 2020, 9, 86. [Google Scholar] [CrossRef] [Green Version]
  108. Coffey, L.; Claudio, D. In defense of group fuzzy AHP: A comparison of group fuzzy AHP and group AHP with confidence intervals. Expert Syst. Appl. 2021, 178, 114970. [Google Scholar] [CrossRef]
  109. Li, R.; Richmond, P.; Roehner, B.M. Effect of population density on epidemics. A: Statistical Mechanics and its Applications. Physica 2018, 510, 713–724. [Google Scholar] [CrossRef] [Green Version]
  110. Klee, P. The Core of GIScience: A Process-Based Approach; ITC: Enschede, The Netherlands, 2011. [Google Scholar]
  111. Węglarczyk, S. Kernel Density Estimation and its Application. In ITM Web of Conferences, Proceedings of the XLVIII Seminar of Applied Mathematics 2018, Boguszow-Gorce, Poland, 9–11 September 2018; EDP Sciences: Les Ulis, France, 2018; Volume 23, p. 37. [Google Scholar]
  112. Maalouf, W.E.; Mincheva, M.N.; Campbell, B.K.; Hardy, I.C. Effects of assisted reproductive technologies on human sex ratio at birth. Fertil. Steril. 2014, 101, 1321–1325. [Google Scholar] [CrossRef]
  113. Klarqvist, B. A space syntax glossary. Nord. J. Archit. Res. 2015, 6, 11–12. [Google Scholar]
  114. Badiu, D.L.; Iojă, C.I.; Pătroescu, M.; Breuste, J.; Artmann, M.; Niță, M.R.; Onose, D.A. Is urban green space per capita a valuable target to achieve cities’ sustainability goals? Romania as a case study. Ecol. Indic. 2016, 70, 53–66. [Google Scholar] [CrossRef]
  115. Noyes, J.; Hannes, K.; Booth, A.; Harris, J.; Harden, A.; Popay, J.; Pantoja, T. Qualitative Research and Cochrane Reviews; Wiley-Blackwell Publishers: Hoboken, NJ, USA, 2015. [Google Scholar]
  116. Poot, J.; Pawar, S. Is demography destiny? Urban population change and economic vitality of future cities. J. Urban Manag. 2013, 2, 5–23. [Google Scholar] [CrossRef]
  117. Xu, H.; Chen, Y.; Dan, S.; Qiu, W. Spatial and temporal analysis of urban heat Island effects in Chengdu City by remote sensing. In Proceedings of the 2011 19th International Conference on Geoinformatics IEEE, Shanghai, China, 24–26 June 2011; pp. 1–5. [Google Scholar]
  118. Rahmani, S.; Fahimi, F.; Haeri, S. Comparison and assessment of AHP and WLC methods for locating Bojnord’s Solid Wast (Sample City: Bojnurd). J. North Khorasan Univ. Med. Sci. 2015, 6, 769–778. [Google Scholar] [CrossRef] [Green Version]
  119. Aydi, A.; Abichou, T.; Nasr, I.H.; Louati, M.; Zairi, M. Assessment of land suitability for olive mill wastewater disposal site selection by integrating fuzzy logic, AHP, and WLC in a GIS. Environ. Monit. Assess. 2016, 188, 1–13. [Google Scholar] [CrossRef] [PubMed]
  120. Zarin, R.; Azmat, M.; Naqvi, S.R.; Saddique, Q.; Ullah, S. Landfill site selection by integrating fuzzy logic, AHP, and WLC method based on multi-criteria decision analysis. Environ. Sci. Pollut. Res. 2021, 28, 19726–19741. [Google Scholar] [CrossRef] [PubMed]
  121. Hämmerling, M.; Kocięcka, J.; Zaborowski, S. AHP as a Useful Tool in the Assessment of the Technical Condition of Hydro technical Constructions. Sustainability 2021, 13, 1304. [Google Scholar] [CrossRef]
  122. Biagi, B.; Ladu, M.G.; Meleddu, M. Urban quality of life and capabilities: An experimental study. Ecol. Econ. 2018, 150, 137–152. [Google Scholar] [CrossRef]
  123. Dadashpoor, H.; Khalighi, N. Investigating spatial distribution of regional quality of life (RQoL) in Iran between 1996 and 2011. Soc. Indic. Res. 2016, 127, 1217–1248. [Google Scholar] [CrossRef]
  124. Maleki, M.; Van Genderen, J.L.; Tavakkoli-Sabour, S.M.; Saleh, S.S.; Babaee, E. Land use/cover change in Dinevar rural area of West Iran during 2000–2018 and its prediction for 2024 and 2030. Geogr. Tech. 2020, 15, 93–105. [Google Scholar] [CrossRef]
  125. Naghadehi, S.Z.; Asadi, M.; Maleki, M.; Tavakkoli-Sabour, S.M.; Van Genderen, J.L.; Saleh, S.S. Prediction of Urban Area Expansion with Implementation of MLC, SAM and SVMs’ Classifiers Incorporating Artificial Neural Network Using Landsat Data. ISPRS Int. J. Geo-Inf. 2021, 10, 513. [Google Scholar] [CrossRef]
  126. Groff, E.R.; Johnson, S.D.; Thornton, A. State of the art in agent-based modeling of urban crime: An overview. J. Quant. Criminol. 2019, 35, 155–193. [Google Scholar] [CrossRef]
  127. Jelokhani-Niaraki, M.; Mofrad, R.B.; Dero, Q.Y.; Hajiloo, F.; Sadeghi-Niaraki, A. A volunteered geographic information system for monitoring and managing urban crimes: A case study of Tehran, Iran. Police Pract. Res. 2020, 21, 547–561. [Google Scholar] [CrossRef]
  128. Jiaqiang, E.; Zhao, X.; Qiu, L.; Wei, K.; Zhang, Z.; Deng, Y.; Liu, G. Experimental investigation on performance and economy characteristics of a diesel engine with variable nozzle turbocharger and its application in urban bus. Energy Convers. Manag. 2019, 193, 149–161. [Google Scholar]
  129. Hong, J.W.; Hong, J.; Kwon, E.E.; Yoon, D. Temporal dynamics of urban heat island correlated with the socio-economic development over the past half-century in Seoul, Korea. Environ. Pollut. 2019, 254, 112934. [Google Scholar] [CrossRef] [PubMed]
  130. Jorquera, H.; Montoya, L.D.; Rojas, N.Y. Urban air pollution. In Urban Climates in Latin America; Springer: Cham, Switzerland, 2019; pp. 137–165. [Google Scholar]
  131. Maleki, M.; Ahmadi, Z.; Dosti, R. Kermanshah land surface temperature changes in during 1393–1397 periods. Geogr. Hum. Relatsh. 2019, 2, 309–319. [Google Scholar]
  132. Someh, M.F.; Basiri, M.; Azim, A.Z. The role of green roofs in urban sustainability. Eur. Sci. J. 2014, 2, 1857–7881. [Google Scholar]
  133. Sadeghi, R.; Zanjari, N. The inequality of development in the 22 districts of Tehran metropolis. Soc. Welf. Q. 2017, 17, 149–184. (In Persian) [Google Scholar]
Figure 1. Map of the Study Area.
Sustainability 14 02495 g001
Figure 2. Research Methodology.
Sustainability 14 02495 g002
Figure 3. Map of the first part of the criteria: (A) population density; (B) building materials; (C) household density; (D) green space per capita; (E) land use; (F) gender ratio; (G) distance from the fault; (H) age ratio.
Sustainability 14 02495 g003aSustainability 14 02495 g003b
Figure 4. Map of the second part of the criteria: (A) housing price (B) building age (C) space syntax (D) distance to medical centers (E) density of educational spaces (F) distance to fire stations.
Sustainability 14 02495 g004aSustainability 14 02495 g004b
Figure 5. Tehran Resilience Map.
Sustainability 14 02495 g005
Table 1. Dimensions of Urban Resilience [71].
DimensionsCriteriaReference
PhysicalHousing Age, type of construction materials, land use, space syntax, width of streets[5,15,72,73,74,75]
EnvironmentalGreen space per capita, land surface temperature, distance from fault[5,76,77,78,79,80]
EconomicHousing prices, Income level[5,81,82,83,84]
OrganizationalDistance to the fire station, access to medical centers, density of educational spaces[3,85,86,87,88]
SocialPopulation density, age composition, sex composition, residents’ education level, household density[14,83,84,86,89]
Table 2. Information of the Delphi panel experts.
ExpertiseDegreeNumber (Persons)
Urban DesignPhD/Master(2)/(6)
Urban PlanningPhD/Master(3)/(5)
Crisis ManagementPhD/Master(2)/(4)
SociologyPhD/Master(3)/(4)
Civil EngineerPhD/Master(2)/(4)
Traffic ExpertPhD/Master(1)/(2)
Natural GeographyPhD/Master(2)/(2)
Total 42
Table 3. Pair-wise comparison scale for AHP preferences [101,106].
Preferences (Oral Assessment)Numerical Rating
Maximum priority9
Very high priority7
High Priority5
Medium priority3
Less priority1
Preferences between these intervals2,4,6,8
Table 4. RI rate for a number of different criteria.
N123456789101112131415
RI000.520.881.11.241.341.41.441.481.511.531.551.571.58
Table 5. Transformation of criteria into spatial information and how they affect resilience.
CriterionExplanationExtraction MethodEffectivenessRef.
Land surface
temperature
In order to extract land surface temperature, Thermal
Infrared Sensor (TIRS)
T s = T i + C 1 ( T i T j ) + C 2 ( T i T j ) 2 + C 0 + ( C 3 + C 4 w ) ( 1 ɛ ) ( C 5 + C 6 w ) Δɛ[80]
Household densityNumber of households per hectare H o u d e n s i t y = H o u t o t A r e a ( h a ) [109]
Population densityThe number of inhabitants per hectare P o p d e n s i t y = P o p t o t A r e a ( h a ) [109]
Age of buildingsAverage age of buildings prepared by Tehran Municipality
Distance to faultDistance to fault which is calculated by using Euclidean distance d i s t ( p , q ) = ( x p x q ) 2 + ( y p y q ) 2 + [110]
Distance to fire
stations
Distance fire stations that are calculated by using Euclidean distance d i s t ( p , q ) = ( x p x q ) 2 + ( y p y q ) 2 [110]
Housing priceDetermined using field surveys and price comparisons in housing finder soft wares.
Education center densityKernel function estimate of density in schools ω ( t ) d t = 1 n j = 1 x ω K ( x j , t ) d t = 1 + [111]
Distance to health centerDistance to health clinics which is calculated by using Euclidean distance d i s t ( p , q ) = ( x p x q ) 2 + ( y p y q ) 2 [110]
Land useThis data was prepared by Tehran Municipality+/−
Sex composition of
population
The ratio of women to men s e x   r a t i o = w o m e n m e n [112]
Street widthDistance of street center to the buildings (Euclidean distance) d i s t ( p , q ) = ( x p x q ) 2 + ( y p y q ) 2 +[110]
Space syntaxAnalyzing the relationships between spaces of urban areas and buildings+[113]
Per capita green spaceCalculation of available green space as a ratio to the number of inhabitants+[114]
Income levelInformation was obtained by sampling and field questioning n = t 2 p q / d 2 1 + 1 N   [ t 2 pq / d 2     1 ] +[115]
Level of educationThis information was collected by the Statistics Organization of Iran+
Type of building
materials
This information was collected by the Statistics Organization of Iran+/−
Age composition of populationRatio of population under 14 and above 65 to total population Y + O P o p [116]
Table 6. Data reclassification method.
ClassDomain Related to Each Class
First classV ≤ Vmean − 1.5std
Second classVmean-1.5std < V < Vmean − std
Third classVmean-std < V ≤ Vmean + std
Fourth classVmean + std < V ≤ Vmean + 1.5std
Fifth classV > Vmean + 1.5std
Table 7. Final criteria for decision making.
Criteria Name
Building age(C1)Space syntax(C6)Green space per capita (C11)
Population density(C2)Distance to fire station(C7)Household density (C12)
Distance from fault(C3)Building materials(C8)Density of educational spaces (C13)
Age Composition(C4)Building prices (C9)Land use (C14)
Sex composition(C5)Access to Medical Centers (C10)
Table 8. Pair-wise comparison matrix of criteria.
C1C2C3C4C5C6C7C8C9C10C11C12C13C14
C113278231649456
C20.33310.5230.510.333213122
C30.52144120.5325233
C40.1430.50.25120.3330.3330.14310.520.50.51
C50.1250.330.250.510.250.3330.12510.510.50.51
C60.51134120.5325223
C70.33330.5330.510.333213122
C813268231547446
C90.16660.50.333110.3330.50.210.520.511
C100.2510.5220.510.25212112
C110.110.3330.20.510.20.3330.1430.50.510.50.51
C120.2510.5220.510.25212112
C130.20.50.333220.50.50.25112111
C140.1660.50.333110.3330.50.16610.510.511
Table 9. The final weight of criteria.
CC1C2C3C4C5C6C7C8C9C10C11C12C13C14
W0.195330.061160.1052230.0300130.0238930.0962230.0712880.1850570.0321920.0526470.0220570.0526470.0419530.030129
Table 10. Neighborhoods with the highest and lowest resilience.
BestWorst
Rank NeighborhoodsRankNeighborhoods
1Iranshahr357Alaeen
2Vali Asr Square358Agaahi
3University of Tehran359Taqiyabad
4Ghaem Magham-Sanai360Shoosh
5Ismailabad361Rah-Ahan
6Laleh Park362Saffaeh
7Amjadieh-Khaghani363Abuzar
8Ferdowsi364Southern Armenians
9Imamate365Moghadam
10Parastar366Anbar Naft
11Choobtarash 367Firoozabad
12Behjat Abad368Golchin
13Zanjan369Imamzadeh Yahya
14Argentina370Mansoorieh
15Eastern Tehranpars371Zahirabad
16Western Tehranpars372Shahid Ghayouri
17Tehran Pars373Dilman
18Palestine374Jalili
19Jahad square375Valiabad
20Shoora376Sartakht
Table 11. Comparison of non-resilient neighborhoods with the whole city.
Sub-CriteriaCity SituationStatus of Non-Tolerant
Neighborhoods
Sub-CriteriaCity
Situation
Status of Non-Tolerant
Neighborhoods
C114.6%78.4%C885%68%
C2249291C99.9618.67
C362504050C101250970
C40.010.128C1116.53.5
C585.885.94C127584
C60.4280.3C131.692.31
C742403460C1439%51%
Publisher’s Note: MDPI stays neutral with regard to jurisdictional claims in published maps and institutional affiliations.

