Article

Subsidized LPG Scheme and the Shift to Cleaner Household Energy Use: Evidence from a Tribal Community of Eastern India

1
School of Commerce, Presidency University, Itgalpur Rajanakunte, Yelahanka, Bengaluru 560064, Karnataka, India
2
School of Management, National Institute of Technology Karnataka, Surathkal, Mangalore 575025, Karnataka, India
3
Urban Institute & Department of Civil Engineering, Kyushu University, Fukuoka 819-0395, Japan
*
Author to whom correspondence should be addressed.
Sustainability 2022, 14(4), 2450; https://doi.org/10.3390/su14042450
Submission received: 16 December 2021 / Revised: 15 February 2022 / Accepted: 17 February 2022 / Published: 21 February 2022

Abstract

:
Traditional fuels have both environmental and health impacts. The transition from traditional to clean cooking fuel requires significant public policy actions. The Pradhan Mantri Ujjwala Yojana (PMUY) is one of the primary policies launched in India to eradicate energy poverty among households. Past studies have focused on the drivers that motivate rural households to adopt clean energy and identified the bottlenecks for adoption of clean energy in developing countries. PMUY’s success in terms of scale and pace is critical in the national drive to provide access to clean energy fuel to each citizen. The present study focuses on two objectives. First, we investigate the intensity of adoption and refill of LPG under the PMUY scheme. Second, we use household and other demographic characteristics to examine the factors that influence households’ decision on using LPG as a cooking fuel. Empirical results show that rapid growth has been witnessed in the provision of subsidized LPG connections. However, the annual average refill status stands at two LPG cylinders per beneficiary household indicating that the majority of the beneficiaries have failed to refill their LPG cylinders. This imbalance between rapid enrollment of LPG and limited refill among beneficiary households indicate the continued usage of traditional sources of energy for cooking. From the primary survey conducted in the rural tribal communities of Odisha, we observe that household income and education played a significant role in adoption of LPG and continued usage of LPG gas. Additionally, the logit and ordered probit models identify that membership in self-help groups, accessibility and awareness of LPG are the major adoption drivers. In conclusion, policy makers need to address the challenge of refill status among PMUY consumers. Further, educating households on health benefits through SHG and creating accessibility at village level can actively increase the usage of LPG.

1. Introduction

The energy source used for cooking by households is a key indicator of the overall socio-economic development of a region. Lack of access to clean energy for cooking indicates energy poverty for a household. The emphasis on the United Nations’ sustainable development goals (SDGs) and international financial support to developing countries for affordable and clean energy has accelerated the shift from traditional energy use to clean energy use. Despite the progress in affordable and clean energy, developing countries in sub-Saharan Africa and South Asia have a large deficit, with their continued reliance on traditional sources of energy for cooking. India, despite being one of the fastest growing economies in the world, faces significant challenges in achieving energy access. An estimate shows that 239 million people do not have access to electricity and 830 million people lack access to clean cooking energy [1]. The usage of traditional solid fuels for cooking causes both environmental and health effects. The dynamics of energy use are strongly associated with the income level of households [2,3]. Apart from household income, education level induces households to adopt affordable and clean energy [4,5,6]. In fact, small and marginal farmer households incur higher monthly expenditures compared with their monthly income [7]. This constraint of lack of financial capital has created a large deficit in adopting modern fuel as an energy source. Developing countries have strived to a great extent to focus on making clean energy affordable and accessible. The usage of LPG as a cooking source has been scaled up around the globe [8]. The external shocks that affect income generation in rural areas is a significant challenge in continued usage of clean energy. The probability of households falling back to the usage of dirty fuel due to income shocks is high. Several policies to govern the existing gap in the adoption of clean energy and continued usage of clean energy are being addressed among the developing countries [9]. A policy evaluation focused on clean energy would help in the better implementation of the program among similar economies. The constraints in the existing policies could be addressed with the mid-course policy revision to make it more effective.
In the past, India has provided a price subsidy for the refill of domestic LPG cylinders. However, with limited disposable income, the adoption of LPG gas was limited among households. The LPG subsidy was mainly availed by the high expenditure households and a larger stake of these subsidies was consumed in the urban region [10]. Moreover, the subsidy was given on the cylinder, which excluded a large number of low-income households from the LPG market due to the requirement of initial capital investment. To overcome this capital constraint, the Pradhan Mantri Ujjwala Yojana (PMUY) scheme was launched in 2016 to provide a capital subsidy to adopt LPG as a cooking source for households below the poverty line. Since its inception, the policy has achieved remarkable penetration, as nearly 70% of the target was achieved in just two-thirds of the intended timeline [11]. However, full transition to LPG among rural households in India has still not been achieved [12]. The monetary cost involved in switching to clean energy creates a barrier as most of the biofuels incur near zero monetary costs [13]. Although enrolment in the LPG scheme is quite high, the consumption frequency of LPG as a means of cooking among these enrolled households raises a question about the actual penetration and usage of cleaner energy [14]. A significant proportion of households that enrolled in the PMUY have reported having used LPG only intermittently.
Various studies have investigated the factors influencing households’ decision to adopt cleaner cooking fuels [4,5,6]. Income and education are the key determinants of solar energy adoption among Kenyan households [6]. Similar results have also been found in other African countries such as Ethiopia, Tanzania, and Malawi in the adoption of clean and renewable energy for lightning [4]. In addition, female household heads were more likely to adopt the clean energy when compared with their male counterparts. With growing literature on the adoption of clean cooking fuel, a few studies have aimed at evaluating the policies focusing on the adoption of cleaner fuel [14,15]. Capital subsidy schemes such as PMUY have triggered the adoption of LPG in India. However, to increase the share of LPG as a main source of cooking fuel, doorstep delivery of LPG cylinders is required [13]. A site-level policy evaluation of PMUY in rural Karnataka showed that the number of refills among beneficiaries is half of that with comparison to rural general consumers [12]. The household response to the adoption of PMUY indicates that greater availability of kerosene limits the adoption of LPG. Creating awareness of the health benefits of clean cooking fuel and enhancing its delivery mechanism led to a higher adoption of LPG in rural India [15].
There is a need to evaluate whether the PMUY scheme has significantly performed a complete transition from solid fuel to clean fuel among the beneficiaries or not. To bridge this gap, the present study dwells on understanding the gap between the adoption and the refill of LPG by PMUY beneficiaries among different states in India. The aggregated dataset, including total PMUY beneficiaries and their refill pattern, was employed for the analysis. Furthermore, analyzing the factors that influence the decisions of households in energy poverty regions to adopt LPG (especially under PMUY) will contribute to a better understanding of the program’s effectiveness and help in its fine tuning. Therefore, the study predicts the determining factors that influence the adoption of LPG in rural Odisha, which is a highly energy poor states of India. Additionally, we focus on understanding the relative importance of household characteristics. Moreover, the study employs a wide range of household characteristics—economic, social and demographic—to identify the factors that influence a household’s choice of fuels for cooking.
The paper is organized as follows: Section 2 presents a brief literature review and outlines the conceptual framework; Section 3 describes the study area, data collection and methodology; Section 4 enumerates the empirical results followed by discussions while Section 5 concludes with policy recommendations.

2. Theoretical Background

Microeconomic theory postulates a range of factors that affect the quantity of a given commodity that would be demanded at a given price: average levels of income; the size of the population; prices and availability of substitutes (in this case, traditional and modern energy sources); individual and social tastes; special influences [3]. Researchers have attempted to understand the factors that determine households’ adoption of clean and affordable energy. The energy ladder hypothesis model, which has been extensively adopted, helps to understand the dynamics of household decisions to substitute and/or shift to alternate fuels [13]. For example, in India, one can classify the energy ladder hypothesis for cooking as solid fuels (wood and cow dung) at a lower scale on the energy ladder and with an increase in socioeconomic status, a move towards kerosene to LPG and finally to electricity. The affordability and awareness of LPG has created a pathway for households to adopt the former as the source of energy for cooking. Alternatively, providing access to cleaner energy is an important prerequisite to improve the socio-economic status of the region [16,17]. Income plays a significant role in the quality of life of a household. The higher the income, the better and the more sophisticated and convenient the energy sources and vice versa. The effects of income on fuel usage and adoption have been extensively studied [17,18]. Apart from income, other major variables employed are the characteristics of the household head [2,3]. The age of the household head is a widely used variable, where mixed results have been found [19,20]. Studies indicate both positive and negative relationships between the age of the household head and the use of fuel. Education is a well-proven indicator that has a positive influence on households to switch from the traditional choice of fuel to modern fuel [17,21]. The evidence of household size on the choice of fuel is ambiguous. Studies indicate different results in terms of preference of fuel by larger households, few studies show preference to dirty fuels over clean fuels [22,23], and the opposite trend [2]. Gender is another debated factor that is employed to identify the choice of fuel. A few studies have observed that female-headed households are more likely to adopt cleaner fuels such as LPG [19], and contrastingly, results also indicate that a higher proportion of female members use firewood as fuel for cooking [24]. These mixed results indicate the necessity for further work, focusing on the gender differences in adopting LPG, as women are responsible for household cooking and are directly exposed to pollution caused by the use of traditional fuels.
Though income represents the economic status of a household, it does not capture the wealth of individuals, especially their living status, savings and consumption patterns. Increased savings and change in consumption patterns also influence households’ choice to adopt modern fuel for cooking purposes. Studies have revealed limited evidence identifying the effect of wealth status on the adoption of modern fuel for cooking purposes. Accessibility plays an important role in preference of choice; in this case, fuel accessibility indicates the adoption mechanism among rural households. Empirical research thus far has primarily focused on the household characteristics as determinants of fuel use that are unlikely to capture the role played by factors such as awareness about the health impacts of conventional cooking fuel and government interventions in adopting modern fuel. Accessibility and awareness are the major factors that influence consumer behavior. Therefore, studies employing these factors will provide more insights into the adoption of modern fuel.

3. Materials and Methods

A multi-stage sampling approach was used to conduct the household survey. The first stage involved the purposive selection of three districts out of the 30 districts in Odisha. The districts were selected based on their poverty dynamics and household vulnerability to poverty status [25]. The districts chosen were Koraput, Nabarangpur and Kandhamal. These districts are among the poorest districts in the state, with the exception of Nabarangpur district. It has been observed that Kandhamal district was ranked highest in poverty dynamics and vulnerability to poverty estimation. Koraput district was among the highly vulnerable districts. The second stage was the convenience selection of the block/taluk/mandal in the districts from each selected district. The final stage was the random selection of 479 households from these three districts.
To make the sample representative, the number of households to be interviewed from each village was determined using a proportional factor based on the village population. From the total 479 sampled responses, 201 from Koraput, 103 from Kandhamal and 175 from Nabarangpur district were collected (Table 1). The data were collected in two phases. The first survey was conducted in July–August 2018 while the second survey was conducted during December–January 2019, using a comprehensive questionnaire. The authors have themselves canvassed the questionnaires in the field. Questionnaire pre-testing, involving 20 rural households and group discussions with the village ward members and village elders, was also undertaken to note and remedy the ambiguities present in the questionnaire. All households in the selected villages had an equal chance of being sampled. A household was defined as a unit where the members have stayed together and shared food and other essentials for survival in the last six months. Mostly, the household head (male or female) was interviewed. In the rare case where the household head was absent, any adult person who was knowledgeable in answering questions about the household, was interviewed.
To understand the factors determining LPG usage among households, the study employs various household, economic and demographic characteristics. The variables were carefully selected based on literature and survey instruments. A detailed discussion on the variables is presented below.
The relationship between income and choice of energy, though well established, is uncertain in Indian conditions. Studies have found that increase in per capita expenditure has a positive effect on energy consumption [26]. Contrastingly, the results from other studies indicate that energy-poor households are not income poor [27]. The present study employs the logarithm of household income, which is the monthly income earned by the household converted into its logarithmic form. Household head characteristics are well connected to energy choice as they are decision-makers among rural households. To represent the education level of the household head, we use years of schooling, assuming that an increase in the number of years of schooling will lead to attainment of a better education level. Similarly, we assess the relationship between household head age and choice of energy. The role of gender is important in the choice of energy use for cooking as, in practice, women are responsible for cooking in rural society. However, we do not directly include gender role in the study; rather, we use the education level (spouse’s schooling) of women similar to household head’s education level. Education and age are the continuous variables and represent the highest level of education achieved and the age of the individual, respectively.
To understand the wealth status of a household, we use an indicator, namely the type of house (TOH) in which the household resides. Empirically, one can identify the living conditions of a household from the housing infrastructure. It is hypothesized that better living conditions will influence a household to adopt a modern cooking fuel. To test the above hypothesis, we investigate whether the house has a separate room for cooking (SRF). This would potentially provide more information on the status of rural household characteristics and their fuel choice. A house with tiled flooring was given the highest value of 3, a kutcha house with 2, followed by the hut and semi-pucca house with 1. Similarly, for a separate room for cooking, a dichotomous variable was constructed. The variable takes the value 1 for the household with a separate room for the kitchen and 0 otherwise. The relationship between employment status and choice of energy is not fully accounted for in the empirical framework. Further, farmers, who form an integral part of the rural economy, have been given limited focus. The employment choice among rural households plays a significant role in the choice of fuel. Salaried or business individuals would forego collecting fuelwood and choose modern fuel to save time and earn income from employment. Therefore, the present study uses a dichotomous variable to measure the employment status with special reference to farmers. The variable takes the value 1 for the farmers and 0 otherwise (salaried and business).
Traditional fuels in the rural region face imperfect markets as most of the fuels (animal dung and crop residues) are available at zero monetary cost. Farmers who are exposed to these fuel choices tend to adopt them as their primary energy source for cooking. Therefore, we identify the probability of farmers’ adopting a cleaner fuel by foregoing the traditional fuel choice which is available with zero monetary cost. Farm size owned indicates a household’s exposure to traditional fuels, and the dependency on cultivation. Hence, we use the farmland owned, which is a continuous variable measuring the total land owned by households in acres. The evidence on awareness and role of government interventions on household decision making on choice of cooking energy is limited in the existing studies. To explore this relationship, this study identifies the involvement of household members in self-help groups (SHGs). Self-help groups promote awareness about social well-being and also create awareness about government policies in rural regions. The inclusion of a household member in an SHG and their choice of fuel can be interconnected and may decide the efficacy of policy interventions. To investigate the role of awareness, we employ a dichotomous variable indicating 1 for the member of the household being enrolled in SHGs and 0 otherwise. Accessibility and availability play a major role in the adoption of modern fuels. To better understand the accessibility of modern fuel (LPG), we employ the distance between the homestead and the nearest primary health care center. Hospitals are important available facilities and also indicate the region’s minimum basic amenities. The distance to hospital from the homestead, measured in kilometers, is a continuous variable and resembles a proxy for accessibility and availability of primary services.
The study follows a two-pronged analysis. In the first step, to understand the transition behavior of households to using clean fuel for cooking, a comparison of data on LPG connections installed and refills are analyzed. The real usage of LPG for cooking will be known from the refill intensity. Firstly, the year-wise (2017–2020) and state-wise total connections of LPG acquired under the PMUY scheme were tabulated (Table 1). A cumulative value of the first installation of LPG was calculated to analyze the overall growth in LPG connections. The adoption of an LPG connection alone does not fully represent the transition from traditional fuel, but the sustained use of cleaner fuel does indicate that. To understand the continued usage of LPG, we use the total refill purchase by PMUY beneficiaries (Table 2). The study evaluates the average annual refill purchase by PMUY beneficiaries by estimating the year-wise total refill to the year-wise total cumulative LPG connections. The data on total connections and refill purchases has been collected from the Open Government Data (OGD) Platform at www.data.gov.in (accessed on 10 August 2021).
As a second step, the study uses primary survey data to estimate the factors that influence the household adoption decision of the LPG connection under the PMUY scheme. The study uses descriptive statistics to explore household characteristics. Based on the outcome of household characteristics, we employ a binomial probit model. The dependent variable takes a binary form in which households with LPG gas consumption are labelled as 1 and those with non-usage of LPG gas as 0. The study uses an ordered probit model, where the dependent variable is ordered in three levels: 1 for no transition to LPG; 2 with a partial transition to LPG; and 3 with full transition to LPG. Probit models are well suited for assessing the determinants of household decisions [13,28]. These models estimate the change in the probability of adopting cleaner energy sources for cooking, conditional on certain factors.

4. Results and Discussion

4.1. Analyzing the Shortfall between LPG Cylinder Connections and Refills under the PMUY across the States of India

Table 1 presents the year-wise LPG connections and cumulative year-wise increase in LPG connections under the PMUY for major states in India. About 80 million new LPG connections were distributed to households below the poverty line between 2017 and 2020. Significant growth in the LPG connections can be viewed in all the states, especially in Uttar Pradesh, West Bengal and Bihar, the states that lead the list of adopters. At an aggregate level, the top six states in Table 1 that accounted for more than 90% of households having energy poverty in 2015 were found to be the largest adopters of LPG under the PMUY [29]. Over the four years of PMUY scheme implementation (2016–2020), significant growth in these states has been witnessed in the adoption of new LPG connections, which appears to be a sign of successful implementation. However, the assessment of LPG use beyond adoption is critical to strengthen the transition from solid fuels such as firewood and cow dung. The successful implementation of the scheme should follow a continued use of LPG and a foregoing of the use of traditional fuels. As per the PMUY policy, the subsidies are provided to cover the cost of initial installation of the LPG connection. There are, however, no subsidies for the refill cylinders. While the average family requires nearly 10 to 12 LPG cylinders in a year for cooking, the refill status of 24% of PMUY beneficiaries was zero since the adoption of LPG under PMUY (up to November 2018) [12]. To understand the gap between consumption (refill) and adoption of LPG, the present study analyses the state-wise consumption of LPG by average annual refill of cylinders per PMUY beneficiary.
Table 2 presents the year-wise LPG refill and average annual refill under PMUY for major states in India. The data on refill status indicates that rural households are reluctant to shift completely to LPG as a cooking source. The lowest average annual refill was 1.06 cylinders per household in Chhattisgarh state in 2019–2020, which indicates that a large number of households still prefer solid fuels for cooking. The trend for the average annual refill consumption varies over the years 2017 to 2020 across the states. During the initial period (2017–2018), the average annual refill among the states tends to be higher compared with the later years (2019–2020) for which refill data is available. These are largely the early adopters of LPG; despite the rapid increase in the adoption of LPG in the next two consecutive years, the refill rate slipped drastically. The annual refill in Uttar Pradesh dropped from 3.29 in 2017–2018 to 1.45 in 2018–2019 and finally 1.75 in 2019–2020. A similar pattern can be viewed in other states, which indicates low consumption of LPG by PMUY beneficiaries. From the trend, it can be noted that early adopters (2016–2018) used more LPG when compared with later beneficiaries. Though a long-term trend would be suitable to measure the full transition towards modern fuels, the analysis in our study shows a usage of 1 to 3 cylinders per year per household for the period used in the study. The major barrier to LPG usage is the recurring cost involved in each refill, which discourages poor households from buying a refill. The full transition to modern energy requires adoption as well as continuous usage of LPG over a longer time horizon. Suitable policy intervention is necessary to improve the consumption of LPG to fully replace traditional fuels. Further, for an in-depth analysis of the barriers to LPG usage and the adoption of LPG among households, the study explores the factors that determine the household’s decision to adopt a clean cooking fuel. The external shock (climate change; market imperfections) that affect income plays a significant role in the refill of the LPG cylinders. Similar results have been reported in an investigation on the low re-fill status among PMUY beneficiaries at micro level in Karnataka state [12]. LPG cylinder refills have been highly price sensitive and demand tends to decrease drastically during the summer season due to households having less disposable income [30].

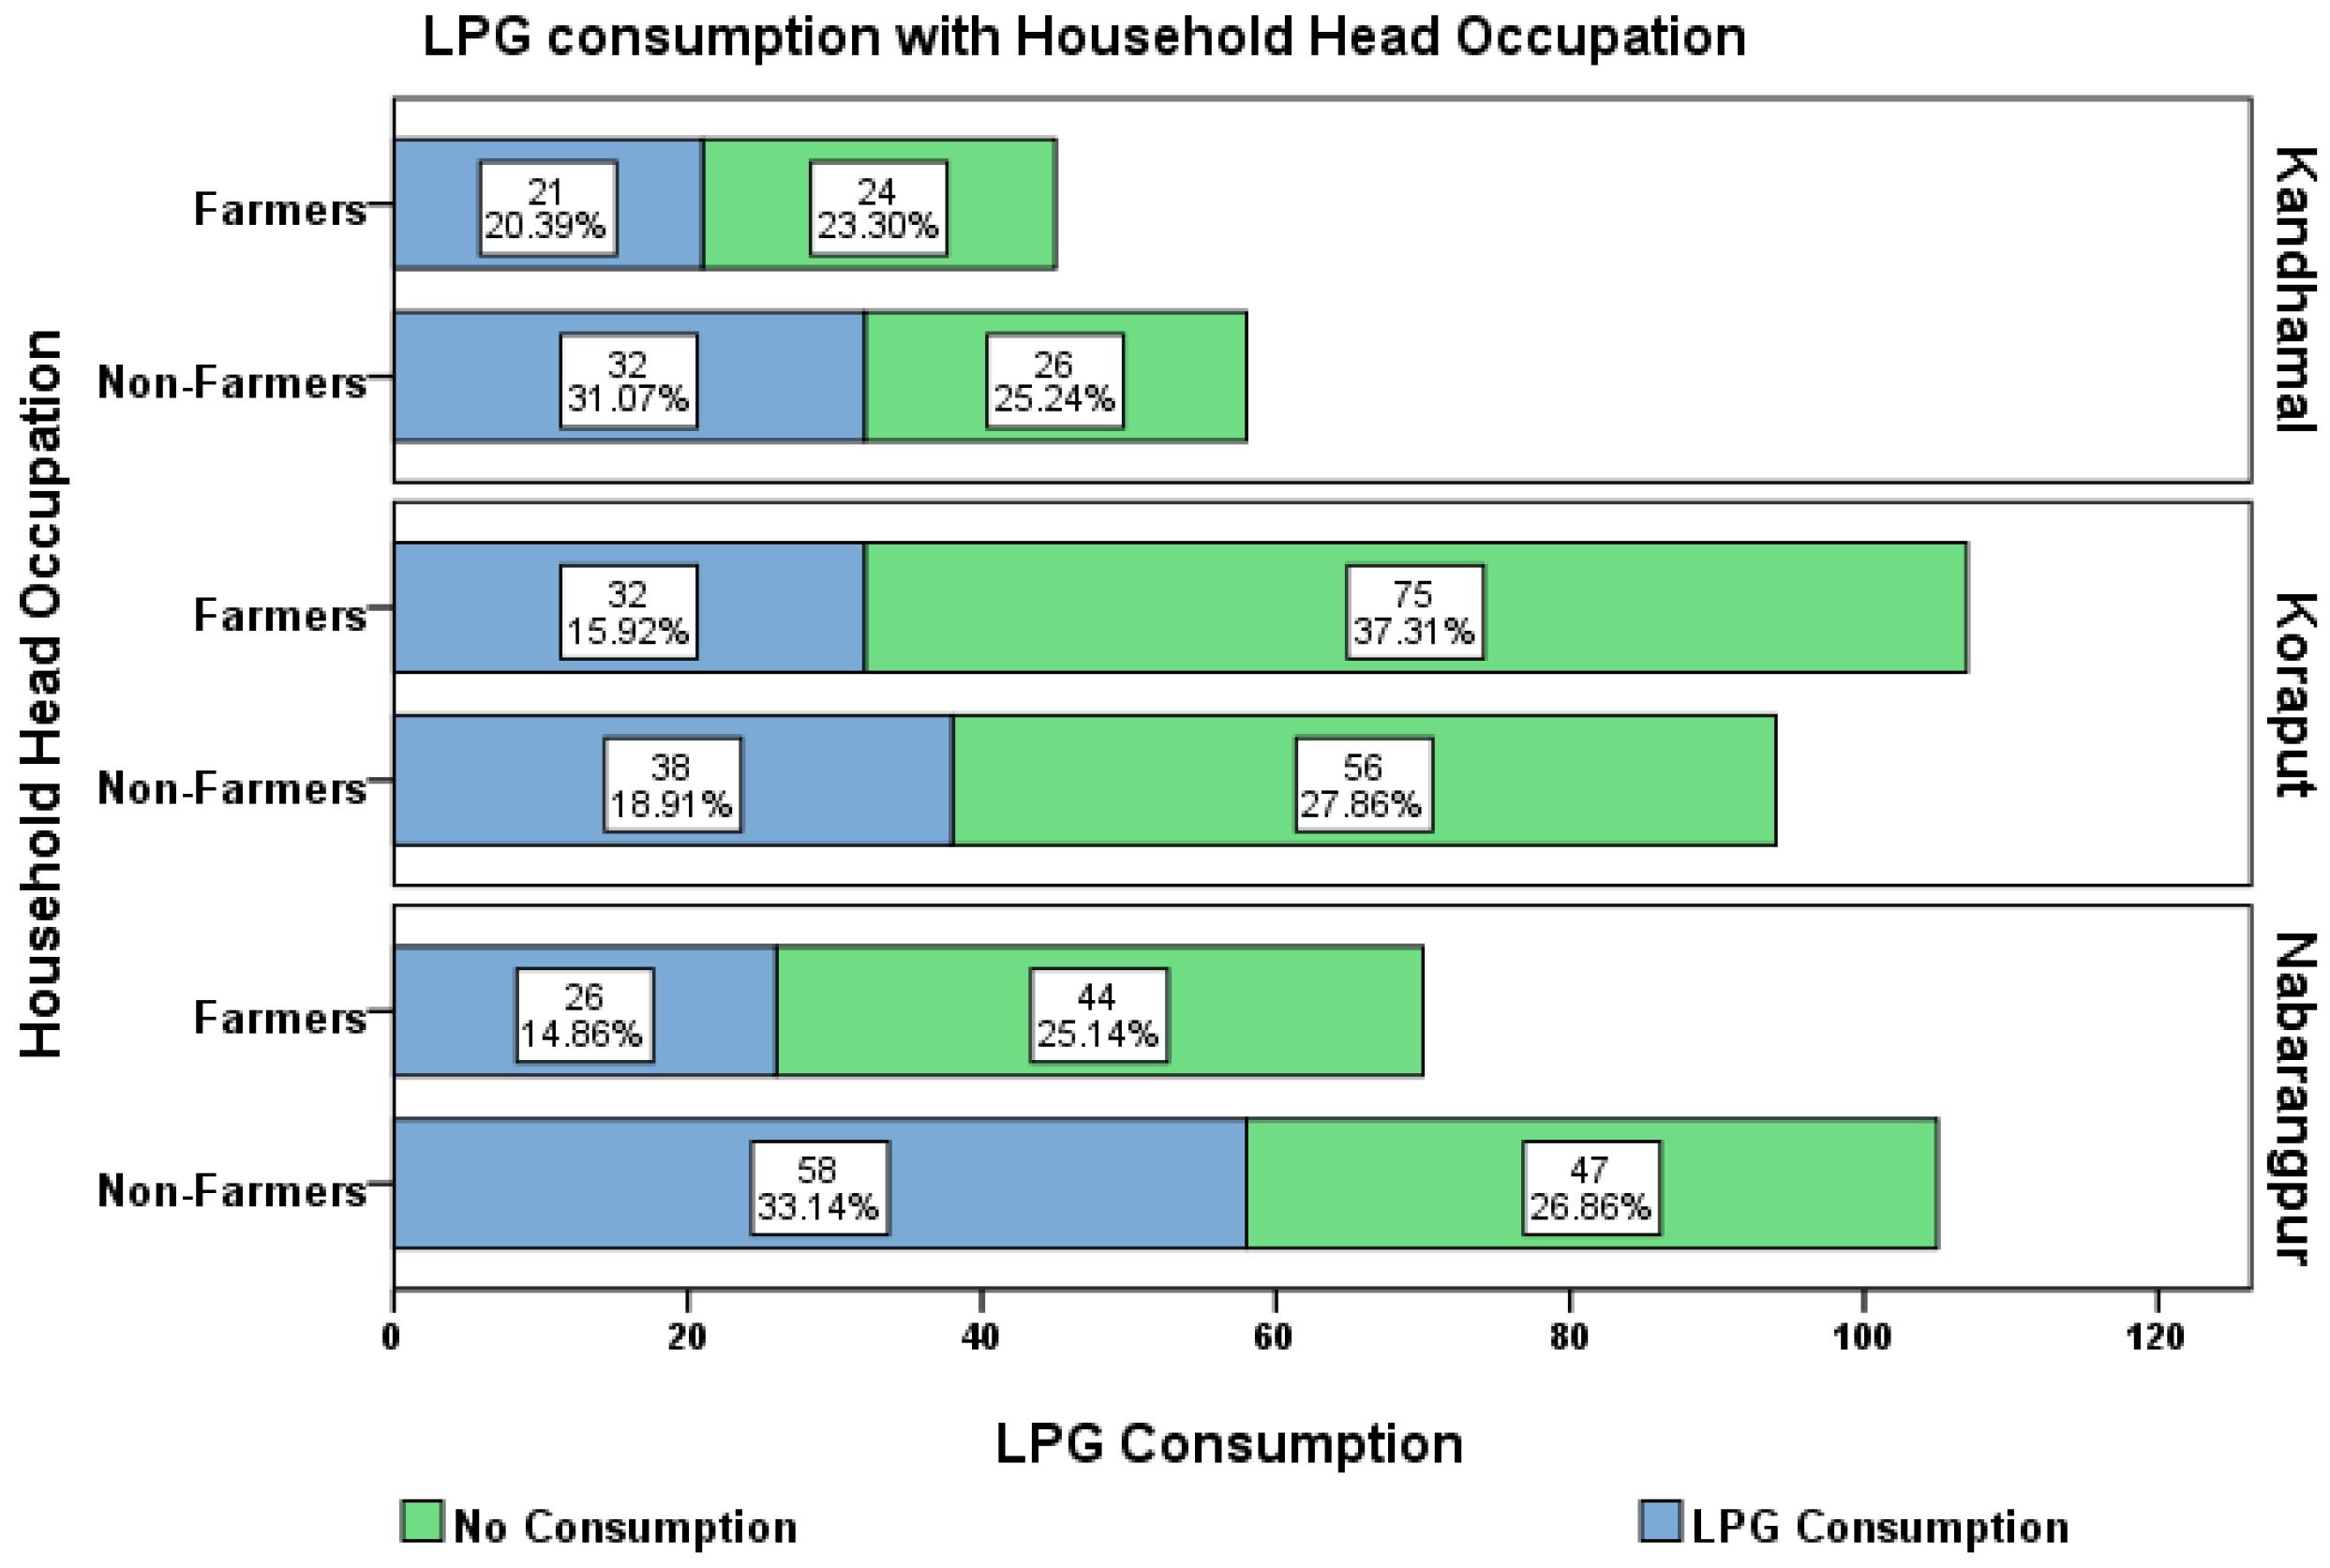
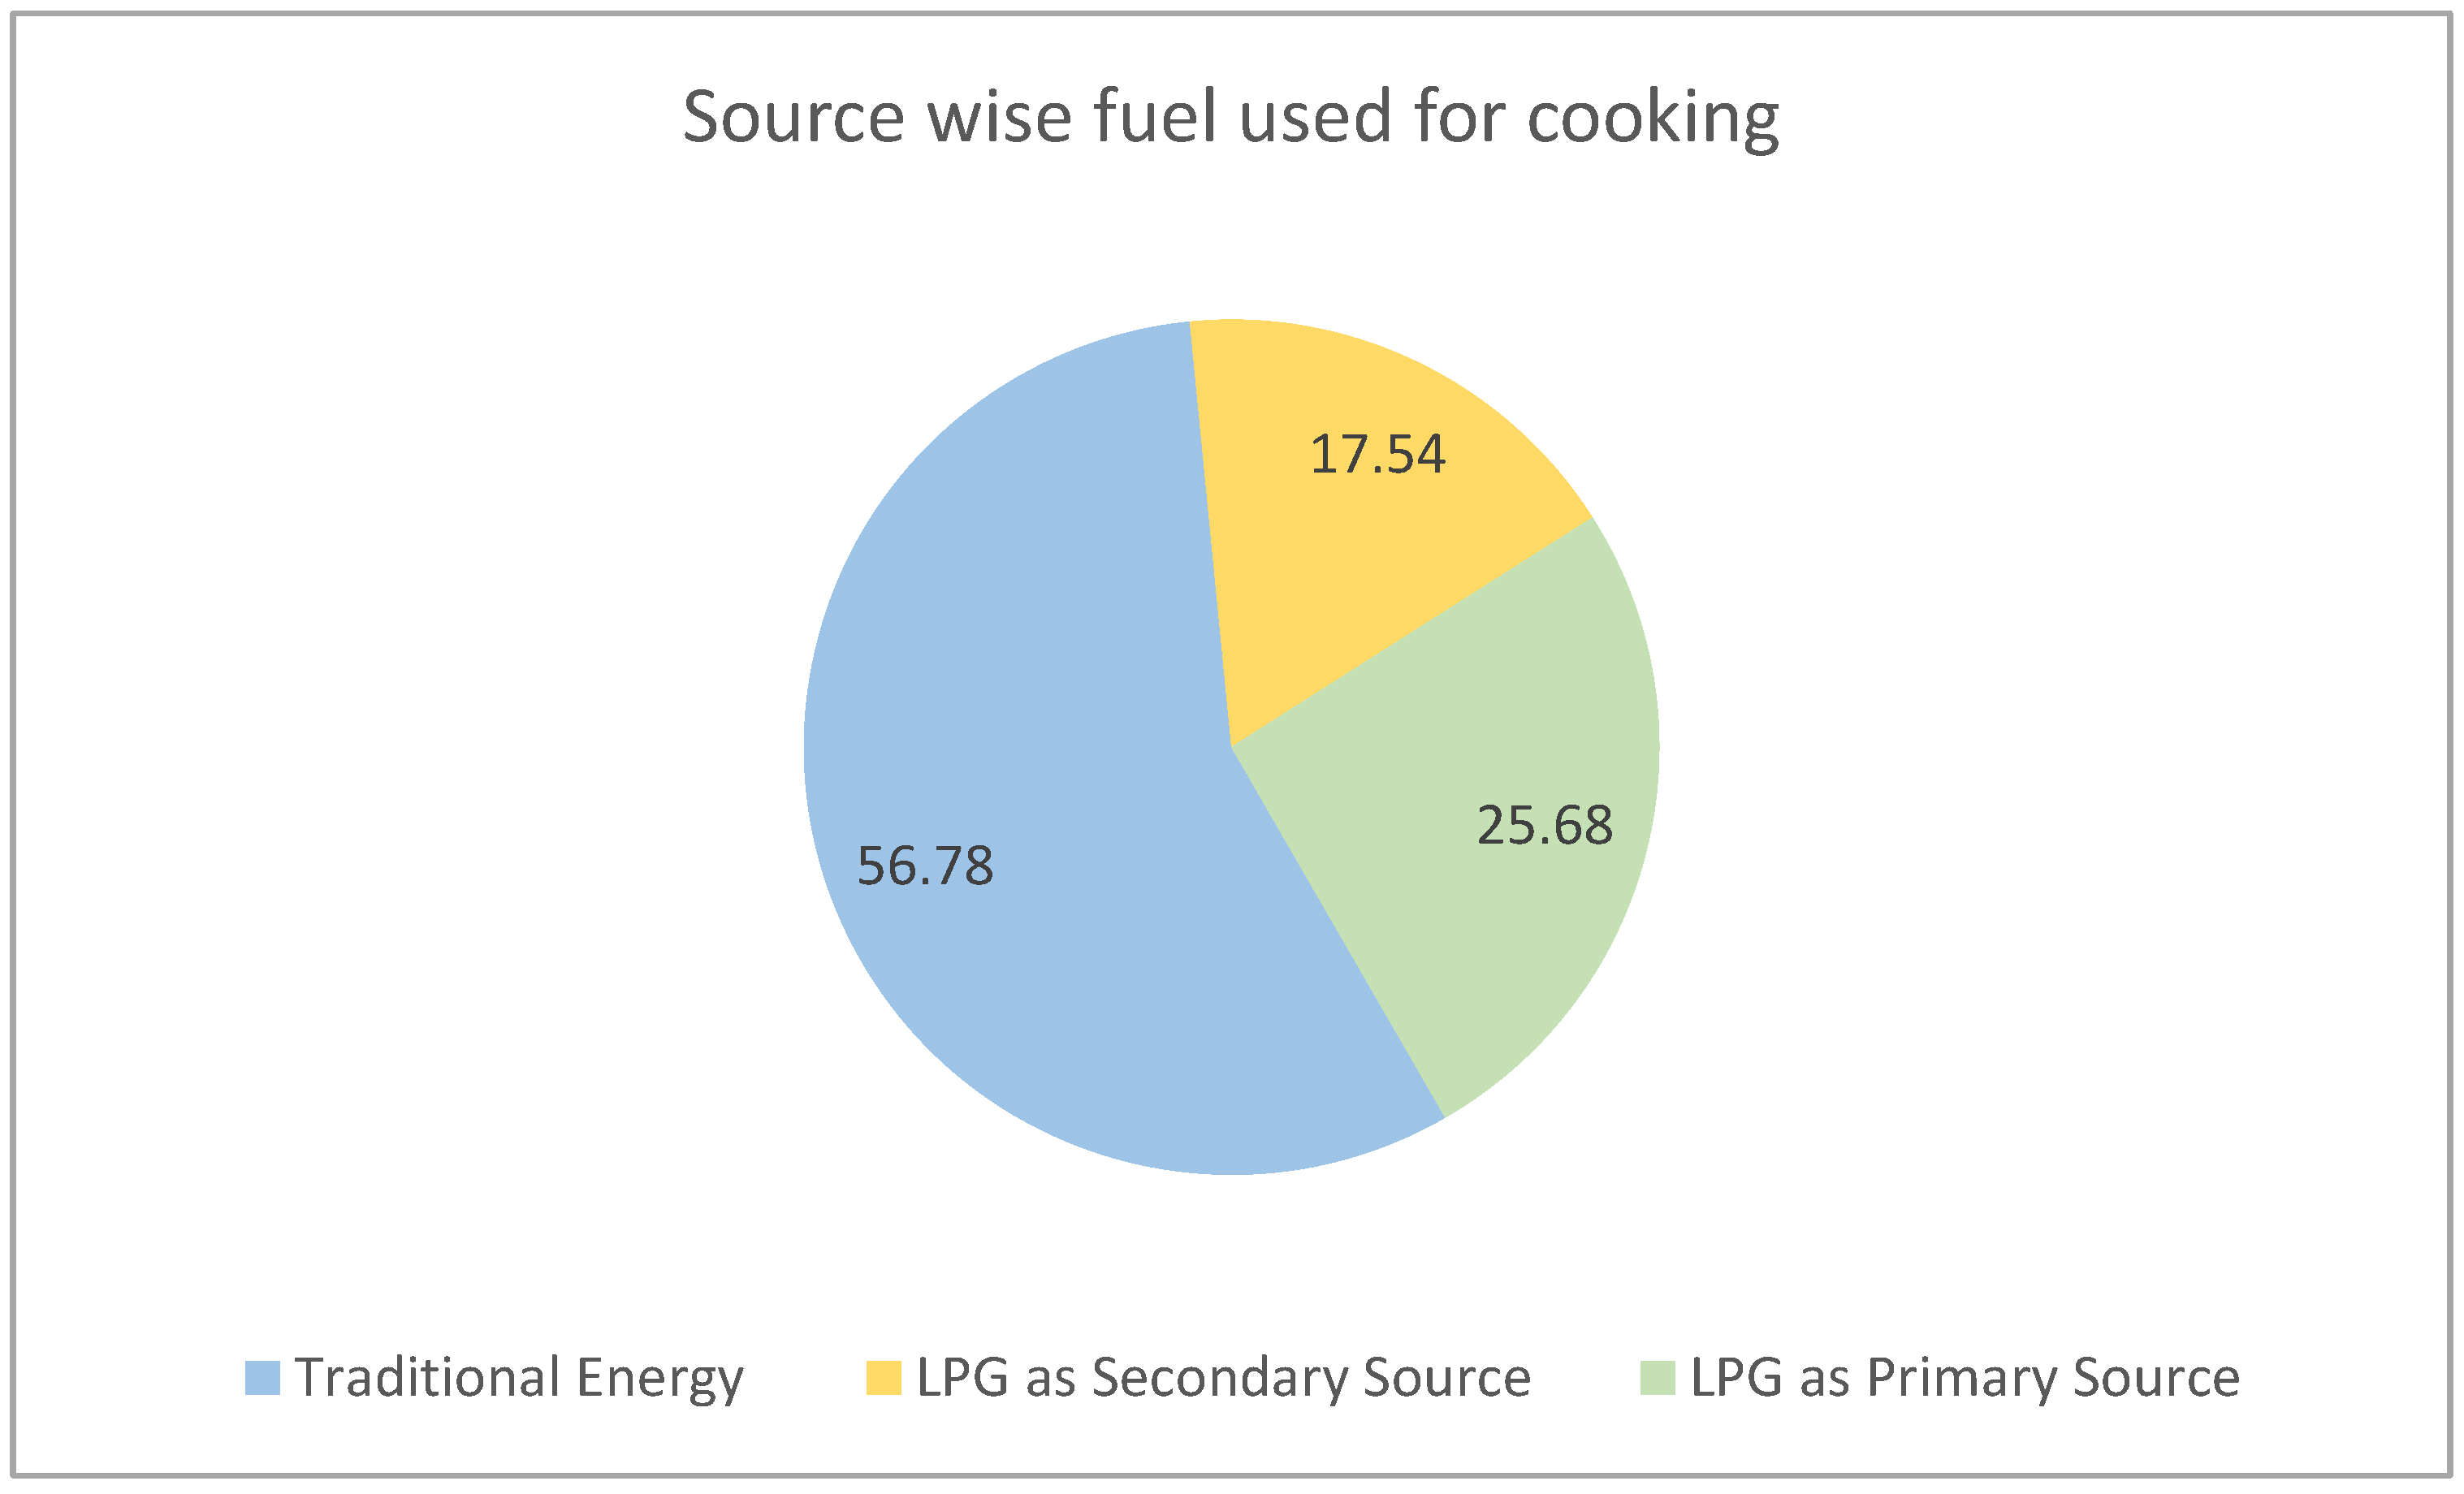
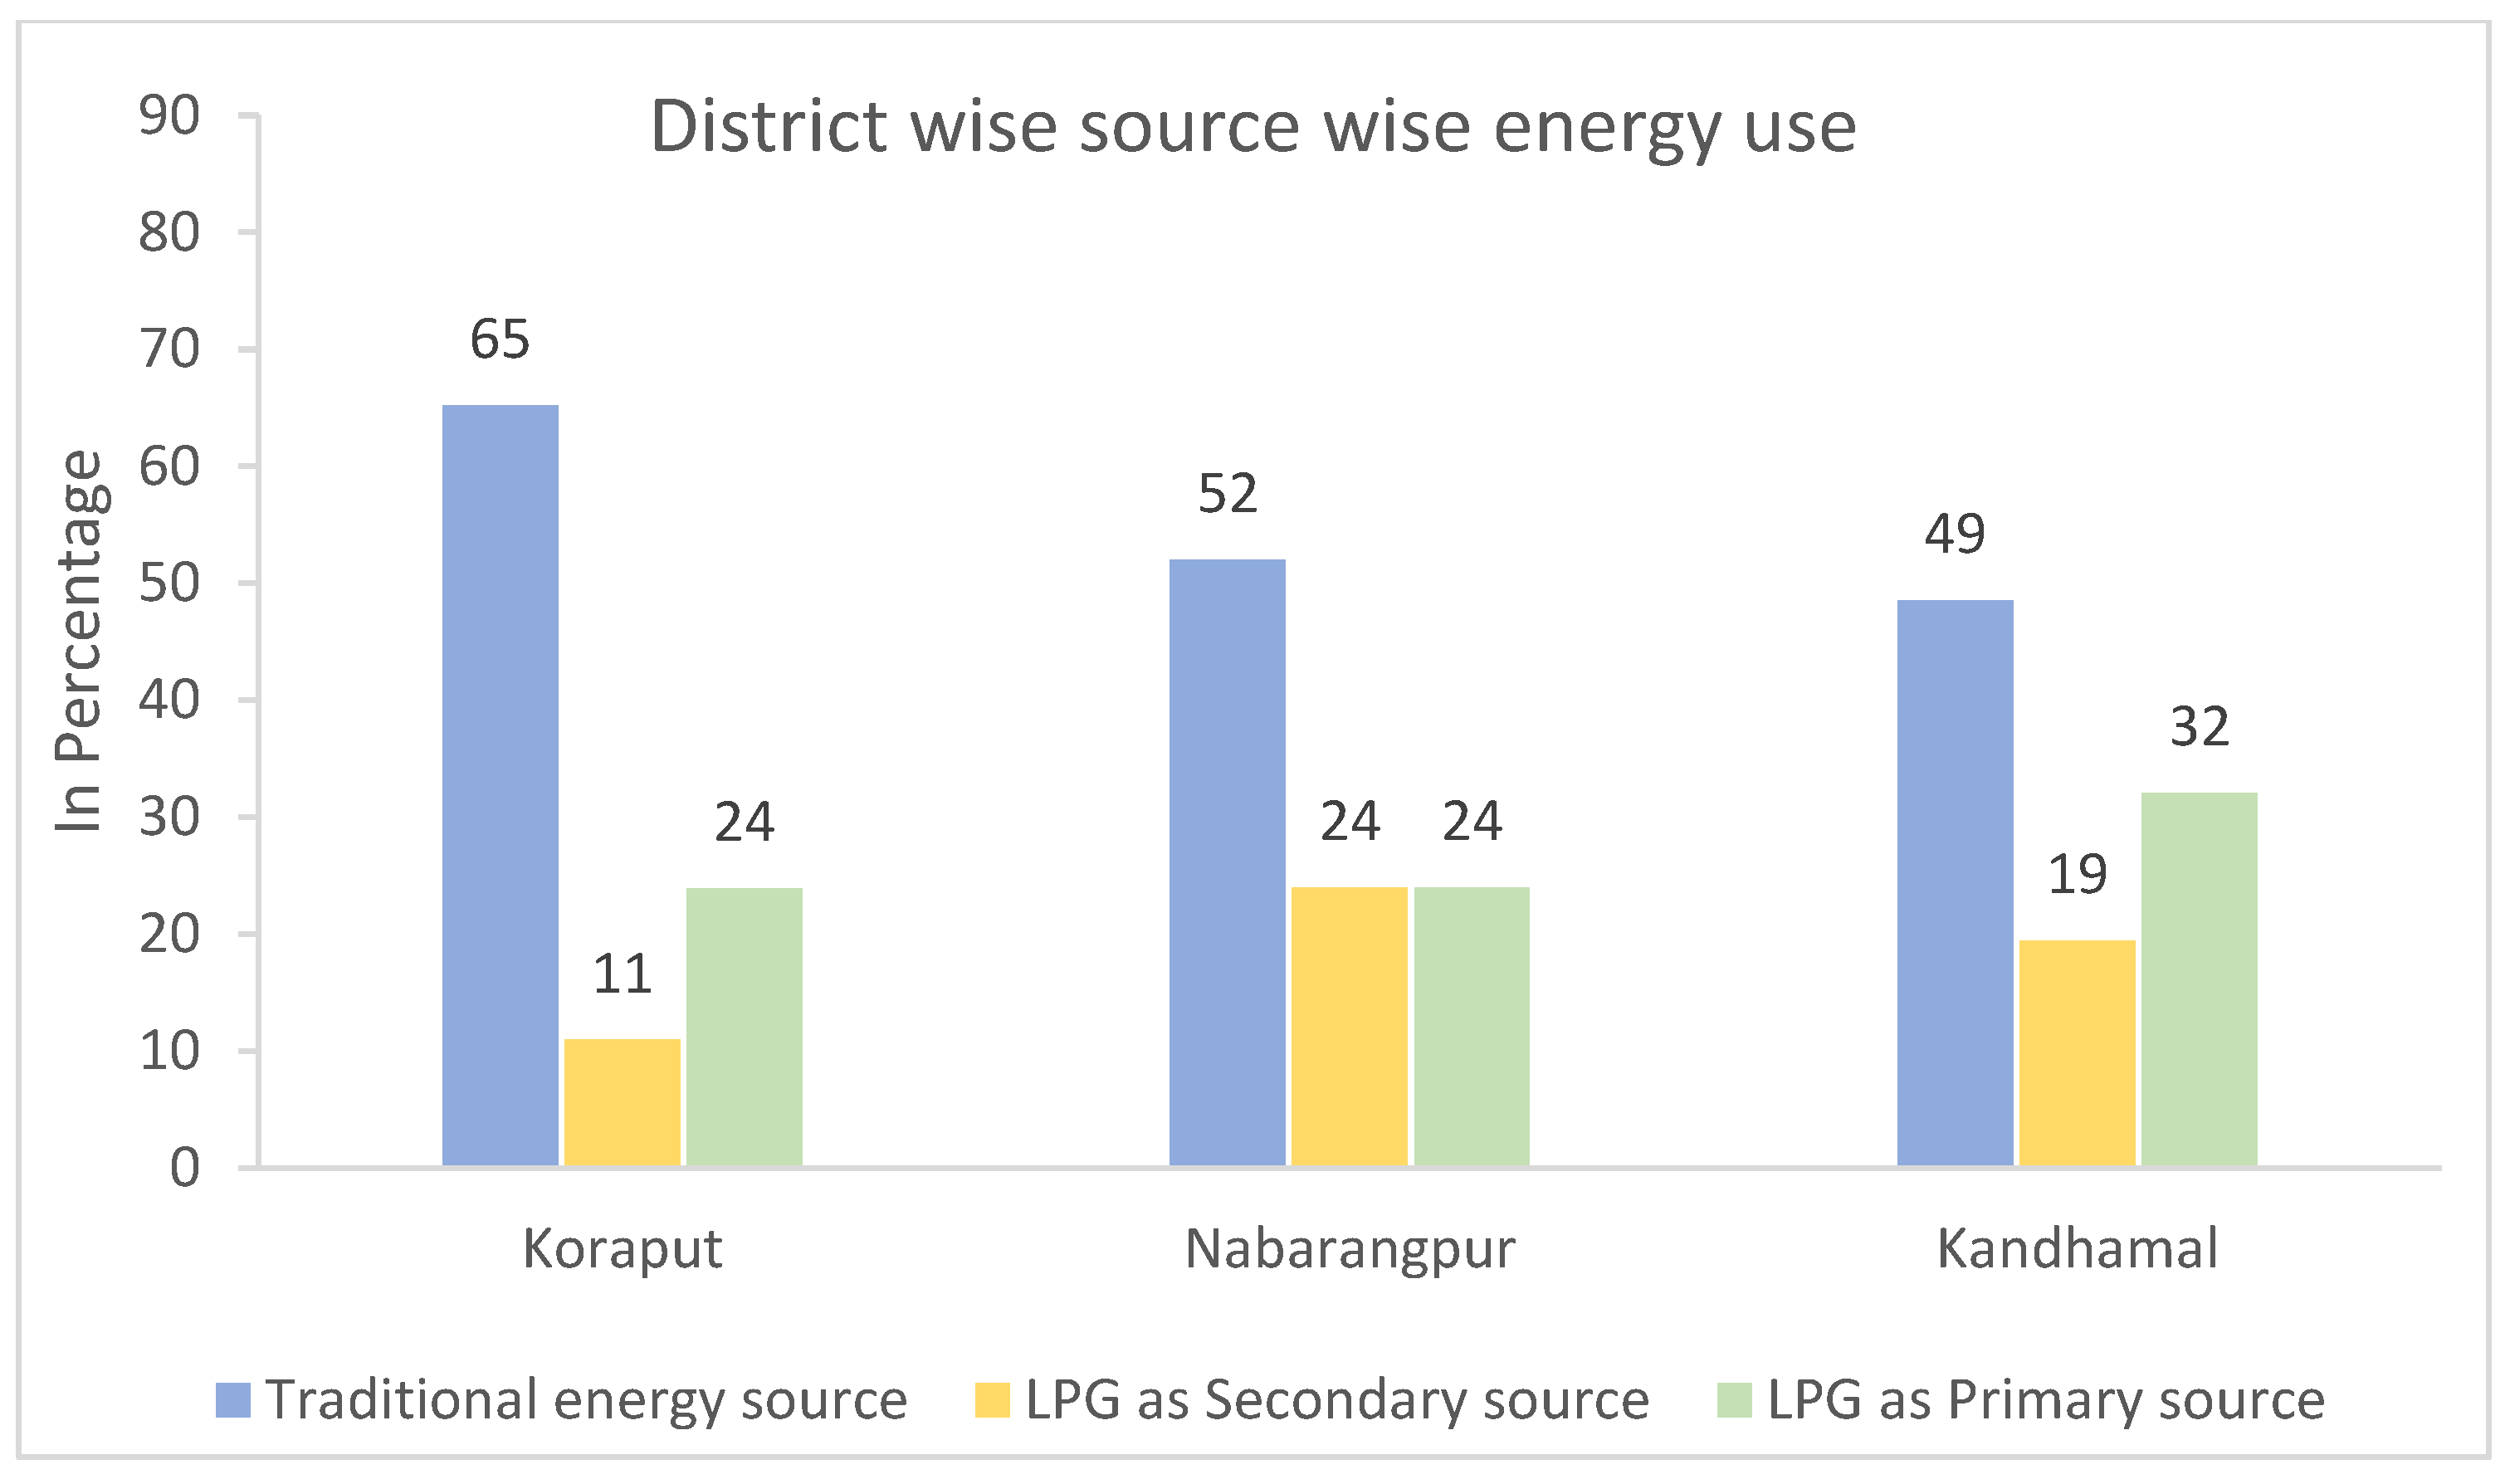
4.2. The Adoption Intensity of Clean Cooking Fuel in the Selected Districts

The districts are chosen for the study—namely, Koraput, Nabarangpur and Kandhamal of Odisha—are characterized by a high score in energy poverty [29], indicating lesser access to clean energy. Figure 1 presents the source of energy used for cooking among the sample households. The household data from the present study shows that nearly 57% of the respondents use traditional energy sources for cooking while the remaining 43% have adopted LPG. Out of the 43% of respondents who have adopted LPG, 17% use it as a secondary source and the other 26% use it as the primary source for cooking. Figure 2 presents the district-wise energy used for cooking as a percentage of different sources of energy among the sampled households. There is heterogeneity among the districts in LPG adoption. Nearly 65% of the households in the Koraput district use traditional sources of energy, 24% use LPG as the primary source of energy for cooking and 11% use it as the secondary source. Higher rates of LPG adoption are observed in the other two districts.
Figure 3 presents the income distribution of the sampled households. The average monthly income is found to be Rs. 3866 (about $55, using an exchange rate of $1 = Rs 70). Although the income distribution is right-skewed, the majority of the households have a low monthly income. Figure 4 presents the two-way relationship between the percentage of households that adopted LPG and the literacy status of the household heads in the three districts. There is a positive relationship between the literacy level of the household heads and the adoption status. In all three districts, the adoption rate is higher for the literate household heads, whereas illiterate household heads are more likely to use traditional fuels. Figure 5 presents the percentage of households in the three districts, by their occupation, using LPG as cooking fuel. The households are divided into the binary categories of farmers and non-farmers, depending on their primary occupation status. In all the districts, households that have agriculture as their main occupation are more likely to use traditional fuels such as cow dung and paddy residues, while non-farming households are more likely to adopt LPG for cooking.
In the present study, the wealth status of households is captured by the type of house flooring they have. Three types of flooring have been observed—the wealthiest households have tiled flooring followed by semi-pucca (cemented) and kutcha (mud) floorings. Figure 6 presents the households’ choice of LPG for cooking by their wealth status, as revealed by their house flooring. Households with kutcha and semi-pucca flooring tend to use traditional fuels, while the households equipped with better infrastructure (tiled flooring) adopted LPG as the energy source for cooking. Though the self-help groups (SHGs) are well established in the rural areas in India, only 40% of the households in our study area were members of such groups. Figure 7 presents the households’ choice of LPG by their membership status in SHGs. Results show that a higher proportion of households that are not part of the SHGs continued to use traditional fuels. This may be due to the role of social capital that helps disseminate information and creates a peer effect. Members are more likely to be influenced by other members and thus adopt cleaner fuel as compared with non-members.
Table 3 shows that the average monthly income of the households is Rs. 3866, with a minimum income of Rs. 300 and a maximum of Rs. 21,834. The average landholding of the respondents is 2.47 acres, meaning predominantly the small-scale and marginal farmers. The accessibility proxy variable, distance to the nearest hospital, shows significant heterogeneity among the households, with an average distance being 9 km from homestead to the hospital, the minimum distance being less than 1 km, and the maximum being 34 km.

4.3. Determinants of LPG Adoption under PMUY

Table 4 presents the binomial probit regression results of the adoption decision model. The results corroborate the hypotheses laid out in the theoretical framework. An increase in income positively affects an average household’s decision to adopt LPG as an energy source for cooking. Although some of the past studies show a negative relation between household head’s age and the decision to use modern fuel [19,20], our findings observe the opposite effect. The negative relation between household head’s age and adoption of clean energy is observed in the African countries [20]. The age of the household head positively influences the decision to adopt LPG as a source of cooking fuel. The education variable has a statistically significant and positive coefficient, meaning that it has a positive influence on the adoption decision. The household heads with lower education levels preferred to use traditional fuel. The household size is found to have a positive sign as expected from the theoretical framework but is not statistically significant.
The present study uses the spouse’s education level as an additional indicator to test the adoption of LPG fuel, since in developing countries, it is the women who are predominantly engaged in cooking. Though the variable has a positive sign, it is not statistically significant. Household wealth status is a key determinant in the choice of cooking fuel. Existing studies have used proxy variables such as type of toilets, ownership of four-wheeled vehicles, or cattle to represent the wealth status of a household [4,17]. In India, since toilet facility construction is subsidized by the government, it does not fully represent the wealth status of a household. Hence, the present study uses alternative proxy variables such as the type of flooring and availability of a separate room for cooking to measure the wealth status. The results indicate that households with a better-equipped house have a higher probability of shifting to modern fuels. Similarly, we found that households that have a separate room for cooking have a higher probability of moving away from traditional fuels. Conversely, impoverished houses with no separate room for cooking are less likely to adopt modern fuels for cooking.
Employment plays a significant role in the adoption of modern fuels. Daily wage laborers tend to use fuelwood as their energy choice for cooking, whereas households involved in non-farm activities tend to adopt LPG as their cooking source [17]. Access to traditional types of fuel does not involve monetary costs. The crop residue or cow dung or firewood are freely accessible to rural households, which reduces their incentive to switch to a modern fuel. In this regard, we employ variables such as household occupation and farmland owned by a household to understand the probability of farmers’ switching strategy to modern fuel. The coefficient of a household employed in farm activities is negative but statistically insignificant. However, findings from the farmland owned by households support the previous propositions. Farmers have less tendency to shift to modern fuel sources as the traditional fuel sources are easily available, with a negligible monetary cost. Awareness on the merits of employing modern fuel and knowledge about government interventions plays a significant role in the adoption of modern technology within rural society [31].
Self-help groups have played a vital role in promoting socio-economic welfare among rural households. The results in Table 4 indicate that if any individual in a household is a member of an SHG, then it increases that household’s probability of adopting LPG as a source of fuel for cooking. The role of SHGs can be pivotal in improving the reach of government schemes in rural households. Accessibility to cooking fuel is a major constraint in the switch towards modern fuels, as traditional fuels (firewood) are abundantly available in rural society. To identify the access to modern sources of energy, we use a proxy variable, namely distance to the nearest hospital from the homestead. The distance to the nearest hospital appears with a negative sign, indicating that a long distance to the hospital reduces the probability of adopting LPG.
The energy ladder hypothesis that explains the dynamics of the shift from fuelwood to electricity is well accounted for in literature [2,3]. The present study focuses on an alternative specification for the energy ladder hypothesis to understand the success of the central government scheme ‘Pradhan Mantri Ujjwala Yojana’ (PMUY) in India and explores the determinants that lead to adoption of the PMUY scheme. As discussed earlier, the PMUY scheme has made a significant effort in modernizing the rural kitchen by providing subsidies to purchase an LPG connection. However, the success of the scheme needs to be evaluated beyond the acquisition of the LPG connection. As we show in Table 1 and Table 2, a rapid growth of LPG adoption has been witnessed in rural societies, while the post-sales or refills remain stagnant. This may act as a challenge for policy intervention in the future as the usage of LPG is limited among the households. In this regard, we use an ordered probit model, where the dependent variable is ordered on three levels: 1 with no LPG connection and employing traditional fuel (no transition to LPG); 2 for the households which employ LPG as a secondary source of fuel for cooking (partial transition to LPG); and 3 for households which employ LPG as the primary fuel source for cooking (full transition to LPG).
Table 5 presents the ordered probit model results. Though the results are similar to the binomial probit model, the marginal effects presented in Table 6 explain the impact of the independent variables effectively. Results from the marginal effects explain the difference in the effect of the independent variables for each of the ordered dependent variables. An increase in household income will lead to higher adoption of LPG and reduce the use of traditional fuel for cooking purposes. The present study supports the proposition that older households are more likely to adopt modern fuel and forego the use of traditional fuel for cooking [17]. The likelihood of adopting LPG increases with the increase in the level of education.
Higher household size increases the probability of adopting LPG and reduces the dependency on traditional fuel usage. Similar results are found when spouse’s schooling is used to represent the education level of females in the household. The marginal effects of household wealth status, which was measured using the type of house and availability of a separate room for the kitchen, indicate a positive influence on LPG consumption and a negative one on traditional fuel. Interestingly, individual households involved in farming and owning a higher amount of farmland display a negative sentiment on adopting LPG fuel. The possible reason could be that farming produces crop residue and alternative produce such as dung cake, and these act as the main fuel for cooking. However, knowledge on air pollutants and possible environmental health risks in developing countries is limited among farmers [32,33]. The demographic feasibility of accessing modern fuel differentiates the role of a households’ choice of energy use. Households closer to the hospital have higher chances of using LPG fuel while the farther the distance to a hospital, the more there is a likelihood of using traditional fuel. The likelihood of households adopting modern fuel increases if they are enrolled in SHGs and decreases otherwise. The binomial probit models are robust as the re-estimated ordered probit model and their marginal coefficients are consistently significant.
Overall, the study has identified several determinants which play a prominent role in improving the effective adoption and continued usage of LPG as a cooking source. Income and education levels have been the key drivers behind the adoption decision of modern fuel for cooking. Promoting education and enhancing the income level would induce rural households to shift completely from traditional fuel usage. Further, although the role of gender has been investigated in the past, a thorough investigation of the education level of female household members needs to be considered for better policy interventions. The major limitation for farmers to shift from the traditional sources of cooking is that they are habituated to the firewood cooking method, irrespective of their income. Additionally, easy accessibility to crop residue and dung cake with zero monetary cost induces households to continue to follow the traditional cooking style. To improve the policy effectiveness, awareness has to be created by SHGs, which have the potential to conduct activities that create greater awareness among households and significantly promote the transition towards clean cooking fuel. The accessibility and availability of modern fuel is an important dimension for the adoption and prolonged usage of LPG [34]. The government should focus on the availability of LPG cylinders to the last mile and frame targets among the distributors to push the LPG cylinders. However, the recent COVID 19 pandemic outbreak is certain to cause additional stress to the existing crisis in the rural economy. This crisis will further impede the adoption of clean energy in the rural economy and hinder the LPG refill rate among PMUY users.

5. Conclusions

‘Pradhan Mantri Ujjwala Yojana’ (PMUY), the flagship program of the Government of India under the Ministry of Petroleum and Natural Gas, launched in 2016, aims to provide subsidized LPG connection to households below the poverty line. The present study analyzed the adoption rates and patterns of refill status under the PMUY scheme in various states of India. The findings show that the adoption of LPG gas under the PMUY has encouraged rural households to shift to cleaner energy. The states that have higher rates of LPG connections under the scheme are the ones that have a higher level of energy poverty as well. Though the rate of adoption is high, the frequency of consumption/refill is low. The annual average refill purchase per beneficiary household is between one and two cylinders at the national level. The gap between the adoption and refill indicates continued usage of solid fuels. For effective interventions to ensure the success of the scheme, the program should focus on a full transition from polluting fuels. We suggest that policy makers should frame suitable measures to increase the consumption of clean energy among rural households. The common challenges faced by the rural households include lack of knowledge on the documentation requirements and inadequate information on the capital subsidy as part of the intervention program. A full transition towards LPG use requires awareness campaigns through SHGs to disseminate information on the benefits of clean energy and an enhanced subsidy program, possibly through cash transfer to beneficiaries that are conditional upon LPG refill, for a longer period. The future scope of the study can focus refill patterns at local to regional scale among PMUY beneficiaries with inclusion of socio-demographical characteristics. Further, this study can be expanded to other energy poverty regions to understand the mechanism of clean energy adoption.

Author Contributions

Conceptualization, R.K., P.R.J. and S.M.; methodology, formal analysis, R.K. and P.R.J.; resources, writing—original draft preparation, R.K. and P.R.J.; writing—review and editing, R.K., P.R.J. and S.M. All authors have read and agreed to the published version of the manuscript.

Funding

This research received funding from the Scheme for Promotion of Academic and Research Collaboration (SPARC), Ministry of Human Resource Development, Government of India [Proposal ID–302].

Informed Consent Statement

Informed consent was obtained from all subjects involved in the study.

Data Availability Statement

The data are available on request.

Acknowledgments

We duly acknowledge the excellent technical support provided by Sunil Khosla, and Loshini to complete this manuscript.

Conflicts of Interest

The authors declare no conflict of interest.

References

  1. WEO. Energy Access Outlook 2017: From Poverty to Prosperity; International Energy Agency: Paris, France, 2017. [Google Scholar]
  2. Baiyegunhi, L.J.S.; Hassan, M.B. Rural household fuel energy transition: Evidence from Giwa LGA Kaduna State, Nigeria. Energy Sustain. Dev. 2014, 20, 30–35. [Google Scholar] [CrossRef]
  3. Rahut, D.B.; Das, S.; De Groote, H.; Behera, B. Determinants of household energy use in Bhutan. Energy 2014, 69, 661–672. [Google Scholar] [CrossRef]
  4. Rahut, D.B.; Behera, B.; Ali, A. Factors determining household use of clean and renewable energy sources for lighting in Sub-Saharan Africa. Renew. Sustain. Energy Rev. 2017, 72, 661–672. [Google Scholar] [CrossRef]
  5. Mensah, J.T.; Adu, G. An empirical analysis of household energy choice in Ghana. Renew. Sustain. Energy Rev. 2015, 51, 1402–1411. [Google Scholar] [CrossRef]
  6. Lay, J.; Ondraczek, J.; Stoever, J. Renewables in the energy transition: Evidence on solar home systems and lighting fuel choice in Kenya. Energy Econ. 2013, 40, 350–359. [Google Scholar] [CrossRef] [Green Version]
  7. Chakravorty, S.; Chandrasekhar, S.; Naraparaju, K. Land distribution, income generation and inequality in India’s agricultural sector. Rev. Income Wealth 2019, 65, S182–S203. [Google Scholar] [CrossRef]
  8. Quinn Ashlinn, K.; Bruce, N.; Puzzolo, E.; Dickinson, K.; Sturke, R.; Jack, D.W.; Mehta, S.; Shankar, A.; Sherr, K.; Rosenthal, J.P. An analysis of efforts to scale up clean household energy for cooking around the world. Energy Sustain. Dev. 2018, 46, 1–10. [Google Scholar] [CrossRef]
  9. Nakhooda, S. Asia, the multilateral development banks and energy governance. Glob. Policy 2011, 2, 120–132. [Google Scholar] [CrossRef]
  10. Gangopadhyay, S.; Ramaswami, B.; Wadhwa, W. Reducing subsidies on household fuels in India: How will it affect the poor? Energy Policy 2005, 33, 2326–2336. [Google Scholar] [CrossRef]
  11. Dabadge, A.; Sreenivas, A.; Josey, A. What has the Pradhan Mantri Ujjwala Yojana achieved so far? Econ. Political Wkly. 2018, 53, 69–75. [Google Scholar]
  12. Kar, A.; Pachauri, S.; Bailis, R.; Zerriffi, H. Using sales data to assess cooking gas adoption and the impact of India’s Ujjwala programme in rural Karnataka. Nat. Energy 2019, 4, 806–814. [Google Scholar] [CrossRef]
  13. Masera, O.R.; Saatkamp, B.D.; Kammen, D.M. From linear fuel switching to multiple cooking strategies: A critique and alternative to the energy ladder model. World Dev. 2000, 28, 2083–2103. [Google Scholar] [CrossRef]
  14. Sharma, A.; Parikh, J.; Singh, C. Transition to LPG for cooking: A case study from two states of India. Energy Sustain. Dev. 2019, 51, 63–72. [Google Scholar] [CrossRef]
  15. Swain, S.S.; Mishra, P. Determinants of adoption of cleaner cooking energy: Experience of the Pradhan Mantri Ujjwala Yojana in rural Odisha. India. J. Clean. Prod. 2020, 248, 119223. [Google Scholar] [CrossRef]
  16. Ekholm, T.; Krey, V.; Pachauri, S.; Riahi, K. Determinants of household energy consumption in India. Energy Policy 2010, 38, 5696–5707. [Google Scholar] [CrossRef]
  17. Rahut, D.B.; Behera, B.; Ali, A. Patterns and determinants of household use of fuels for cooking: Empirical evidence from sub-Saharan Africa. Energy 2016, 117, 93–104. [Google Scholar] [CrossRef]
  18. Rao, M.N.; Reddy, B.S. Variations in energy use by Indian households: An analysis of micro level data. Energy 2007, 32, 143–153. [Google Scholar] [CrossRef]
  19. Farsi, M.; Filippini, M.; Pachauri, S. Fuel choices in urban Indian households. Environ. Dev. Econ. 2007, 12, 757–774. [Google Scholar] [CrossRef] [Green Version]
  20. Guta, D.D. Application of an almost ideal demand system (AIDS) to Ethiopian rural residential energy use: Panel data evidence. Energy Policy 2012, 50, 528–539. [Google Scholar] [CrossRef]
  21. Lewis, J.J.; Pattanayak, S.K. Who adopts improved fuels and cookstoves? A systematic review. Environ. Health Perspect. 2012, 20, 637–645. [Google Scholar] [CrossRef]
  22. Pandey, V.L.; Chaubal, A. Comprehending household cooking energy choice in rural India. Biomass Bioenergy 2011, 35, 4724–4731. [Google Scholar] [CrossRef]
  23. Özcan, K.M.; Gülay, E.; Üçdogruk, S. Economic and demographic determinants of household energy use in Turkey. Energy Policy 2013, 60, 550–557. [Google Scholar] [CrossRef]
  24. Link, C.F.; Axinn, W.G.; Ghimire, D.J. Household energy consumption: Community context and the fuelwood transition. Soc. Sci. Res. 2012, 41, 598–611. [Google Scholar] [CrossRef] [Green Version]
  25. Khosla, S.; Jena, P.R. Switch in livelihood strategies and social capital have a role to play in deciding rural poverty dynamics: Evidence from panel data analysis from eastern India. J. Asian Afr. Stud. 2020, 55, 76–94. [Google Scholar] [CrossRef]
  26. Pachauri, S.; Mueller, A.; Kemmler, A.; Spreng, D. On measuring energy poverty in Indian households. World Dev. 2004, 32, 2083–2104. [Google Scholar] [CrossRef]
  27. Khandker, S.R.; Barnes, D.F.; Samad, H.A. Are the energy poor also income poor? Evidence from India. Energy Policy 2012, 47, 1–12. [Google Scholar] [CrossRef]
  28. Behera, B.; Rahut, D.; Jeetendra, A.; Ali, A. Household collection and use of biomass energy sources in South Asia. Energy 2005, 85, 468–480. [Google Scholar] [CrossRef]
  29. Sadath, A.C.; Acharya, R.H. Assessing the extent and intensity of energy poverty using multidimensional energy poverty index: Empirical evidence from households in India. Energy Policy 2017, 102, 540–550. [Google Scholar] [CrossRef]
  30. Abhishek, K.; Pachauri, S.; Bailis, R.; Zerriffi, H. Capital cost subsidies through India’s Ujjwala cooking gas programme promote rapid adoption of liquefied petroleum gas but not regular use. Nat. Energy 2020, 5, 125–126. [Google Scholar]
  31. Patil, R.; Roy, S.; Gore, M.; Ghorpade, M.; Pillarisetti, A.; Chakma, J.; Juvekar, S. Barriers to and facilitators of uptake and sustained use of LPG through the PMUY in tribal communities of Pune district. Energy Sustain. Dev. 2021, 63, 1–6. [Google Scholar] [CrossRef]
  32. Sidhu, M.K.; Ravindra, K.; Mor, S.; John, S. Household air pollution from various types of rural kitchens and its exposure assessment. Sci. Total Environ. 2017, 586, 419–429. [Google Scholar] [CrossRef] [PubMed]
  33. Harrell, B.S.; Pillarisetti, A.; Roy, S.; Ghorpade, M.; Patil, R.; Dhongade, A.; Smith, K.R.; Levine, D.I.; Juvekar, S. Incentivizing Elimination of Biomass Cooking Fuels with a Reversible Commitment and a Spare LPG Cylinder. Environ. Sci. Technol. 2020, 54, 5313–15319. [Google Scholar] [CrossRef] [PubMed]
  34. Malakar, Y.; Day, R. Differences in firewood users’ and LPG users’ perceived relationships between cooking fuels and women’s multidimensional well-being in rural India. Nat. Energy 2020, 5, 1022–1031. [Google Scholar] [CrossRef]
Figure 1. Percentage of source-wise fuel used for cooking among sample households.
Sustainability 14 02450 g001
Figure 2. Percentage of district-wise and source-wise energy used for cooking among sample households.
Sustainability 14 02450 g002
Figure 3. Monthly income of the sampled households.
Sustainability 14 02450 g003
Figure 4. Percentage of households’ choice of LPG by education status of household head in the three districts.
Sustainability 14 02450 g004
Figure 5. Percentage of household’s choice of LPG by occupation in the three districts.
Sustainability 14 02450 g005
Figure 6. Percentage of households’ choice of LPG by type of flooring in the three districts.
Sustainability 14 02450 g006
Figure 7. Percentage of households’ choice of LPG by membership in SHGs in the three districts.
Sustainability 14 02450 g007
Table 1. The year-wise LPG connection and cumulative year-wise increase in LPG connection under the PMUY for major states in India (in Millions).
No. of LPG Connections under PMUYYear-Wise Increase in Connections under PMUY
State/UT2016–20172017–20182018–20192019–20202017–20182018–20192019–2020
Uttar Pradesh5.5310.9556.4771.8176.4861.296314.78
West Bengal2.522.5363.0060.8115.0578.0628.874
Bihar2.4772.4362.9820.6724.9137.8958.567
Madhya Pradesh2.241.0753.1310.7333.3156.4467.179
Rajasthan1.7230.9033.070.6962.6265.6966.392
Odisha1.0121.2881.9260.5232.34.2264.749
Maharashtra0.8591.0192.1860.3731.8774.0644.436
Jharkhand0.5370.6671.7010.3851.2042.9053.29
Tamil Nadu0.2730.7452.1240.1011.0183.1423.243
Karnataka0.0160.8931.9140.3260.9092.8233.149
Chhattisgarh1.1050.8470.7410.3061.9522.6932.998
Gujarat0.7520.5171.2520.3871.2692.5212.908
Jammu and Kashmir0.2660.1070.680.1770.3731.0531.23
Punjab0.2450.1370.8270.0160.3821.2091.225
TelanganaNANA0.9240.151NANA1.075
Haryana0.2790.0780.3230.0510.3570.680.731
Uttarakhand0.1140.0240.2150.0520.1370.3530.405
Andhra Pradesh0.0630.0170.2630.0480.080.3430.391
Kerala0.0110.0270.1720.0460.0380.210.256
Himachal Pradesh0.0020.0280.0830.0230.030.1130.136
Note: Authors’ calculation based on data available at www.data.gov.in (accessed on 10 August 2021).
Table 2. The year-wise LPG refill (in millions) and average annual refill per household under the PMUY for major states in India.
Total No. of Refill Consumption of PMUY Beneficiaries (in Millions)Average Annual Refill Consumption per PMUY Beneficiary
State/UT2017–20182018–20192019–20202017–20182018–20192019–2020
Andhra Pradesh0.2480.3300.7333.100.961.88
Bihar14.59312.60114.4392.971.601.69
Chhattisgarh2.5722.1263.1711.320.791.06
Gujarat4.3403.9934.4323.421.581.52
Haryana1.7881.6991.4905.012.502.04
Himachal Pradesh0.0750.1900.2862.521.692.10
Jammu and Kashmir0.9551.1451.8372.561.091.49
Jharkhand2.3633.0404.7161.961.051.43
Karnataka1.9953.2845.4482.191.161.73
Kerala0.0930.2840.4782.421.351.87
Madhya Pradesh6.5346.7429.8081.971.051.37
Maharashtra4.6885.5967.3252.501.381.65
Odisha5.2294.8957.7262.271.161.63
Punjab1.4202.3452.4343.711.941.99
Rajasthan7.5407.48010.1632.871.311.59
Tamil Nadu2.3904.9055.8292.351.561.80
Telangana0.000.7581.765NANA1.64
Uttar Pradesh21.31219.02425.8123.291.471.75
Uttarakhand0.5960.6440.7304.341.831.80
West Bengal13.35110.99716.5222.641.361.86
Note: Authors’ calculation based on data available at www.data.gov.in (accessed on 10 August 2021).
Table 3. Summary statistics of key variables.
VariableMeanStd. Dev.MinMax
Household size in numbers 4.872.00112
HH head’s age in numbers43.4614.491890
HH head’s schooling in Years3.323.87015
Distance to hospital in kilometers 9.268.920.135
Spouse’s schooling in years 1.913.46012
Income in Rupees 3866.022512.7730021,834
Land in acres 2.474.84035
Source: Authors’ computation.
Table 4. Results of binomial probit model.
Explanatory Variables Coef.Z-Statp-Value
Intercept −3.487 ***−3.180.001
Log monthly income0.259 *1.80.072
Age of household0.009 *1.90.058
Education of household head (Years)0.059 ***2.880.004
HH size0.0401.140.255
Spouse’s education (Years)0.0170.780.435
Type of house0.252 ***2.560.01
Separate room for cooking0.299 *1.820.069
Occupation−0.115−0.860.388
Land size−0.034 **−2.220.027
Member of SHG0.400 ***2.980.003
Distance to hospital−0.037 ***−4.220.000
Number of observations479
Prob > chi20.000
Pseudo R20.1606
Source: Authors’ estimation using primary data. Note: ***, **, and * indicate statistical significance at 1%, 5%, and 10% respectively.
Table 5. Results of the ordered probit model.
Explanatory Variable Coef.Z-Statp-Value
Log monthly income0.238 **1.90.068
HH head’s age0.012 **2.540.011
HH head’s schooling0.072 ***3.9250.000
HH size0.0320.960.338
Spouse’s schooling0.0120.610.540
Type of house0.216 **2.360.018
Separate room for cooking0.2321.570.116
Occupation−0.131−1.070.285
Land size−0.03−2.090.036
Member of SHG0.384 ***3.050.002
Distance to Hospital−0.027 ***−3.340.001
Number of observations479
Prob > chi20.00
Pseudo R20.111
Source: Authors’ own estimation using primary data. Note: *** and ** indicates statistical significance at 1% and 5% respectively.
Table 6. Results of ordered probit model (marginal effects).
VariableCoef. (1)Coef. (2)Coef. (3)
Log monthly income−0.093 *
(0.050)
0.023 *
(0.012)
0.070 *
(0.039)
HH head’s age−0.005 ***
(0.001)
0.001 **
(0.0005)
0.003 **
(0.001)
HH head’s schooling−0.028 ***
(0.007)
0.007 ***
(0.002)
0.021 ***
(0.005)
HH size−0.012
(0.012)
0.003
(0.003)
0.009
(0.009)
Spouse’s schooling−0.005
(0.007)
0.001
(0.001)
0.004
(0.005)
Type of house−0.084
(0.035)
0.021 **
(0.009)
0.064 **
(0.027)
Separate room for cooking−0.091
(0.585)
0.020 *
(0.011)
0.072
(0.048)
Occupation0.051
(0.047)
−0.013
(0.012)
−0.039
(0.036)
Land size0.012 ***
(0.005)
−0.003 **
(0.001)
−0.009 **
(0.004)
Member of SHG−0.148 ***
(0.047)
0.038 ***
(0.014)
0.110 ***
(0.034)
Distance to Hospital0.010 ***
(0.003)
−0.003 ***
(0.0008)
−0.008 ***
(0.002)
Note: ***, **, and * indicate statistical significance at 1%, 5% and 10% respectively.
Publisher’s Note: MDPI stays neutral with regard to jurisdictional claims in published maps and institutional affiliations.

