Figure 1.
Interdependence of internal and external factors on localities. Source: Canva processing.
Figure 1.
Interdependence of internal and external factors on localities. Source: Canva processing.
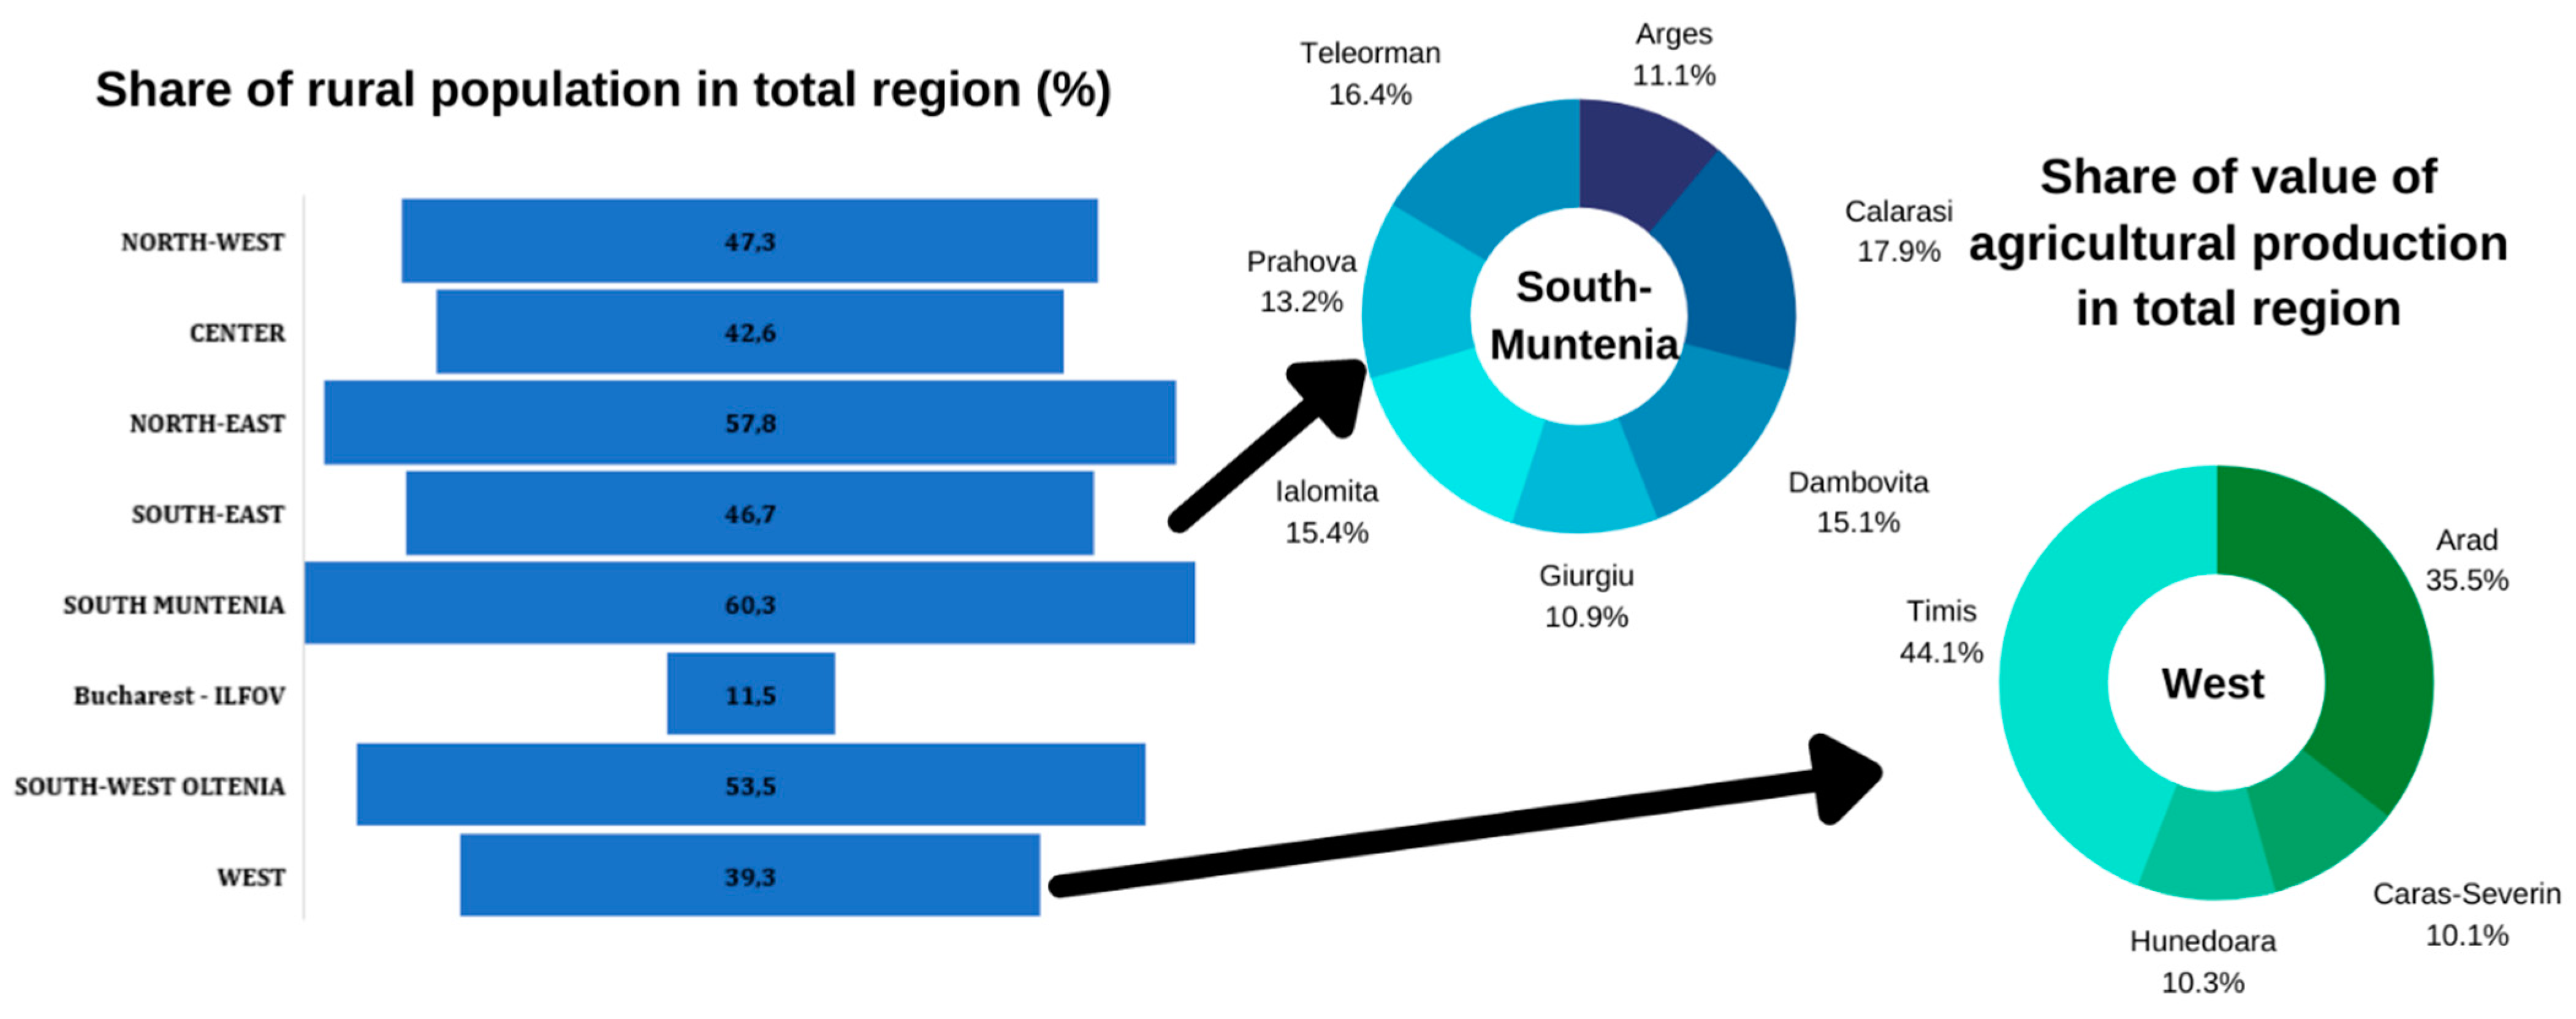
Figure 2.
Relevant aspects concerning the focus of the study on these regions. Source: data processing INS through the Canva program.
Figure 2.
Relevant aspects concerning the focus of the study on these regions. Source: data processing INS through the Canva program.
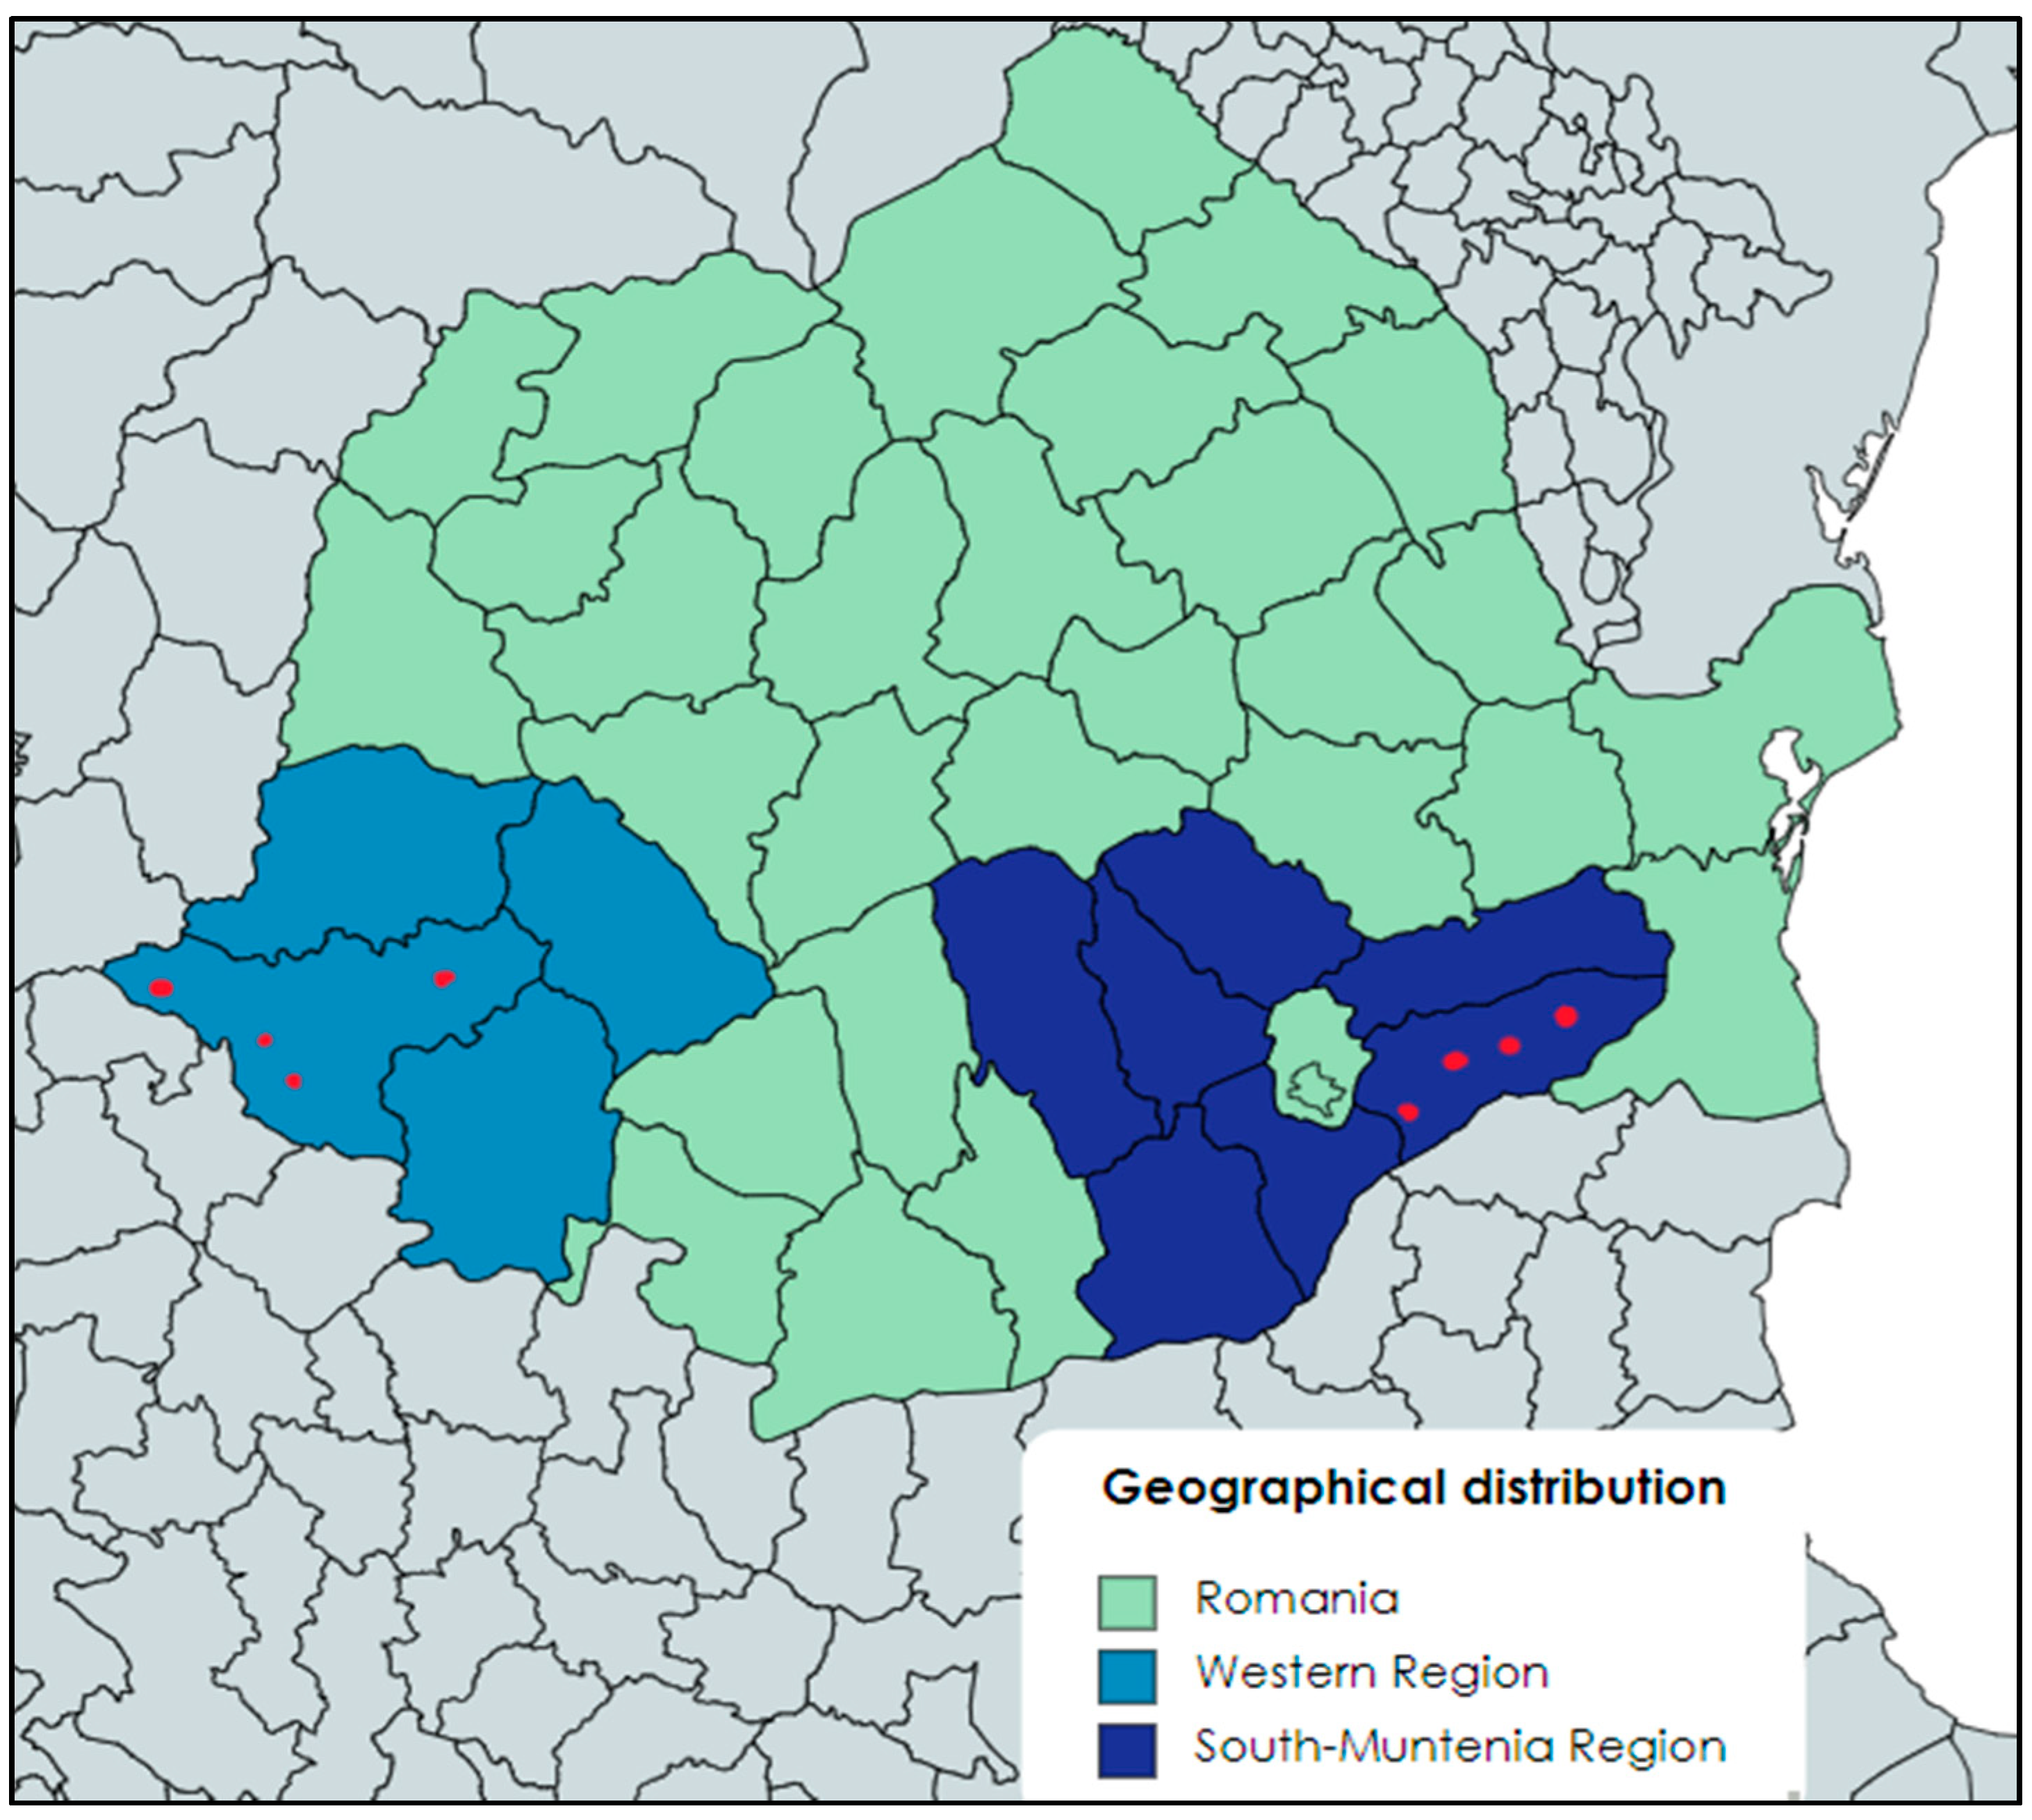
Figure 3.
Territorial distribution of the analyzed localities. Source: geographical distribution using the MapChart application.
Figure 3.
Territorial distribution of the analyzed localities. Source: geographical distribution using the MapChart application.
Figure 4.
The relationship established between the variables through the Vensim simulation program. Source: data processing from the local authorities.
Figure 4.
The relationship established between the variables through the Vensim simulation program. Source: data processing from the local authorities.
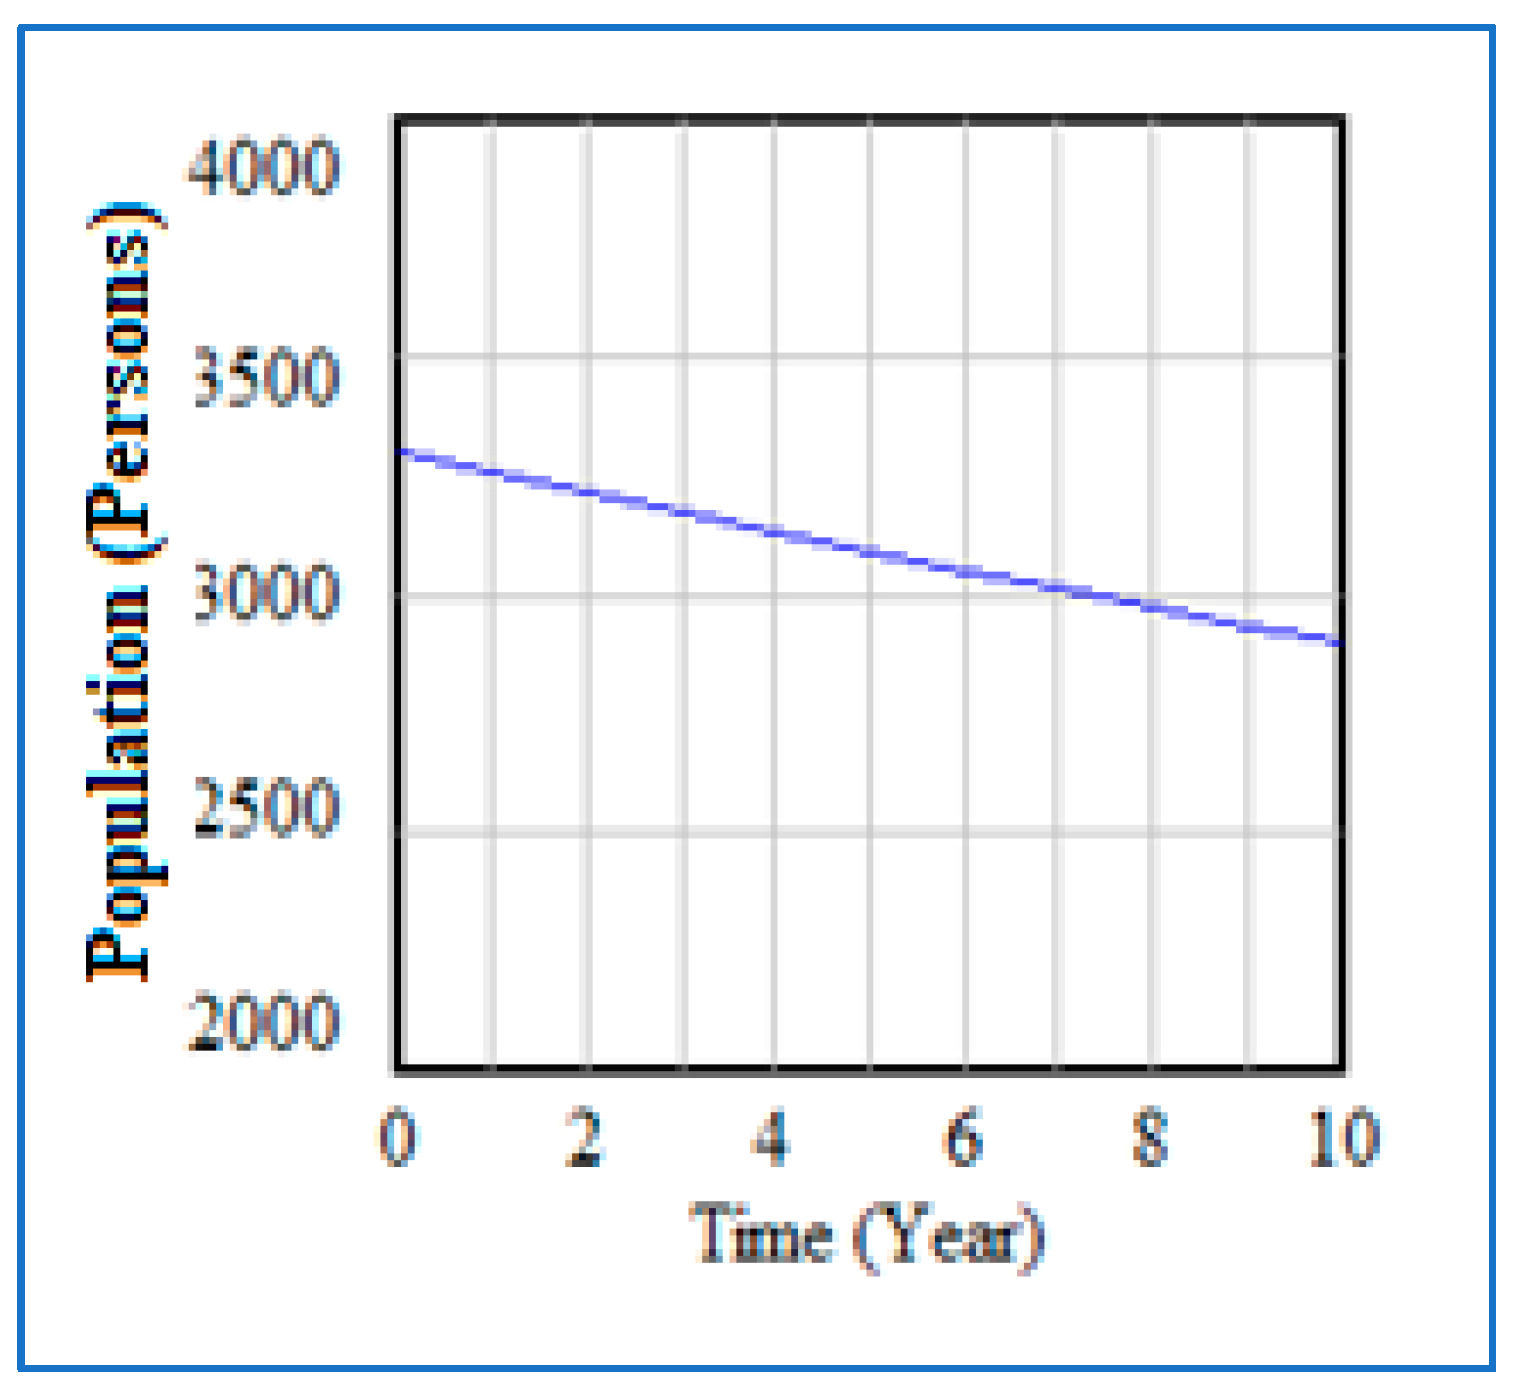
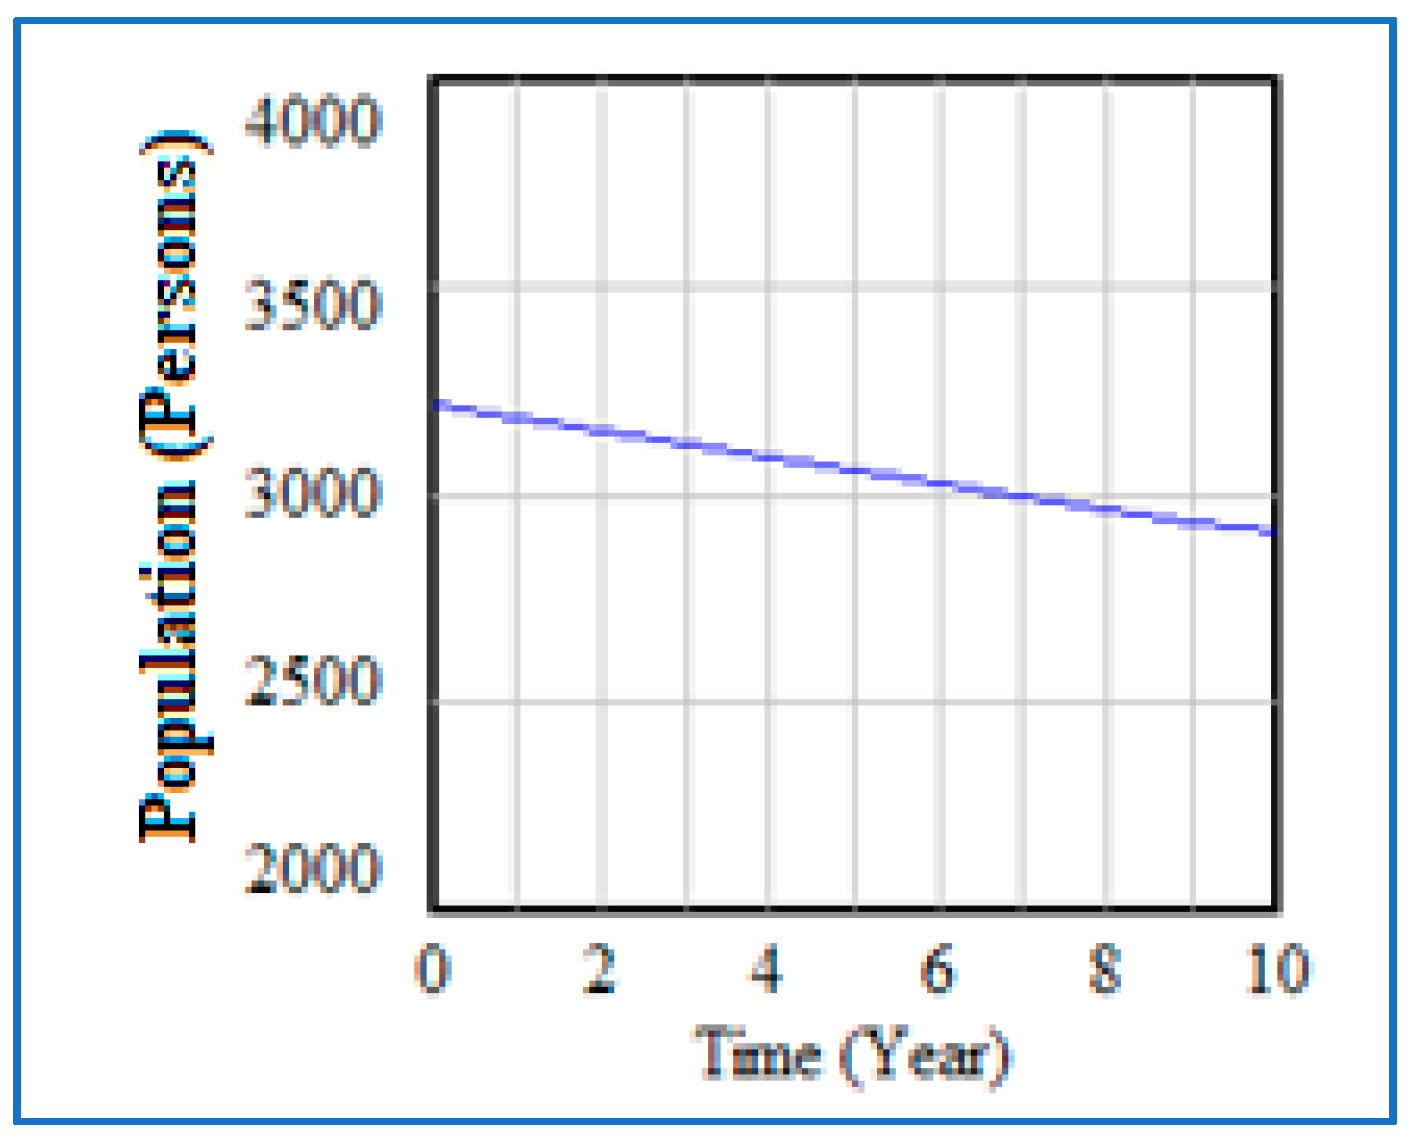
Figure 5.
The result of the simulation regarding the evolution of the population in Dragalina over a period of 10 years. Source: data processing from the local authorities.
Figure 5.
The result of the simulation regarding the evolution of the population in Dragalina over a period of 10 years. Source: data processing from the local authorities.
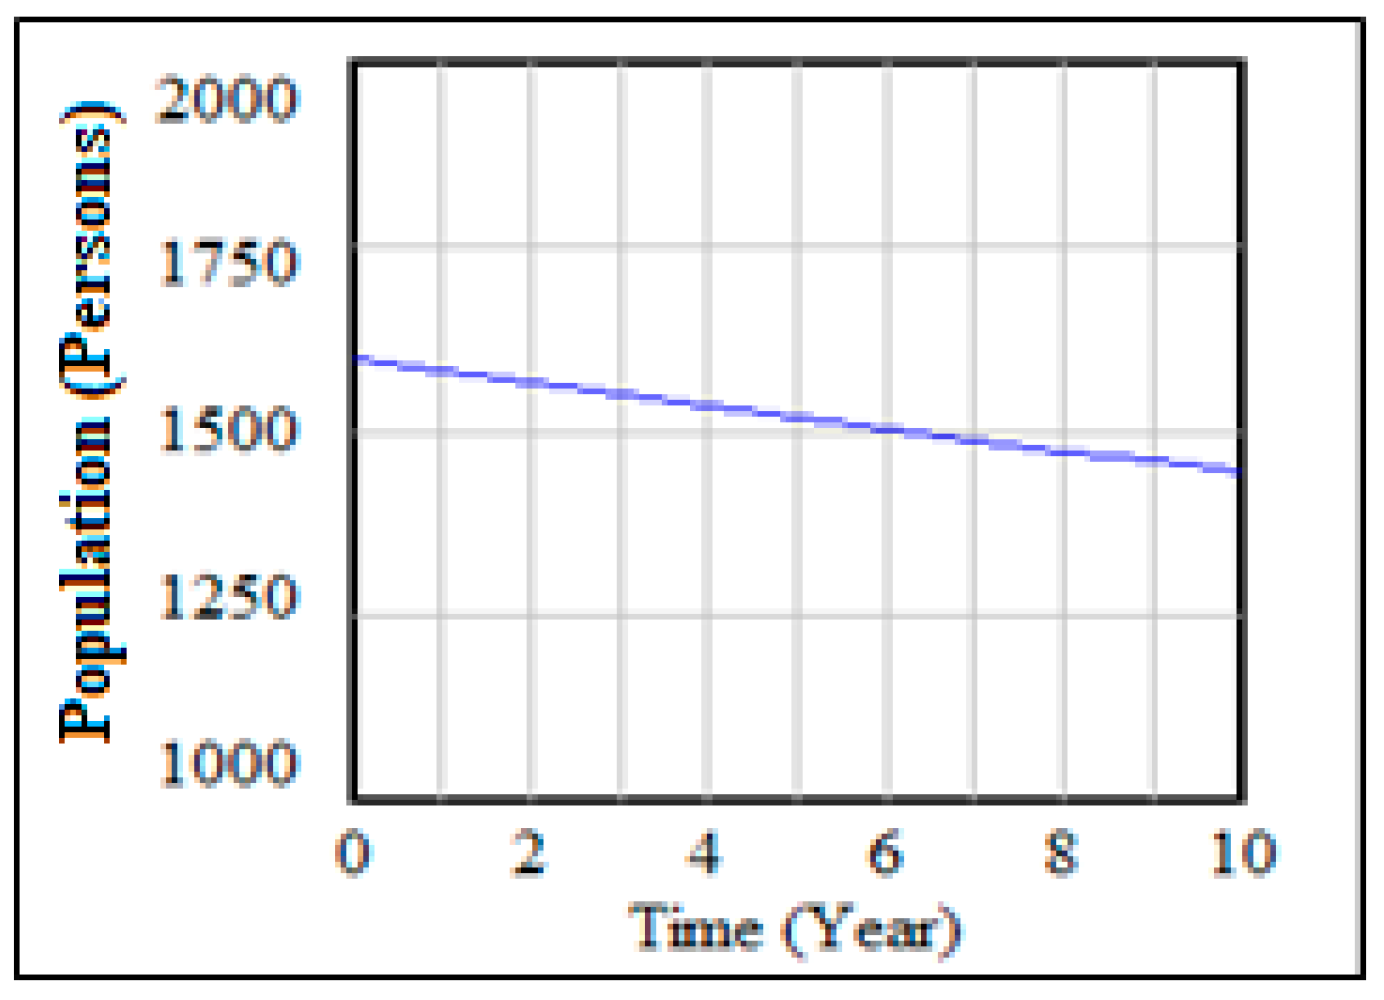
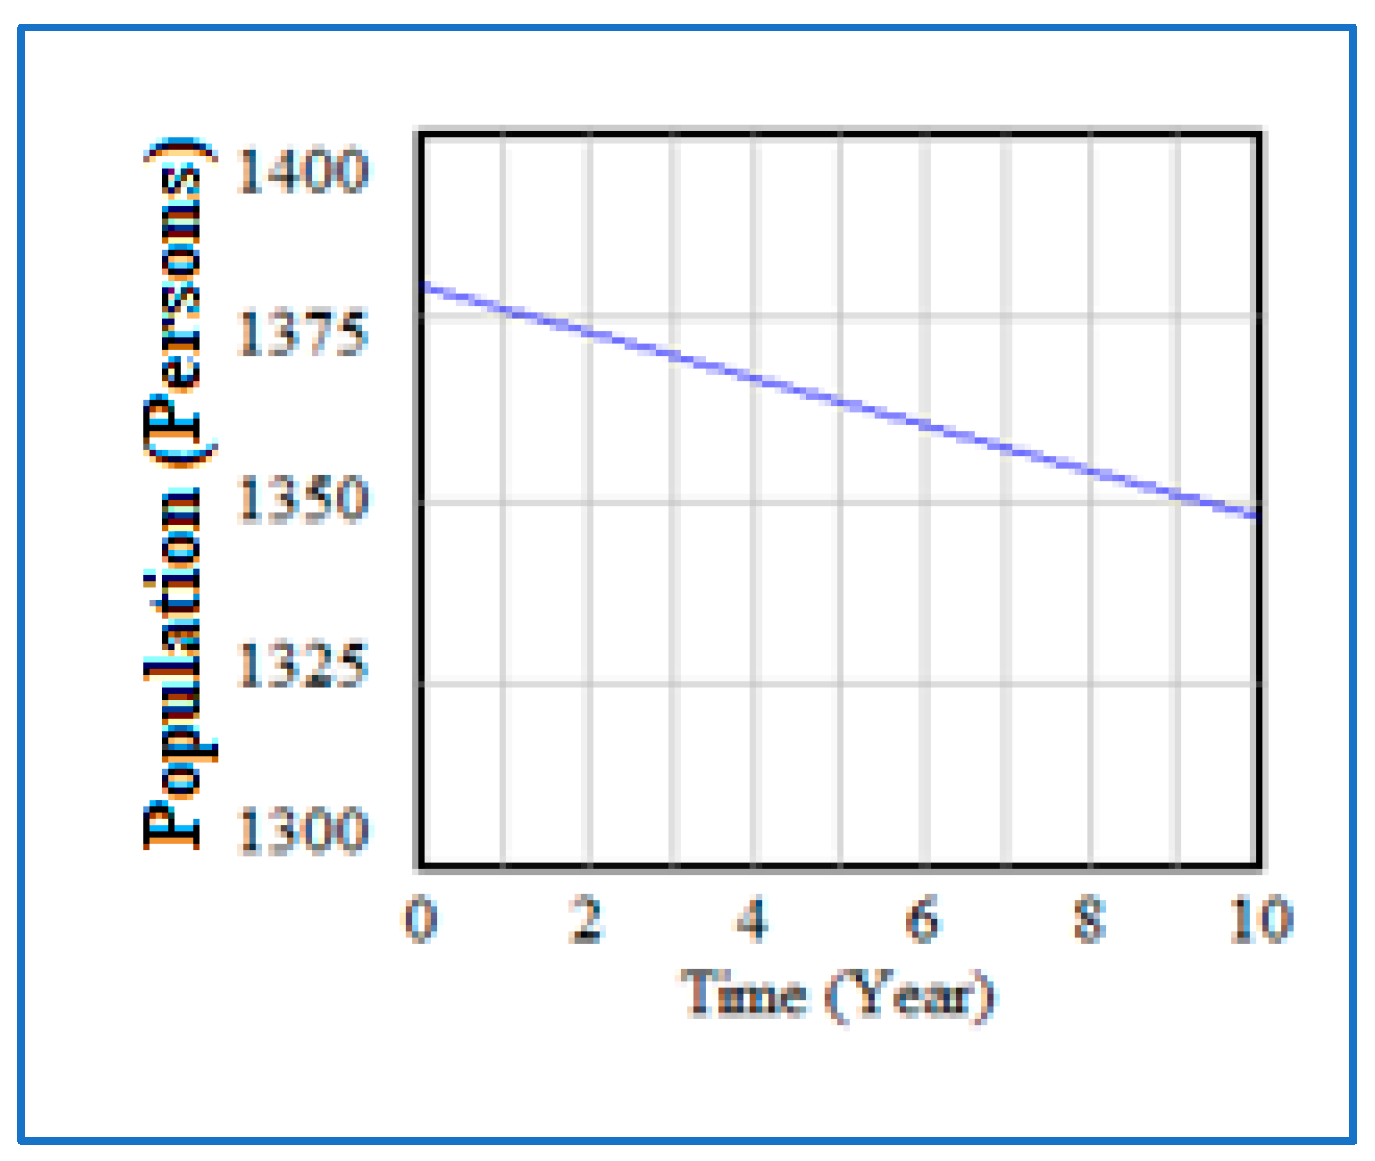
Figure 6.
The result of the simulation regarding the evolution of the population in Nicolae Balcescu for a period of 10 years. Source: data processing from the local authorities.
Figure 6.
The result of the simulation regarding the evolution of the population in Nicolae Balcescu for a period of 10 years. Source: data processing from the local authorities.
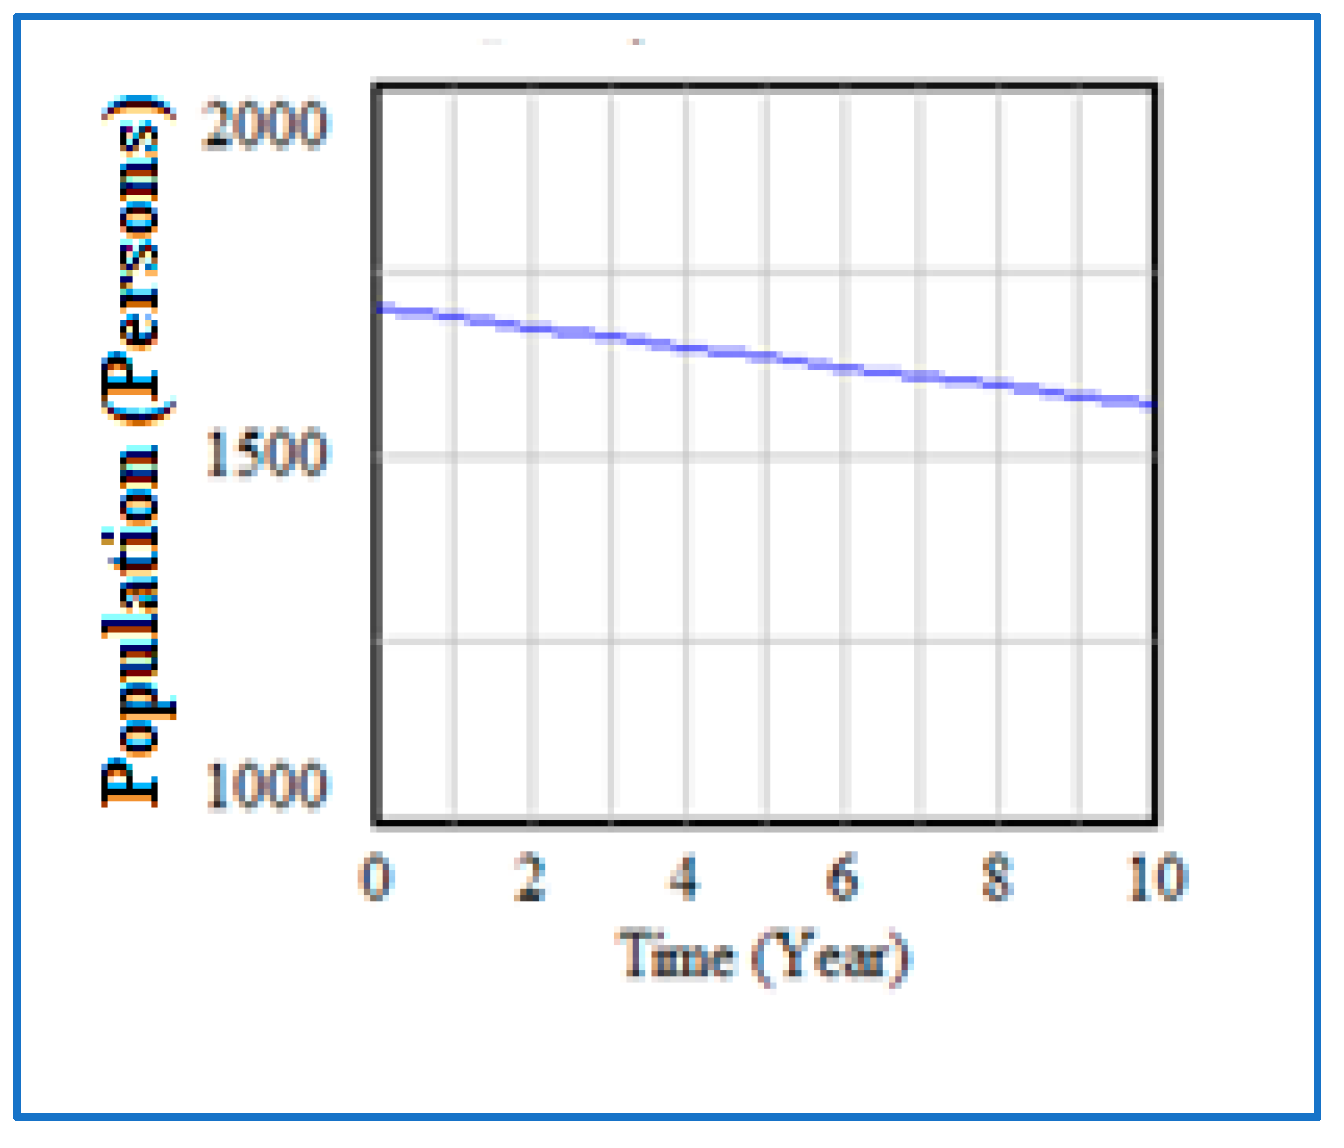
Figure 7.
The result of the simulation regarding the evolution of the population in Soldanu for a period of 10 years. Source: data processing from the local authorities.
Figure 7.
The result of the simulation regarding the evolution of the population in Soldanu for a period of 10 years. Source: data processing from the local authorities.
Figure 8.
The result of the simulation regarding the evolution of the population in Sarulesti for a period of 10 years. Source: data processing from the local authorities.
Figure 8.
The result of the simulation regarding the evolution of the population in Sarulesti for a period of 10 years. Source: data processing from the local authorities.
Figure 9.
The result of the simulation regarding the evolution of the population in Sanmihaiu for a period of 10 years. Source: data processing from the local authorities.
Figure 9.
The result of the simulation regarding the evolution of the population in Sanmihaiu for a period of 10 years. Source: data processing from the local authorities.
Figure 10.
The result of the simulation regarding the evolution of the population in Valcani for a period of 10 years. Source: data processing from the local authorities.
Figure 10.
The result of the simulation regarding the evolution of the population in Valcani for a period of 10 years. Source: data processing from the local authorities.
Figure 11.
The result of the simulation regarding the evolution of the population in Peciu Nou for a period of 10 years. Source: data processing from the local authorities.
Figure 11.
The result of the simulation regarding the evolution of the population in Peciu Nou for a period of 10 years. Source: data processing from the local authorities.
Figure 12.
The result of the simulation regarding the evolution of the population in Fardea for a period of 10 years. Source: data processing from the local authorities.
Figure 12.
The result of the simulation regarding the evolution of the population in Fardea for a period of 10 years. Source: data processing from the local authorities.
Table 1.
The centralizing situation of the answers received from the local authorities.
Table 1.
The centralizing situation of the answers received from the local authorities.
| County | No. Localities to Which Requests Were Sent | No. Localities That Responded to the Request | No. Localities That Did Not Respond | Share of Localities That Responded of the Total (%) |
|---|
| Calarasi | 50 | 19 | 31 | 38.0 |
| Timis | 88 | 35 | 53 | 39.8 |
| Total | 138 | 54 | 84 | 39.1 |
Table 2.
Communes that were selected according to the criteria needed to determine mathematical models.
Table 2.
Communes that were selected according to the criteria needed to determine mathematical models.
| No. Crt. | Locality from Calarasi County | Locality from Timis County |
|---|
| 1 | Dragalina | Sanmihaiu |
| 2 | Nicolae Balcescu | Valcani |
| 3 | Soldanu | Peciu Nou |
| 4 | Sarulesti | Fardea |
Table 3.
Classification of the analyzed localities.
Table 3.
Classification of the analyzed localities.
| No. Crt. | Localities | Distance to Nearest Urban Center (km) | Local Resources |
|---|
| 1 | Dragalina | 22 (Slobozia) | Close to the A2 highway; agricultural land |
| 2 | Nicolae Balcescu | 12,4 (Lehliu-Gara); 70 (Bucharest) | Close to A2 highway; agricultural land; railway access |
| 3 | Soldanu | 20 km (Oltenita); 47 (Bucharest) | Near National Road 4 (access with Bulgaria); agricultural land; railway access; lake (recreation) |
| 4 | Sarulesti | 21 (Fundulea); 26 (Lehliu-Gara) | Near the A2 highway; agricultural land; lake (recreation) |
| 5 | Sanmihaiu | 12 (Timisoara) | Bega river, agricultural land |
| 6 | Valcani | 20 (Sannicolau Mare) | Agricultural land, close to the border with Hungary and Serbia |
| 7 | Peciu Nou | 21 (Timisoara) | Agricultural land, lake (recreation) |
| 8 | Fardea | 90 (Deva); 88 (Timisoara) | Agricultural land, hills, natural lake, cultural buildings |
Table 4.
Analysis of the evolution of the main demographic indicators in Dragalina commune (CL) in the period 2015–2020.
Table 4.
Analysis of the evolution of the main demographic indicators in Dragalina commune (CL) in the period 2015–2020.
| Specification | 2015 | 2016 | 2017 | 2018 | 2019 | 2020 | % | Avr. | Annual Rhythm |
|---|
| Population (no inhabitants) | 8775 | 8629 | 8537 | 8560 | 8427 | 8537 | −2.71 | 8578 | −0.5 |
| Households (no.) | 3303 | 3358 | 3465 | 3444 | 3519 | 3457 | 4.66 | 3424 | 0.9 |
| Birth rate (no. of newborns) | 2 | 1 | 0 | 0 | 1 | 0 | - | 1 | - |
| Mortality (no. deaths) | 84 | 79 | 76 | 75 | 68 | 78 | −7.14 | 77 | −1.5 |
| No. persons receiving social assistance | 209 | 208 | 207 | 172 | 128 | 110 | −47.37 | 172 | −12.0 |
| No. dispensaries/medical units | 4 | 4 | 4 | 4 | 4 | 4 | 0.00 | 4 | 0.0 |
Table 5.
Analysis of the evolution of the main economic indicators in Dragalina commune (CL) in the period 2015–2020.
Table 5.
Analysis of the evolution of the main economic indicators in Dragalina commune (CL) in the period 2015–2020.
| Specification | 2015 | 2016 | 2017 | 2018 | 2019 | 2020 | % | Avr. | Annual Rhythm |
|---|
| Number of economic agents (companies, SRL, PFA, II, etc.), of which: | 212 | 264 | 316 | 368 | 400 | 420 | 98.1 | 330.0 | 14.7 |
| Agricultural profile | 170 | 173 | 181 | 185 | 191 | 197 | 15.9 | 182.8 | 3.0 |
| Tourist units (including agrotourism units) | 0 | 0 | 0 | 0 | 0 | 0 | - | 0.0 | - |
Table 6.
The main indicators, using linear regression, Dragalina commune.
Table 6.
The main indicators, using linear regression, Dragalina commune.
| Model 1 | R | R-Square | Std. Error of the Estimate | F-Change |
| 0.986 | 0.971 | 31.117 | 22.707 |
| Independent variable | B | Std. Error | Beta | t |
| No. deaths | 7.340 | 6.574 | 0.333 | 1.117 |
| Households (no.) | −0.849 | 0.653 | −0.575 | −1.299 |
| Number of economic agents | −0.164 | 0.400 | −0.114 | −0.410 |
Table 7.
Analysis of the evolution of the main demographic indicators in Nicolae Balcescu commune (CL) in the period 2015–2020.
Table 7.
Analysis of the evolution of the main demographic indicators in Nicolae Balcescu commune (CL) in the period 2015–2020.
| Specification | 2015 | 2016 | 2017 | 2018 | 2019 | 2020 | % | Avr. | Annual Rhythm |
|---|
| Population (no inhabitants) | 1631 | 1620 | 1598 | 1584 | 1572 | 1569 | −3.80 | 1596 | −0.8 |
| Households (no.) | 760 | 760 | 771 | 771 | 781 | 785 | 3.29 | 771 | 0.6 |
| Birth rate (no. of newborns) | 18 | 15 | 20 | 19 | 22 | 12 | −33.33 | 18 | −7.8 |
| Mortality (no. deaths) | 29 | 37 | 34 | 31 | 25 | 35 | 20.69 | 32 | 3.8 |
| No. persons receiving social assistance | 41 | 36 | 26 | 16 | 12 | 11 | −73.17 | 24 | −23.1 |
| No. dispensaries/medical units | 1 | 1 | 1 | 1 | 1 | 1 | 0.00 | 1 | 0.0 |
Table 8.
Analysis of the evolution of the main economic indicators in Nicolae Balcescu commune (CL) in the period 2015–2020.
Table 8.
Analysis of the evolution of the main economic indicators in Nicolae Balcescu commune (CL) in the period 2015–2020.
| Specification | 2015 | 2016 | 2017 | 2018 | 2019 | 2020 | % | Avr. | Annual Rhythm |
|---|
| Number of economic agents (companies, SRL, PFA, II, etc.), of which: | 17 | 21 | 22 | 23 | 27 | 27 | 58.8 | 22.8 | 9.7 |
| Agricultural profile | 9 | 13 | 14 | 14 | 14 | 14 | 55.6 | 13.0 | 9.2 |
| Tourist units (including agritourism) | 0 | 0 | 0 | 0 | 0 | 0 | - | - | - |
Table 9.
The main indicators, using linear regression, Nicolae Balcescu commune.
Table 9.
The main indicators, using linear regression, Nicolae Balcescu commune.
| Model 2 | R | R-Square | Std. Error of the Estimate | F-Change |
| 0.999 | 0.999 | 1.541 | 456.226 |
| Independent variable | B | Std. Error | Beta | t |
| Households (no.) | −0.364 | 0.213 | −0.148 | −1.709 |
| Number of socially assisted persons | 1.540 | 0.181 | 0.770 | 8.487 |
| Number of economic agents | −0.625 | 0.578 | −0.094 | −1.082 |
Table 10.
Analysis of the evolution of the main demographic indicators in Soldanu commune (CL) in the period 2015–2020.
Table 10.
Analysis of the evolution of the main demographic indicators in Soldanu commune (CL) in the period 2015–2020.
| Specification | 2015 | 2016 | 2017 | 2018 | 2019 | 2020 | % | Avr. | Annual Rhythm |
|---|
| Population (no inhabitants) | 3280 | 3290 | 3300 | 3300 | 3310 | 3320 | 1.22 | 3300 | 0.2 |
| Households (no.) | 1432 | 1470 | 1491 | 1520 | 1531 | 1544 | 7.82 | 1498 | 1.5 |
| Birth rate (no. of newborns) | 0 | 0 | 0 | 0 | 0 | 0 | - | - | - |
| Mortality (no. deaths) | 59 | 38 | 47 | 46 | 28 | 42 | −28.81 | 43 | −6.6 |
| No. persons receiving social assistance | 190 | 203 | 220 | 240 | 240 | 229 | 20.53 | 220 | 3.8 |
| No. dispensaries/medical units | 1 | 1 | 1 | 1 | 1 | 1 | 0.00 | 1 | 0.0 |
Table 11.
Analysis of the evolution of the main economic indicators in Soldanu commune (CL) in the period 2015–2020.
Table 11.
Analysis of the evolution of the main economic indicators in Soldanu commune (CL) in the period 2015–2020.
| Specification | 2015 | 2016 | 2017 | 2018 | 2019 | 2020 | % | Avr. | Annual Rhythm |
|---|
| Number of economic agents (companies, SRL, PFA, II, etc.), of which: | 80 | 87 | 93 | 117 | 120 | 135 | 68.8 | 105.3 | 11.0 |
| Agricultural profile | 4 | 4 | 4 | 4 | 6 | 6 | 50.0 | 4.7 | 8.4 |
| Tourist units (including agritourism) | - | - | - | - | - | - | - | - | - |
Table 12.
The main indicators, using linear regression, Soldanu commune.
Table 12.
The main indicators, using linear regression, Soldanu commune.
| Model 3 | R | R-Square | Std. Error of the Estimate | F-Change |
| 0.964 | 0.929 | 9.182 | 8.670 |
| Independent variable | B | Std. Error | Beta | t |
| Population (no.) | −0.432 | 1.612 | −0.281 | −0.268 |
| Households (no.) | 0.853 | 0.862 | 1.654 | 0.989 |
| Number of socially assisted persons | −0.495 | 0.867 | −0.464 | −0.571 |
Table 13.
Analysis of the evolution of the main demographic indicators in Sarulesti commune (CL) in the period 2015–2020.
Table 13.
Analysis of the evolution of the main demographic indicators in Sarulesti commune (CL) in the period 2015–2020.
| Specification | 2015 | 2016 | 2017 | 2018 | 2019 | 2020 | % | Avr. | Annual Rhythm |
|---|
| Population (no inhabitants) | 3230 | 3205 | 3201 | 3215 | 3210 | 3221 | −0.28 | 3214 | −0.1 |
| Households (no.) | 1032 | 1025 | 1140 | 1137 | 1133 | 1128 | 9.30 | 1099 | 1.8 |
| Birth rate (no. of newborns) | 7 | 6 | 3 | 2 | 4 | 5 | −28.57 | 5 | −6.5 |
| Mortality (no. deaths) | 34 | 35 | 30 | 41 | 37 | 33 | −2.94 | 35 | −0.6 |
| No. persons receiving social assistance | 191 | 163 | 149 | 126 | 108 | 150 | −21.47 | 148 | −4.7 |
| No. dispensaries/medical units | 2 | 2 | 2 | 2 | 2 | 2 | 0.00 | 2 | 0.0 |
Table 14.
Analysis of the evolution of the main economic indicators in Sarulesti commune (CL) in the period 2015–2020.
Table 14.
Analysis of the evolution of the main economic indicators in Sarulesti commune (CL) in the period 2015–2020.
| Specification | 2015 | 2016 | 2017 | 2018 | 2019 | 2020 | % | Avr. | Annual Rhythm |
|---|
| Number of economic agents (companies, SRL, PFA, II, etc.), of which: | 22 | 23 | 25 | 27 | 27 | 27 | 22.7 | 5.2 | 4.2 |
| Agricultural profile | 7 | 7 | 7 | 7 | 7 | 7 | - | 7.0 | 0.0 |
| Tourist units (including agritourism) | 2 | 2 | 3 | 4 | 4 | 4 | - | - | - |
Table 15.
The main indicators, using linear regression, Sarulesti commune.
Table 15.
The main indicators, using linear regression, Sarulesti commune.
| Model 4 | R | R-Square | Std. Error of the Estimate | F-Change |
| 0.993 | 0.985 | 0.430 | 44.205 |
| Independent variable | B | Std. Error | Beta | t |
| Households (no.) | 0.002 | 0.008 | 0.055 | 0.283 |
| No. persons receiving social assistance | −0.011 | 0.012 | −0.143 | −0.922 |
| Tourist units (including agritourism) | 1.860 | 0.507 | 0.820 | 3.665 |
Table 16.
Analysis of the evolution of the main demographic indicators in Sanmihaiu Roman (TM) commune in the period 2015–2020.
Table 16.
Analysis of the evolution of the main demographic indicators in Sanmihaiu Roman (TM) commune in the period 2015–2020.
| Specification | 2015 | 2016 | 2017 | 2018 | 2019 | 2020 | % | Avr. | Annual Rhythm |
|---|
| Population (no inhabitants) | 8215 | 8452 | 8452 | 9006 | 8912 | 8990 | 9.43 | 8671 | 1.8 |
| Households (no.) | 2404 | 3450 | 3632 | 3632 | 3944 | 4097 | 70.42 | 3527 | 11.3 |
| Birth rate (no. of newborns) | 95 | 92 | 114 | 105 | 116 | 107 | 12.63 | 105 | - |
| Mortality (no. deaths) | 49 | 37 | 43 | 41 | 54 | 53 | 8.16 | 46 | 1.6 |
| No. persons receiving social assistance | 25 | 35 | 31 | 20 | 19 | 18 | −28.00 | 25 | −6.4 |
| No. dispensaries/medical units | 4 | 4 | 4 | 4 | 4 | 4 | 0.00 | 4 | 0.0 |
Table 17.
Analysis of the evolution of the main economic indicators in Sanmihaiu (TM) commune in the period 2015–2020.
Table 17.
Analysis of the evolution of the main economic indicators in Sanmihaiu (TM) commune in the period 2015–2020.
| Specification | 2015 | 2016 | 2017 | 2018 | 2019 | 2020 | % | Avr. | Annual Rhythm |
|---|
| Number of economic agents (companies, SRL, PFA, II, etc.), of which: | 323 | 436 | 445 | 474 | 527 | 552 | 70.9 | 486.8 | 11.3 |
| Agricultural profile | 8 | 9 | 10 | 10 | 10 | 10 | 25.0 | 9.5 | 4.6 |
| Tourist units (including agritourism) | 1 | 1 | 1 | 1 | 1 | 1 | - | - | - |
Table 18.
The main indicators, using linear regression, Sanmihaiu Roman commune.
Table 18.
The main indicators, using linear regression, Sanmihaiu Roman commune.
| Model 5 | R | R-Square | Std. Error of the Estimate | F-Change |
| 0.953 | 0.908 | 163.124 | 6.548 |
| Independent variable | B | Std. Error | Beta | t |
| Households (no.) | 0.308 | 0.328 | 0.543 | 0.941 |
| No. persons receiving social assistance | −25.356 | 11.238 | −0.523 | −2.256 |
| Economic agents with agricultural profile | 39.181 | 237.383 | 0.097 | 0.165 |
Table 19.
Analysis of the evolution of the main demographic indicators in Valcani commune (TM) in the period 2015–2020.
Table 19.
Analysis of the evolution of the main demographic indicators in Valcani commune (TM) in the period 2015–2020.
| Specification | 2015 | 2016 | 2017 | 2018 | 2019 | 2020 | % | Avr. | Annual Rhythm |
|---|
| Population (no inhabitants) | 1385 | 1390 | 1380 | 1374 | 1370 | 1372 | −0.94 | 1379 | −0.2 |
| Households (no.) | 534 | 534 | 534 | 534 | 534 | 534 | 0.00 | 534 | 0.0 |
| Birth rate (no. of newborns) | 11 | 14 | 9 | 6 | 13 | 13 | 18.18 | 11 | 3.4 |
| Mortality (no. deaths) | 18 | 15 | 16 | 12 | 9 | 15 | −16.67 | 14 | −3.6 |
| No. persons receiving social assistance | 1 | 0 | 0 | 0 | 0 | 0 | - | - | - |
| No. dispensaries/medical units | 1 | 1 | 1 | 1 | 1 | 1 | - | - | - |
Table 20.
Analysis of the evolution of the main economic indicators in Valcani commune (TM) in the period 2015–2020.
Table 20.
Analysis of the evolution of the main economic indicators in Valcani commune (TM) in the period 2015–2020.
| Specification | 2015 | 2016 | 2017 | 2018 | 2019 | 2020 | % | Avr. | Annual Rhythm |
|---|
| Number of economic agents (companies, SRL, PFA, II, etc.) of which: | 9 | 10 | 10 | 10 | 10 | 10 | 11.1 | 9.8 | 2.1 |
| Agricultural profile | 4 | 5 | 5 | 5 | 5 | 5 | 25.0 | 4.8 | 4.6 |
| Tourist units (including agritourism) | 0 | 0 | 0 | 0 | 0 | 0 | - | - | - |
Table 21.
The main indicators, using linear regression, Valcani commune.
Table 21.
The main indicators, using linear regression, Valcani commune.
| Model 6 | R | R-Square | Std. Error of the Estimate | F-Change |
| 0.679 | 0.462 | 7.476 | 1.286 |
| Independent variable | B | Std. Error | Beta | t |
| Mortality (no. deaths) | 1.675 | 1.298 | 0.677 | 1.291 |
| Number of economic agents | −0.096 | 10.134 | −0.005 | −0.010 |
Table 22.
Analysis of the evolution of the main demographic indicators at the level of Peciu Nou (TM) commune in the period 2015–2020.
Table 22.
Analysis of the evolution of the main demographic indicators at the level of Peciu Nou (TM) commune in the period 2015–2020.
| Specification | 2015 | 2016 | 2017 | 2018 | 2019 | 2020 | % | Avr. | Annual Rhythm |
|---|
| Population (no inhabitants) | 5412 | 5490 | 5591 | 5591 | 5615 | 5701 | 5.34 | 5567 | 1.0 |
| Households (no.) | 2040 | 2040 | 2040 | 2147 | 2149 | 2224 | 9.02 | 2107 | 1.7 |
| Birth rate (no. of newborns) | 37 | 58 | 49 | 42 | 28 | 45 | 21.62 | 43 | 4.0 |
| Mortality (no. deaths) | 47 | 46 | 45 | 42 | 50 | 48 | 2.13 | 46 | 0.4 |
| No. persons receiving social assistance | 13 | 16 | 15 | 13 | 13 | 11 | −15.38 | 14 | −3.3 |
| No. dispensaries/medical units | 4 | 4 | 4 | 4 | 4 | 4 | 0.00 | 4 | 0.0 |
Table 23.
Analysis of the evolution of the main economic indicators at the level of Peciu Nou (TM) commune in the period 2015–2020.
Table 23.
Analysis of the evolution of the main economic indicators at the level of Peciu Nou (TM) commune in the period 2015–2020.
| Specification | 2015 | 2016 | 2017 | 2018 | 2019 | 2020 | % | Avr. | Annual Rhythm |
|---|
| Number of economic agents (companies, SRL, PFA, II, etc.) of which: | 485 | 490 | 494 | 497 | 501 | 525 | 8.2 | 498.7 | 1.6 |
| Agricultural profile | 18 | 25 | 30 | 34 | 40 | 45 | 150.0 | 32.0 | 20.1 |
| Tourist units (including agritourism) | 1 | 1 | 1 | 1 | 1 | 0 | −100.0 | 0.8 | - |
Table 24.
The main indicators, using linear regression, Peciu Nou commune.
Table 24.
The main indicators, using linear regression, Peciu Nou commune.
| Model 7 | R | R-Square | Std. Error of the Estimate | F-Change |
| 0.937 | 0.878 | 7.764 | 4.782 |
| Independent variable | B | Std. Error | Beta | t |
| Population (no inhabitants) | 0.115 | 0.154 | 0.828 | 0.745 |
| Households (no.) | 0.128 | 0.117 | 0.714 | 1.095 |
| Economic agents with agricultural profile (no.) | −0.785 | 2.092 | −0.551 | −0.375 |
Table 25.
Analysis of the evolution of the main demographic indicators in Fardea commune (TM) in the period 2015–2020.
Table 25.
Analysis of the evolution of the main demographic indicators in Fardea commune (TM) in the period 2015–2020.
| Specification | 2015 | 2016 | 2017 | 2018 | 2019 | 2020 | % | Avr. | Annual Rhythm |
|---|
| Population (no inhabitants) | 1750 | 1742 | 1712 | 1680 | 1662 | 1647 | −5.89 | 1699 | −1.2 |
| Households (no.) | 543 | 544 | 546 | 550 | 551 | 552 | 1.66 | 548 | 0.3 |
| Birth rate (no. of newborns) | 12 | 10 | 11 | 10 | 9 | 7 | −41.67 | 10 | −10.2 |
| Mortality (no. deaths) | 21 | 23 | 23 | 34 | 18 | 25 | 19.05 | 24 | 3.5 |
| No. persons receiving social assistance | 2 | 1 | 2 | 1 | 2 | 0 | −100.00 | 1 | - |
| No. dispensaries/medical units | 1 | 1 | 1 | 1 | 1 | 1 | 0.00 | 1 | 0.0 |
Table 26.
Analysis of the evolution of the main economic indicators in Fardea commune (TM) in the period 2015–2020.
Table 26.
Analysis of the evolution of the main economic indicators in Fardea commune (TM) in the period 2015–2020.
| Specification | 2015 | 2016 | 2017 | 2018 | 2019 | 2020 | % | Avr. | Annual Rhythm |
|---|
| Number of economic agents (companies, SRL, PFA, II, etc.), of which: | 5 | 5 | 1 | 8 | 2 | 0 | −100.0 | 3.5 | - |
| Agricultural profile | 0 | 5 | 1 | 2 | 1 | 0 | - | 1.5 | - |
| Tourist units (including agritourism) | 0 | 0 | 0 | 3 | 0 | 0 | - | - | - |
Table 27.
The main indicators, using linear regression, Fardea commune.
Table 27.
The main indicators, using linear regression, Fardea commune.
| Model 8 | R | R-Square | Std. Error of the Estimate | F-Change |
| 0.995 | 0.990 | 5.520 | 147.056 |
| Independent variable | B | Std. Error | Beta | t |
| Households (no.) | −10.585 | 1.152 | −0.953 | −9.189 |
| No. of newborns | 1.249 | 2.561 | 0.051 | 0.488 |


 ,
, 


