Article

Self-Assessment Framework for Corporate Environmental Sustainability in the Era of Digitalization

1
Sustainable Manufacturing and Life Cycle Engineering, Institute of Machine Tools and Production Technology (IWF), Technische Universität Braunschweig, Langer Kamp 19b, 38106 Braunschweig, Germany
2
Singapore Institute of Manufacturing Technology, 2 Fusionopolis Way, #08-04, Innovis, Singapore 138634, Singapore
3
School of Computing, National University of Singapore, COM1, 13 Computing Drive, Singapore 117417, Singapore
*
Author to whom correspondence should be addressed.
Sustainability 2022, 14(4), 2293; https://doi.org/10.3390/su14042293
Submission received: 15 December 2021 / Revised: 28 January 2022 / Accepted: 10 February 2022 / Published: 17 February 2022

Abstract

:
The shift towards a climate-neutral economy will affect businesses in the upcoming decades. Companies will need to increase their transformation towards environmentally sustainable businesses in the following years, in which digitalization might be a practical enabler to accelerate this transformation. However, as a starting point, companies require knowledge of their current sustainability performance to manage this transition and need a method that provides the necessary information. The use of self-assessment tools is a widely acknowledged method for such processes. Nevertheless, there is a lack of self-assessment tools that integrate sustainability and digitalization perspectives to overcome different organizational barriers. This paper focuses on how managers can be supported in planning their transformations by interlinking sustainability and digitization. Our objective is to enable the managers of companies to assess their current state in terms of corporate environmental sustainability and to explore their policies, information systems, and actions to support their transformation towards sustainable and digital businesses. A self-assessment tool based on a rapid questionnaire is presented after reviewing and synthesizing different approaches, including maturity modeling, sustainability reporting, and digital assessment tools. The self-assessment tool is improved upon evaluation by industry experts and the framework is tested on a case company.

1. Introduction

Due to the increasing legal pressure on companies to move towards a climate-neutral economy [1] (p. 7), [2] (p. 2), [3] (pp. 3–4), [4], companies are required to become more accountable for their contributions and risks related to Environmental sustainability (ES) in the upcoming years [5]. In fact, ES has become an innovation driver instead of the sole consideration for cost reductions [6]. However, in order to meet environmental requirements and keep up with competitors, companies must assess their level of ES first. This must be made transparent to decision-makers to support business development.
One solution to support this transparency is the application of assessment tools. Self-assessment tools as state-of-the-art materials can especially help managers understand the concepts of ES and their relevance to their companies [7]. Although there may be certain limitations in assessing sustainability performance, they may also be practical opportunities for improvement, guiding the improvement processes and helping in managing businesses [7] (p. 15).
Companies must focus on the essential aspects for business transformation, such as management practices, business processes, and technology [8] (p. 1). Although companies differ based on their products, industry, or size, the concept of business engineering (BE) provides a general framework to cope with the planning and realization of business transformations [9]. Commonly, the transformation process is addressed at three interconnected levels, namely the business strategy, information systems, and processes [9] (pp. 8–62).
The importance of information systems is highlighted in the roles of digitization and digitalization for business transformation. Digitization provides a powerful means to support ES in companies. It can provide business transparency regarding the environmental performance and can help identify the potential for improvement. Although the impacts of digitalization and digital technologies on ES have been discussed controversially [10,11,12,13], there are many indications that digitalization has a strong potential to reduce negative environmental impacts [14,15]. According to VDI, up to a 25% increase in resource efficiency and 25% decrease in energy consumption were achieved in a case study. In this case study, the company’s environmental performance was compared before and after implementing an ERP system [16] (p. 96).
However, integrating both ES and digital technologies into the core business is still challenging [17,18,19,20,21,22]. Due to the complexity of both topics and the isolated investigations of specific aspects in academia, such as respective transformation barriers [17] (p. 2), [22] (pp. 3–5) or specific technical fundamentals [21] (p. 2), interlinkage within the overall concept is missing. Therefore, recent research shows that both aspects must be addressed as an integrative task [11,23,24]. Consequently, there is a lack of self-assessment tools with which to explore ES and digitalization strategies in an integrative manner. For this reason, this paper explores how the concept of BE can be used within a self-assessment tool to support companies in transforming their businesses towards environmental sustainability by integrating the perspective of digitalization.
To this end, we propose a self-assessment tool that leverages BE, maturity models, and disclosure frameworks to support business development from both perspectives—digitalization and sustainability. It uses a digital medium to provide a cohesive assessment format. Our objective is to enable managers to assess the current state of ES in their companies.
This work evolves the ideas from previous academic and practice frameworks and offers companies a new framework to manage their transition towards environmentally sustainable businesses. To this end, this paper is structured as follows. In Section 2, we describe the interlinkage of ES, business transformation, and digitalization. Then, we bring these elements together under the umbrella of corporate environmental sustainability and design a theoretical self-assessment framework. This framework is used to review the current state-of-the-art in Section 3. In Section 4, the development methodology and conceptual assessment framework are introduced, followed by the results of the use-case-based evaluation of the self-assessment tool being presented in Section 5. Finally, Section 6 and Section 7 discuss the tool, present the main findings and limitations, and discuss future research directions.

2. The Interlinkage of Environmental Sustainability, Business Transformation, and Digitalization

In order to develop a self-assessment tool, the interlinkage of ES, business transformation, and digitalization through relevant design principles needs to be introduced. Here, design principles relate to systemized knowledge from practice to describe theoretical concepts [25] (p. 7). Section 2.1 introduces ES and explains why this work focuses on the environmental dimension of sustainability. Then, in Section 2.2, transformation enablers for the introduction of ES are introduced to derive recommendations for actions to cope with these challenges. Based on this, Section 2.3 describes the role of digitalization and its design principles to support the transformation towards ES by overcoming the existing business transformation barriers. Finally, Section 2.4 brings together all of these theories to form the basis for a theoretical framework of reference for the envisioned self-assessment tool.

2.1. Environmental Sustainability

The term sustainability refers to sustainable development, which became famous through the Brundtland Report [26] and has been defined over a hundred times since [27] (p. 537). Based on the different interpretations in the literature, different concepts of sustainable development exist. These can be distinguished, such as in ecological sustainability [28,29] and the triple bottom line (TBL) [30,31]. While ecological sustainability focuses on an environmentally friendly economy by implementing environmentally sustainable practices [28] (p. 938), the TBL considers economic, environmental, and social needs all at the same time [32].
In terms of the 21st-century business paradigm, the TBL is helpful in measuring the value of a company not only through its financial performance but also by its contributions to the environment and society [32] (pp. 17–39). At the same time, these three sustainability dimensions address a wide range of internationally relevant problems and goals, such as ending poverty, fighting climate change, and ensuring sustained economic growth.
Having a broad number of problems and goals raises the question of the importance of each goal compared to the others. Since the economy and society could not exist without the environment, it may be argued that ES is the most important. The concept of planetary boundaries supports its relevance. By focusing on ES, this highlights the limitation of natural resources and the capacity of the environment to absorb pollution [33] (p. 534). These absolute boundaries have led to the absolute sustainability perspective, which requires absolute targets for ES and a shift towards eco-effectiveness instead of eco-efficiency [33] (pp. 535–536).
Comparing the TBL and the concept of absolute sustainability reveals one major limitation of the TBL—the TBL can be used to justify the avoidance of technology-based innovations to support ES for social or economic reasons [33] (p. 535). In this way, social and economic goals can be achieved in the short term at the expense of the environment.
However, regarding the concept of absolute sustainability, this view would negatively affect the economic and social dimension in the long term. Thus, in the following, we build up our self-assessment framework of ES, although the economic and social dimension must not be neglected.

2.2. Business Transformation towards ES

The pathway towards a climate-neutral economy is characterized by ambitious climate change mitigation targets [34] (p. 2), higher costs [35], and business transformation towards a new value proposition through enhanced ES [36] (p. 18). As stated by Lee et al. [8] (p. 1), to succeed in business transformation, various company perspectives must be analyzed (e.g., management practice, business processes) and improved with best-practice or other measures towards a “strategic end state”. Therefore, all primary (business) activities within a value chain, according to Porter [37], need to be considered. These activities are inbound logistics, operations, outbound logistics, marketing and sales, and services. These occur in different product life cycle stages and are important because they create and add the most value [38] (pp. 321–324). According to the CERES Report (2016), products and services, operations, and supply chains (including logistics) are acknowledged by many companies as most relevant for sustainability performance [39]. Therefore, all relevant environmental issues are related to the corporate business activities tied to (1) products, (2) operations, and (3) supply chains.
Although many companies have acknowledged the necessity of ES [40], the business transformation towards ES is often hindered due to several business transformation enablers that need to be overcome. Therefore, this work highlights five main business transformation enablers to be overcome. These enablers as well as the related recommendations for action, are described in Table 1.
Small and medium enterprises (SMEs) lag primarily due to constraints regarding resources (e.g., knowledge) and organizational barriers (e.g., lack of strategy or missing metrics to track ES) [18] (pp. 616–617), [19] (p. 11), [20] (p. 583). In comparison, multinational corporations (MNCs) face different technical, organizational, or cognitive challenges depending on their integration progress for their sustainability strategy [17]. For instance, low stakeholder engagement (organizational barrier) [17] (p. 14), data accessibility for reporting (technical barrier) [17] (p. 12), and knowledge gaps in specific sustainability areas (cognitive barrier) [17] (p. 14) represent barriers regarding the sustainability integration. Based on the work by Caldera et al. (2019) [20], we consider five business transformation enablers that might support the integration of ES into the business. Table 1 presents these enablers.
Since these enablers relate to sets of strategies, processes, implemented measures, and initiatives taken by an organization to reduce its negative impact and increase its positive impact on the natural environment, the term ES is extended to the term corporate environmental sustainability (CES) according to GRI [41] (p. 10). Regarding the GRI, the ES problem domains of the self-assessment framework contain the CES aspects carbon, energy, water, material, and waste.

2.3. The Role of Digitalization

New digital technologies drive business transformation by enhancing products, services, and operations along the value chain [15] (pp. 26–27). In the literature, various authors use the term digital transformation to describe this shift to new business models [42] (p. 2), [43,44,45,46]. However, according to Vial [47] (p. 135), digital transformation is a more comprehensive term for the changes in the industry and society and is not limited to organization-centric processes [47] (p. 121). As pointed out by Feroz et al. [42] (p. 2), to address organization-related processes, the terms digitalization and digitization can be used. However, they must be differentiated, as stated by Legner et al. [46] (p. 1). Digitalization can be defined as “the transformation of business models and core internal processes through the use of information and communications technologies (ICT)” [48] (p. 9). In contrast, digitization relates to “the process of converting analogue signals into a digital form, and ultimately into binary digits” [49] (p. 2).
Due to the strong correlation between digitalization and ES [15], especially the potential of Industry 4.0 as an enabler for ES is discussed [14,50,51]. Industry 4.0 can be described as increasing digitization and automation in the field of manufacturing by creating digital value chains and enabling communication within the eco-system of products [52] (p. 306).
Based on the work of Gilchrist (2016) [53] and Ghobakhloo (2018) [54], six design principles from Industry 4.0 can be determined to reveal the potential for products, operations, and supply chains in terms of CES through digitalization (see Table 2).
Some technologies related to Industry 4.0 design principles and their potential are highlighted in the following. This shows how business transformation enablers might be overcome and environmentally sustainable business accelerated.
For instance, regarding real-time capability and decentralization, the significant technologies are cyber–physical production systems (CPPS) and the Internet of Things (IoT). These enable the acquisition of more accurate data and real-time monitoring [13] (p. 4) from processes such as production and resource consumption [13] (p. 4), [55,56]. CPPS can increase efficiency through machine real-time monitoring regarding resource reconfiguration, as shown in the examples of lightweight structure manufacturing [57] (pp. 15–28) and energy consumption and management [56]. Furthermore, CPPS expand existing capabilities in the real world through computation, communication, and control [58] (p. 1). These benefits can significantly support the development of capabilities or the initiation of continuous improvement measures.
According to Ghobakhloo [59] (p. 3), the horizontal and vertical integration leads to a digital supply network (DSN), which is said to contribute to overarching economic concepts such as the circular economy [60] (p. 17). Moreover, integrating AI and cloud computing might boost smart energy and resource consumption [61,62]. Besides the process automation and digitalization, digital platforms might enable stronger customer and partner engagement across the value chain and may allow innovation in business models [46] (p. 3). These benefits can significantly support new strategy development or continuous knowledge transfer.
Overall, through digitalization, positive impacts on ES might be achieved. Nevertheless, this requires sustainable digitization processes to monitor environmental data, such as greenhouse gas (GHG) emissions, waste streams, and energy consumption metrics [63,64]. Therefore, especially processes around data collection and processing in terms of environmental performance indicators and other aspects must be examined in companies.

2.4. Synthesis of the Self-Assessment Framework

With the interlinkage of ES, business transformation enablers, and digitalization, a set of relevant theories for business transformation towards CES has been introduced. These aspects shall be consolidated under the concept of BE. Therefore, the three BE levels, business strategy, information systems, and processes (see Table A1), are addressed as business domains. However, BE does not provide any recommendations on how to address companies that operate in specific parts of the value chain, such as manufacturing or logistics. Furthermore, there is no recommendation on how to assess business transformation.
As applied by GRI and suggested by Hynds et al. [65] (p. 52), the combination of qualitative and quantitative measurements must be considered as a success factor to measure a company’s sustainability performance. According to Schönherr and Martinuzzi (2019), tools combining both types of data and indicators contribute to more reliable and transparent conclusions [66] (p. 123). On the one hand, a qualitative assessment might be useful in addressing specific improvement measures (e.g., implementation of specific environmental indicators). On the other hand, a quantitative assessment might help in tracking progress and showing quantifiable improvements (e.g., absolute decrease in carbon emissions). Therefore, a combined qualitative and quantitative assessment approach is required.
Building upon the related theory, a self-assessment framework for CES shall be introduced that takes a business view on the transformation of companies towards CES (see Figure 1). In this view, CES is represented by the problem domains of ES (see Section 2.2) and Industry 4.0 design principles (see Section 2.3). The Industry 4.0 design principles are not regarded as an essential part of ES but more as a complementary aspect. While ES implies relevant environmental aspects and requirements for business transformation, Industry 4.0 design principles present enablers to meet them and to boost the transformation. The environmental aspects and transformation enablers are related to the business view (see Section 2.2), and the transformation is supported by a combined qualitative and quantitative assessment approach (see Section 2.4).

3. State-of-the-Art

In order to develop a self-assessment tool based on the theoretical framework, a sound foundation should be provided through a review of already existing approaches in the literature. A focus is set on existing maturity models as an assessment approach that is applied in ES and digitalization. MMs rely on a conceptual framework that supports organizational changes by assessing the current state and providing a development process to achieve the desired state in a particular area of interest over time [67] (p. 2).
Existing MMs are analyzed concerning the main elements of the theoretical self-assessment framework, namely the business view, ES problem domains, Industry 4.0 design principles, business transformation enablers, and the assessment approach. Overall, 13 MMs are analyzed regarding their fulfilment of these evaluation criteria—seven related to ES and six to digitalization.
Within the context of ES, we considered the MM by Baumgartner and Ebner (2010) [68], which explores the interdependency between corporate sustainability strategies, corporate competitive strategies, and corporate sustainability. Although the authors relate corporate sustainability to the concept of TBL, only the environmental dimension was considered. Overall, the model contains 21 assessment dimensions and four maturity levels. Another corporate-level model is provided by Cagnin et al. (2013) [69]. It also explores the corporate structures, values, and visions among seven assessment dimensions and five levels. Since MMs on the corporate level are rare, further MMs were selected from other sustainability fields. For instance, Golinska and Kuebler (2014) [70] designed an MM in the field of remanufacturing, addressing the TBL and 15 dimensions among five maturity levels. Then, Hynds et al. (2014) [65] focused their MM on product development, while Pigosso et al. (2013) [67] focused on the continuous improvement of processes in product eco-design. Another perspective by Finnerty et al. (2017) included energy management of multi-site industrial organizations by enabling bi-directional benchmarking [71]. Finally, Reefke et al. (2014) [72] proposed an MM for a sustainable supply chain that aims to offer support in discovering, learning, strategizing, designing and testing, transforming, monitoring, and controlling a multi-layered supply chain management.
In the context of digitalization, five MMs assessing a company’s current state in terms of Industry 4.0 were considered. Although there are differences between the outcomes in the studies by Schumacher et al. (2016) [72], Schuh et al. (2018) [73], Lichtblau et al. (2015) [74], the Singapore Economic Development Board (2018) [75], and Geissbauer et al. (2016) [76], there is a strong common understanding of most of the dimensions. For instance, the addressed dimensions cover the complete value chain and address digital technologies. The MM by Weiß and Termer (2018) [77], in contrast, focuses on specific digital technologies related to digital analytics and optimization within a company and derives from that a company’s degree of digitization.
Based on the analysis of these MMs, four insights are revealed (see Table 3).
Firstly, not all MMs for assessing ES consider Industry 4.0 design principles, while conversely not all MMs in the field of digitalization take into account the ES problem domains. This identified gap supports the initially introduced need in the literature regarding the integrative view of ES and digitalization [11,23,24].
Secondly, MMs in the field of ES strongly vary in terms of the business view and ES problem domains. While MMs related to the corporate level support the planning of sustainability strategies, they do not provide any insights regarding relevant quantitative indicators or measures for deploying the strategy. Other MMs can be found that focus on one specific business view, such as remanufacturing [70] (operations), while also addressing all ES problem domains or on one specific ES problem domain, such as energy-related operations or the supply chain [71]. Based on this insight, a clear need for an MM with a holistic perspective on the complete business view and all ES problem domains in the context of CES is shown.
Thirdly, MMs in both fields mainly help to address up to three of the five business transformation enablers and might require solutions and ideas from other assessment tools to close this gap.
Finally, for both research fields, MMs still lack a quantitative assessment approach. By a quantitative assessment approach, we mean the analysis of quantitatively measured data. With respect to CES, this might include environmental data, as requested by sustainability reporting bodies such as the Global Reporting Initiative (GRI) or Carbon Disclosure Project (CDP). Such data are considered relevant since they can help in the identification of relevant environmental performance indicators [41] (pp. 1–8). Additionally, continuous improvement measures can be supported through quantitative target setting and measurements.
In conclusion, the following success criteria for a CES self-assessment tool have been defined:
  • Integrate the view on ES and digitalization based on the design principles;
  • Consider all defined business views;
  • Address all defined business transformation enablers;
  • Apply a qualitative and quantitative assessment approach.

4. Assessment Framework

As introduced in Section 2.4, the self-assessment tool should apply a qualitative and quantitative assessment approach. Therefore, we combine an MM with an extended set of qualitative and quantitative questions similar to existing disclosure frameworks (e.g., GRI or CDP frameworks). The purpose behind building a two-step assessment is to allow iterative identification and elaboration of the most relevant topics related to business transformation. The first assessment part is an MM that enables a rapid assessment [78] based on a few qualitative questions. These first qualitative questions reveal further qualitative and quantitative questions that can validate the answers from the first assessment part (see Figure 2).
Since we aim to develop an MM-based self-assessment tool, we follow the development approach used by Neff et al. [79]. As a simplified version of Becker et al.’s methodology [80], this follows four development phases: problem identification, comparison of existing MMs, iterative development steps, and evaluation [79].
Neff et al.’s methodology is applied to develop both parts. Therefore, the development steps under the phases are distinguished between MM-related (blue); questionnaire-based, assessment-related (green); and cross-functional (grey) development steps. Figure 2 provides an overview of the different development steps within the different phases.
The steps problem identification and comparison of existing MMs are covered by Section 2 and Section 3. This section presents the results from the iterative development steps, while Section 5 presents the results of the evaluation. The evaluation is divided into an expert evaluation and a use case for the maturity model.
For the expert evaluation, a group of 9 experts evaluated the assessment framework. The expert reviewers were researchers with expertise in the specific assessment areas covered by the assessment framework. The expert reviewers were asked to provide general feedback on the assessment during the evaluation.
The maturity levels in each sub-domain were evaluated in five aspects, based on the review of maturity models by Salah et al. [81]. The five aspects are sufficiency, distinctness, usefulness, ease of use, and accuracy and relevance (see Table A4).
For the use case, a company in Singapore was identified to test the usability and usefulness of the assessment. The company is a manufacturing company in Singapore in the building sector with over 200 employees. A person in the knowledge management and business development department who has been supporting the sustainability report preparation process in the company was identified to conduct the assessment. This person has been at the company for four years.
After the end-user company attempted the assessment, a set of questions were posed to evaluate the tool from the perspective of an end-user. The evaluated aspects were understandability, ease of use, and usefulness (see Table A5).

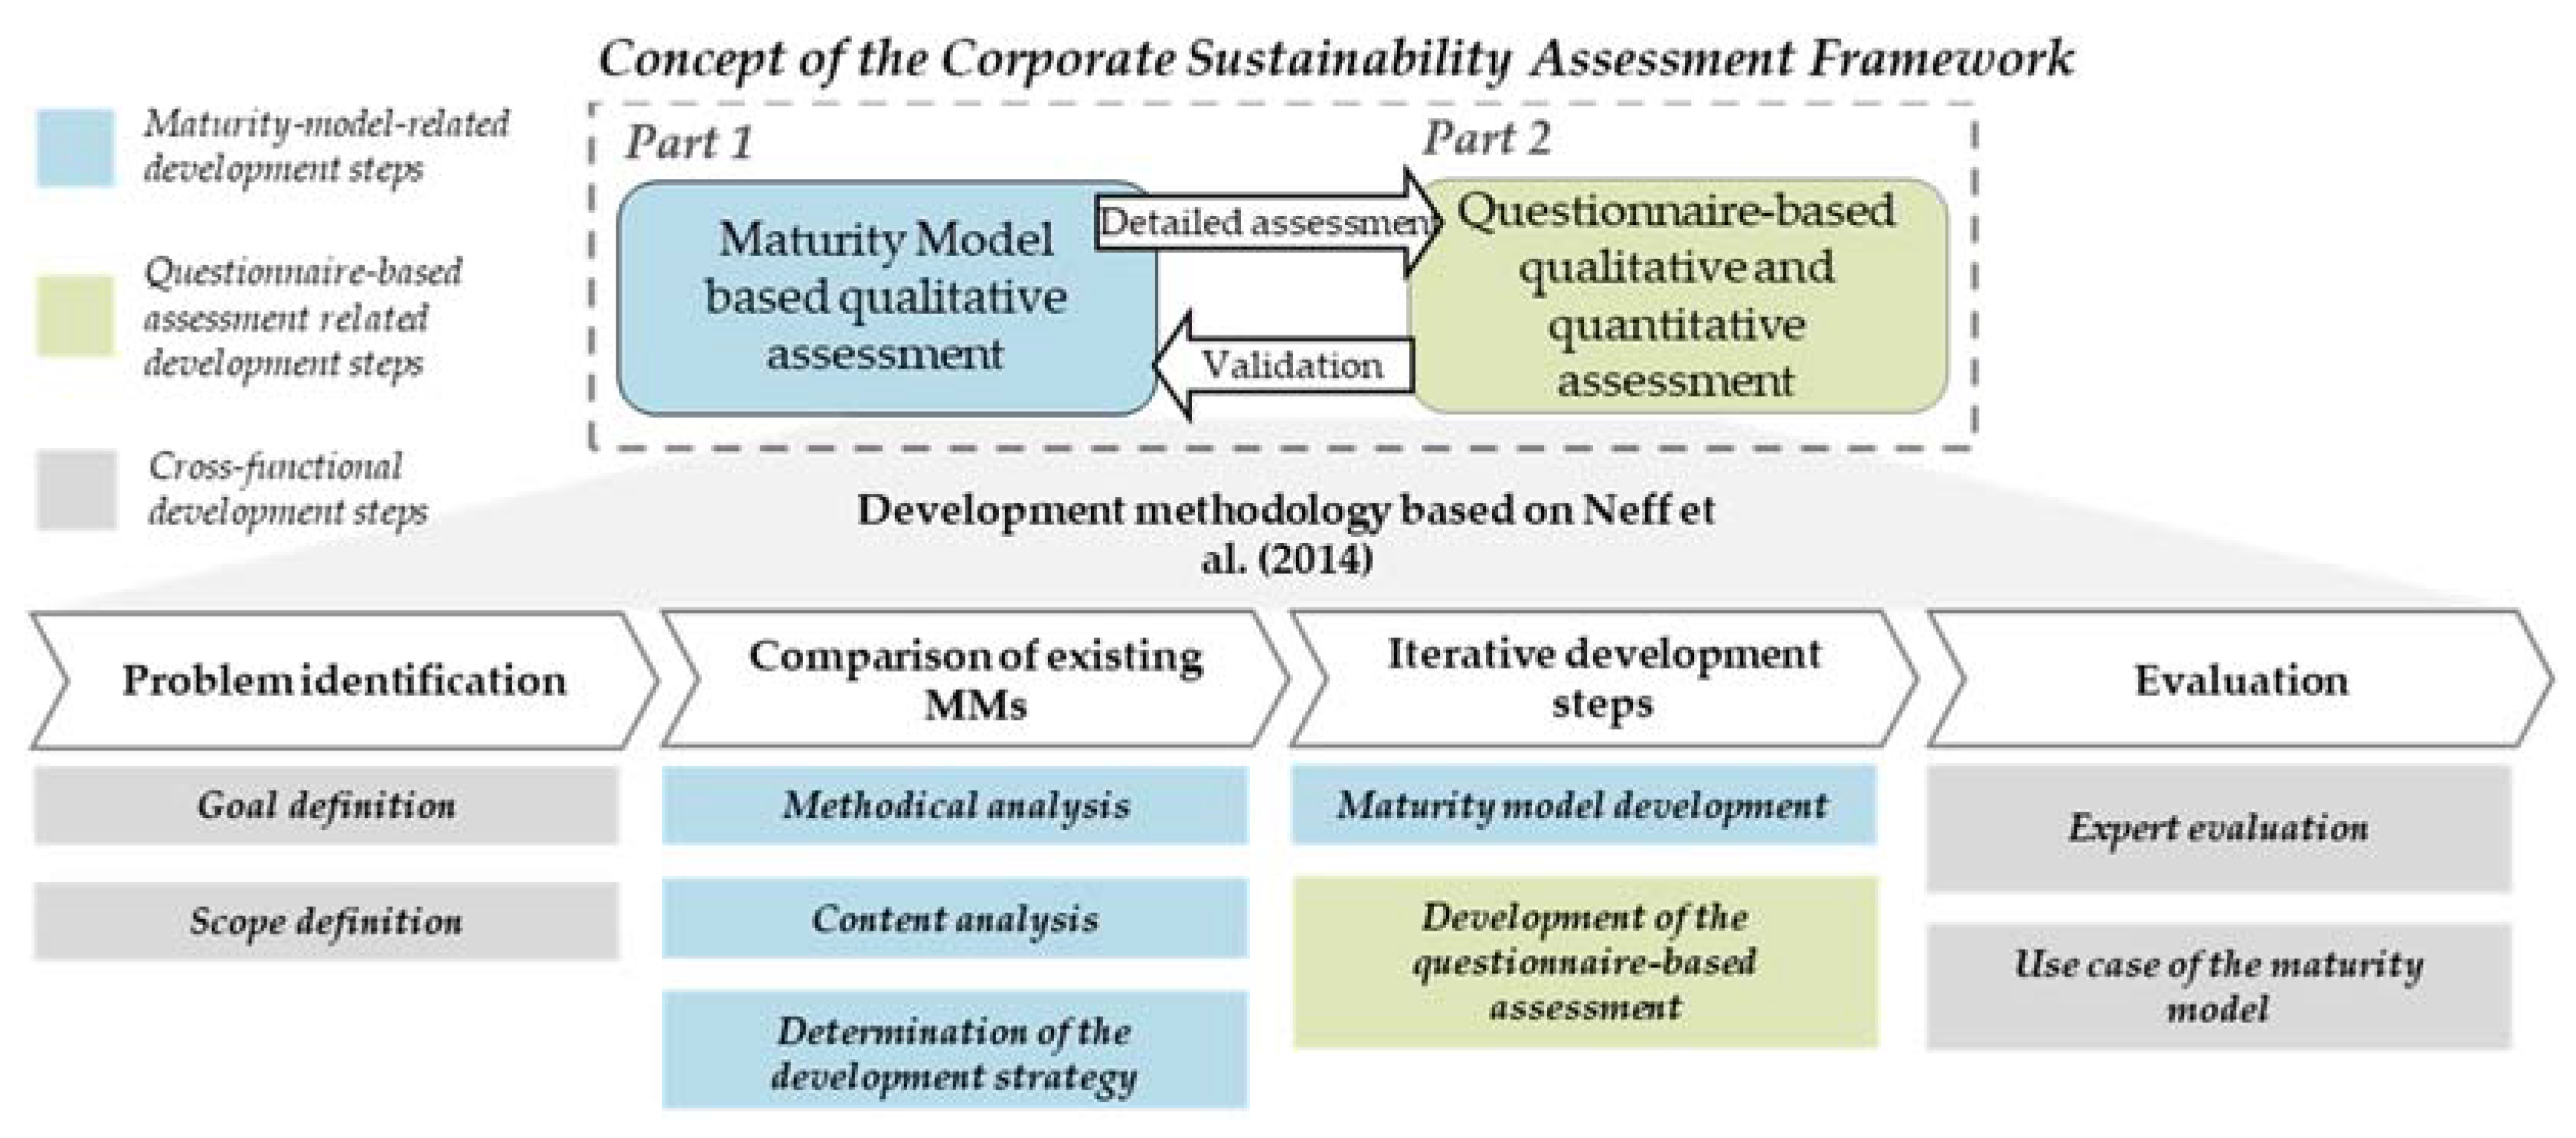
4.1. Framework Design
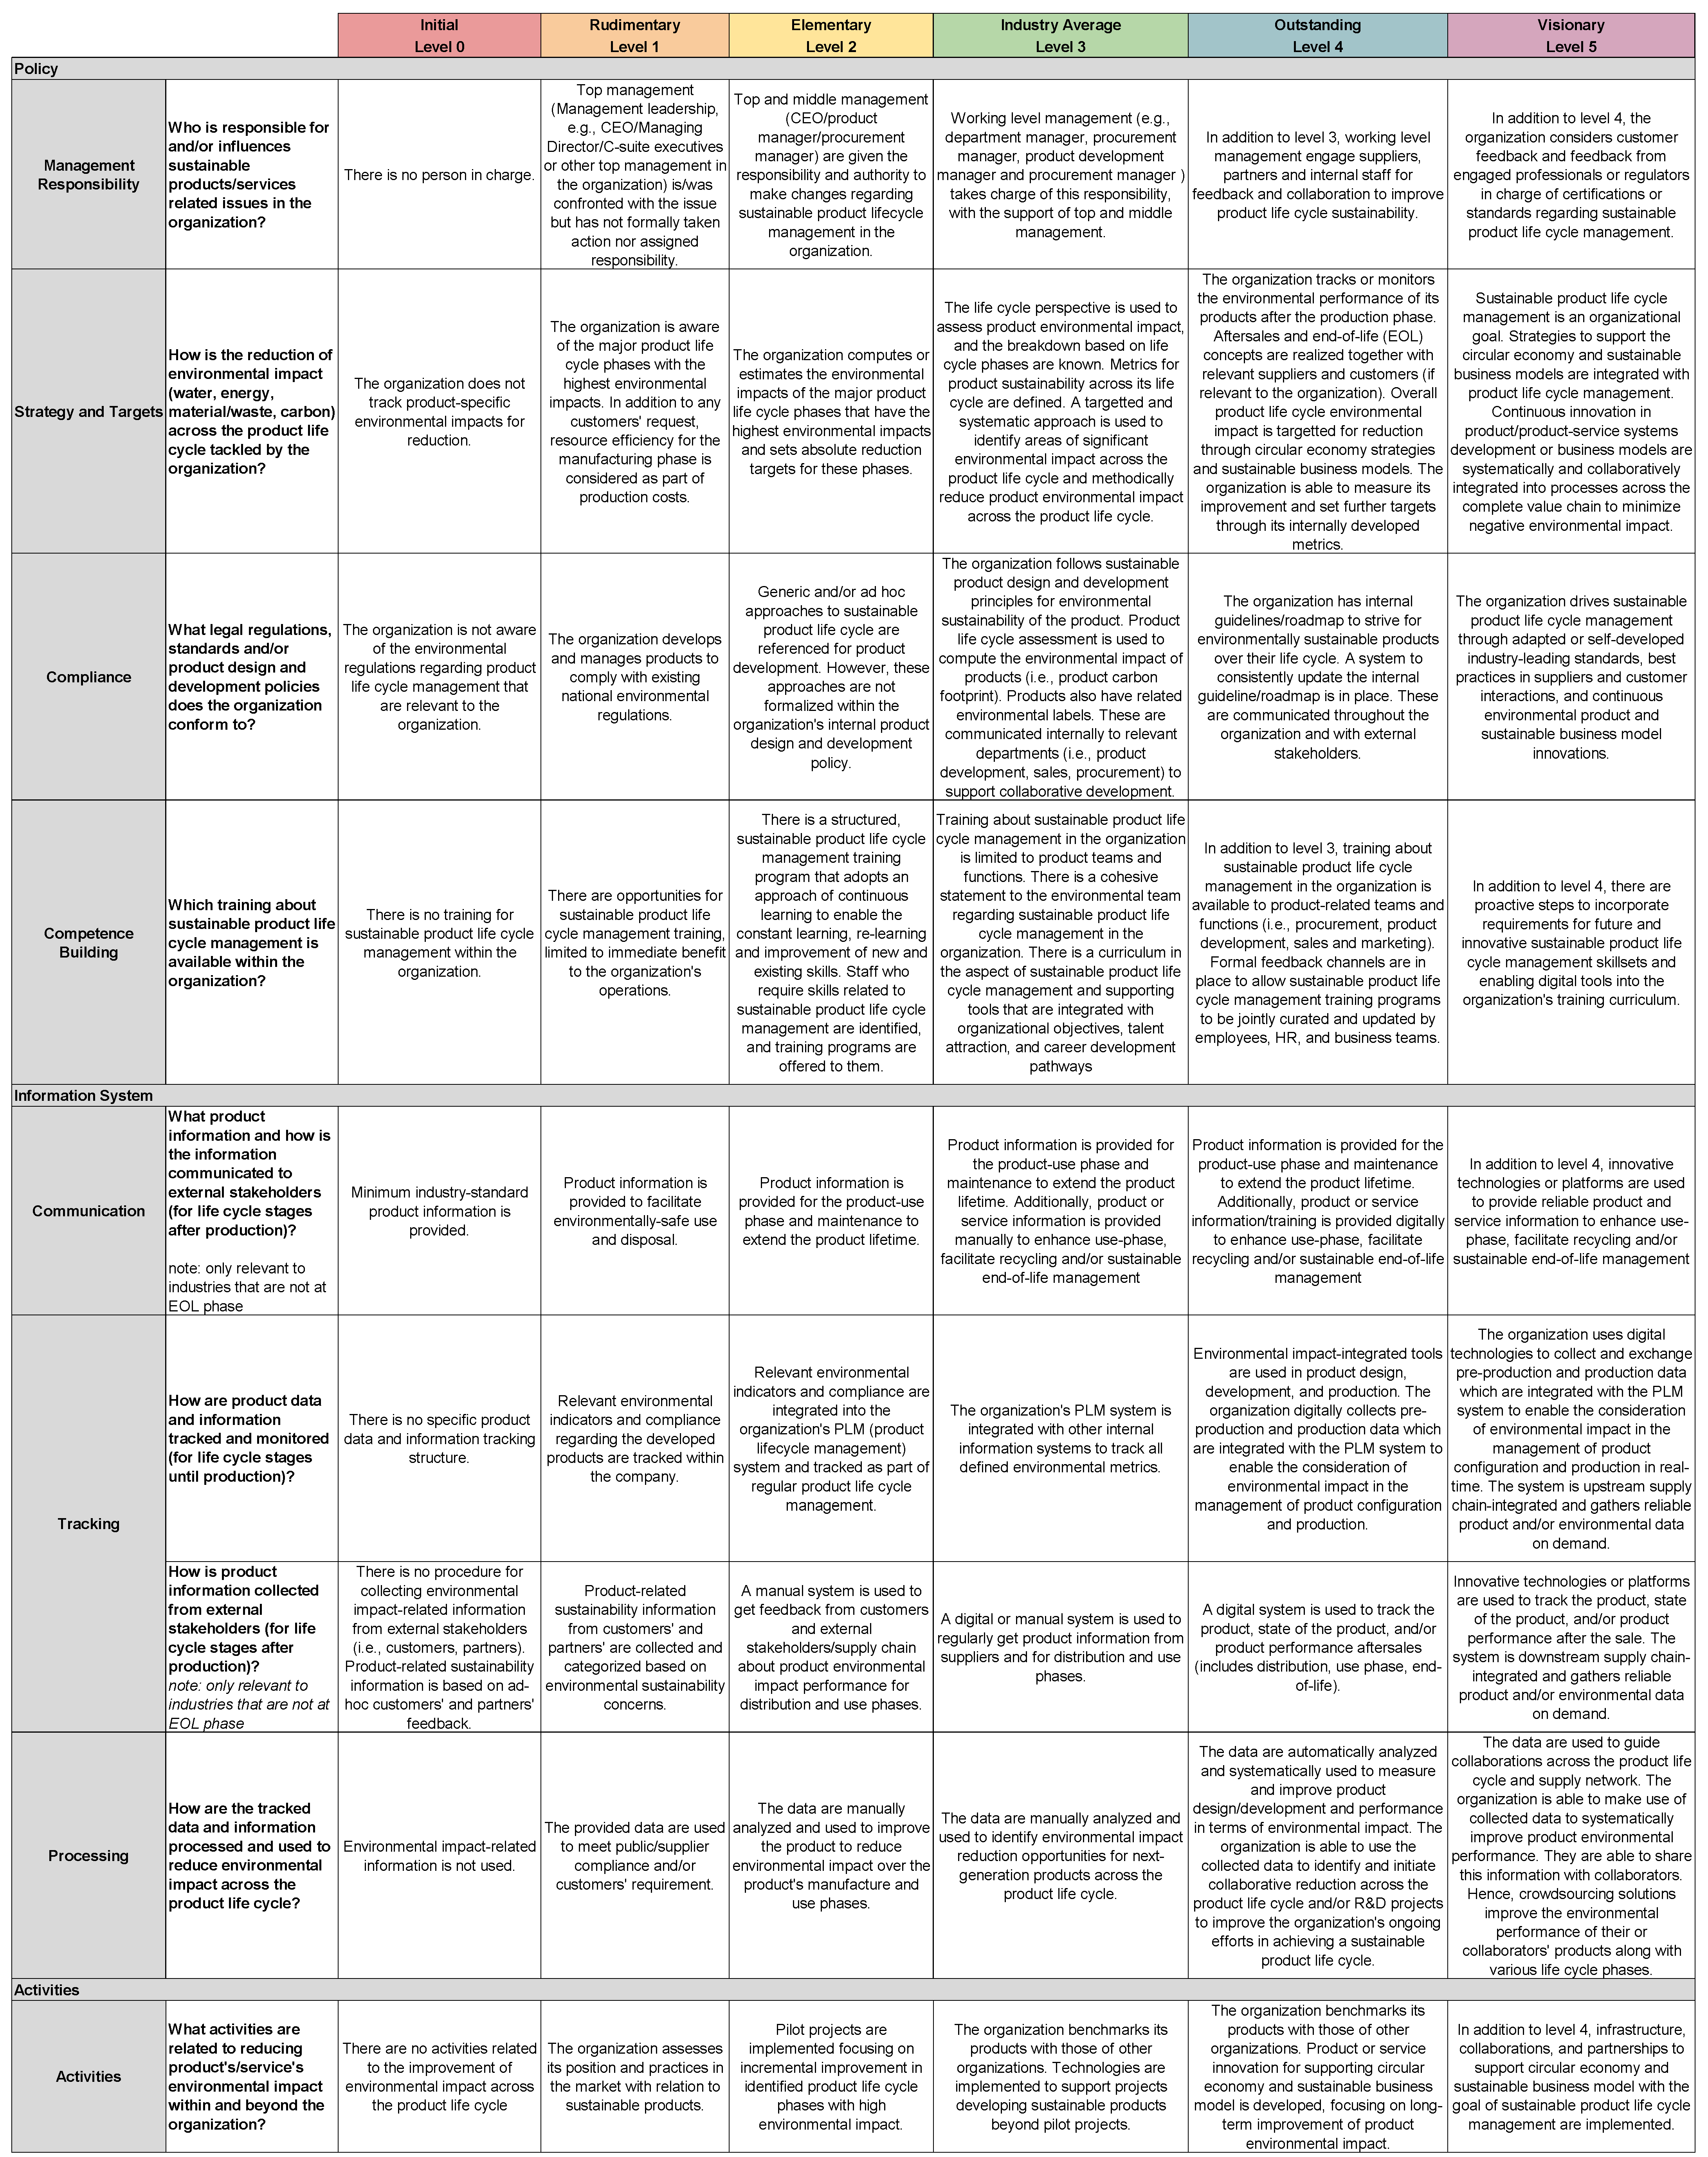
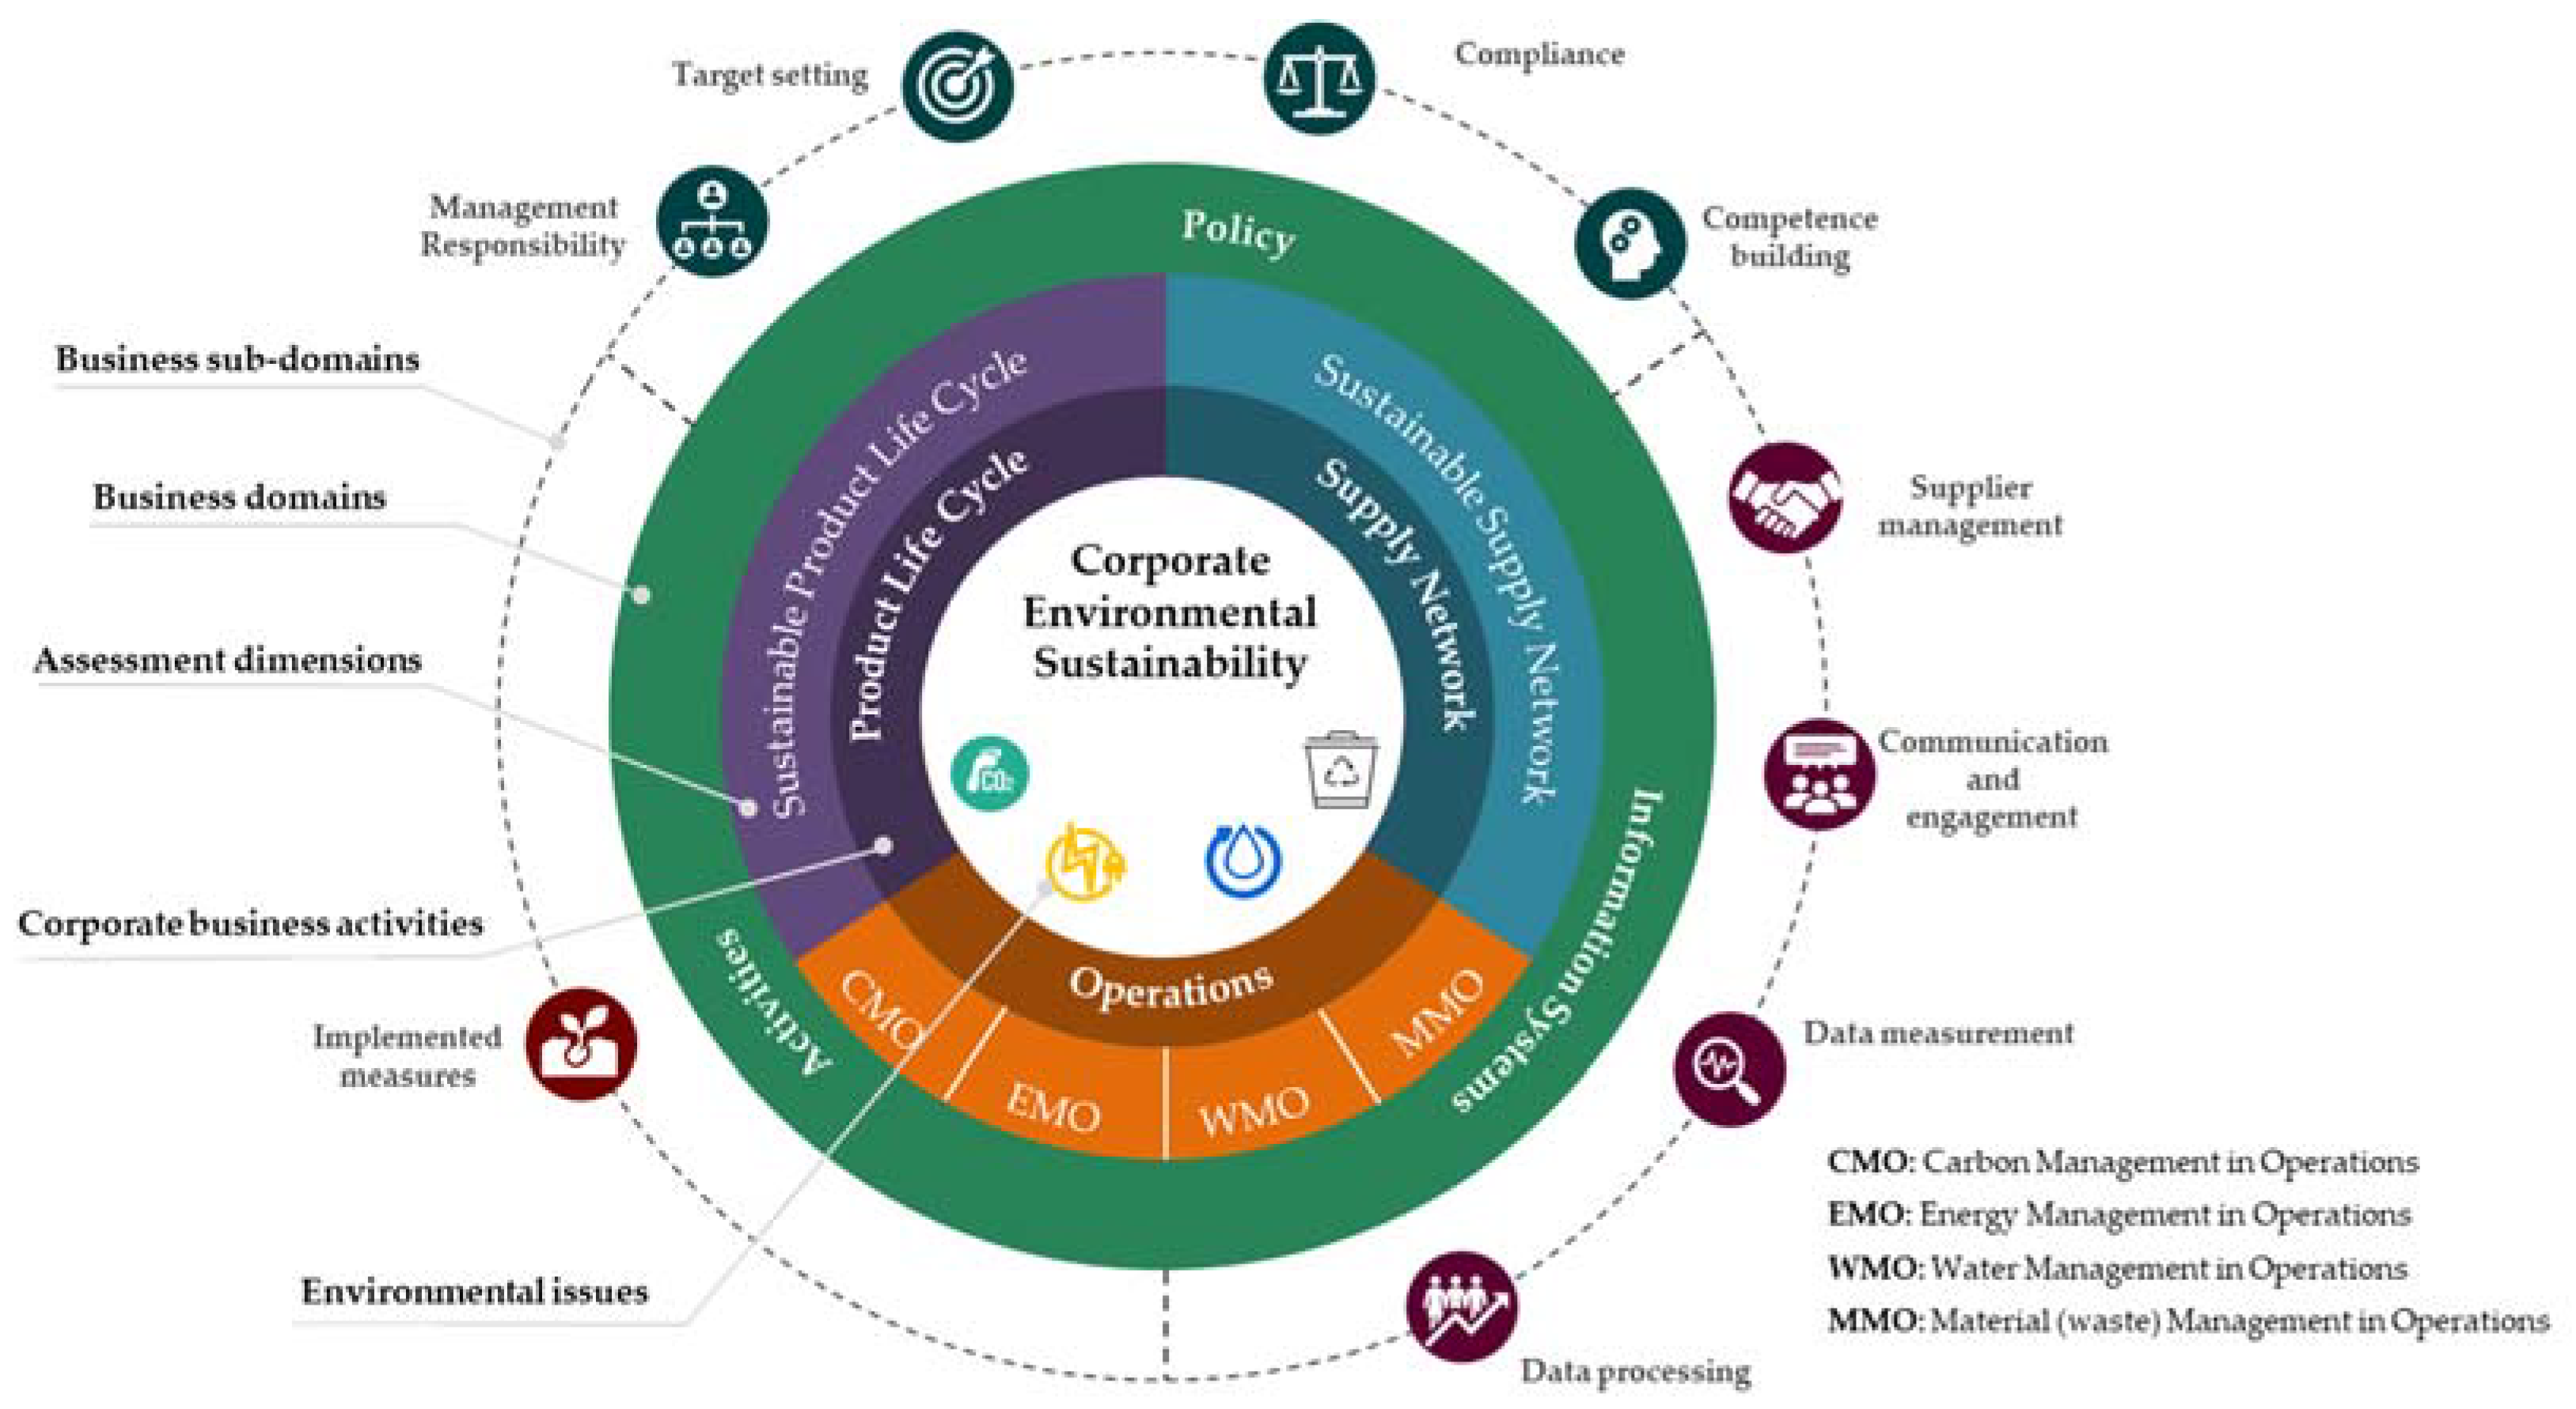
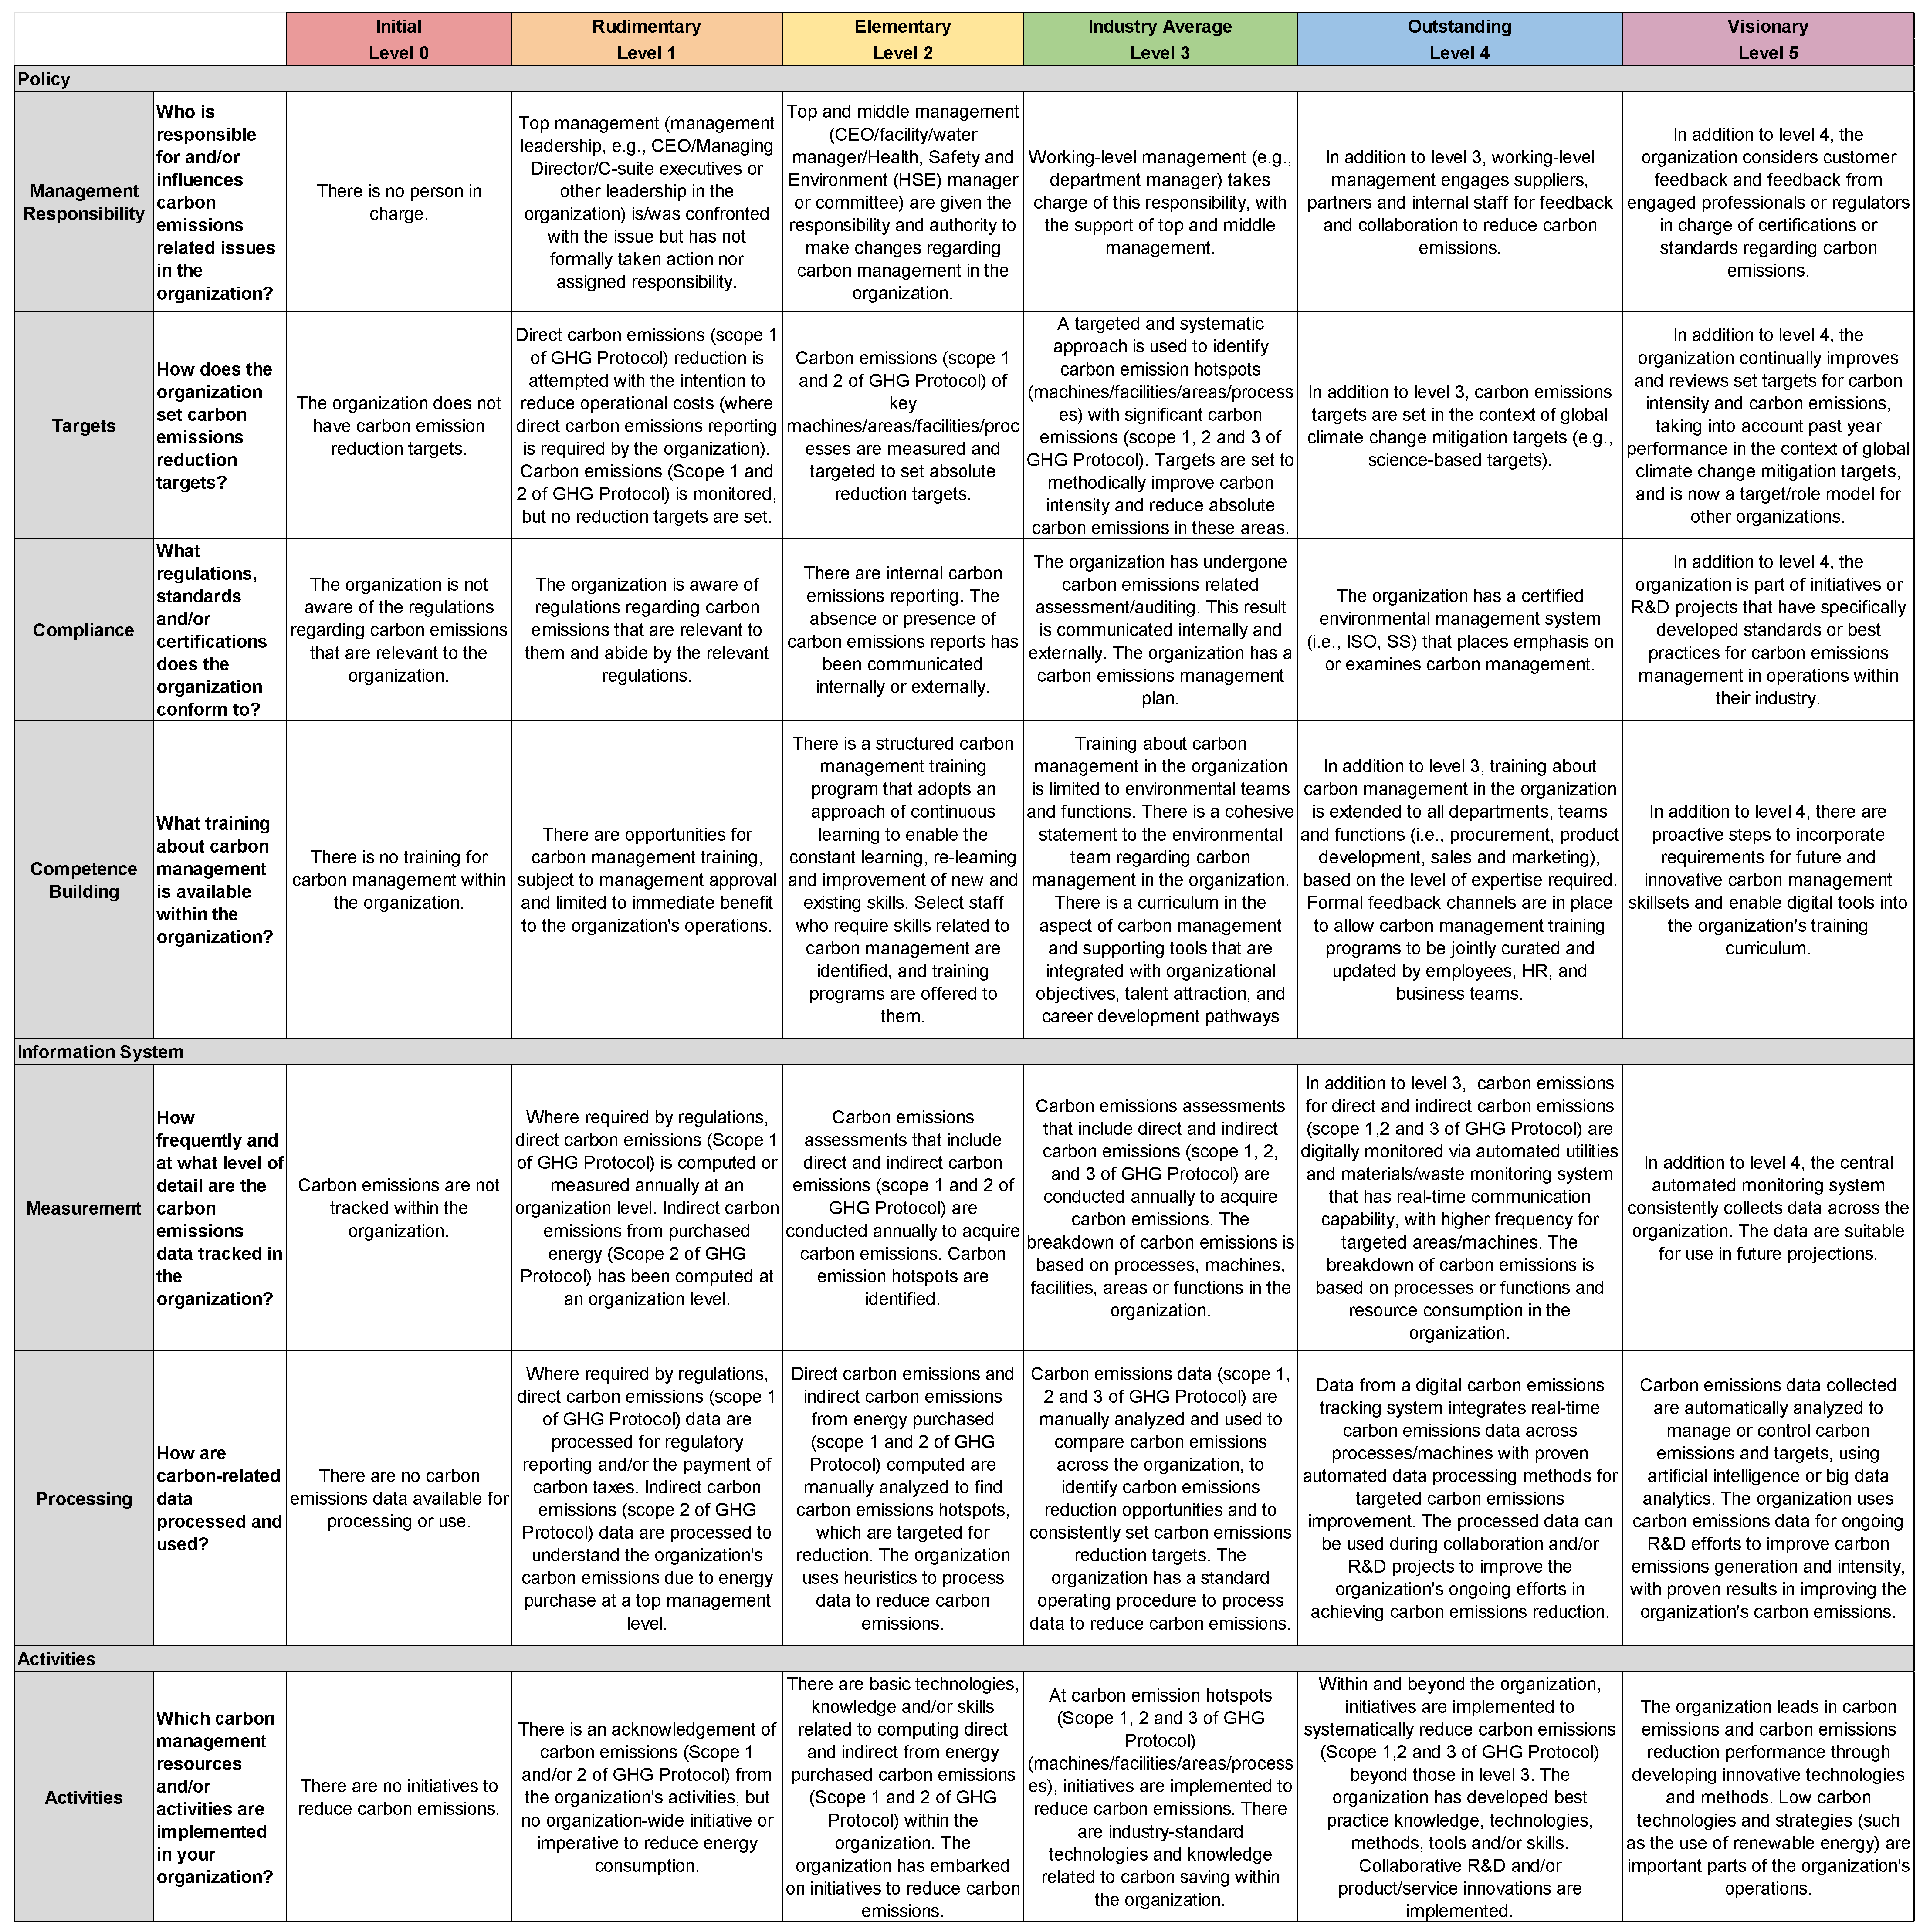
The framework design follows the proposal by Fraser et al. regarding the components and addresses five design questions [82] (see Table 4).

4.1.1. Dimensions

Dimensions have the function of describing what is being assessed. Based on the ideas introduced in Section 2, the dimensions, domains, and sub-domains are constructed (see Figure 3). Thus, the assessment framework consists of six dimensions represented by separate maturity models and at least seven sub-domains that assess the business across three domains. In this work, domains and sub-domains can be seen as sub-categories of one dimension.
The innermost circle represents the core component of CES and its assessment—the ES problem domains that are transferred into ES design principles. The ES design principles are set in the context of the business view and represent the second component of CES—the three defined corporate business activities from Section 2.2. The product is refined to the product life cycle, since we want to address the design and management of a product’s sustainability performance across the whole life cycle. Additionally, supply chain is refined to supply network due to the broader definition scope [83] and includes all processes and communication related to a company’s supply chain. Finally, operations remain and include all operational processes within the company’s facilities. Since we aim to improve those processes regarding the ES problem domains, we name this “management in operations” for each ES problem domain.
Merging ES design principles with corporate business activities leads to six assessment dimensions: (1) sustainable product life cycle; (2) sustainable supply network; (3) carbon management in operations; (4) energy management in operations; (5) water management in operations; (6) material (waste) management in operations. Inspired by GRI, only the corporate business activity operations are divided into four assessment dimensions due to their respective relevance and scope [84].
In order to assess these dimensions, the domains policy, information systems, and activities are applied and extended using sub-domains. The function of the domains and sub-domains is to measure the progress in the assessment dimensions regarding the business transformation. In comparison to the original BE framework, we refine the domains business strategy to policy and processes to activities to limit the broad term definitions. The description of the sub-domains derived from reviewing GRI, CDP, and various MMs can be found in Table A2.
As described in Section 2.3, digitalization is considered as a lever for ES. Thus, we place it directly within the domain information systems. Digitalization is incorporated with the sub-domains data measurement and processing concerns (see Figure 3). These two sub-domains of information systems address the central questions regarding the digitization degree of processes, characteristics of data (e.g., real-time obtained), and interoperability across the value network referring to the identified Industry 4.0 design principles. Depending on the corporate business activity, different thematic focuses are set. For instance, vertical integration relates to operations, while horizontal integration to the supply chain and interoperability and virtualization to the product.
However, digitalization is not limited to IS but is also partly addressed in policy and activities. Here, for instance, the application of new (digital) technologies regarding knowledge management (e.g., in competence building) or driving innovations (e.g., in activities) interconnects the three domains and contributes to a higher CES state.
The general technologies form a foundation for quantitative data collection and data quality assessment through their characteristics (e.g., automated processes or predictive analytics).

4.1.2. Maturity Levels

Maturity levels can classify the progress within a specific dimension and show the current state. In order to answer Fraser et al.’s questions regarding the maturity levels, the MM by Baumgartner and Ebner [68] is discussed and extended as a reference.
Baumgartner and Ebner propose four maturity levels to assess corporate sustainability. Based on this, Müller and Pfleger modify the model to five levels by separating the first level into two levels [38]. These five levels are in line with our understanding as well. However, in accordance with [65], a sixth level is required to include future-oriented factors and concepts (e.g., circular economy). According to King and Kraemer, the inclusion of evolution and change driving factors instead of predefined states is recommended [10]. Because of a common understanding of the CS maturity process with [38,68], the names of the levels are referenced from their work, extended by a sixth level, and renamed in two cases for clearer understanding. As a result, the following maturity level names are determined: initial, rudimentary, elementary integration, industry average, outstanding, and visionary. A detailed description of these levels can be found in Table A3. These descriptions address the general requirements for each level and are used to customize the MMs regarding each dimension, domain, and sub-domain.
In conclusion, each dimension is represented by a six-level maturity model similar to the carbon management in operations model shown in Figure 4. All other dimensions can be found in Figure A1, Figure A2, Figure A3, Figure A4 and Figure A5.

4.1.3. Indicators

Indicators have the function of justifying a specific maturity level depending on the degree of fulfilment. Depending on the assessment approach, qualitative or quantitative indicators can be used. These might be textual descriptions (qualitative assessment) or numerical data (quantitative assessment). Regarding MMs, various qualitative descriptions from existing MMs and reporting standards were compiled to meet our six maturity levels (see Figure 4). In the following, some of the integrated indicators are presented and set in the context of certain design principles we presented previously.
In the context of the MM development, each sub-domain was designed as a single-choice question with six descriptions, including aspects from the design principles and other sources (see Section 2). These were classified in such a way as to describe a roadmap towards an environmentally sustainable business based on the ideas of existing MMs and certain future-oriented factors (see Section 4.1.2).
For instance, the domain policy starts with nobody in charge of carbon management, missing targets, or missing awareness for existing or upcoming regulations, and no programs to enhance its employees in this field. This is the poorest policy state a company can have according to our scope. On the other hand, a company that sets climate mitigation targets in a global context (e.g., science-based targets) and ensures continuous improvements can be considered as a visionary company regarding targets.
How the company progresses depends strongly on the business transformation enablers that affect the company and which indicators are fulfilled in other sub-domains. A company that strives towards a visionary state might follow different pathways while approaching it. One possibility is to realize the descriptions of one specific sub-domain. However, at some point, obstacles or inefficiencies might appear that require measures from other sub-domains. We assume it might be difficult to drive continuous improvements of the entire company without sharing responsibilities, creating and contributing to a mindset of collaboration as addressed in the sub-domain management responsibility. Furthermore, the technological aspects of dealing with data might be of importance.
Following the visionary state in the sub-domain targets might lead at some point to the need for reliable data and information on carbon emissions. This issue is addressed in the domain information systems through the design principles of Industry 4.0.
Since it might be possible to be an environmentally friendly company without digitalization, digitalization gains its focus from level 4 on. At the prior maturity levels, e.g., in processing, we imply the digitization of data by using the term “computed”. Especially in the first levels, it is important to address the scope and approaches used to measure and process data. Only after understanding the role of data and relating it to the tasks and goals from other sub-domains can digitalization occur as the next step towards a visionary approach. In this context, aspects such as real-time capability, interoperability, and vertical integration (see Section 2.3) occur as necessary and can contribute to the implementation of a continuously improving process. This might help achieve the visionary state in targets. However, sharing responsibilities and having helpful information on carbon emissions is not sufficient for overall progress. It is necessary to include the initiatives and resources of the company that are invested in the topic of the dimensions. This is done via activities that question aspects such as innovation power, best practice, or technological progress related to the internal processes.
In conclusion, the described indicators show what the maturity levels contain and how the different sub-domains can affect each other. However, they reveal that there might be further need for clarification, such as identifying how a company ensures that it is on track and making continuous improvements. To answer this question, additional questionnaires were developed to collect additional qualitative and quantitative data for each sub-domain and maturity level (these questionnaires are still in the validation process and are only an exemplarily part of this publication). The purpose is to verify the statements from the maturity model.
Due to the simple approach regarding the MM and the time-intensive process of quantitative data collection, the MM is called the rapid assessment, and the questionnaires are the full assessment.

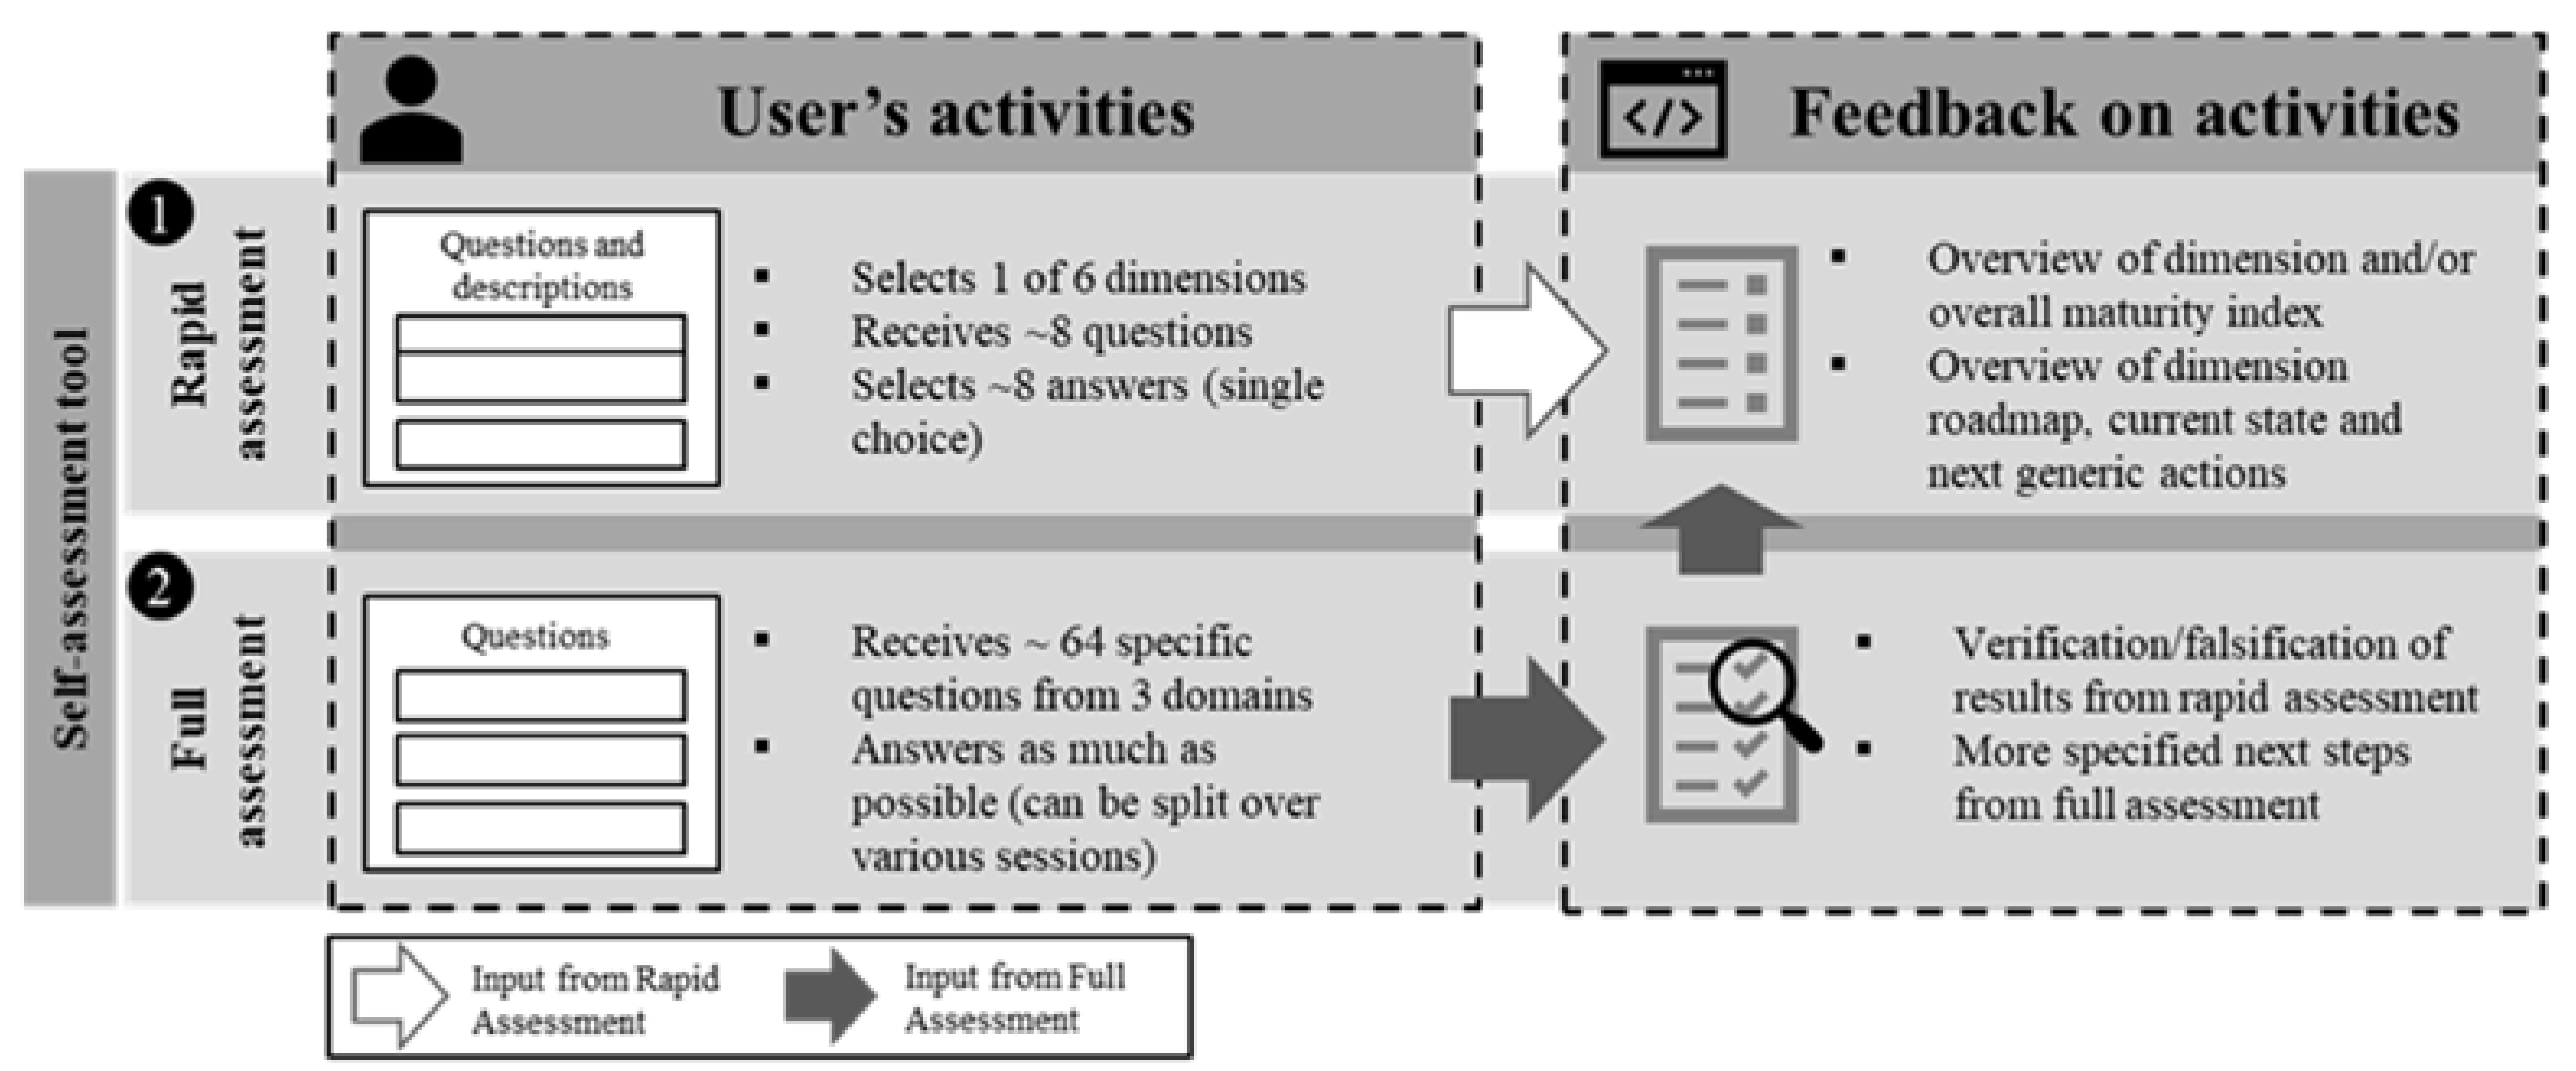
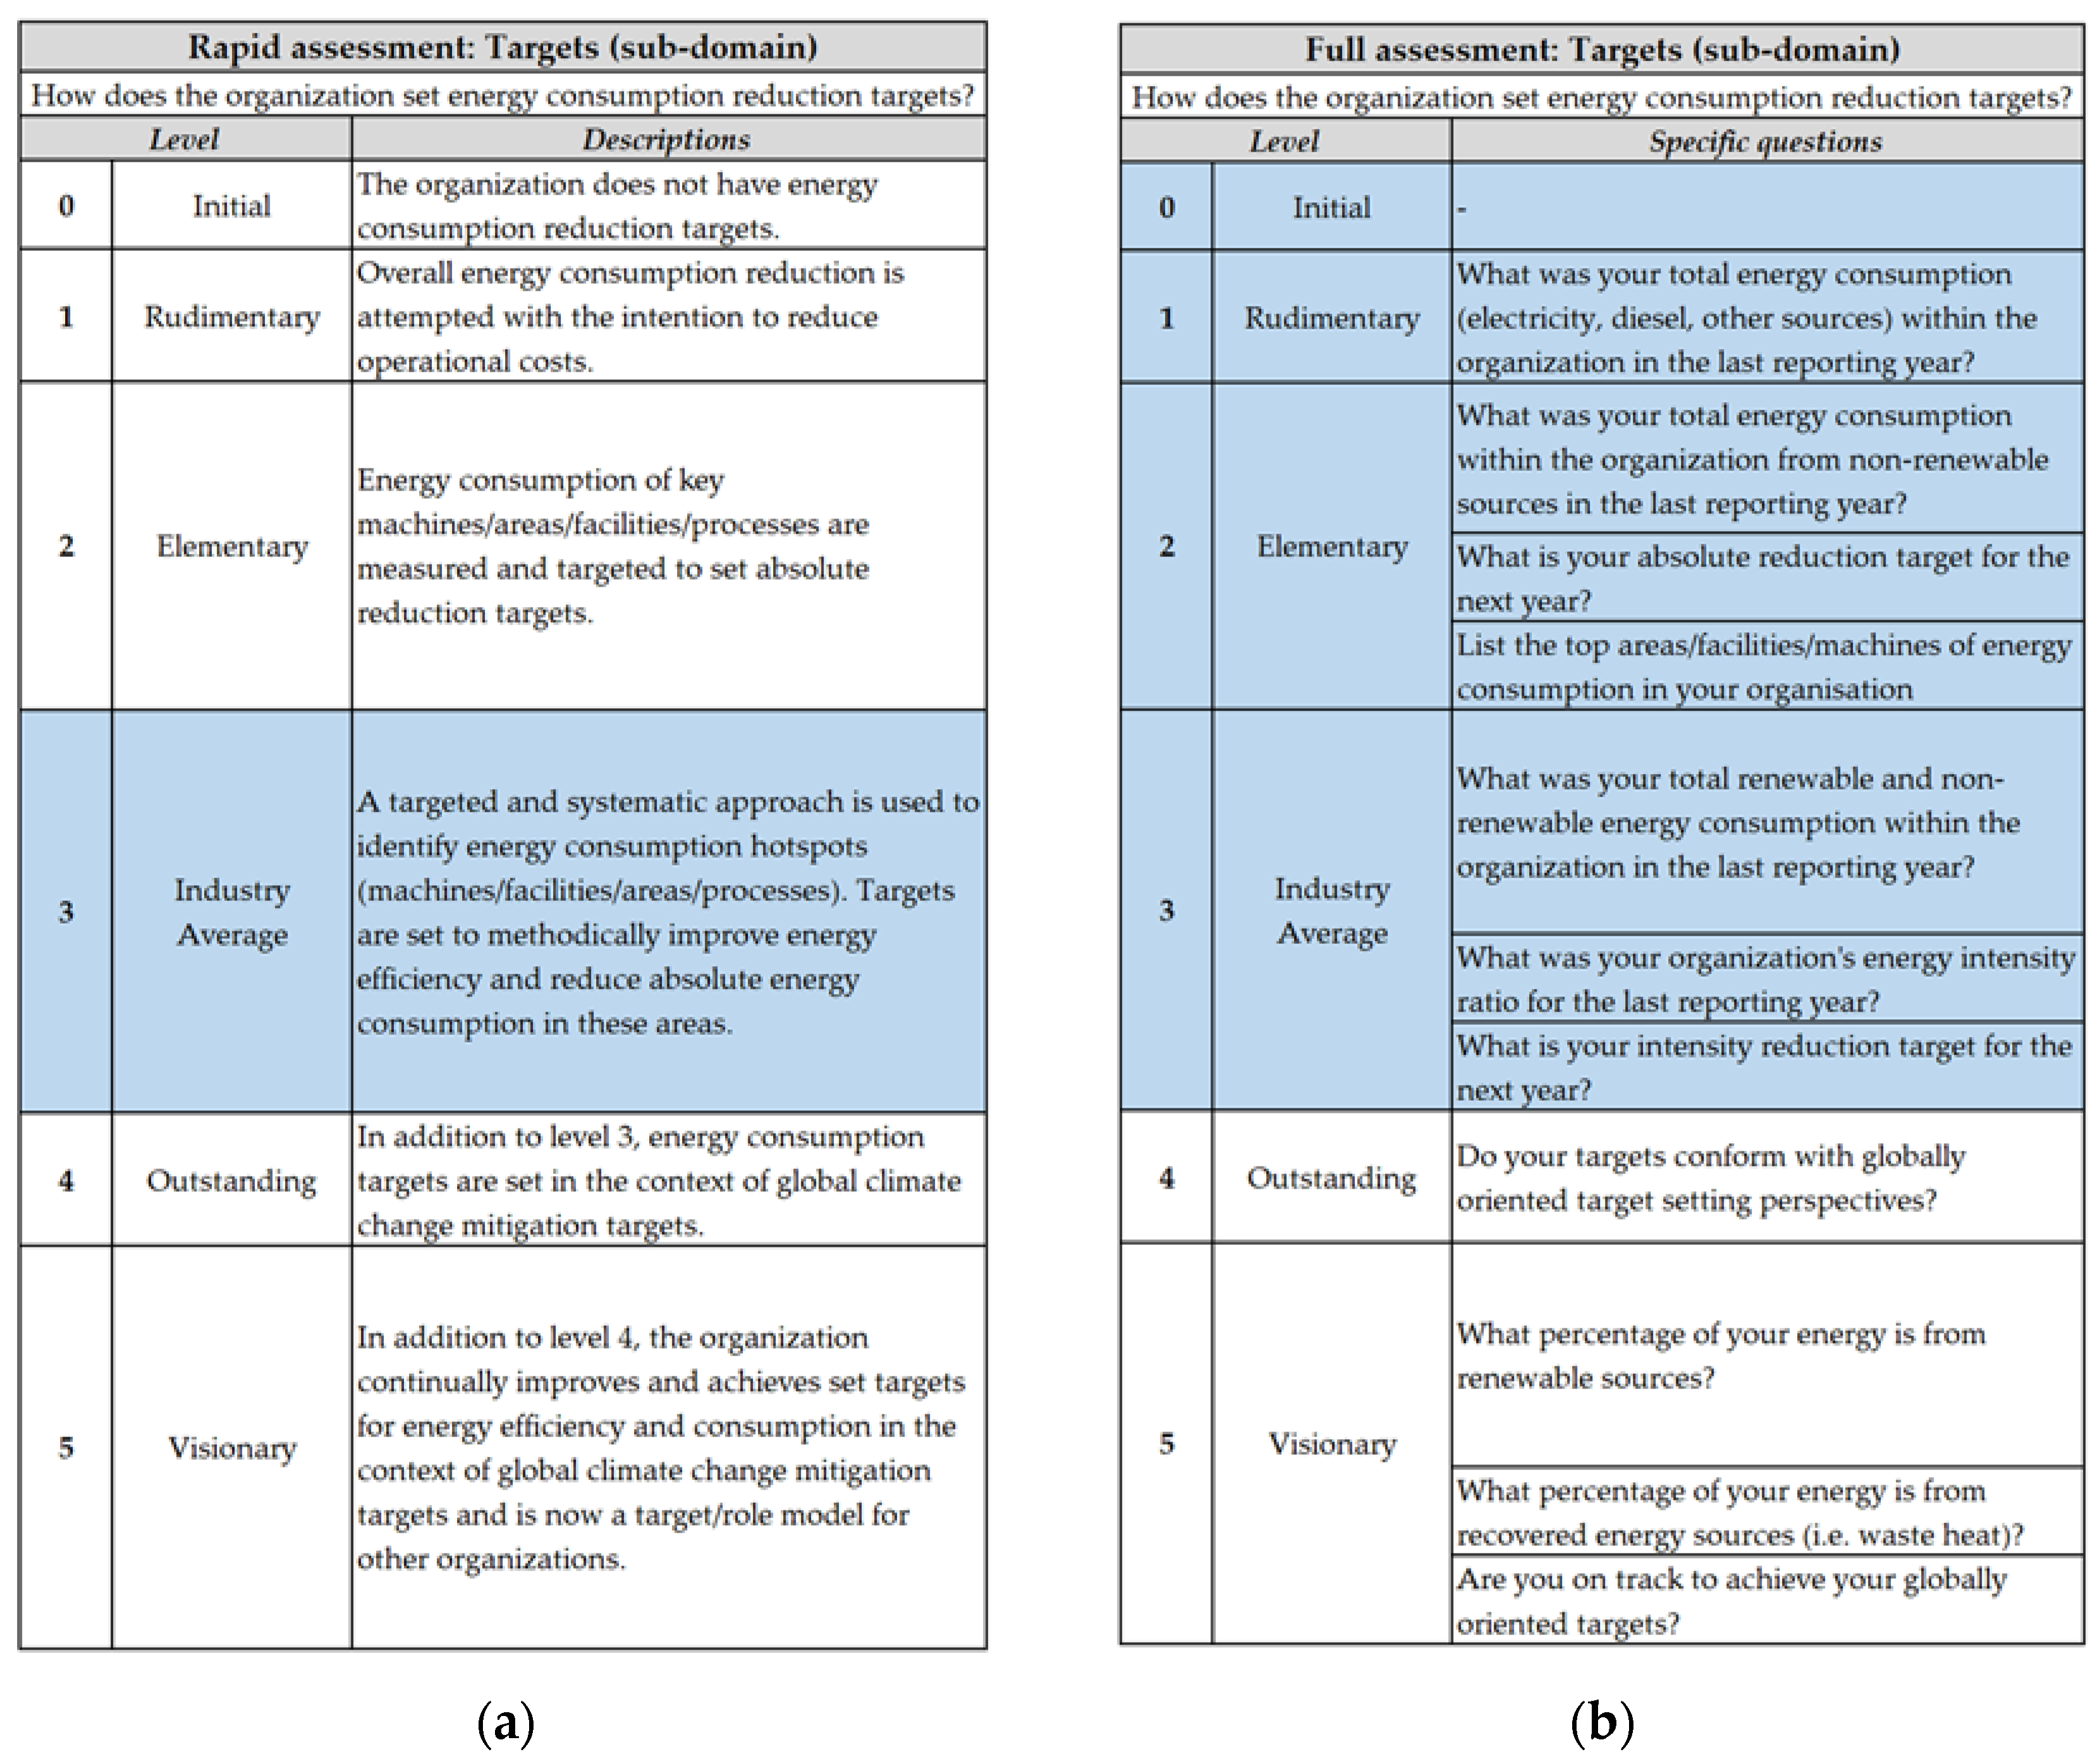
4.2. Framework Application

An exemplary application of the developed self-assessment tool is provided below.
The self-assessment starts with the rapid assessment. The goal of the rapid assessment is to provide a first approximation and characterization of the CES state of a company. In the rapid assessment, the user selects one dimension to be explored. Each dimension has, on average, eight questions (one per sub-domain), and each question has six descriptions representing the maturity levels from 0 to 5. The questions follow the order of the domains: policy, information systems, and activities. There are 48 questions across all dimensions, and overall, 288 qualitative descriptions for the complete rapid assessment. An exemplary question from the rapid assessment can be seen in Figure 5.
After the user completes the rapid assessment, the results are a maturity level and an overview of the company’s current state. The results might initiate internal discussions about the strategic orientation. Further, the company can assess its progress against the defined end state on the proposed roadmap (maturity level 5) and study the requirements for higher levels. The maturity level can reflect the progress within a sub-domain, domain, or the complete dimension.
The current scoring model can be found in Equations (A1)–(A5). However, this is a draft scoring model that is still subject to validation by the industry and must be investigated regarding the consequences for rating different maturity indexes.
Depending on a company’s resources and priorities, completing all dimensions within a rapid or full assessment is not obligatory.
However, applying the full assessment might convey deeper insights and new perspectives regarding improvement actions. For instance, by selecting level 3 on the given question from the sub-domain energy targets, various specific questions in the full assessment are addressed (see Figure 6). In the following case, level 3 in the rapid assessment addresses “a … systematic approach … to identify energy consumption hotspots”. If a systematic approach is applied, it can be checked by asking for the “energy intensity”. Since the energy intensity is an indicator that requires the availability of data at an aggregate level, it can imply that a systematic approach is used. Further, we can also see the differences between the topics in the maturity levels of the full assessment. For instance, there is a differentiation regarding energy consumption. While level 3 requires information about renewable and non-renewable energy, level 4 relates the energy topic to a global-oriented target setting. The full assessment is a good opportunity to up- or downgrade the self-estimated state of the company in the rapid assessment. In general, a user who selects level 3 in the rapid assessment must answer all questions from levels 1 to 3 in the full assessment to verify level 3.
Nevertheless, a completed rapid assessment of the selected dimension is required to apply the full assessment. The full assessment contains in each dimension around 64 questions, not all of which must be answered immediately. Some questions might require additional time to analyze and collect data.

5. Evaluation Results

In the following Sections, the evaluation results of the expert evaluation and the use case are presented.

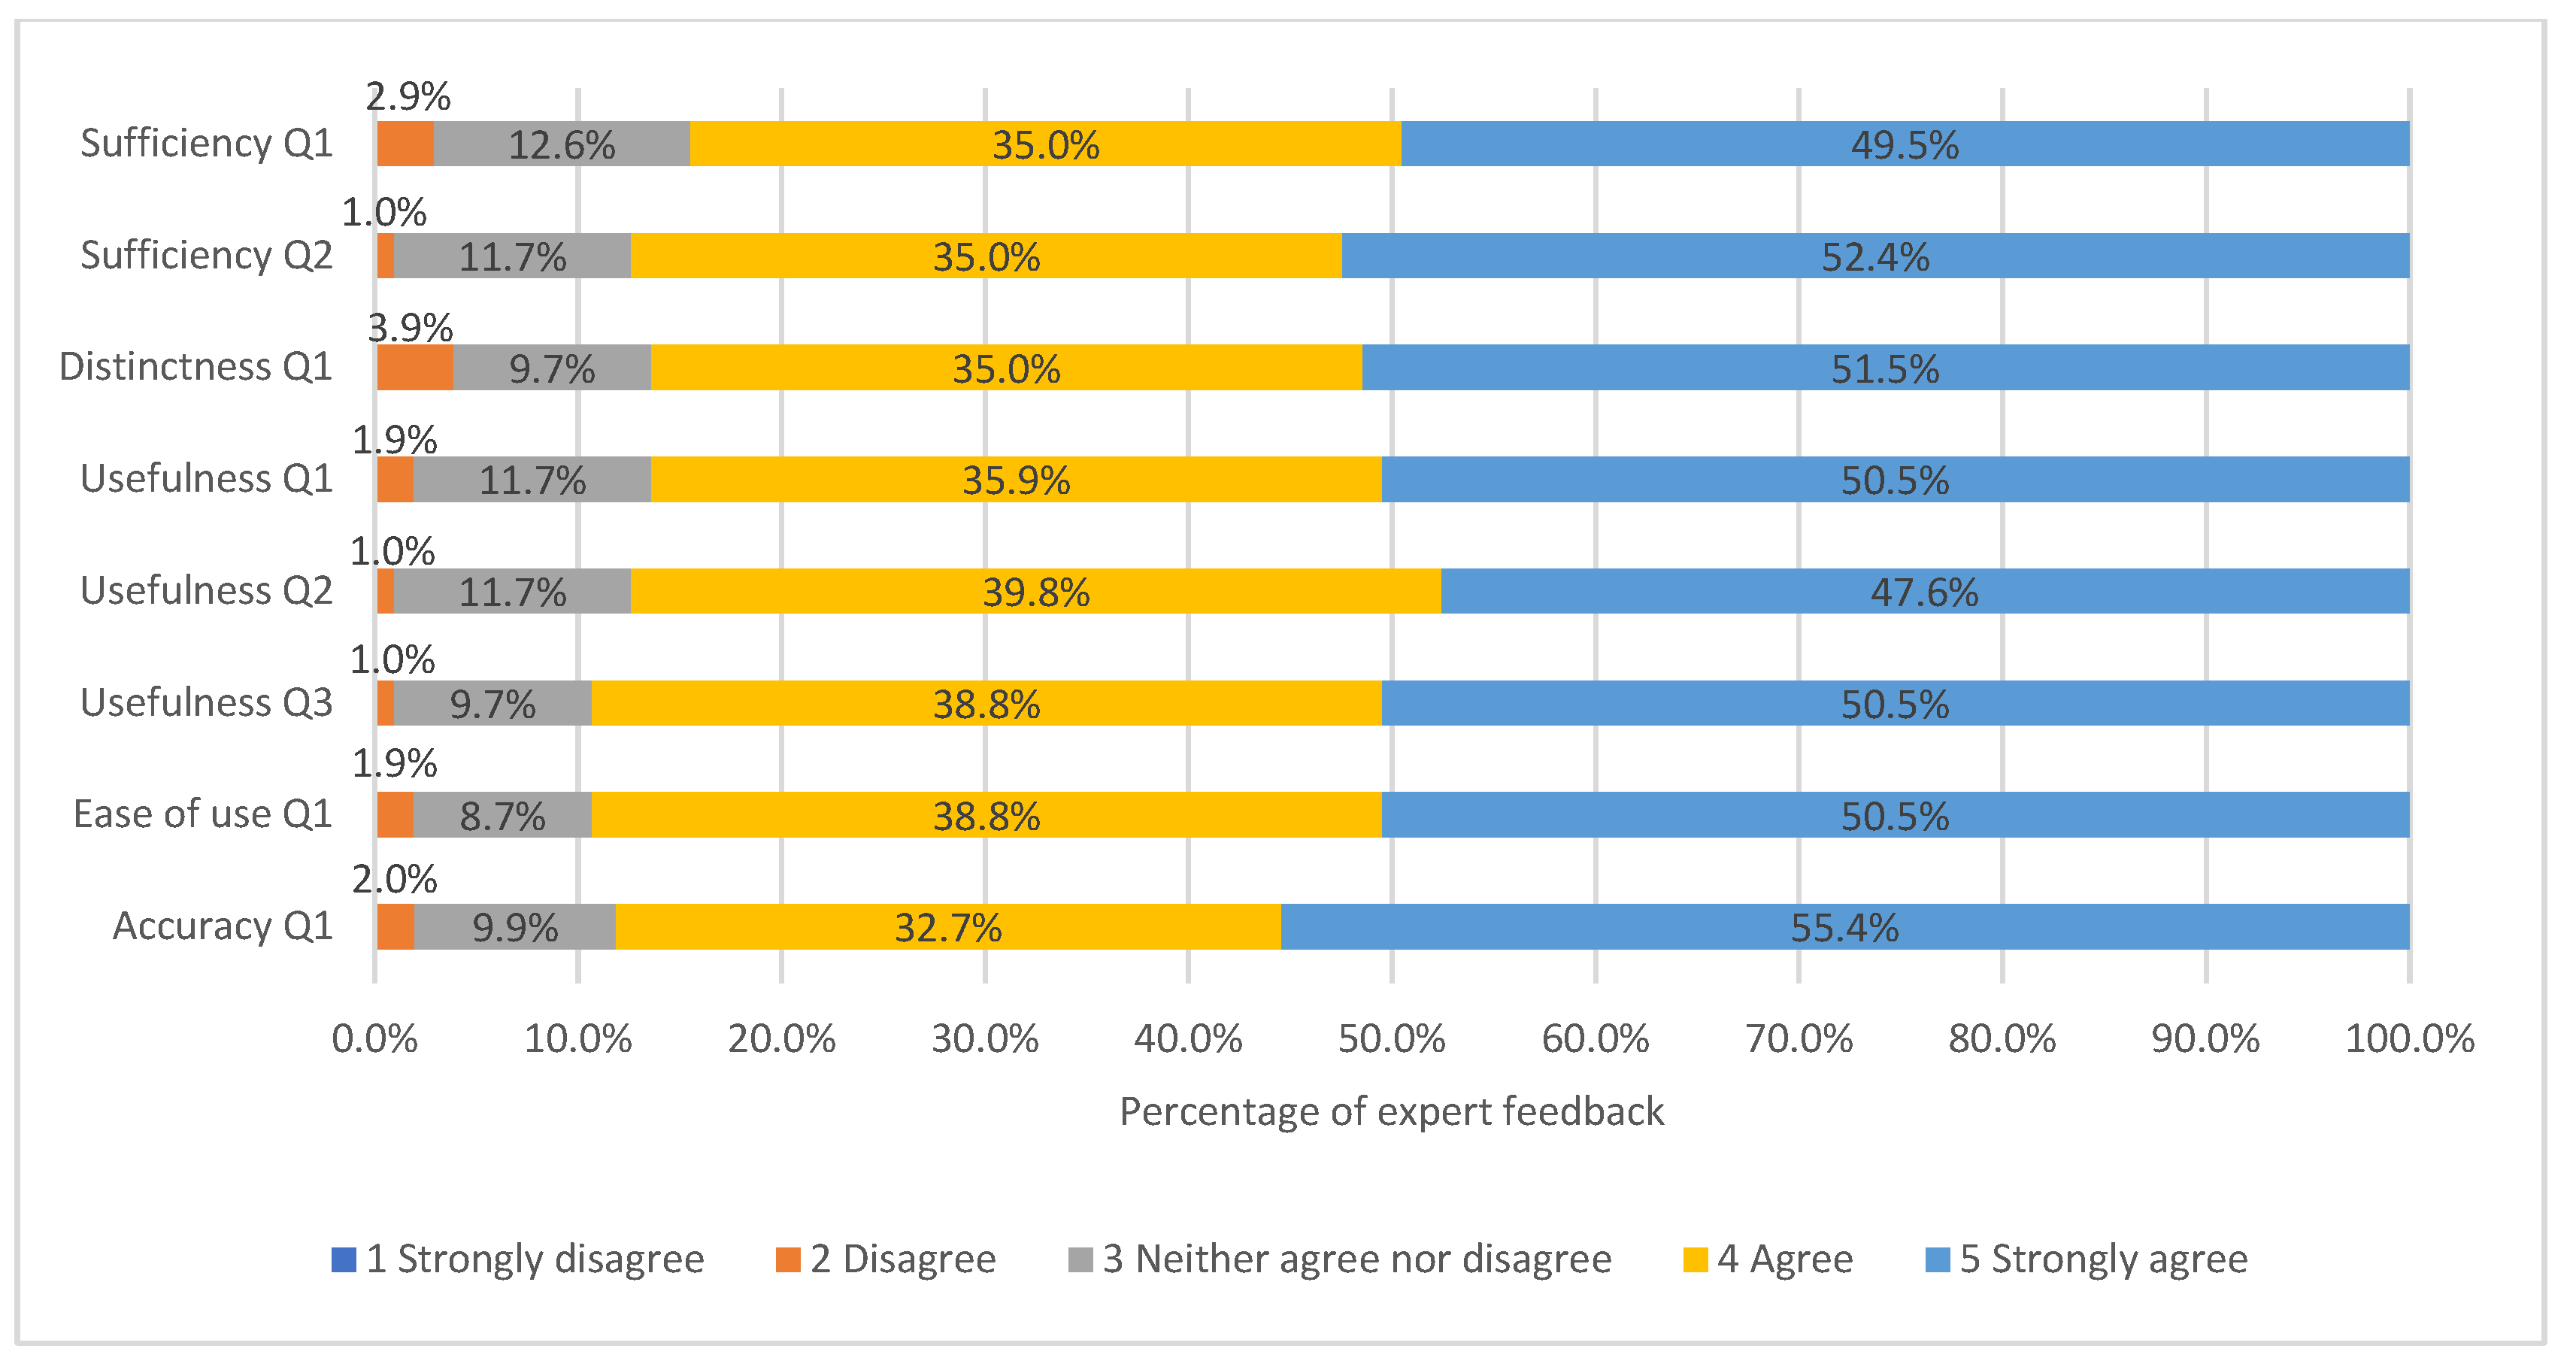
5.1. Expert Evaluation

The assessment was first evaluated by a group of experts. Within the assessment, we specifically evaluated the MMs to identify how they can be improved.
Regarding the assessment, the experts provided general feedback about the user experience. They mentioned that the descriptions for the domain and sub-domain are required to understand the purpose of each question and that the level descriptions in the MM were lengthy, while some descriptions were not clear. We improved this by including descriptions of the domains and sub-domains to explain their roles and rephrased descriptions by taking the experts’ feedback and making it more concise. There were a few comments on data privacy, indicating that the company doing the self-assessment might not be comfortable sharing their data. The authors share this concern and note that data will be confidential and meant to support the assessment and the company’s internal tracking. Future work will aim to understand the extent to which industries are willing to provide data for the assessment.
Specific to the MMs, the quantitative feedback shows that across all sub-domains for the dimensions, more than 85% of the expert feedback across the different evaluation aspects were rated “4—agree” or “5—strongly agree”, with no experts rating “1—strongly disagree”(see Figure 7). This indicates a high level of agreement among the experts in terms of the accuracy, ease of use, usefulness, distinctness, and sufficiency of the MM descriptions. Feedback from experts who rated the MM description poorly provided qualitative feedback in the relevant evaluation aspects.
In addition to the quantitative feedback for the MMs, the experts provided specific qualitative feedback across the five evaluation aspects. Despite the high level of agreement in the quantitative feedback, the qualitative feedback provided more insights for improving the MMs. The experts’ qualitative feedback was consolidated, and the key feedback categories are summarized in Table 5.
Most of the feedback is related to the terminology or clarity of phrasing in the MM-level description. Some terms used were not clear or were perceived to be too technical for the user. We rephrased some of the terms and prepared a glossary for terms that may be new to the users. Where the phrasing of the description was not clear, the descriptions were rephrased. Within the sufficiency and accuracy aspects, experts identified missing aspects or found that the scope of some descriptions was not accurate. When commenting on the distinctness, there was feedback of overlapping across some of the level descriptions. The experts’ suggestions were considered and incorporated.
A few experts commented that the descriptions were not broad enough for all companies, especially companies that provide services and only have office operations. This may be a limitation of the individual dimensions of the self-assessment, as there is an emphasis on companies that may be resource-intensive in their operations. However, companies have the flexibility to select the dimensions that are most relevant to their business, and a company that provides services may find the sustainable supply network dimension, where the emphasis is on working with suppliers, to be more relevant to their sustainability strategy.
Within the usefulness aspect that checks whether the descriptions clearly measure the company’s performance in the relevant sub-domain, some experts questioned the appropriateness of certain criteria as an indication of sustainability maturity, for example, whether a higher frequency of measurement or automation reflects a higher level of sustainability. The authors reconsidered the criteria and implemented changes that supported and clarified these aspects.
In terms of the usefulness of the self-assessment used to identify areas of improvement, several experts commented that companies might be able to identify the general improvement direction. However, more specific actions or technologies will be useful for the actual next steps. This will be considered in future work, where recommendations to companies to achieve the next levels can be provided.
The feedback evaluated was incorporated as an expert-validated version of the MMs. Certain feedback was useful but not adopted and was instead noted for future improvement for the self-assessment. An example is the expansion of dimensions to incorporate other environmental aspects such as biodiversity. The updated version was used in the industry evaluation.

5.2. Use Case

As the company was interested in an overview of their ES in dimensions relevant to their operations, they opted to conduct only the rapid assessment for selected dimensions. The dimensions selected by the company were material management in operations, carbon management in operations, sustainable supply network, and sustainable product life cycle.
Questions in the rapid assessment for the selected dimensions were sent to each reviewer. The results of the rapid assessment were generated and sent back to the company for review.Figure 8 shows a sample of the results sent to the company.
The researchers then conducted an online interview to gather feedback regarding the MM from the assessment based on questions in Table A4. The person from the company selected “4—agree” for all questions aside from the question “I am able to select a description that best fits my company”, where “3—neither agree nor disagree” was selected. This was because the person was not able to answer all questions and had to consult other departments for some of the subdomains.
Overall, the person found that the assessment was applicable to helping the company identify their current state of sustainability and identify areas for improvement. From the results in Figure 8, the company was able to identify that they were in the rudimentary stage in the “targets” and “competence building” sub-domains and could see what they can work on to improve. This feedback highlights the benefits of this assessment framework in terms of helping in strategy development, obtaining knowledge on what is needed, and determining a starting point for improvement.
With respect to the limitations of the assessment, the company shared that it would be more useful to understand the level of sustainability of the industry and competitors to enable benchmarking. That may be tackled by encouraging more companies to complete the assessment and share their results to generate data on the industry average and identify actions or companies leading the industry. Here, we see the potential for digitization to support the collection of data. Additionally, a barrier for the implementation identified by the person was the need to involve managers from different departments and the management team to implement improvements based on the results of the assessment. Additionally, the inclusion of digitalization can facilitate data collection for quantitative questionnaires. For instance, a digital platform might automatically request specific or updated data from the people in charge. That would make it easier for companies to review their performance by benchmarking against their previous results continuously.

5.3. Discussion

Based on the previous sections and Sections, the self-assessment tool and the results from the evaluation are discussed.

5.3.1. Discussion on the Integrated Consideration of Sustainability and Digitalization

The developed self-assessment tool is limited to ES. This might be a relevant shortcoming since businesses still rely on economic information for decision-making. However, due to the growing relevance and interdependency between environmental and economic aspects (e.g., new value proposition by customers or penalties for environmental pollution), it can be claimed that companies deal indirectly with economic aspects as well. Nevertheless, these two aspects require a more systematic interconnection.
Despite the advantage of focusing on one sustainability dimension, this tool also lacks the social dimension from the TBL perspective. However, due to the environmental focus of this tool, it might be a practical foundation for further research on the integration of absolute sustainability (see Section 2.1). Target setting in the context of planetary boundaries might be a useful new indicator to assess companies’ progress regarding their business transformation.
Besides the critical view on the limited sustainability perspective, there must be an awareness of possible limitations to boost business transformation through digitalization. Companies with low levels in terms of policy and activities might level up with investments in digital technologies, but they could quickly stagnate. Even though different digital technologies can automate processes to execute them more efficiently or assess them more precisely, the boost effect might be lost if the technology is not applied correctly. Therefore, a company’s culture must be willing to transform. For instance, data measurement is a core element in IS that requires knowledge of useful methods, e.g., the life cycle assessment, as well as the minimum requirements for digital technologies for measurements, e.g., machine data. The company might level up through digitalization if these requirements are met due to the theoretical data quality ensured through these methods and tools. However, if management has not defined any improvement targets, the company might stagnate because the data will not be applied to drive any improvements. Therefore, it is important to balance and synchronize the requirements from different sub-domains.
Nevertheless, several constraints can stop a company from meeting the requirements. A lack of financial and human resources might impede the transformation. Setting sustainability targets by management might help in levelling up. However, if resources are missing to achieve the targets, the company might stagnate as well.
In conclusion, to overcome these challenges regarding the methods, tools, and resources that might cause stagnation, the assessment framework requires a more digital approach, through which automated data supply can occur through sensor technologies or integration into existing PLM/PDM software, especially for companies with fewer resources.

5.3.2. Discussion of the Results

There are different reasons why companies might have problems progressing on their pathways towards sustainable business. This work emphasizes where and how to start the transformation. Considering concepts from existing ES and digitization tools, the proposal combines maturity models with a more specific questionnaire-based assessment. Furthermore, as the analysis of different maturity models from Section 3 shows, the content from existing maturity models requires a synthesis regarding relevant corporate business activities and environmental issues. Many maturity models focus only on specific corporate business activities such as product development, supply chains, or remanufacturing and miss opportunities to analyze a company holistically. At the same time, maturity models that assess corporate sustainability appear to not be validated by the industry. The advantages of synthesizing different corporate activities are that it enables companies to perform a holistically rapid assessment and provides one possible pathway towards sustainable business. Further, based on the results from the rapid assessment, the company can examine more specific questions based on internationally acknowledged standards and explore their next steps. Since companies are limited in their resources and might usually require advisory help to analyze their company or work through international reporting standards, the developed self-assessment tool might be helpful.
In both the expert and industry validation, the common feedback was that information is required from different departments to be able to complete the assessment. In the industry evaluation, the personnel were not able to answer certain questions related to another department. In addition, both the expert and company suggested that it would be beneficial for managers from various departments to agree on the next actions for the company. Taking these into consideration, a team-based approach to performing the assessment would be beneficial to provide a complete understanding of the company’s sustainability. Key personnel from various departments should be identified to participate in the assessment. After performing the assessment, the team could collaboratively identify areas for the next steps across the company.
Future work could consider incorporating other environmental or social aspects of sustainability. In addition, since executives and shareholders care about business metrics, an investigation on the correlation of the proposed measures and maturity levels with operating margins is required. Another shortcoming of the tool is that it cannot yet support benchmarking against other companies from the same sector. Therefore, further investigation and implementation of industry and location-specific characteristics might be required.

6. Conclusions

The objective of this work was to enable managers to assess their current state of CES. This self-assessment tool aimed to overcome five key enablers that impede an environmentally sustainable business transformation. This was achieved by combining different assessment approaches such as MMs and disclosure frameworks. This work makes the following key contributions:
  • Development of a self-assessment tool that closes the existing gap in maturity models between ES and digitalization;
  • Development of six aligned maturity models that provide a holistic view of CES based on our defined business perspective and the ES design principles;
  • Development of a novel modular sustainability assessment framework with a rapid and full assessment to enable companies to start with low resources and explore their businesses;
  • Provide an evaluated and promising approach to support companies in their transformation towards environmentally sustainable business.

7. Limitations and Future Work

The comparison of various maturity models and the feedback from the evaluation indicate certain shortcomings of the developed assessment tool.
Firstly, the current assessment scope is limited to the environmental perspective. Regarding the business context, the economic perspective might be of relevance since decision-making depends on the available resources.
Secondly, the assessment framework does not provide case-specific improvement steps. Currently, the companies explore the defined roadmap of the developed MMs depending on their current state.
Thirdly, the assessment framework is not able to benchmark companies from the same industry against each other. This might be an important limitation since benchmarking indicates the potential for improvement compared to the best companies in the market.
Based on the identified limitations, there is a need to continue the work on the assessment framework and widen the industry validation process.
Related to the first limitation, questions regarding useful decision-making parameters and tools arise. The digitization of the tool and the extension of the modules might improve the data collection and decision-making processes.
Furthermore, an automated recommendation process based on a gap analysis might be used to address the second limitation. In this way, the exploration of an MM roadmap could be avoided, and time could be saved through case-specific action steps.
Finally, benchmarking might be introduced through digitization and the construction of a platform and database. From broader datasets, new insights might be gained.

Author Contributions

Conceptualization, E.E., C.H. (Cadence Hsien) and Z.-Y.K.; methodology, E.E., C.H. (Cadence Hsien) and Z.-Y.K.; validation, C.H. (Cadence Hsien) and Z.-Y.K.; formal analysis, E.E.; investigation, E.E.; data curation, C.H. (Cadence Hsien) and Z.-Y.K.; writing—original draft preparation, E.E., C.H. (Cadence Hsien) and Z.-Y.K.; writing—review and editing, J.D., M.M., C.H. (Christoph Herrmann) and J.S.C.L.; visualization, E.E. and C.H. (Cadence Hsien); supervision, J.S.C.L., C.H. (Cadence Hsien) and J.D.; project administration, J.S.C.L.; funding acquisition, J.S.C.L. All authors have read and agreed to the published version of the manuscript.

Funding

This research was funded by A*STAR (Funding ID: I21D1AG008) and partially by BMBF (German Federal Ministry of Education and Research) via reference FKZ 01DP17049.

Institutional Review Board Statement

Not applicable.

Informed Consent Statement

Informed consent was obtained from all subjects involved in the study.

Data Availability Statement

No new data were created or analyszed in this study. Data sharing is not applicable to this article.

Conflicts of Interest

The authors declare no conflict of interest.

Appendix A

Table A1. Overview of the three business domains.
IDBusiness DomainsDefinition
1Business strategyThe starting point of business transformation is characterized by the corporate policy structure and its long-term orientation.
2Information systemsThis level supports processes via “computerized information processing”.
3ProcessThis level executes the defined policy in different fields of activity.
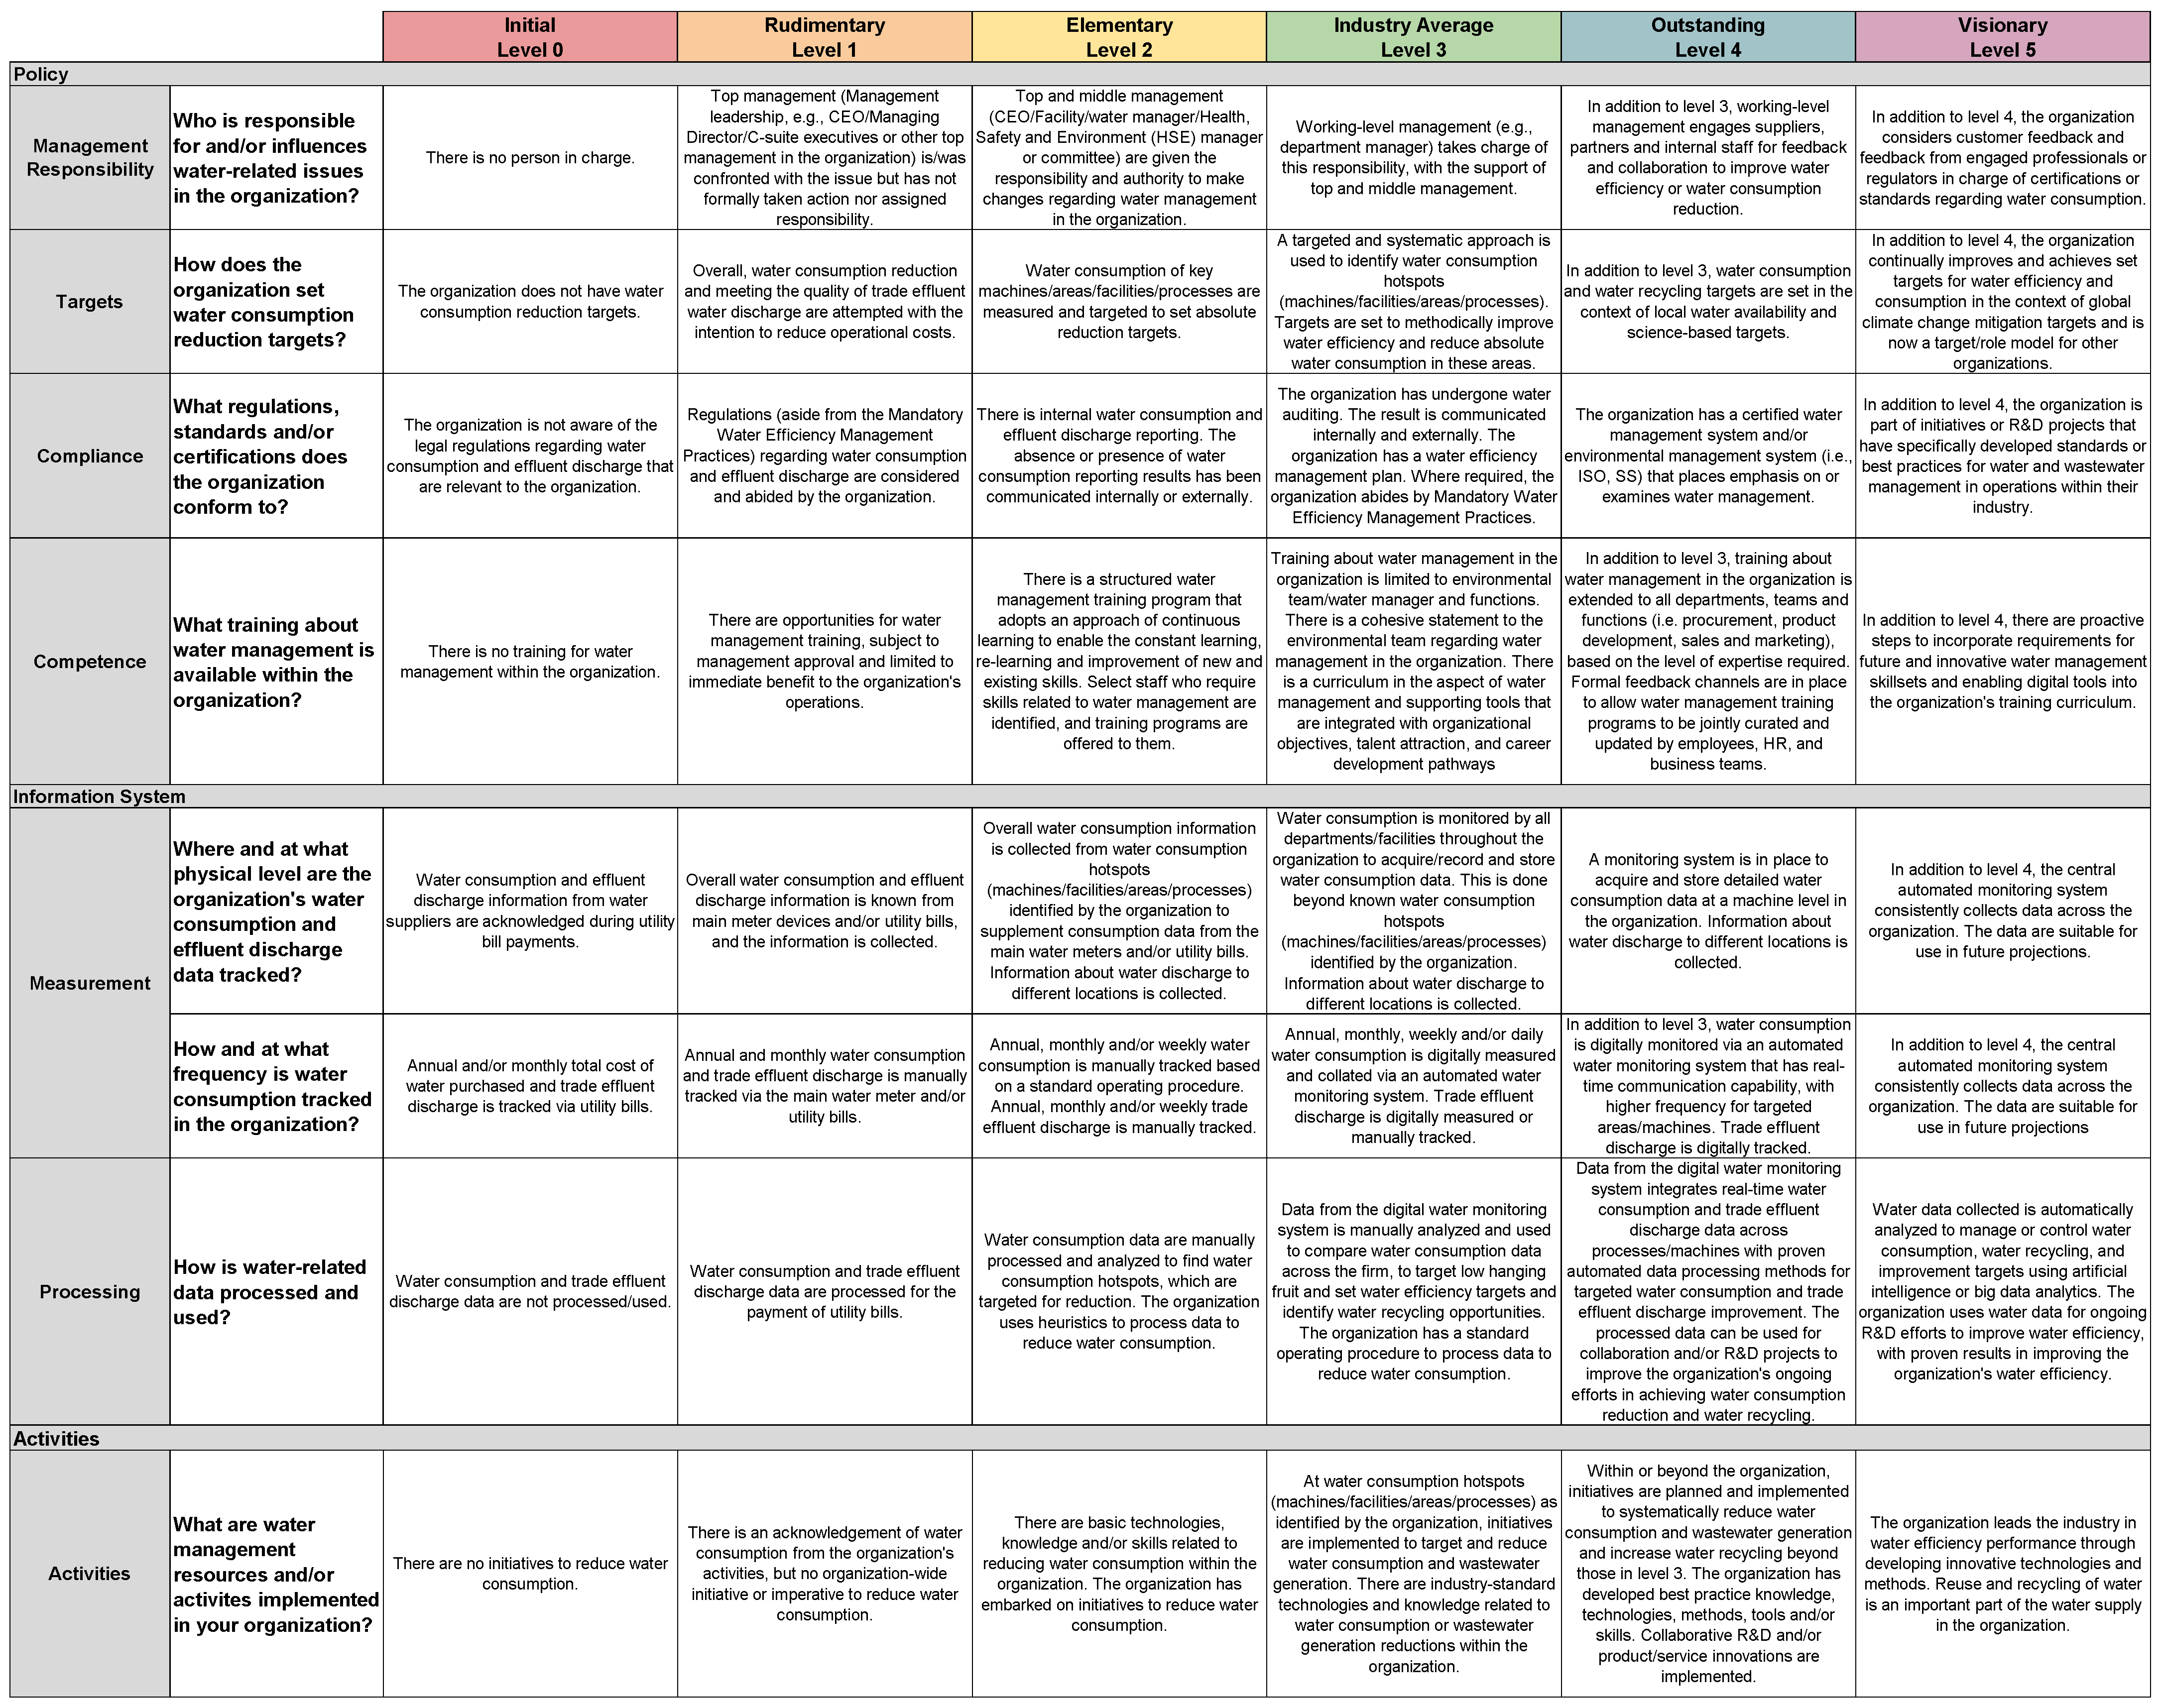
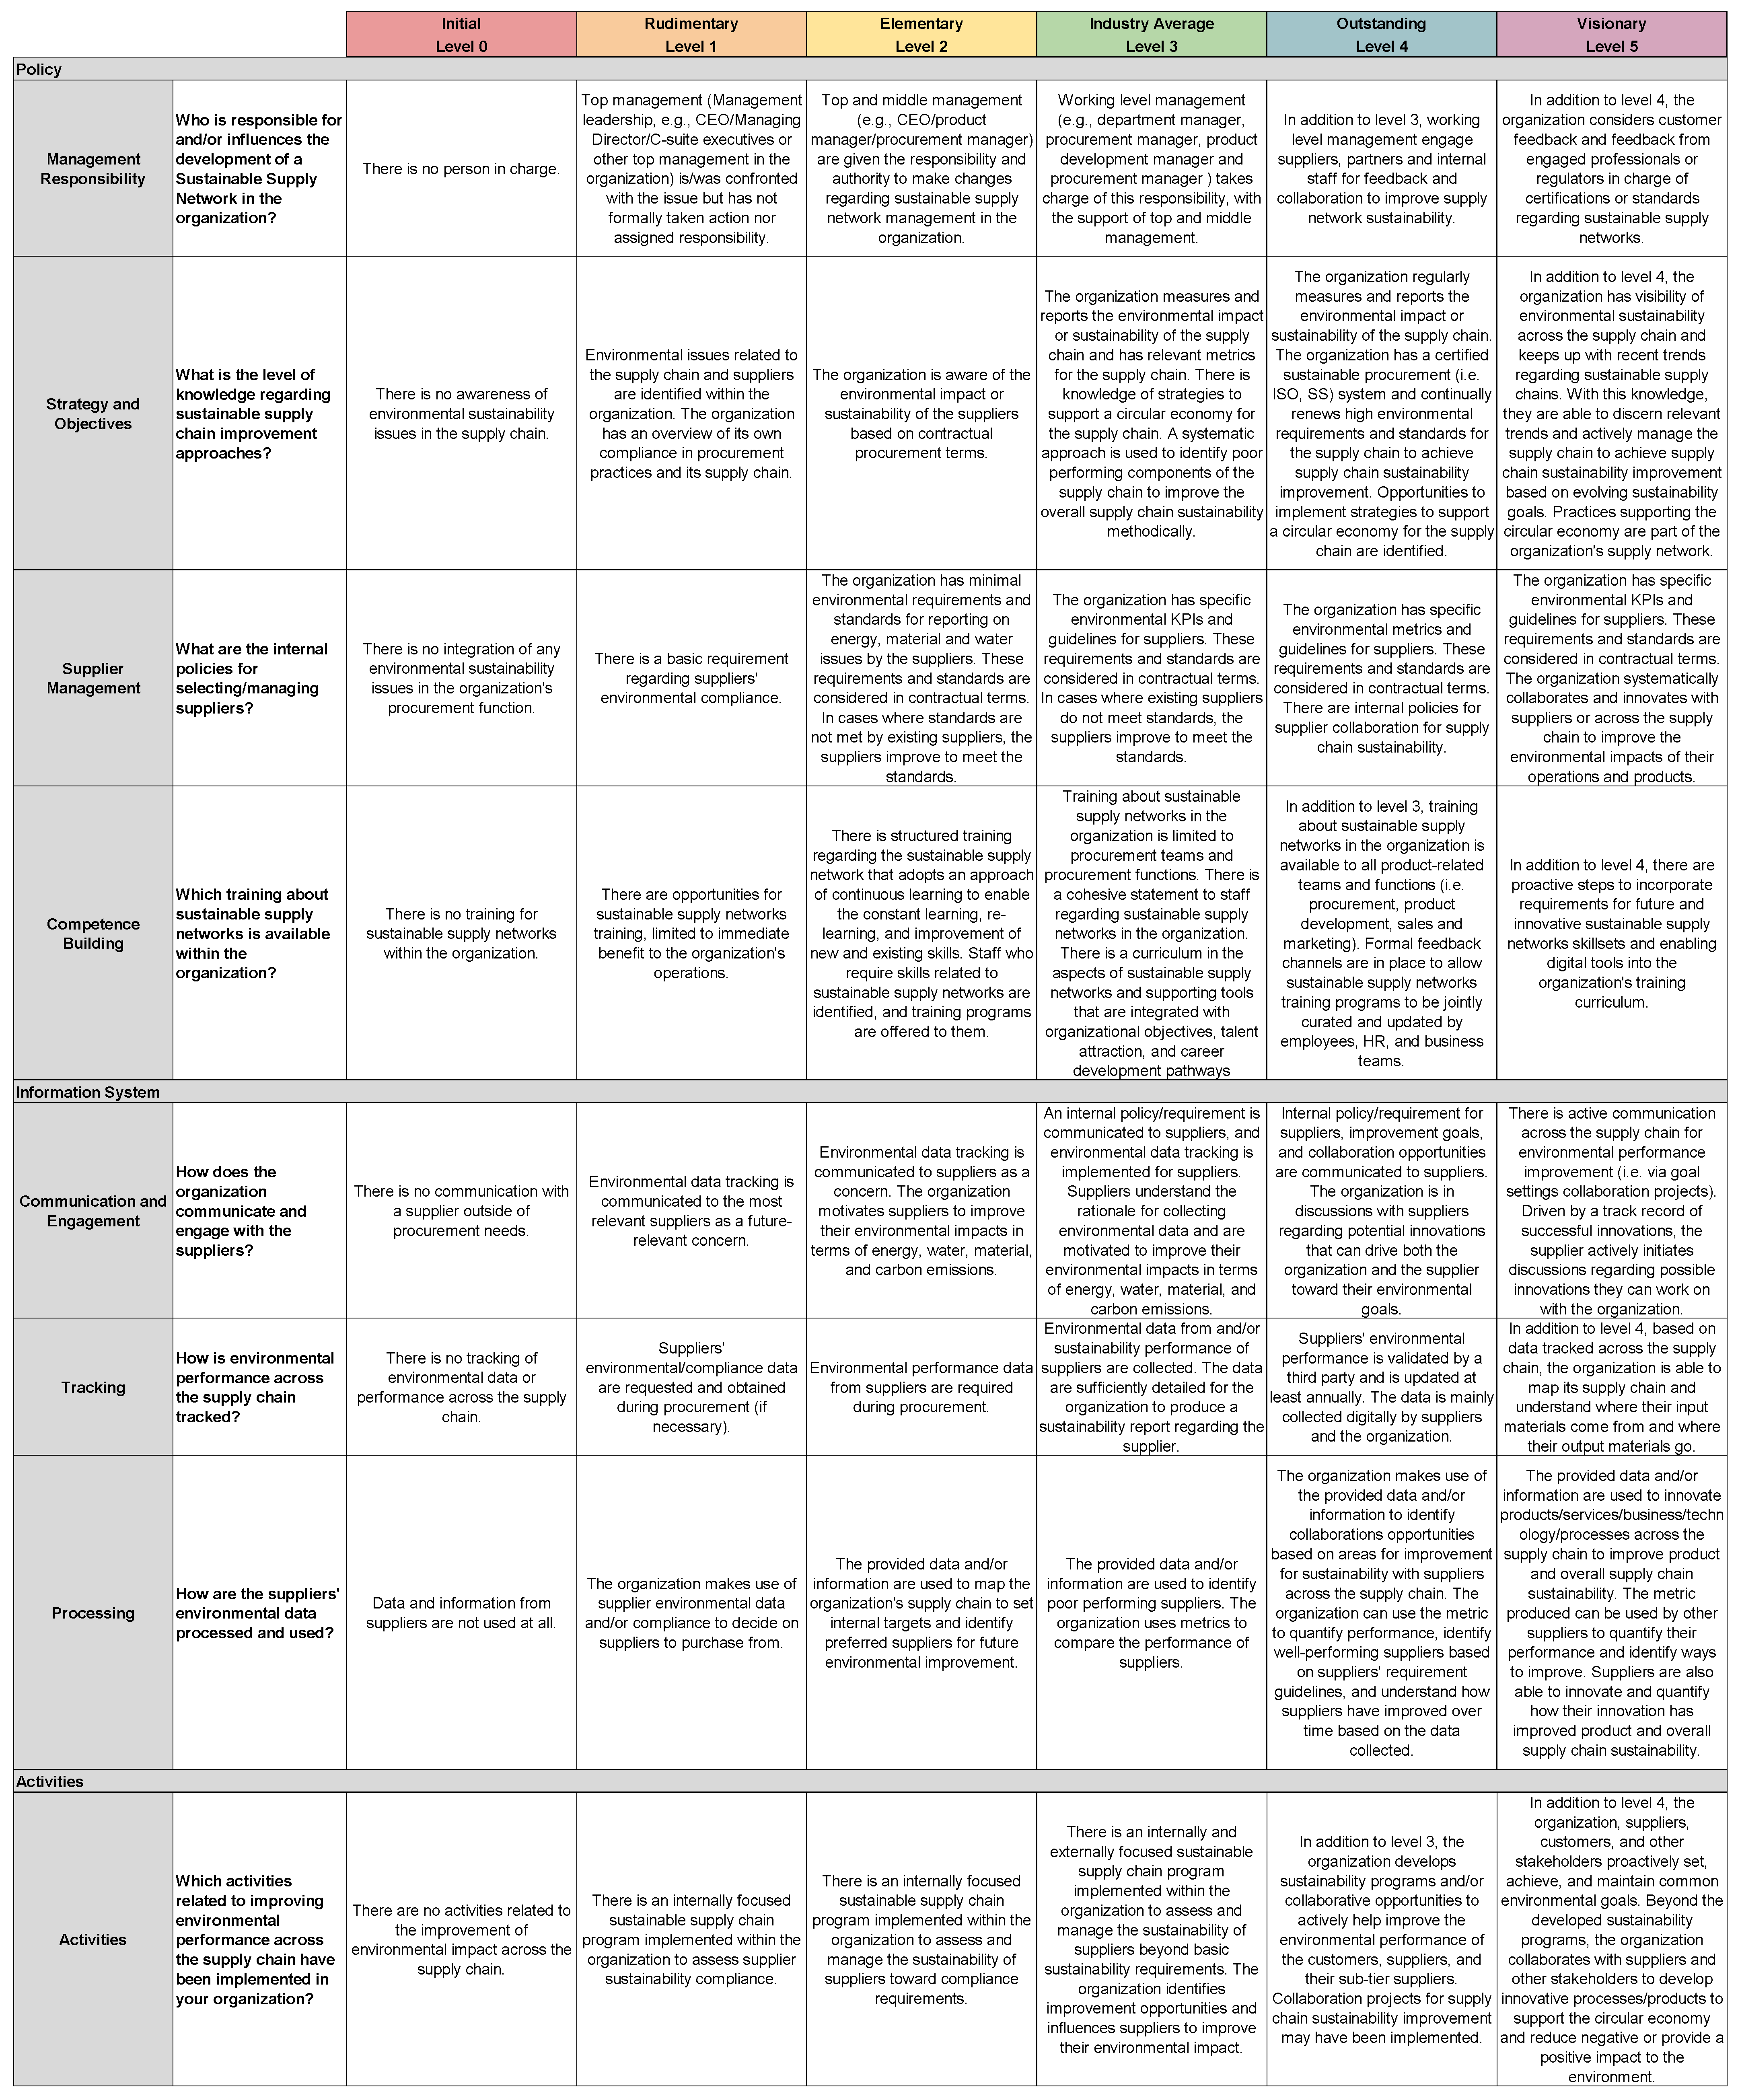
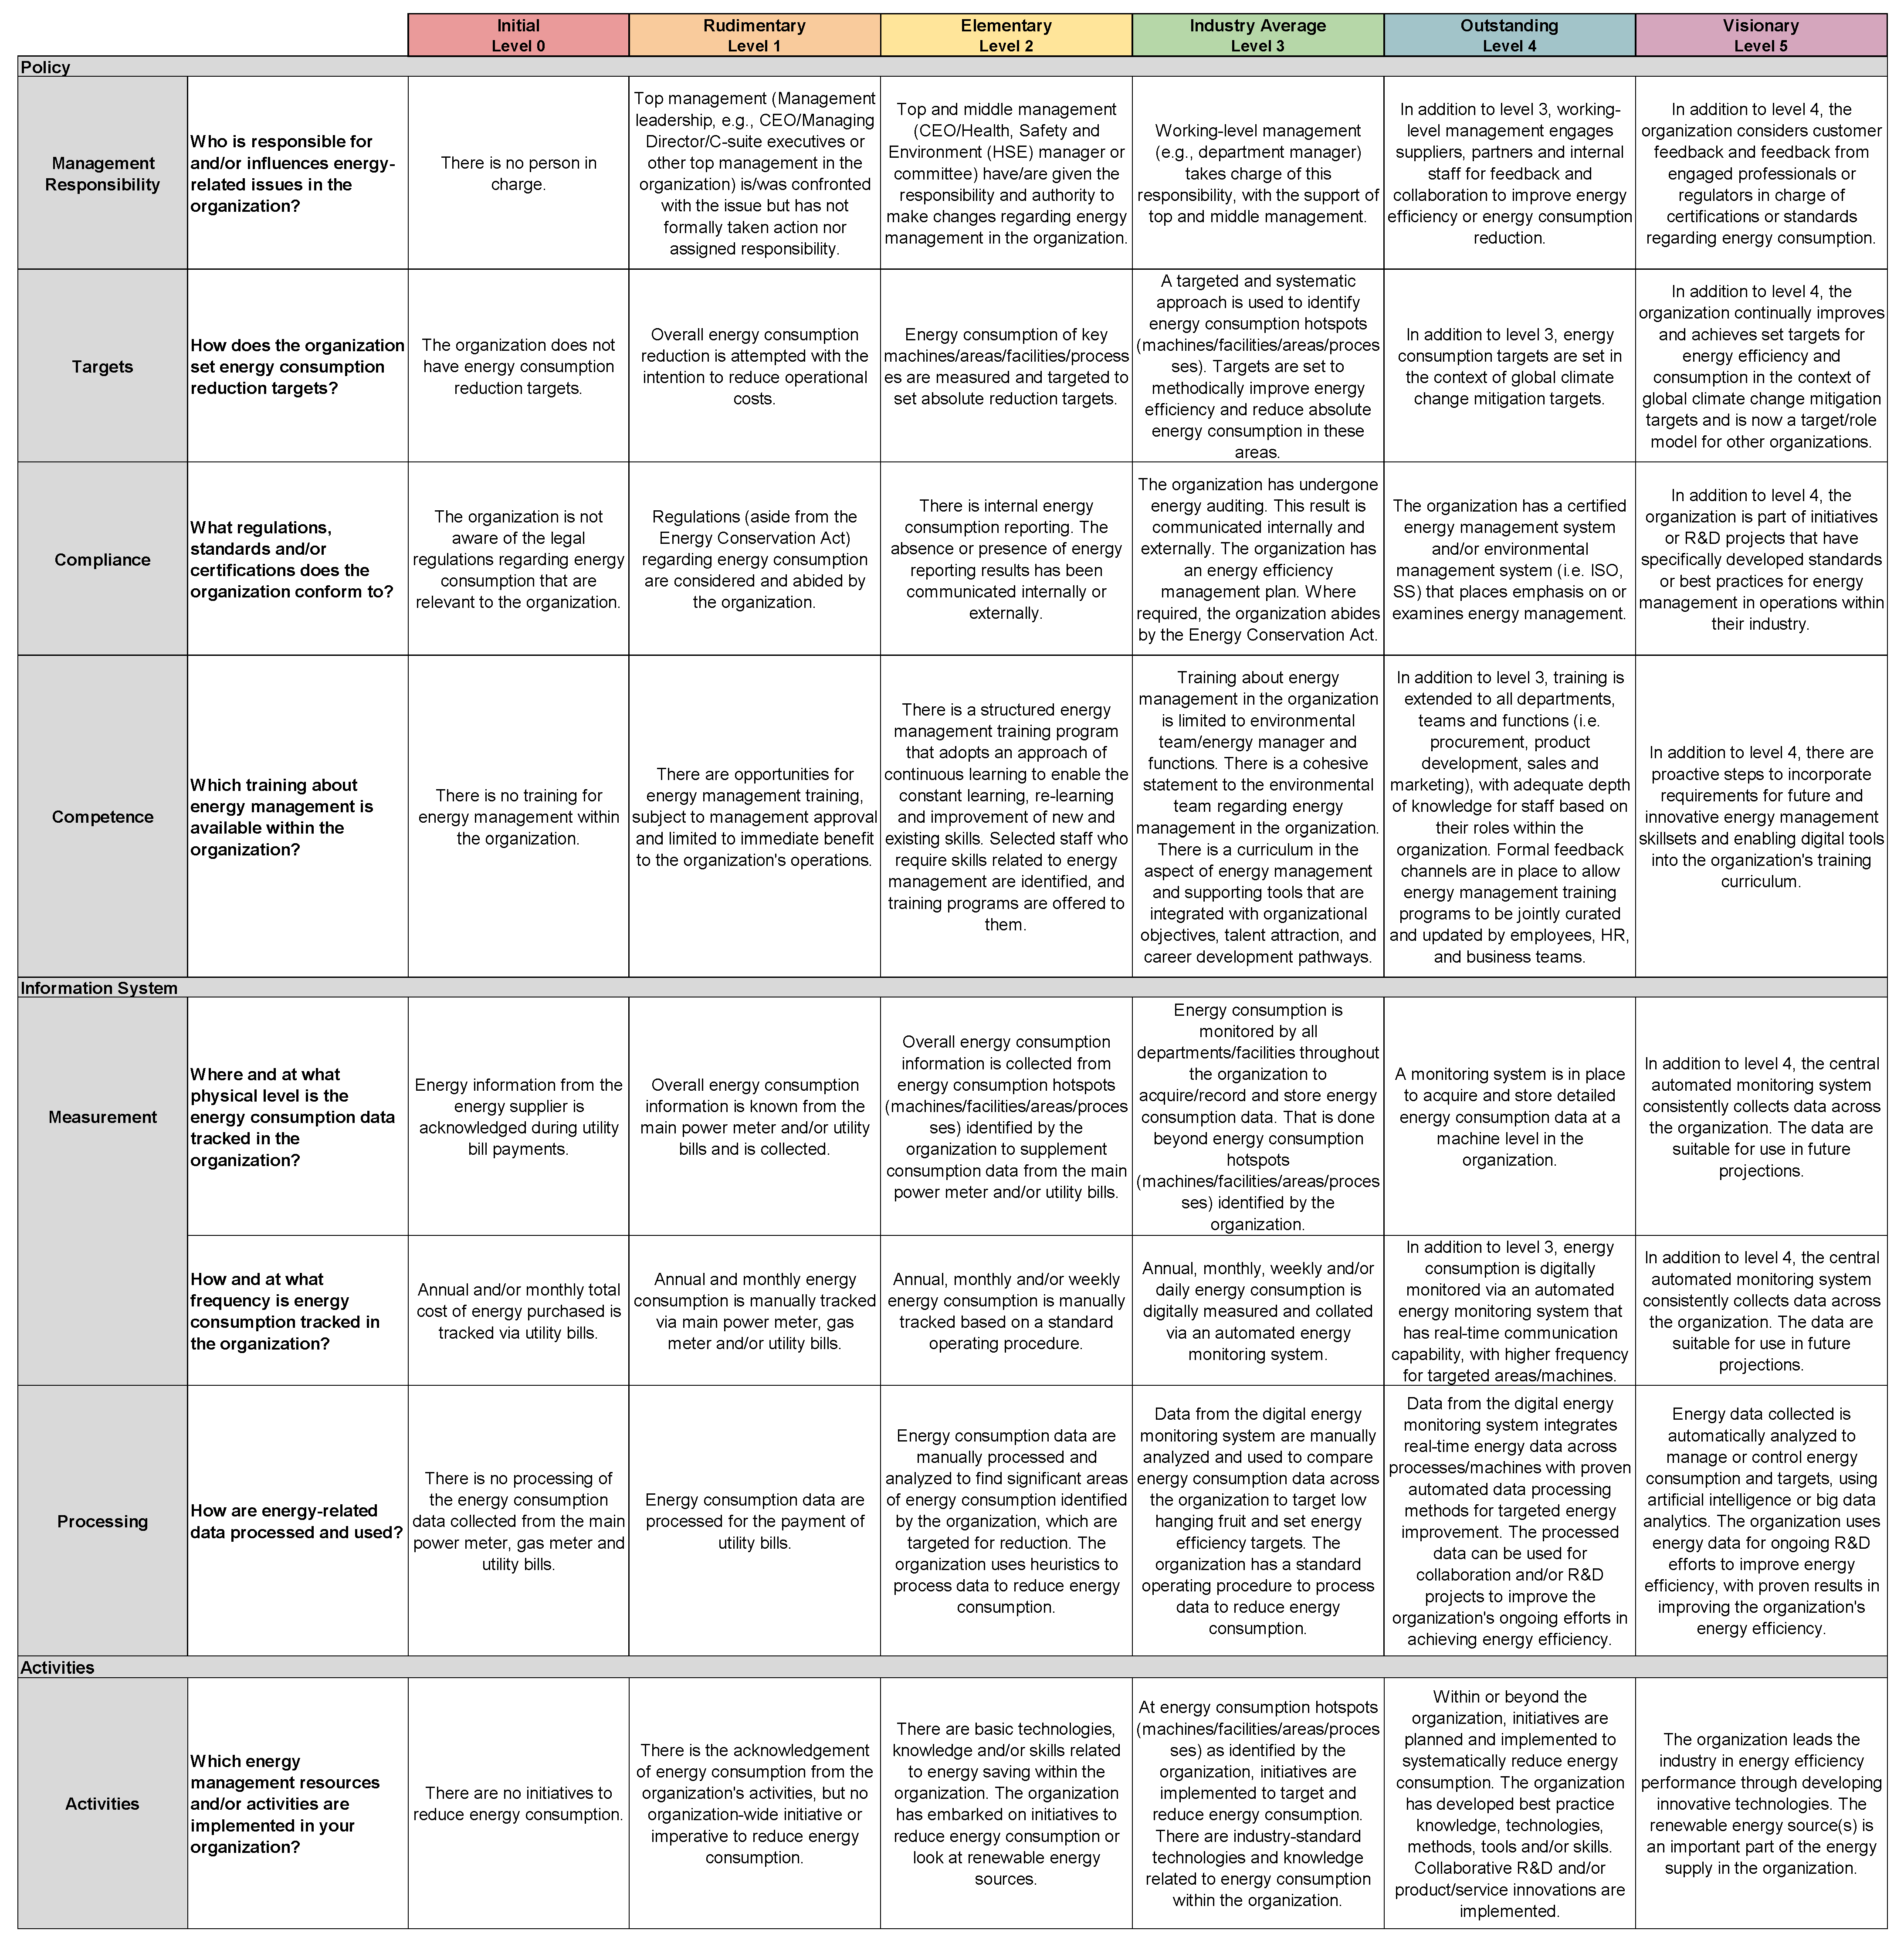
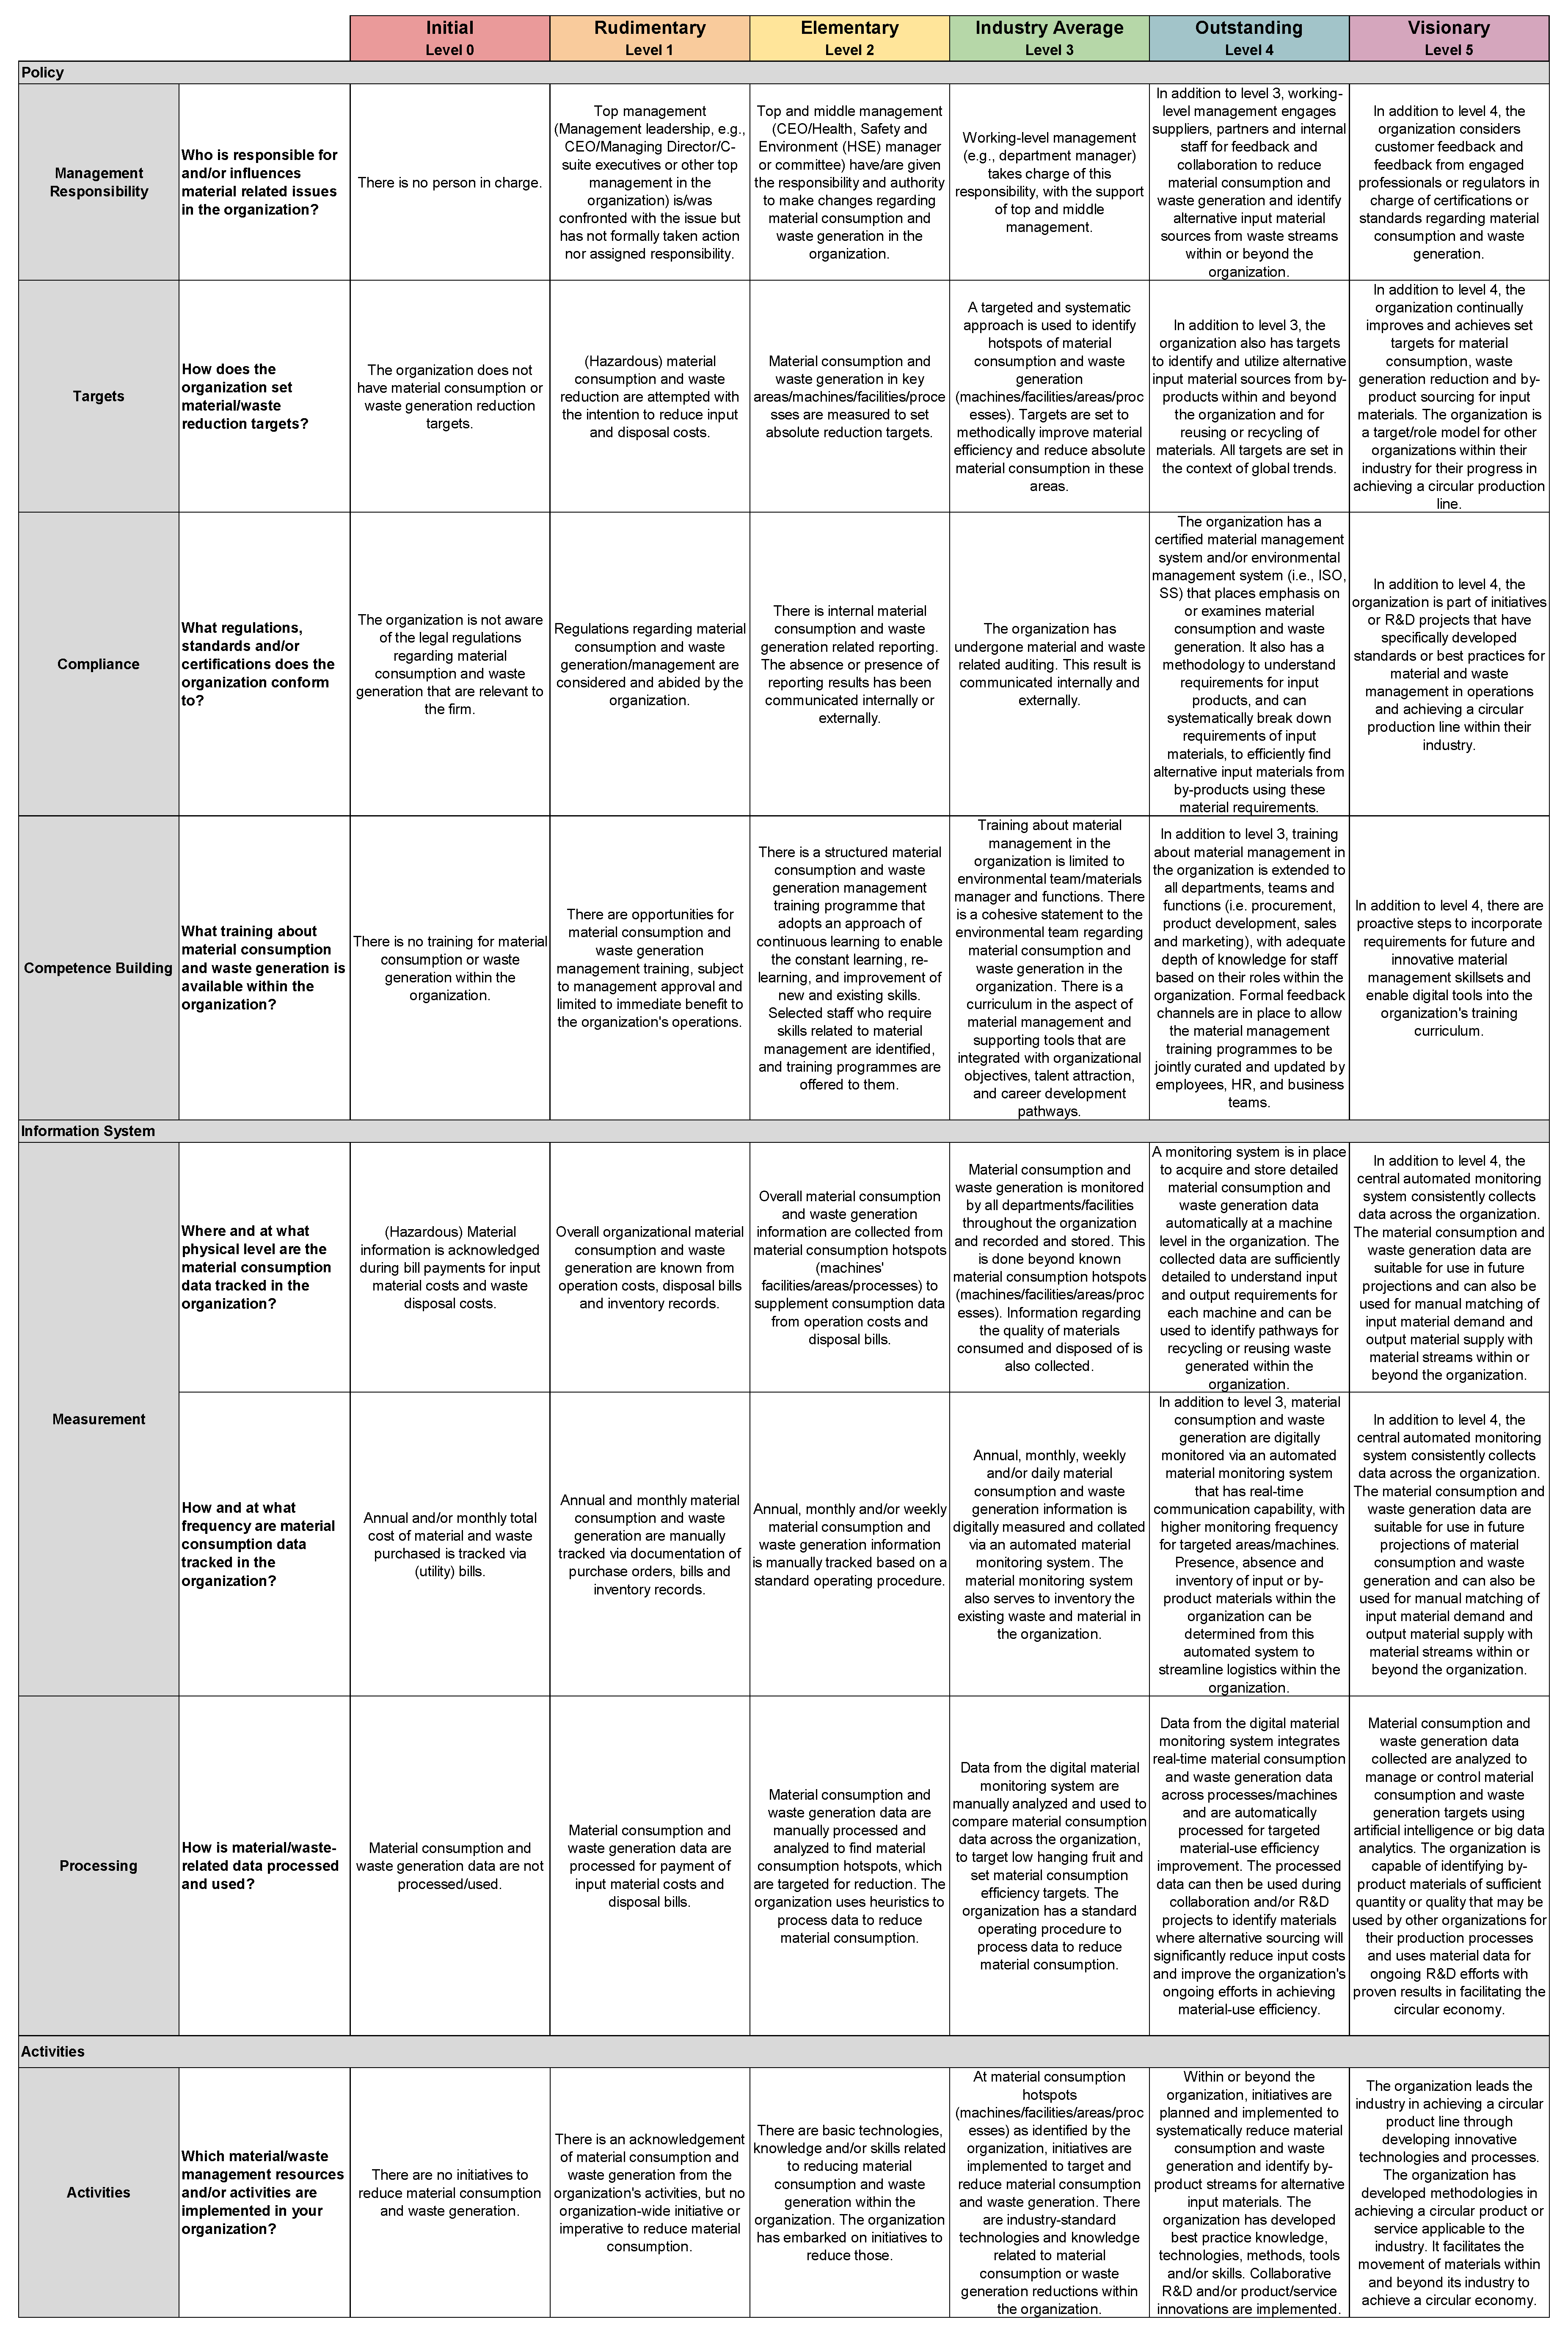
Table A2. Definitions of the domains and key sub-domains.
Sub-DomainDefinition
Management responsibilityexplores the management’s responsibility for sustainability issues.
Target settingexplores the targets and strategies for sustainability issues
Complianceexplores the regulations or standards the company complies with.
Competencebuildingexplores the competence building for sustainability within the company.
Data measurementexplores what method of data collection is related to the data’s level of detail
Data processingexplore how the data are processed and used
Table A3. Overview of the general requirements for customizing the MMs.
Maturity LevelMaturity NameDescription
0InitialThe company meets the minimal requirements to remain compliant or perform business as usual.
1Rudimentary The company undertakes additional efforts to overcome business as usual. Analysis and measures that do not follow any specified corporate strategy lead to the “discovery” of potential enhancements.
2ElementaryThe company initiates the first measures and formulates a corporate strategy regarding environmental sustainability. Then, additional analysis methods are used to systematically understand hot spots and reduction targets are set.
3Industry averageThe company initiates a learning and improvement process based on corporate environmental sustainability. The life cycle perspective is an essential consideration in decision-making. Results from analysis and measures drive the integration of environmental sustainability as a core business element.
4OutstandingThe company drives the holistic integration of environmental sustainability across the whole company and can positively impact environmental, economic, and social aspects. Based on the life cycle perspective, the first collaboration programs with suppliers and partners are initiated to move towards environmentally beneficial innovations.
5VisionaryThe company adapts visionary concepts to reduce unsustainability and create sustainability (circularity flows). The measures lead to environmentally beneficial innovations that positively impact the environment, society, and business partners.
Equations (A1)–(A5). The calculation of the maturity level of a dimension or a domain.
M = 1 n i n I i     n { Policy ,   Information   Systems ,   Activities }
I i = 1 n k n D k  
I Policy = 1 n i n D k     n { Management   Responsibility ,   Targets ,   Compliance ,   Competence   Building }
I Information   Systems = 1 n i n D k     n { measurement   ( over   space ) ,   measurement   ( over   time ) ,   processing }
I Activities = D Activities
n—number of sub-domains within the dimension’s domain.
I—maturity index (dimension, domain or sub-domain).
Table A4. Overview of the general requirements used to customize the MMs.
Evaluation
Criteria
DefinitionQuestions on a Likert Scale of 1 to 5, with 1 Being “Strongly Disagree” and 5 Being “Strongly Agree”
SufficiencyThe sufficiency aspect comprises two criteria:
1. The sufficiency of maturity levels in the MM for representing all possible maturation levels of the sub-domain;
2. The sufficiency of the maturity levels for describing the performance of a company.The rationale for the former criterion is to ensure that the maturity levels are sufficient in covering or representing all possible maturation levels of a company so that any company that attempts the assessment framework will be able to use a maturity level to describe itself. The rationale for the latter criterion is that the maturity levels have to be holistic and consider how all possible policies, pathways, or activities that a company may engage in evolving as the company moves up in the MM. The maturation of a company should be reflected by its improvements in the relevant policies, pathways, or activities, making it necessary to check that all steps for improvements in the policies, pathways, or activities have been accounted for in the maturity levels. This criterion also ensures that there is no measurable or describable improvement below or beyond the first and final maturity level.
  • The maturity levels are sufficient to represent all maturation levels of the sub-domain. To what extent do you agree?
  • The maturity levels are sufficient to describe a company’s performance in this domain. To what extent do you agree?
  • Do you have any comments regarding the sufficiency of the maturity levels in representing all maturation levels of the sub-domain?
  • Would you add any maturity levels? What would you add and why?
(If the feedback for the maturity levels is poor (i.e., disagree or strongly disagree), the experts are asked to comment on how the maturity levels could be improved.)
DistinctnessThe criterion of distinctness refers to the maturity levels being distinct and the differences between the maturity levels being clear. The rationale for this is to allow companies to be able to easily select one maturity level that best describes them.
Reviewers are asked one question, and those who rated the MM poorly on the above aspect are then encouraged to answer a further question.
  • The descriptions of maturity levels are distinct, and the differences between levels are clear. To what extent do you agree?
  • Do you have any comments about the distinctness and clarity of descriptions/maturity levels?
UsefulnessThe aspect of usefulness comprises three criteria. The first criterion is the extent to which the maturity levels measure a company’s performance in the relevant sub-domain, for which it is necessary to convert a qualitative description of a company into a quantifiable measurement, which can later be used for scoring or comparative purposes. The second criterion checks whether the maturity levels are useful in helping a company to identify how it can improve. This means that a company should be able to look to the next maturity level to give it a general idea as to the policies, pathways, or activities it can implement or follow to become more sustainable. The last criterion is whether the maturity level is practical, informative, and useful for companies. This is necessary to ensure that the policies, pathways, and activities used in the maturity model are representative of those implemented in the industry. Likewise, a company of lower maturity that reads the maturity levels will be able to learn about the policies, pathways, and activities that are implemented in the industry by more mature companies and make targeted improvement steps towards sustainability.
  • The descriptions clearly measure the company’s performance in the relevant sub-domain. To what extent do you agree?
  • A company will know how to improve based on the description of the next maturity level. To what extent do you agree?
  • The questions are practical, informative, and useful for companies. To what extent do you agree?
  • Do you have any comments regarding the use of descriptions to measure the company’s performance in this sub-domain?
  • Do you have comments regarding a company’s ability to improve based on the description of the next maturity level?
  • In your opinion, how can the questions be made more practical, informative, or useful for companies?
Ease of useThe criterion ease of use refers to the extent to which a company will be able to identify which maturity level they have achieved. This criterion is used to ensure that the descriptions for each maturity level are easy to read and understandable to both the managers and technical personnel, who are the target audience of the assessment framework.
Reviewers are asked one question, and those who rate the MM poorly on the above criterion are encouraged to answer one further question.
  • A company will be able to identify which maturity level they have achieved. To what extent do you agree?
  • Do you have any comments regarding the ability of companies to identify which maturity level they have achieved?
AccuracyThis criterion refers to the accuracy with which policies, pathways, and activities, which the company sees as their processes and practices, are correctly assigned to suitable and relevant maturity levels. This means that processes and practices are assigned to maturity levels based on how complicated there are and that there are no mismatched processes and practices that result in a maturity level being too easy or difficult to attain in a manner that is disproportionate to the MM.
Reviewers are asked one question, and those who rate the MM poorly on the above criterion are encouraged to answer one further question.
  • Processes and practices are correctly assigned to suitable maturity levels. To what extent do you agree?
  • Do you have comments regarding the processes and practices assigned to each maturity level/description?
Table A5. Overview of the general requirements used to customize the MMs.
Evaluation
Criteria
Questions on a Likert Scale of 1 to 5,
with 1 Being “Strongly Disagree” and 5 Being “Strongly Agree”
Understandability
  • I am able to understand the questions.
Ease of use
  • I am able to select a description that best fits my company.
  • The amount of time required to answer the questions is reasonable.
Usefulness
  • The descriptions have provided me insight on how to progress in the selected dimensions.
Figure A1. Maturity model for energy management in operations.
Sustainability 14 02293 g0a1
Figure A2. Maturity model for material (waste) management in operations.
Sustainability 14 02293 g0a2
Figure A3. Maturity model for water management in operations.
Sustainability 14 02293 g0a3
Figure A4. Maturity model for sustainable supply network.
Sustainability 14 02293 g0a4
Figure A5. Maturity model for sustainable product life cycle.
Sustainability 14 02293 g0a5

References

  1. European Commission. The European Green Deal. Eur. Comm. 2019, 53, 24. [Google Scholar] [CrossRef]
  2. Galvin, R.; Healy, N. The Green New Deal in the United States: What it is and how to pay for it. Energy Res. Soc. Sci. 2020, 67, 101529 . [Google Scholar] [CrossRef]
  3. Holzmann, A.; Grünberg, N. ‘Greening’ China: An Analysis of Beijing’s Sustainable Development Strategies. 2021. Available online: https://merics.org/en/report/greening-china-analysis-beijings-sustainable-development-strategies (accessed on 27 January 2021).
  4. Ministry of Education Singapore; Ministry of National Development Singapore; Ministry of Sustainability and the Environment Singapore; Ministry of Trade and Industry Singapore; Ministry of Transport Singapore. Singapore Green Plan 2030. 2021. Available online: https://www.greenplan.gov.sg/ (accessed on 23 July 2021).
  5. European Comission. Questions and Answers: Corporate Sustainability Reporting Directive Proposal. 2021. Available online: https://ec.europa.eu/commission/presscorner/detail/en/qanda_21_1806 (accessed on 2 August 2021).
  6. Metz, P.; Burek, S.; Hultgren, T.R.; Kogan, S.; Schwartz, L. The Path to Sustainability-Driven Innovation. Res. Technol. Manag. 2016, 59, 50–61. [Google Scholar] [CrossRef]
  7. Dale, B.; Williams, R.; Kolb, F.; Luzon, D.M.; Wallace, M. State-of-the-art study on self-assessment. TQM Mag. 1995, 7, 13–17. [Google Scholar]
  8. Lee, J.; Akkiraju, R.; Tian, C.H.; Jiang, S.; Danturthy, S.; Sundhararajan, P.; Nordman, C.; Mohan, R.; Singala, H.; Ding, W. Business Transformation Workbench: A Practitioner′s Tool for Business Transformation. In Proceedings of the IEEE International Conference on Services Computing, Honolulu, HI, USA, 7–11 July 2008; Volume 2, pp. 81–88. [Google Scholar] [CrossRef] [Green Version]
  9. Österle, H. Business in the Information Age; Springer: Berlin/Heidelberg, Germany, 1995. [Google Scholar] [CrossRef]
  10. Berkhout, F.; Hertin, J. Impacts of Information and Communication Technologies on Environmental Sustainability: Speculations and Evidence; University of Sussex: Brighton, UK, 2001; Available online: https://www.oecd.org/sti/inno/1897156.pdf (accessed on 3 September 2021).
  11. Chen, X.; Despeisse, M.; Johansson, B. Environmental sustainability of digitalization in manufacturing: A. review. Sustainbility 2020, 12, 10298. [Google Scholar] [CrossRef]
  12. Berkhout, F.; Hertin, J. De-materialising and re-materialising: Digital technologies and the environment. Futures 2004, 36, 903–920. [Google Scholar] [CrossRef]
  13. Oláh, J.; Aburumman, N.; Popp, J.; Khan, M.A.; Haddad, H.; Kitukutha, N. Impact of Industry 4.0 on Environmental Sustainability. Sustainability 2020, 12, 4674. [Google Scholar] [CrossRef]
  14. De Sousa Jabbour, A.B.L.; Jabbour, C.J.C.; Foropon, C.; Godinho Filho, M. When titans meet—Can industry 4.0 revolutionise the environmentally-sustainable manufacturing wave? The role of critical success factors. Technol. Forecast. Soc. Chang. 2018, 132, 18–25. [Google Scholar] [CrossRef]
  15. Plattform Industrie 4.0. Sustainable Production: Actively Shaping the Ecological Transformation with Industrie 4.0. 2021. Available online: https://www.plattform-i40.de/IP/Redaktion/DE/Downloads/Publikation/Nachhaltige-Produktion.html (accessed on 3 April 2021).
  16. Schebek, L.; Kannengieβer, J.; Campitelli, A. Ressourceneffizienz durch Industrie 4.0—Potenziale für KMU des verarbeitenden Gewerbes. 2017, p. 183. Available online: http://www.ressource-deutschland.de/fileadmin/Redaktion/Bilder/Newsroom/Studie_Ressourceneffizienz_durch_Industrie_4.0.pdf (accessed on 6 September 2021).
  17. George, R.A.; Siti-Nabiha, A.; Jalaludin, D.; Abdalla, Y.A. Barriers to and enablers of sustainability integration in the performance management systems of an oil and gas company. J. Clean. Prod. 2016, 136, 197–212. [Google Scholar] [CrossRef]
  18. Steinhöfel, E.; Galeitzke, M.; Kohl, H.; Orth, R. Sustainability Reporting in German Manufacturing SMEs. Procedia Manuf. 2019, 33, 610–617. [Google Scholar] [CrossRef]
  19. Siegel, R.; Antony, J.; Garza-Reyes, J.A.; Cherrafi, A.; Lameijer, B. Integrated green lean approach and sustainability for SMEs: From literature review to a conceptual framework. J. Clean. Prod. 2019, 240, 118205. [Google Scholar] [CrossRef]
  20. Caldera, H.; Desha, C.; Dawes, L. Evaluating the enablers and barriers for successful implementation of sustainable business practice in ‘lean’ SMEs. J. Clean. Prod. 2019, 218, 575–590. [Google Scholar] [CrossRef]
  21. Kiel, D.; Müller, J.M.; Arnold, C.; Voigt, K.I. Sustainable industrial value creation: Benefits and challenges of industry 4.0. Digit. Disruptive Innov. 2017, 21, 1740015. [Google Scholar] [CrossRef]
  22. Jones, M.D.; Hutcheson, S.; Camba, J.D. Past, present, and future barriers to digital transformation in manufacturing: A review. J. Manuf. Syst. 2021, 60, 936–948. [Google Scholar] [CrossRef]
  23. Isensee, C.; Teuteberg, F.; Griese, K.-M.; Topi, C. The relationship between organizational culture, sustainability, and digitalization in SMEs: A systematic review. J. Clean. Prod. 2020, 275, 122944. [Google Scholar] [CrossRef]
  24. Gupta, S.; Motlagh, M.; Rhyner, J. The Digitalization Sustainability Matrix: A Participatory Research Tool for Investigating Digitainability. Sustainability 2020, 12, 9283. [Google Scholar] [CrossRef]
  25. Gregor, S. Building theory in the sciences of the artificial. In Proceedings of the 4th International Conference on Design Science Research in Information Systems and Technology, Worcester, MA, USA, 4–6 June 2009; p. 4. [Google Scholar]
  26. World Commission on Environment and Development. Our Common Future; Oxford University Press: Oxford, UK, 1987; Volume 14. [Google Scholar] [CrossRef]
  27. Steurer, R. Paradigmen der Nachhaltigkeit. Z. Für Umweltpolit. Umweltr. 2001, 4, 537–566. [Google Scholar]
  28. Shrivastava, P. The Role of Corporations in Achieving Ecological Sustainability. Acad. Manag. Rev. 1995, 20, 936–960. [Google Scholar] [CrossRef]
  29. Sharma, S.; Henriques, I.; Sharma, S. Stakeholder influences on sustainability practices in the Canadian forest products industry. Strateg. Manag. J. 2005, 26, 159–180. [Google Scholar] [CrossRef]
  30. Gladwin, T.N.; Kennelly, J.J.; Krause, T. Shifting Paradigms for Sustainable for Implications Development And Theory. Acad. Manag. Rev. 1995, 20, 874–907. [Google Scholar] [CrossRef]
  31. Bansal, P. Evolving sustainably: A longitudinal study of corporate sustainable development. Strat. Manag. J. 2005, 26, 197–218. [Google Scholar] [CrossRef]
  32. Elkington, J. Cannibals with Forks The Triple Bottom Line of 21st Century Business; Capstone Publishing Ltd.: Oxford, UK, 1997; ISBN 1-900961-27-X. [Google Scholar]
  33. Hauschild, M.Z.; Kara, S.; Røpke, I. Absolute sustainability: Challenges to life cycle engineering. CIRP Ann. 2020, 69, 533–553. [Google Scholar] [CrossRef]
  34. GreenBiz Group and Black & Veatch. Corporate Sustainability Goal Setting and Measurement; GreenBiz: Oakland, CA, USA, 2021. [Google Scholar]
  35. Clean Energy Wire. Germany’s Carbon Pricing System for Transport and Buildings. 2020. Available online: https://www.cleanenergywire.org/factsheets/germanys-planned-carbon-pricing-system-transport-and-buildings (accessed on 28 July 2021).
  36. McKinsey & Company. The Next Normal Reimagining Operational Resilience Building Future-proof Strategies. 2021. Available online: https://www.mckinsey.com/~/media/mckinsey/business%20functions/operations/our%20insights/the%20need%20for%20resiliency/reimagining-operational-resilience-vf.pdf. (accessed on 2 February 2021).
  37. Porter, M.E. Competitive Advantage Creating and Sustaining Superior Performance, First Free Press Edition 1985; Free Press: New York, NY, USA, 1998; ISBN 0-684-84146-0. [Google Scholar]
  38. Müller, A.-L.; Pfleger, R. Business transformation towards sustainability. Bus. Res. 2014, 7, 313–350. [Google Scholar] [CrossRef] [Green Version]
  39. CERES. The CERES Roadmap for Sustainability. 2018. Available online: https://www.ceres.org/sites/default/files/2018-02/ceres-rfs-8.5x11-rd7-v1-1-sm_updated.pdf. (accessed on 5 January 2021).
  40. Kiron, D.; Unruh, G.; Kruschwitz, N.; Reeves, M.; Rubel, H.; Meyer zum Felde, A. Corporate Sustainability at a Crossroads—Progress toward our common Future in Uncertain Times. 2017. Available online: https://sloanreview.mit.edu/projects/corporate-sustainability-at-a-crossroads/ (accessed on 3 March 2021).
  41. GRI. Gri 101: Foundation 2016 101. GRI Stand. 2016, GRI 101, 29. Available online: www.globalreporting.org (accessed on 2 May 2021).
  42. Feroz, A.K.; Zo, H.; Chiravuri, A. Digital Transformation and Environmental Sustainability: A Review and Research Agenda. Sustainability 2021, 13, 1530. [Google Scholar] [CrossRef]
  43. Paavola, R.; Hallikainen, P.; Elbanna, A. Role of middle managers in modular digital transformation: The case of Servu. In Proceedings of the 25th European Conference on Information Systems, ECIS 2017, Guimarares, Portugal, 5–10 June 2017; Volume 2017, pp. 887–903. [Google Scholar]
  44. Morakanyane, R.; Grace, A.; O’Reilly, P. Conceptualizing digital transformation in business organizations: A systematic review of literature. In Proceedings of the 30th Bled eConference Digital Transformation – From Connecting Things to Transforming Our Lives, BLED 2017, Bled, Slovenia, 18–21 June 2017; pp. 427–444. [Google Scholar] [CrossRef] [Green Version]
  45. Li, L.; Su, F.; Zhang, W.; Mao, J.-Y. Digital transformation by SME entrepreneurs: A capability perspective. Inf. Syst. J. 2018, 28, 1129–1157. [Google Scholar] [CrossRef]
  46. Legner, C.; Eymann, T.; Hess, T.; Matt, C.; Böhmann, T.; Drews, P.; Mädche, A.; Urbach, N.; Ahlemann, F. Digitalization: Opportunity and Challenge for the Business and Information Systems Engineering Community. Bus. Inf. Syst. Eng. 2017, 59, 301–308. [Google Scholar] [CrossRef]
  47. Vial, G. Understanding digital transformation: A review and a research agenda. J. Strateg. Inf. Syst. 2019, 28, 118–144. [Google Scholar] [CrossRef]
  48. Economy 2017. Available online: https://www.bmwi.de/Redaktion/EN/Publikationen/monitoring-report-wirtschaft-digital-2017.html (accessed on 14 December 2021).
  49. Tilson, D.; Lyytinen, K.; Sørensen, C. Research Commentary—Digital Infrastructures: The Missing IS Research Agenda. Inf. Syst. Res. 2010, 21, 748–759. [Google Scholar] [CrossRef]
  50. Santos, J.; Muñoz-Villamizar, A.; Ormazábal, M.; Viles, E. Using problem-oriented monitoring to simultaneously improve productivity and environmental performance in manufacturing companies. Int. J. Comput. Integr. Manuf. 2019, 32, 183–193. [Google Scholar] [CrossRef]
  51. Nascimento, D.L.M.; Alencastro, V.; Quelhas, O.L.G.; Caiado, R.G.G.; Garza-Reyes, J.A.; Rocha-Lona, L.; Tortorella, G. Exploring Industry 4.0 technologies to enable circular economy practices in a manufacturing context: A business model proposa. J. Manuf. Technol. Manag. 2019, 30, 607–627. [Google Scholar] [CrossRef]
  52. Gajšek, B.; Sternad, M. Information Flow in the Context of the Green Concept, Industry 4.0, and Supply Chain Integration; Springer International Publishing: New York, NY, USA, 2020. [Google Scholar] [CrossRef]
  53. Gilchrist, A. Industry 4.0; Apress: Berkeley, CA, USA, 2016; Volume 33. [Google Scholar] [CrossRef]
  54. Ghobakhloo, M. The future of manufacturing industry: A strategic roadmap toward Industry 4.0. J. Manuf. Technol. Manag. 2018, 29, 910–936. [Google Scholar] [CrossRef] [Green Version]
  55. Song, Z.; Moon, Y. Assessing sustainability benefits of cybermanufacturing systems. Int. J. Adv. Manuf. Technol. 2016, 90, 1365–1382. [Google Scholar] [CrossRef]
  56. Thiede, S. Environmental Sustainability of Cyber Physical Production Systems. Procedia CIRP 2018, 69, 644–649. [Google Scholar] [CrossRef]
  57. Dröder, K.; Vietor, T. Technologies for Economical and Functional Lightweight Design; Springer: New York, NY, USA, 2018. [Google Scholar]
  58. Baheti, R.; Gill, H. Cyber-physical Systems. Impact Control Technol. 2011, 12, 161–166. [Google Scholar]
  59. Ghobakhloo, M. Industry 4.0, digitization, and opportunities for sustainability. J. Clean. Prod. 2019, 252, 119869. [Google Scholar] [CrossRef]
  60. Tsolakis, N.; Harrington, T.S.; Srai, J.S. The Management of Operations Digital supply network design: A Circular Economy challenges. Prod. Plan. Control 2021, 1–26. [Google Scholar] [CrossRef]
  61. Lee, J. Industrial AI; Springer: Singapore, 2020. [Google Scholar] [CrossRef]
  62. Junior, J.A.G.; Busso, C.M.; Gobbo, S.C.O.; Carreão, H. Making the links among environmental protection, process safety, and industry 4.0. Process. Saf. Environ. Prot. 2018, 117, 372–382. [Google Scholar] [CrossRef] [Green Version]
  63. Hilty, L.M. ICT for Sustainability: An Emerging Research Field; Springer: Cham, Switzerland, 2017. [Google Scholar] [CrossRef]
  64. Van Der Velden, M. Digitalisation and the UN Sustainable development Goals: What role for design. IDA Interact. Des. Archit. 2018, 37, 160–174. [Google Scholar]
  65. Hynds, E.J.; Brandt, V.; Burek, S.; Knox, P.; Parker, J.P.; Zietlow, M.; Schwartz, L.; Taylor, J.; Jager, W. A Maturity Model for Sustainability in New Product Development. Res. Technol. Manag. 2014, 57, 50–57. [Google Scholar] [CrossRef] [Green Version]
  66. Schonherr, N.; Martinuzzi, A. Business and the Sustainable Development Goals: Measuring and Managing Corporate Impacts; Springer: New York, NY, USA, 2019. [Google Scholar]
  67. Pigosso, D.C.; Rozenfeld, H.; McAloone, T.C. Ecodesign maturity model: A management framework to support ecodesign implementation into manufacturing companies. J. Clean. Prod. 2013, 59, 160–173. [Google Scholar] [CrossRef] [Green Version]
  68. Baumgartner, R.J.; Ebner, D. Corporate sustainability strategies: Sustainability profiles and maturity levels. Sustain. Dev. 2010, 18, 76–89. [Google Scholar] [CrossRef]
  69. Cagnin, C.H.; Loveridge, D.; Butler, J. Business Sustainability Maturity Model. Comput. Comun. Rev. 2013, 1–15. [Google Scholar] [CrossRef]
  70. Golinska, P.; Kuebler, F. The Method for Assessment of the Sustainability Maturity in Remanufacturing Companies. Procedia CIRP 2014, 15, 201–206. [Google Scholar] [CrossRef]
  71. Finnerty, N.; Sterling, R.; Coakley, D.; Keane, M. An energy management maturity model for multi-site industrial organisations with a global presence. J. Clean. Prod. 2017, 167, 1232–1250. [Google Scholar] [CrossRef] [Green Version]
  72. Reefke, H.; Ahmed, M.D.; Sundaram, D. Sustainable Supply Chain Management—Decision Making and Support: The SSCM Maturity Model and System. Glob. Bus. Rev. 2014, 15, S1–S12. [Google Scholar] [CrossRef] [Green Version]
  73. Schuh, G.; Anderl, R.; Gausemeier, J.; Hompel ten, M.; Wahlster, W. Industry 4.0 maturity index. Assembly 2018, 61, 32–35. [Google Scholar]
  74. Lichtblau, K.; Stich, V.; Bertenrath, R.; Blum, M.; Bleider, M.; Millack, A.; Schmitt, K.; Schmitz, E. MPULS—Industrie 4.0 Readiness. 2015. Available online: https://www.semanticscholar.org/paper/Industrie-4.0-Readiness-Lichtblau-Bertenrath/fb4ee757dd678b8126eaa33114dcea82ae8c77bb (accessed on 14 December 2021).
  75. EDB Singapore. The Singapore Smart Industry Readiness Index. 2018; p. 46. Available online: https://speta.org/wp-content/uploads/2019/08/SIRI-White-Paper.pdf (accessed on 23 August 2021).
  76. Geissbauer, R.; Vedso, J.; Schrauf, S. Industry 4.0: Building the Digital Enterprise. 2016. Available online: www.pwc.com/industry40 (accessed on 23 August 2021).
  77. Termer, F. Reifegradmodell zum Digital Analytics & Optimization Maturity Index (DAOMI). 2018, pp. 1–75. Available online: www.bitkom.org (accessed on 23 August 2021).
  78. Netland, T.; Alfnes, E. Proposing a quick best practice maturity test for supply chain operations. Meas. Bus. Excel. 2011, 15, 66–76. [Google Scholar] [CrossRef] [Green Version]
  79. Neff, A.A.; Hamel, F.; Herz, T.P.; Uebernickel, F.; Brenner, W.; Brocke, J.V. Developing a maturity model for service systems in heavy equipment manufacturing enterprises. Inf. Manag. 2014, 51, 895–911. [Google Scholar] [CrossRef]
  80. Becker, J.; Knackstedt, R.; Pöppelbuß, D.-W.I.J. Developing Maturity Models for IT Management. Bus. Inf. Syst. Eng. 2009, 1, 213–222. [Google Scholar] [CrossRef]
  81. Salah, D.; Paige, R.; Cairns, R. An Evaluation Template for Expert Review of Maturity Models. In Proceedings of the 15th International Conference, PROFES 2014, Helsinki, Finland, 10–12 December 2014; pp. 318–321. [Google Scholar]
  82. Fraser, P.; Moultrie, J.; Gregory, M. The use of maturity models/grids as a tool in assessing product development capability. In Proceedings of the IEEE International Engineering Management Conference, Cambridge, UK, 18–20 August 2002; Volume 1, pp. 244–249. [Google Scholar] [CrossRef]
  83. Johnson, M. Integrating the Supply Chain... 25 years on. Int. J. Phys. Distrib. Mater. Manag. 2018. [Google Scholar] [CrossRef] [Green Version]
  84. Global Reporting Initiative. GRI Standards. Available online: https://www.globalreporting.org/standards/gri-standards-download-center/ (accessed on 17 September 2020).
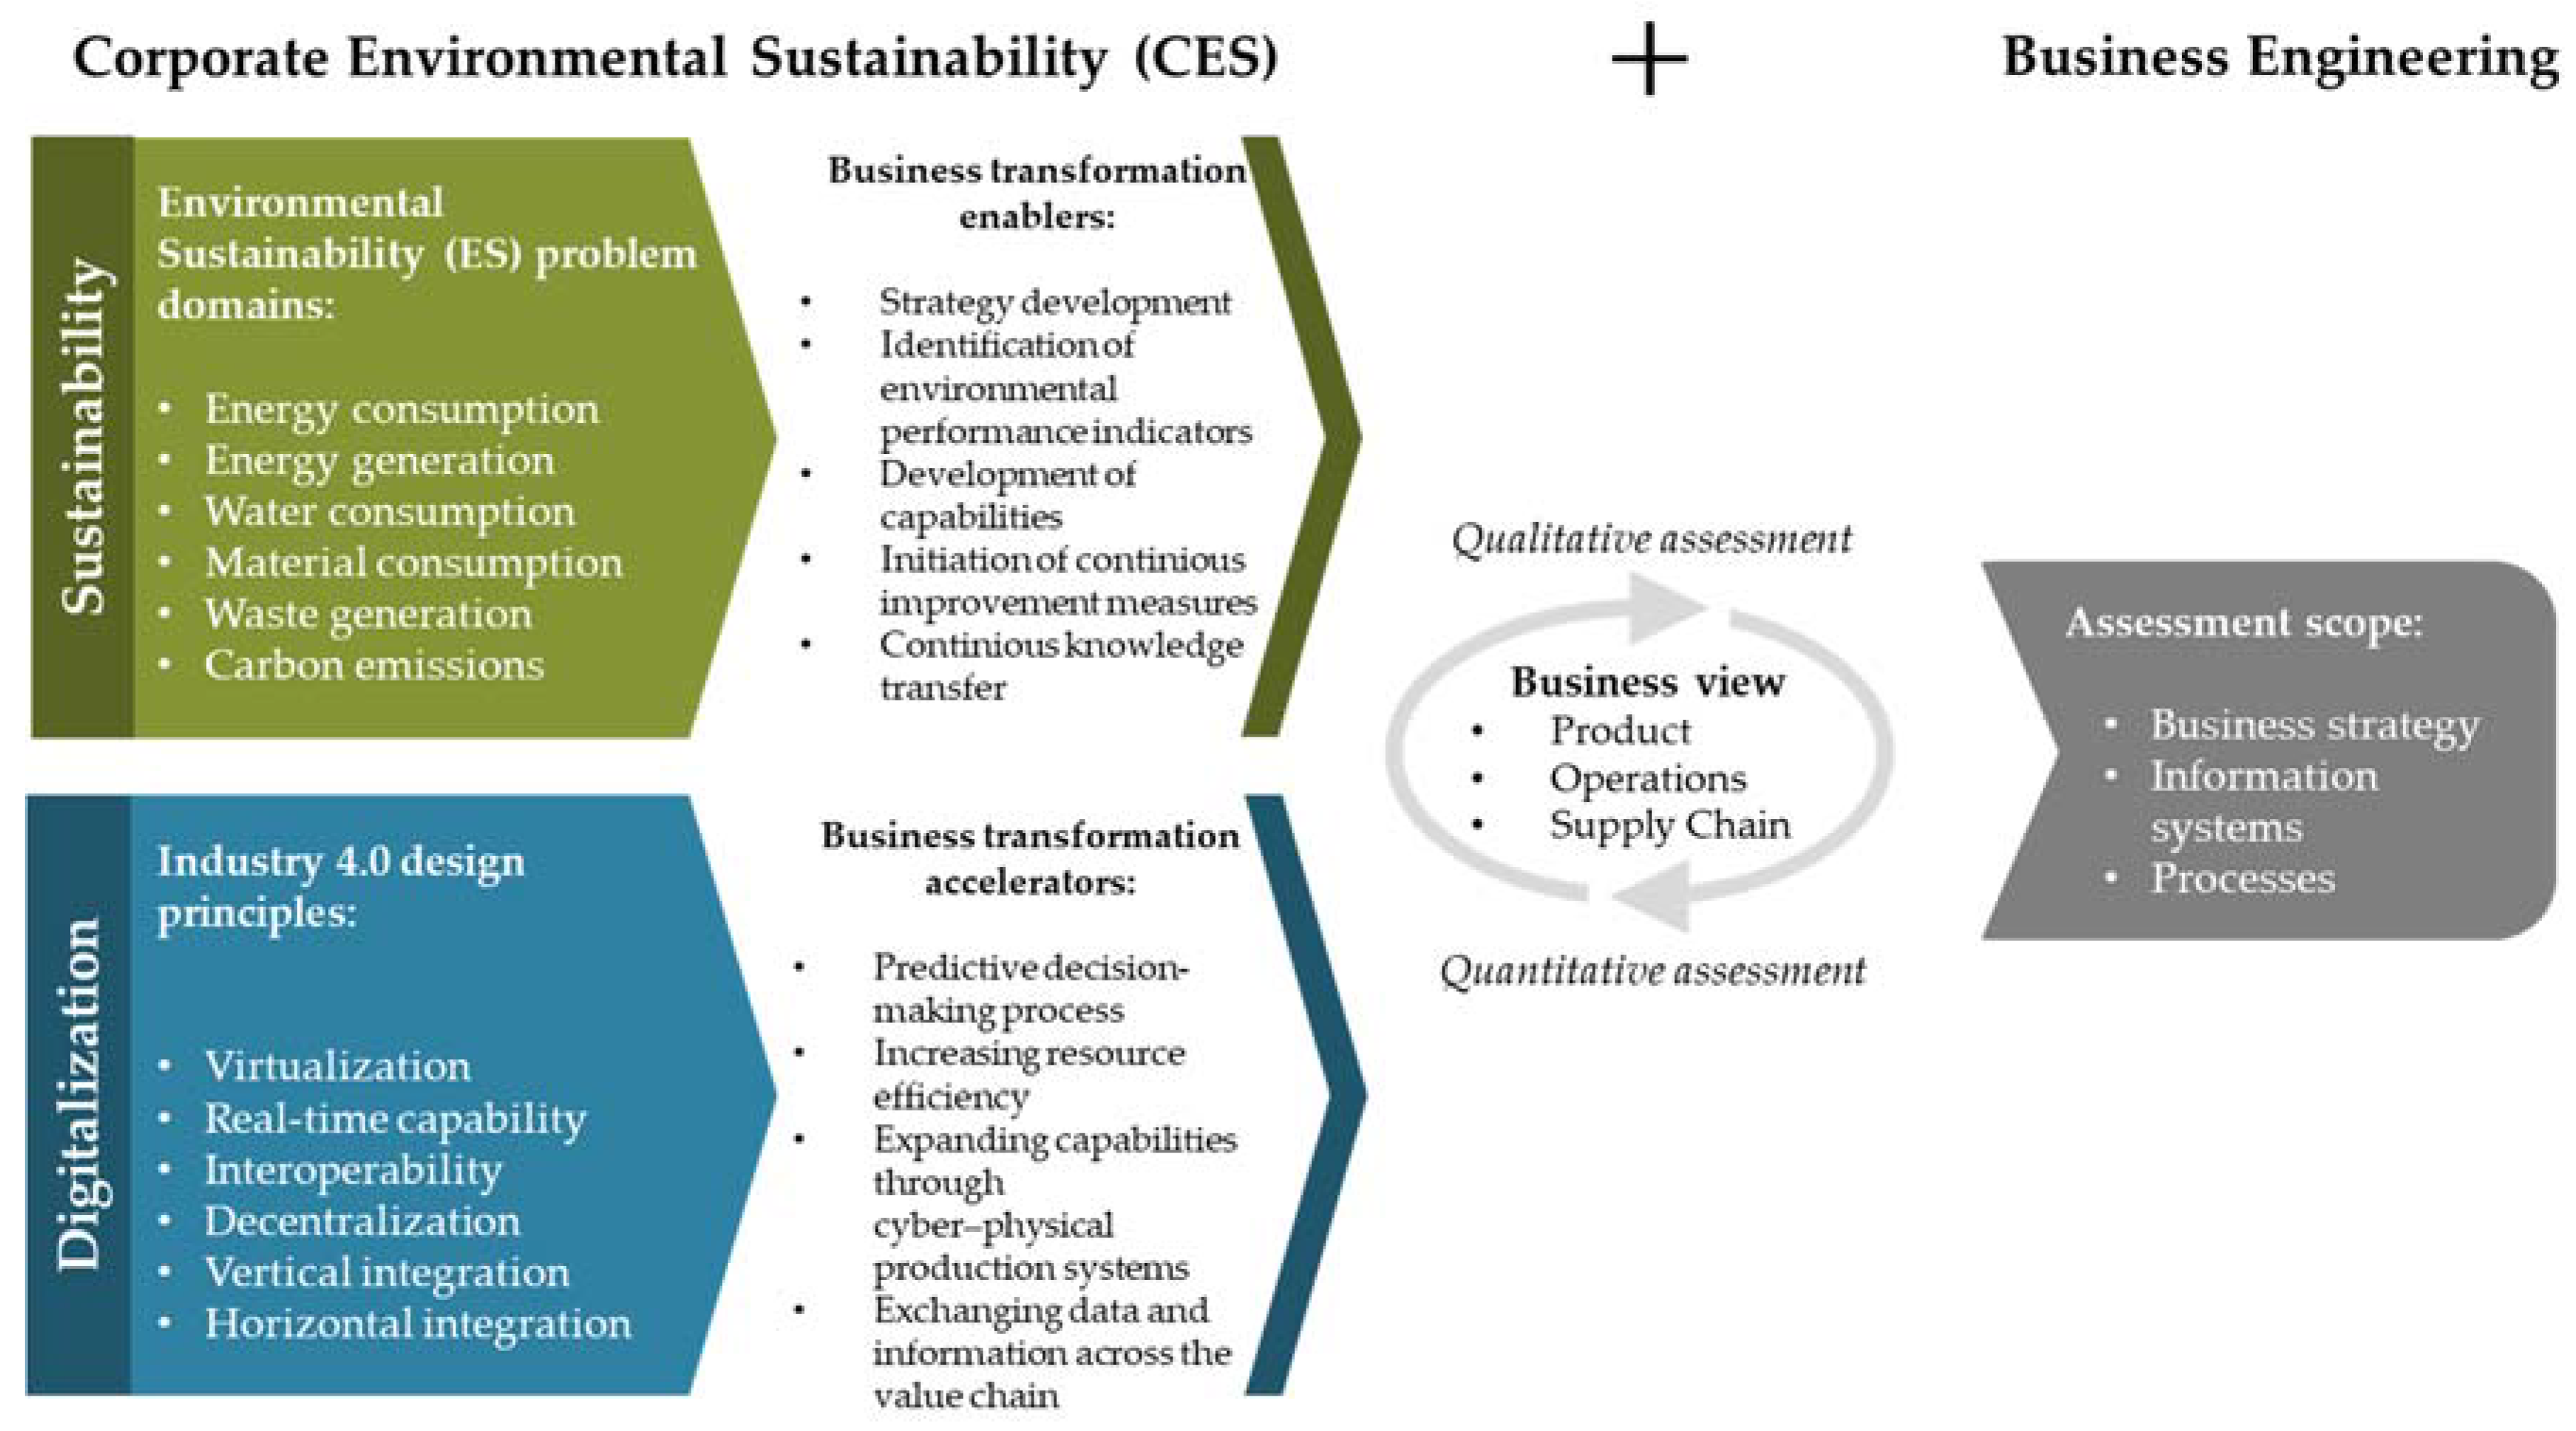
Figure 1. The theoretical self-assessment framework for Corporate Environmental Sustainability.
Sustainability 14 02293 g001
Figure 2. Adopted development procedure for the CES self-assessment tool based on the methodology used by Neff et al.
Sustainability 14 02293 g002
Figure 3. Defined scope of the CES self-assessment tool.
Sustainability 14 02293 g003
Figure 4. Example of carbon management in the operations dimension.
Sustainability 14 02293 g004
Figure 5. Overview of the self-assessment procedure.
Sustainability 14 02293 g005
Figure 6. Exemplary questions from the rapid assessment (a) and the full assessment (b) of energy management in operations.
Sustainability 14 02293 g006
Figure 7. Results of expert feedback for the MMs.
Sustainability 14 02293 g007
Figure 8. Sample of the results for the rapid assessment of carbon management in operations, information systems, and activities domains. The selections of the company are indicated by the red boxes.
Sustainability 14 02293 g008
Table 1. Five main business transformation enablers and related recommendations for action.
Business Transformation EnablersRecommendations for Action
Strategy developmentDeveloping a business transformation strategy requires the involvement of various stakeholders, clear target communication, and suitable competencies.
Identification of environmental
performance indicators
An overview of the most relevant indicators is needed to identify environmental performance indicators.
Development of capabilitiesBy monitoring the most relevant indicators over time, various action fields and their need in capabilities can be identified. This relates especially to monitoring and management of all relevant and required sustainability-related data.
Initiation of continuous
improvement measures
Business transformation underlies a continuous improvement process and requires continuous analysis of old and new measures
Continuous knowledge transferTo build up competences in the business, it is necessary to build up knowledge, share it, and develop it further.
Table 2. Six Industry 4.0 design principles based on Gilchrist (2016) [52] and Ghbakhloo (2018) [53] to reveal the potential for products, operations, and supply chains in terms of CES through digitalization.
Industry 4.0 Design PrinciplesDescription and Potentials to Support CES
VirtualizationSensor data from the physical world can be converted into information or simulation-based models (e.g., digital twin) and shared across the value chain. This information can enhance processes, products, and decisions to support ES.
Real-time capabilityData collection from production processes takes place in real-time and enables real-time monitoring and feedback processes, and could enable manufacturing processes to become more energy- or resource-efficient.
InteroperabilityVarious systems (e.g., machines, products, and workforce) are interconnected to coordinate processes and resources efficiently.
DecentralizationThe application of digital technologies (CPPS, big data etc.) enables the different systems to make decisions autonomously. By driving continuous knowledge transfer and extending existing capabilities that way, companies’ core competences might shift from collecting ES sustainable data to designing ES sustainable processes.
Vertical integrationThe integration and automation of operational technology (OT) and information technology (IT) across the production to enterprise levels enhance the operational efficiency of all involved systems. Increasing operational efficiency affects energy and resource efficiency as well.
Horizontal integrationIntegrating and automating processes with stakeholders along the value chain improves product quality (e.g., productivity) and supports the creation of new business models. Especially, the redesign from linear to circular flows to reduce waste might create sustainable value.
Table 3. Evaluation of existing maturity models related to corporate sustainability and digitalization.
Corporate SustainabilityDigitalization
Design Principles/AuthorBaumgartner and Ebner, 2010 [68]Cagnin et al., 2013 [69]Golinska and Kuebler, 2014 [70]Hynds et al., 2014 [65]Pigosso et al., 2013 [67]Finnerty et al., 2017 [71]Reefke et al., 2010 [72]Schumacher et al., 2016 [72]Schuh et al., 2018 [74]Lichtblau et al., 2015 [74]Singapore Economic Development Board, 2018 [75]Temer, 2018 [77]Geissbauer et al., 2016 [76]Goal of the Integrative View
Business viewOperations(■)
Product(■)
Supply Chain (■)
ES problem
domains
Carbon (■)
Energy(■)(■)
Material and Waste(■)
Water (■)
Industry 4.0 design principlesVirtualization (■)(■)
Vertical integration (■)(■)
Real-time capability (■)(■)
Interoperability (■)(■)
Horizontal integration (■)(■)
Decentralization (■)(■)
Business transformation enablersStrategy development
Identification of KPIs
Identification of capabilities
Identification of needed measures
Extension of knowledge
Assessment
approach
Qualitative
Quantitative
■ integrated: directly addressed as assessment dimension. (■) partly integrated: indirectly addressed or not further specified.
Table 4. Key components of a maturity model according to Fraser et al.
TopicQuestion
Dimensions
  • How many assessment dimensions are required for the MM?
  • In how many elements is the dimension structured?
Maturity levels
  • How many maturity levels are applied?
  • What are the names of the maturity levels?
Indicators
  • What activities and descriptions do the levels include?
Table 5. Summary of experts’ qualitative feedback for the MMs.
Evaluation AspectsExpert Feedback
Sufficiency
  • The scope of the level descriptions are not clear due to phrasing
  • Not broad enough for all types of companies
  • Missing aspects (missing aspects specified by experts)
Distinctness
  • Level descriptions overlap or are not distinct enough
Usefulness
  • Appropriateness to specify certain criteria to be considered a higher level
  • Level descriptions are not detailed enough
  • Specific activity or technology for improvement is not provided, limiting how much companies can find out from the MM to improve
Ease of use
  • Whether questions can be answered depends on who the respondent is
  • Terms need to be simplified or have definitions
  • Terms used need to be described in more detail or provide examples
Accuracy
  • Scope of level descriptions are not at the right level (justification and more appropriate level is suggested by experts)
Publisher’s Note: MDPI stays neutral with regard to jurisdictional claims in published maps and institutional affiliations.

