Article

Addressing the Phenomenon of Overtourism in Budapest from Multiple Angles Using Unconventional Methodologies and Data

by
Betsabé Pérez Garrido
1,*,
Szabolcs Szilárd Sebrek
2,
Viktoriia Semenova
3,
Damla Bal
3 and
Gábor Michalkó
4,5
1
Department of Computer Science, Institute of Information Technology, Corvinus University of Budapest, 1093 Budapest, Hungary
2
Corvinus Institute for Advanced Studies, Corvinus University of Budapest, 1093 Budapest, Hungary
3
Doctoral School of Business and Management, Corvinus University of Budapest, 1093 Budapest, Hungary
4
Institute of Marketing, Corvinus University of Budapest, 1093 Budapest, Hungary
5
CSFK Geographical Institute, 1112 Budapest, Hungary
*
Author to whom correspondence should be addressed.
Sustainability 2022, 14(4), 2268; https://doi.org/10.3390/su14042268
Submission received: 29 January 2022 / Revised: 12 February 2022 / Accepted: 15 February 2022 / Published: 16 February 2022

Abstract

:
This paper addresses the phenomenon of overtourism in Budapest from multiple perspectives, starting with an overview that uses information collected from news, media, and academic tourism literature. Further, the phenomenon of overtourism is addressed quantitatively using different indicators, including tourism density and intensity. According to these indicators, the center of Budapest (formed by districts I, V, VI, VII, VIII, and IX) has been strongly affected by the presence of tourists, while districts physically far from the center have been less affected. This fact suggests the heterogeneity of the city in terms of overtourism. The number one catalyst of the negative impacts of foreign visitors’ behavior is party tourism (‘ruin pub’ tourism), which involves an unconventional use of the Hungarian capital. Finally, using an unconventional optimization method called fuzzy linear programming, we attempt to explore the challenging problem of identifying the optimal number of tourists for the city. The results of the study have important theoretical, methodological, and practical implications. On the theoretical side, we offer a comprehensive understanding of the phenomenon of overtourism in Budapest. Methodologically, the integrated approach in terms of data gathering and unconventional analytical methodologies (comprised of a case study analysis, the assessment of effective indicators for measuring the discussed phenomenon, and the demonstration of the sustainable number of visitors) represents a novel perspective about the extent of overtourism in Budapest. On the practical side, our findings provide valuable guidance for policymakers to help mitigate the problem of overtourism in the city. With regard to future research, we suggest extending and updating the results presented in this study to develop more sustainable tourism strategies.

1. Introduction

In 2019, Budapest was named the best destination in Europe, outranking classic urban destinations such as Paris, London, and Barcelona [1]. Within the same calendar year, the capital of Hungary ranked second on the “Best in Travel 2020” list, being awarded the title of the world’s most affordable large city [2]. Indeed, the year 2019 witnessed unprecedented tourist traffic in Budapest and the Hungarian tourism sector enjoyed “a golden age” [3] before the COVID-19 pandemic. The contribution of tourism to GDP reached 13.2% in 2019 and the growth rate of the tourism sector exceeded both the EU and worldwide average [4]. Being among the most popular tourist destinations, however, has its downsides. Earlier, Budapest was ranked fifth among the European cities most affected by overtourism in 2017 [5]. Followed by Barcelona and Amsterdam, Budapest is third on the list of cities most impacted by overtourism at night [6].
Budapest is divided into 23 districts that have their own political, economic, social, and cultural structures. The fragmentation of the city in terms of district management, and uncoordinated urban planning in the post-socialist years have led to few attempts at planning for tourism [7]. Previous research [8] concluded that tourism planning and management in Budapest is fragmented. Moreover, one city agency responsible for tourism was closed, and the remaining state-owned Hungarian Tourism Agency is focused on marketing and communications rather than planning or development [7]. As Smith et al. [9] noted, unplanned urban processes may result in many adverse effects from tourism-related activity. For instance, the unstructured and somewhat unregulated urban planning system in Budapest was one of the reasons for the expansion of the ruin bar market and the formation of the whole party area, as well as the growth in Airbnb accommodation [7]. Additionally, the city is extremely congested due to the existence of sections of national roads and a Budapest-centric transport infrastructure [10]. Consequently, the ‘Pearl of the Danube’ is considered one of the most affected urban areas.
The phenomenon of overtourism in the context of Budapest has recently been investigated in the tourism literature. For instance, Pinke-Sziva et al. [11] analyzed the phenomenon of overtourism with specific reference to the night-time economy in District VII—the so-called “party quarter of Budapest.” With a focus on the same District VII, Smith et al. [7] explored the two closely connected phenomena—ruin bars, and the high density of Airbnb apartments—which are local and global examples of tourism consumption. Smith et al. [9] explored the role of tourism in growing resident discontent and resistance, while Remenyik et al. [6] assessed the extent of overtourism in Budapest. Party tourism is an unconventional tourism product in an urban environment which was first developed for cultural, health, and conference tourists [12]. Due to the divergent interests of inhabitants and the management of flows on the territory, scholars have highlighted the difficulty of measuring overtourism in such urban environments [13].
The excessive use of resources, infrastructure, and the facilities of a destination is among the causes of overtourism, implying that cities have a carrying capacity that tourism can exceed [14]. As per Camatti et al. [15], the tourism carrying capacity of a destination is an essential reference point for developing responses to the complex phenomenon of overtourism. Hence, we refer to the concept of tourism carrying capacity (TCC), which reflects the dynamics of the destination environment [16,17]. TCC is a management tool [18] designed for tourism planning that enables the development of initiatives for managing tourist flows via the balanced redistribution and segmentation of demand, introducing regulations or reservation systems, and creating alternative itineraries or novel tourist attractions [15,17].
Prior research has shed some light on the problems of overtourism in Budapest. However, we still lack an integrated view that links its emergence and comprehensive measurement in a city setting. In our study, we aimed to identify factors that made overtourism possible in Budapest, to apply recognized indicators of overtourism to better understand the city’s carrying capacity and flows of different types of visitors, and to determine the sustainable number of tourists in the Hungarian capital. To address the research objectives, three research questions were raised: (1) What are the factors that led to the emergence of overtourism in Budapest? (2) How can one quantify the phenomenon based on verified overtourism-tailored indicators? (3) How can one approximate the optimal number of visitors in the city?
As suggested by Remenyik et al. [6], the overtourism phenomenon and the capability of an area may be assessed via the use of complex methodologies. Therefore, we adopted an integrated view built upon a case study of urban destination indicators to assess the degree of overtourism in Budapest, and calculated the sustainable number of visitors with the use of unconventional optimization methods such as Fuzzy Linear Programming (FLP). The application of different methods for data collection and data analysis opens up fresh lines of inquiry into the phenomenon of overtourism in Budapest and its districts. The following section presents the theoretical discussion of the overtourism phenomenon and its measurement, with a focus on TCC.

2. Literature Review

2.1. Definition of Overtourism

Over the last two decades, the number of global outbound tourists has more than doubled. International tourist arrivals increased from 673 million in 2000 to 1460 million in 2019 [19], harming many popular destinations [20]. Even though the term ‘overtourism’ has attracted increased interest among researchers in recent times, the issue of the crowding of destinations has been addressed in the literature since the mid-1960s [21,22,23,24,25,26]. Along with rapid urbanization, tourism mobility, low-cost flights, increases in income, the growing popularity of Airbnb, and the proliferation of social media and information communication technologies have increased the demand for city tourism immoderately [27,28]. To define the unfavorable consequences of this excessive demand, Skift created the term ‘overtourism’ in 2016 [27], which has been increasingly used in the literature [14]. Nevertheless, there is no academically accepted definition of the term; thus, it remains open to multiple interpretations [29]. According to the UNWTO definition, overtourism is “the impact of tourism on a destination, or parts thereof, that excessively influences perceived quality of life of citizens and/or quality of visitors experiences in a negative way” [27] (p. 4).
One of the main economic problems caused by overtourism is the increase in the price of housing, goods, and services in destination areas [30] which fuels gentrification. Gentrification is the process of the displacement of low-income households from a transforming destination that often entails great expense [31]. The other element that drives gentrification is short-term rentals, which decrease the housing stock for long-term rentals [32]. The social and cultural issues associated with overtourism include depopulation, conflict between residents and tourists, insecurity, decreasing quality of life, and the destruction of local culture. With the increase in the touristification of urban centers, living conditions change and become less suitable for residents, which leads to depopulation [33]. An excessive number of tourists per resident decreases the quality of life of residents, resulting in tourismphobia [34]. Young travelers may be driven to seek out new experiences, causing a severe deterioration in perceived security because of their poor behavior, alcohol/drug use, and engagement in prostitution and gambling that diminish moral values and cultural traditions [35].
In terms of negative environmental impacts, overtourism drastically increases water, land, air, noise, and aesthetic pollution, and is associated with solid waste, littering and sewage treatment issues, infrastructure degradation, natural resource depletion, biodiversity loss, and climate change [36,37]. Additionally, although tourists may treat cultural assets with respect, an excessive number of visitors can threaten the physical condition of historical and archaeological sites through wear and tear, together with insufficient regulation and poor management [38].

2.2. The Measurement of Overtourism

The literature has defined several indicators for measuring the phenomenon of overtourism, which affects the wellbeing of both tourists and residents. For instance, Simancas Cruz and Peñarrubia Zaragoza [39] estimated tourist accommodation density, an indicator for determining a state which is undesirable for tourists and, thus, defines the optimal limit for accommodation saturation. Table 1 presents six indicators of overtourism as defined by Peeters et al. [40].
The indicators above are designed to estimate whether a destination may be at risk of overtourism from an economic or social perspective. However, the authors [40] point to the inability of assigning a general value to an indicator that infers when a state of overtourism is likely to develop.
Additionally, to avoid negative consequences (e.g., overcrowding, congestion, or environmental degradation) arising from tourist activities and flows, how tourism develops in relation to the principles of sustainability should be considered [41]. As Coccossis et al. [41] note, planning and management for tourism growth are of particular importance in the context of sustainable development. Hence, it is especially important for tourism destinations to apply a minimum number of consistent indicators for assessing sustainable tourism [42] and the phenomenon of overtourism.

2.3. Tourism Carriying Capacity

In measuring overtourism, the concept of TCC is considered a valuable operational tool for identifying the limits to sustainable tourism activity [18,43]. On the one hand, a growing number of visitors positively affects the income and employment levels of some of the population in the tourist destination. On the other hand, growth in visitor numbers can generate negative effects. Understanding the number of tourists a destination can tolerate has become one of the major challenges which policymakers and scholars have been trying to address.
The topic of TCC prevails in the overtourism debate. The concept was defined by the World Tourism Organization as “the maximum number of tourists that a space can absorb without a lowering of the quality of the visitor’s experience and without serious consequences for its ecology and its socio-economic structures” [44] (p. 5). The literature outlines three main dimensions of carrying capacity, including the physical–ecological, socio–demographic, and political–economic dimensions which are derived from problems such as the threat to the physical environment of a destination, the loss of a local community’s character, and the dependence of the local economy on tourism [15,18].
An early description of TCC referred to the maximum number of visitors that could be supported without an unacceptable decline in the quality of visitor experience and the quality of the environment. Subsequently, the definition of TCC was complemented with reference to other types of capacity, including the capacity of supporting facilities, among them the maximum number of accommodation units, sitting places associated with the catering sector, parking spaces, the capacity for solid waste disposal, and other services which cater to the needs of visitors. These facilities can constrain the tourist capacity of the destination and impose additional costs on residents [45]. Previous research has widely applied the TCC model to determine the optimal number of visitors, especially in the context of cities, which have been exposed to negative externalities because of overtourism over recent years. Several scholars have estimated the carrying capacity of different destinations—including for the historical center of Venice [16,45], Rome [46], a coastal destination on the Costa del Sol, Spain [43], and Dubrovnik in Croatia [15].
In terms of the practical calculation of TCC, as Bertocchi et al. [16] highlighted, one of the prominent research streams is dedicated to the use of fuzzy linear programming. Costa and Van der Borg [47] and Canestrelli and Costa [45] were among the first to determine the social–economic carrying capacity of Venice’s historical center by applying fuzzy linear programming. Fuzzy linear programming permits the estimation of the optimal number of tourists by considering several constraints and using approximate data [45,46]. The advantage of this unconventional method of optimization is its capacity to incorporate imprecise data.
However, there is no single and universal method of calculating TCC [16], since TCC can be studied in relation to its specific components and through a holistic approach involving the application of different methodologies and approaches. Some indicators cannot be operationalized because of the lack of data. The concept of TCC has also been criticized in the literature, as this type of measurement simplifies the problem of overtourism [14,43,48,49]. Some scholars assume that the concentration on calculating carrying capacity may be misleading as the estimated number of tourists may be too large and suboptimal [50]. Hence, the focus should be on visitors’ experiences and behavior, rather than on the number of people [9,14,51].
Notwithstanding the difficulty of establishing the carrying capacity of destinations [9] and the critiques of the approach, McCool and Lime [49] confirm that in some cases the carrying capacities for facilities (e.g., parking lots or cultural sites) may be identified. In general, proponents believe that TCC can help stimulate sustainable development scenarios and the better management of tourist flows [16]. In this study, we adopt the commonly accepted indicators for measuring the carrying capacity of a given city by applying FLP to identify the optimal number of visitors to Budapest. Thus, we attempt to contribute to an under-researched area of urban sustainable tourism [52] that may help create the highest possible utility for tourism actors and the local community and economy.
This section has attempted to provide a summary of the literature related to the phenomenon of overtourism and its measurement. Much of the research on overtourism has focused on identifying and evaluating the reasons for the adverse effects of tourist activities and streams. To date, various methods have been developed and introduced to measure overtourism. However, the previous studies indicate the difficulty of measuring this phenomenon, especially in urban environments, outlining the need for comprehensive methodology to analyze the extent of overtourism in a city setting. Collectively, those studies highlight the critical role of determining the tourism carrying capacity of a destination and adopting an integrated approach in terms of data gathering and unconventional analytical methods. To address the issues related to overtourism in the context of Budapest, we, therefore, implemented the complex methodologies which are carefully described in the next section.

3. Materials and Methods

3.1. Methodological Triangulation

The phenomenon of overtourism in Budapest has been investigated by applying a combination of multiple methods of data collection and data analysis. The use of different data collection methodologies, called triangulation [53,54], has been theorized and adopted in tourism literature [55,56,57], including research about tourism-related issues in Budapest [7,9,11]. A triangulation strategy increases the credibility and validity of research [56,58], and provides better conclusions through the convergence and collaboration of findings [59]. However, as Koc and Boz reported, tourism literature lacks studies for which more than one method of data collection was used [56].
Following the recommendation of Koc and Boz [56] to increase the use of data triangulation, we triangulated different data sources from several independent sources to explore the studied phenomenon. First, we analyzed the academic literature and online media news on the appearance of overtourism in Budapest to understand the problems the city experienced before the outbreak of the coronavirus pandemic and subsequent border closures. Second, one of the authors collected photographs depicting the negative impacts of tourism activities in Budapest during 2019. Previous studies have confirmed the practicality of using images of tourist destinations as a research tool [60,61], as such images encapsulate the visual look of a place, its atmosphere, and the emotions it evokes [62].
The adoption of qualitative techniques preceded the development of further quantitative research [53,55]. Hence, third, we collected longitudinal tourism data for Budapest and its 23 districts. The data was complemented with the results of a survey distributed among Hungarian tourism industry experts. Similar to the studies of Bertocchi et al. and Camatti et al. [15,16], we adopted the criteria of TCC to study pressure on the urban destination (i.e., Budapest) to define the sustainable number of tourists staying in three types of accommodation. Unlike in Venice and Dubrovnik [15,16], Budapest has geographical characteristics that make it more difficult to capture the phenomenon of overtourism. Subsequently, eight tourist-supporting facilities (see their description in Section 4.3) were selected as relevant as they cater to the needs of tourists, and were analyzed with the application of FLP. Based on the integrated approach, the unconventional analytical methods applied in the current research offer new lenses and perspectives with which to understand the extent of overtourism in Budapest.

3.2. Tourism Carrying Capacity Model: Fuzzy Linear Programming

This section presents the mathematical background behind the estimation of the ideal maximum number of tourists in Budapest. Considering previous research on TCC [16], we use the unconventional optimization method called FLP to estimate the optimal number of tourists in the city. As an optimization tool, FLP helps identify the optimal number of tourists in a destination by considering, on the one hand, the need to maximize the total revenue generated by tourists in the destination, and on the other, the inherent limitations of the destination in terms of physical–ecological, socio–demographic, and political–economic constraints.
Mathematically, the FLP problem can be formulated as:
maximize z ˜ c ˜ x s . t . A ˜ x b ˜ x 0
where the symbols and mean equality and inequality, respectively, with respect to a given linear ranking function, F; c ˜ T = ( c ˜ 1 , , c ˜ n ) T ϵ R n is the cost vector; x = ( x 1 , , x n ) T ϵ R n is the vector of decision variables; b ˜ = ( b ˜ 1 , , b ˜ m ) T ϵ R m is the right-hand side vector of the constraints, and A ˜ = [ a ˜ i j ] m x n ϵ R m x n is the constraints matrix, being c ˜ j , b ˜ i , and a ˜ i j fuzzy numbers, for i = 1, …, m, j = 1, …, n.
In the context of this study, given the revenue generated by each type of tourist in Budapest (the cost vector), the goal is to maximize total revenue, denoted as c ˜ x , subject to the inherent limitations of the city represented by A ˜ x b ˜ . The use of fuzzy numbers indicates that information is only an approximation (rather than exact information).
The solution to (1) uses the concept of the ranking function, where the original problem is transformed into its equivalent crisp problem and then standard methods such as the Simplex Method are applied [63]. This study considers the following ranking functions:
Yager s   F 1   function :   F 1 ( a ˜ ) = 1 3 · [ ( a R ) 2 ( a L ) 2 ] + ( R 2 L 2 ) + ( R a R L a L ) ( a R a L ) + ( R L ) Yager s   F 3   function :   F 3 ( a ˜ ) = L + a L + a R + R 4
where a ˜ = ( a L ; a R ; L ; R ) is a trapezoidal fuzzy number, being L < a L < a R < R real numbers.

4. Results

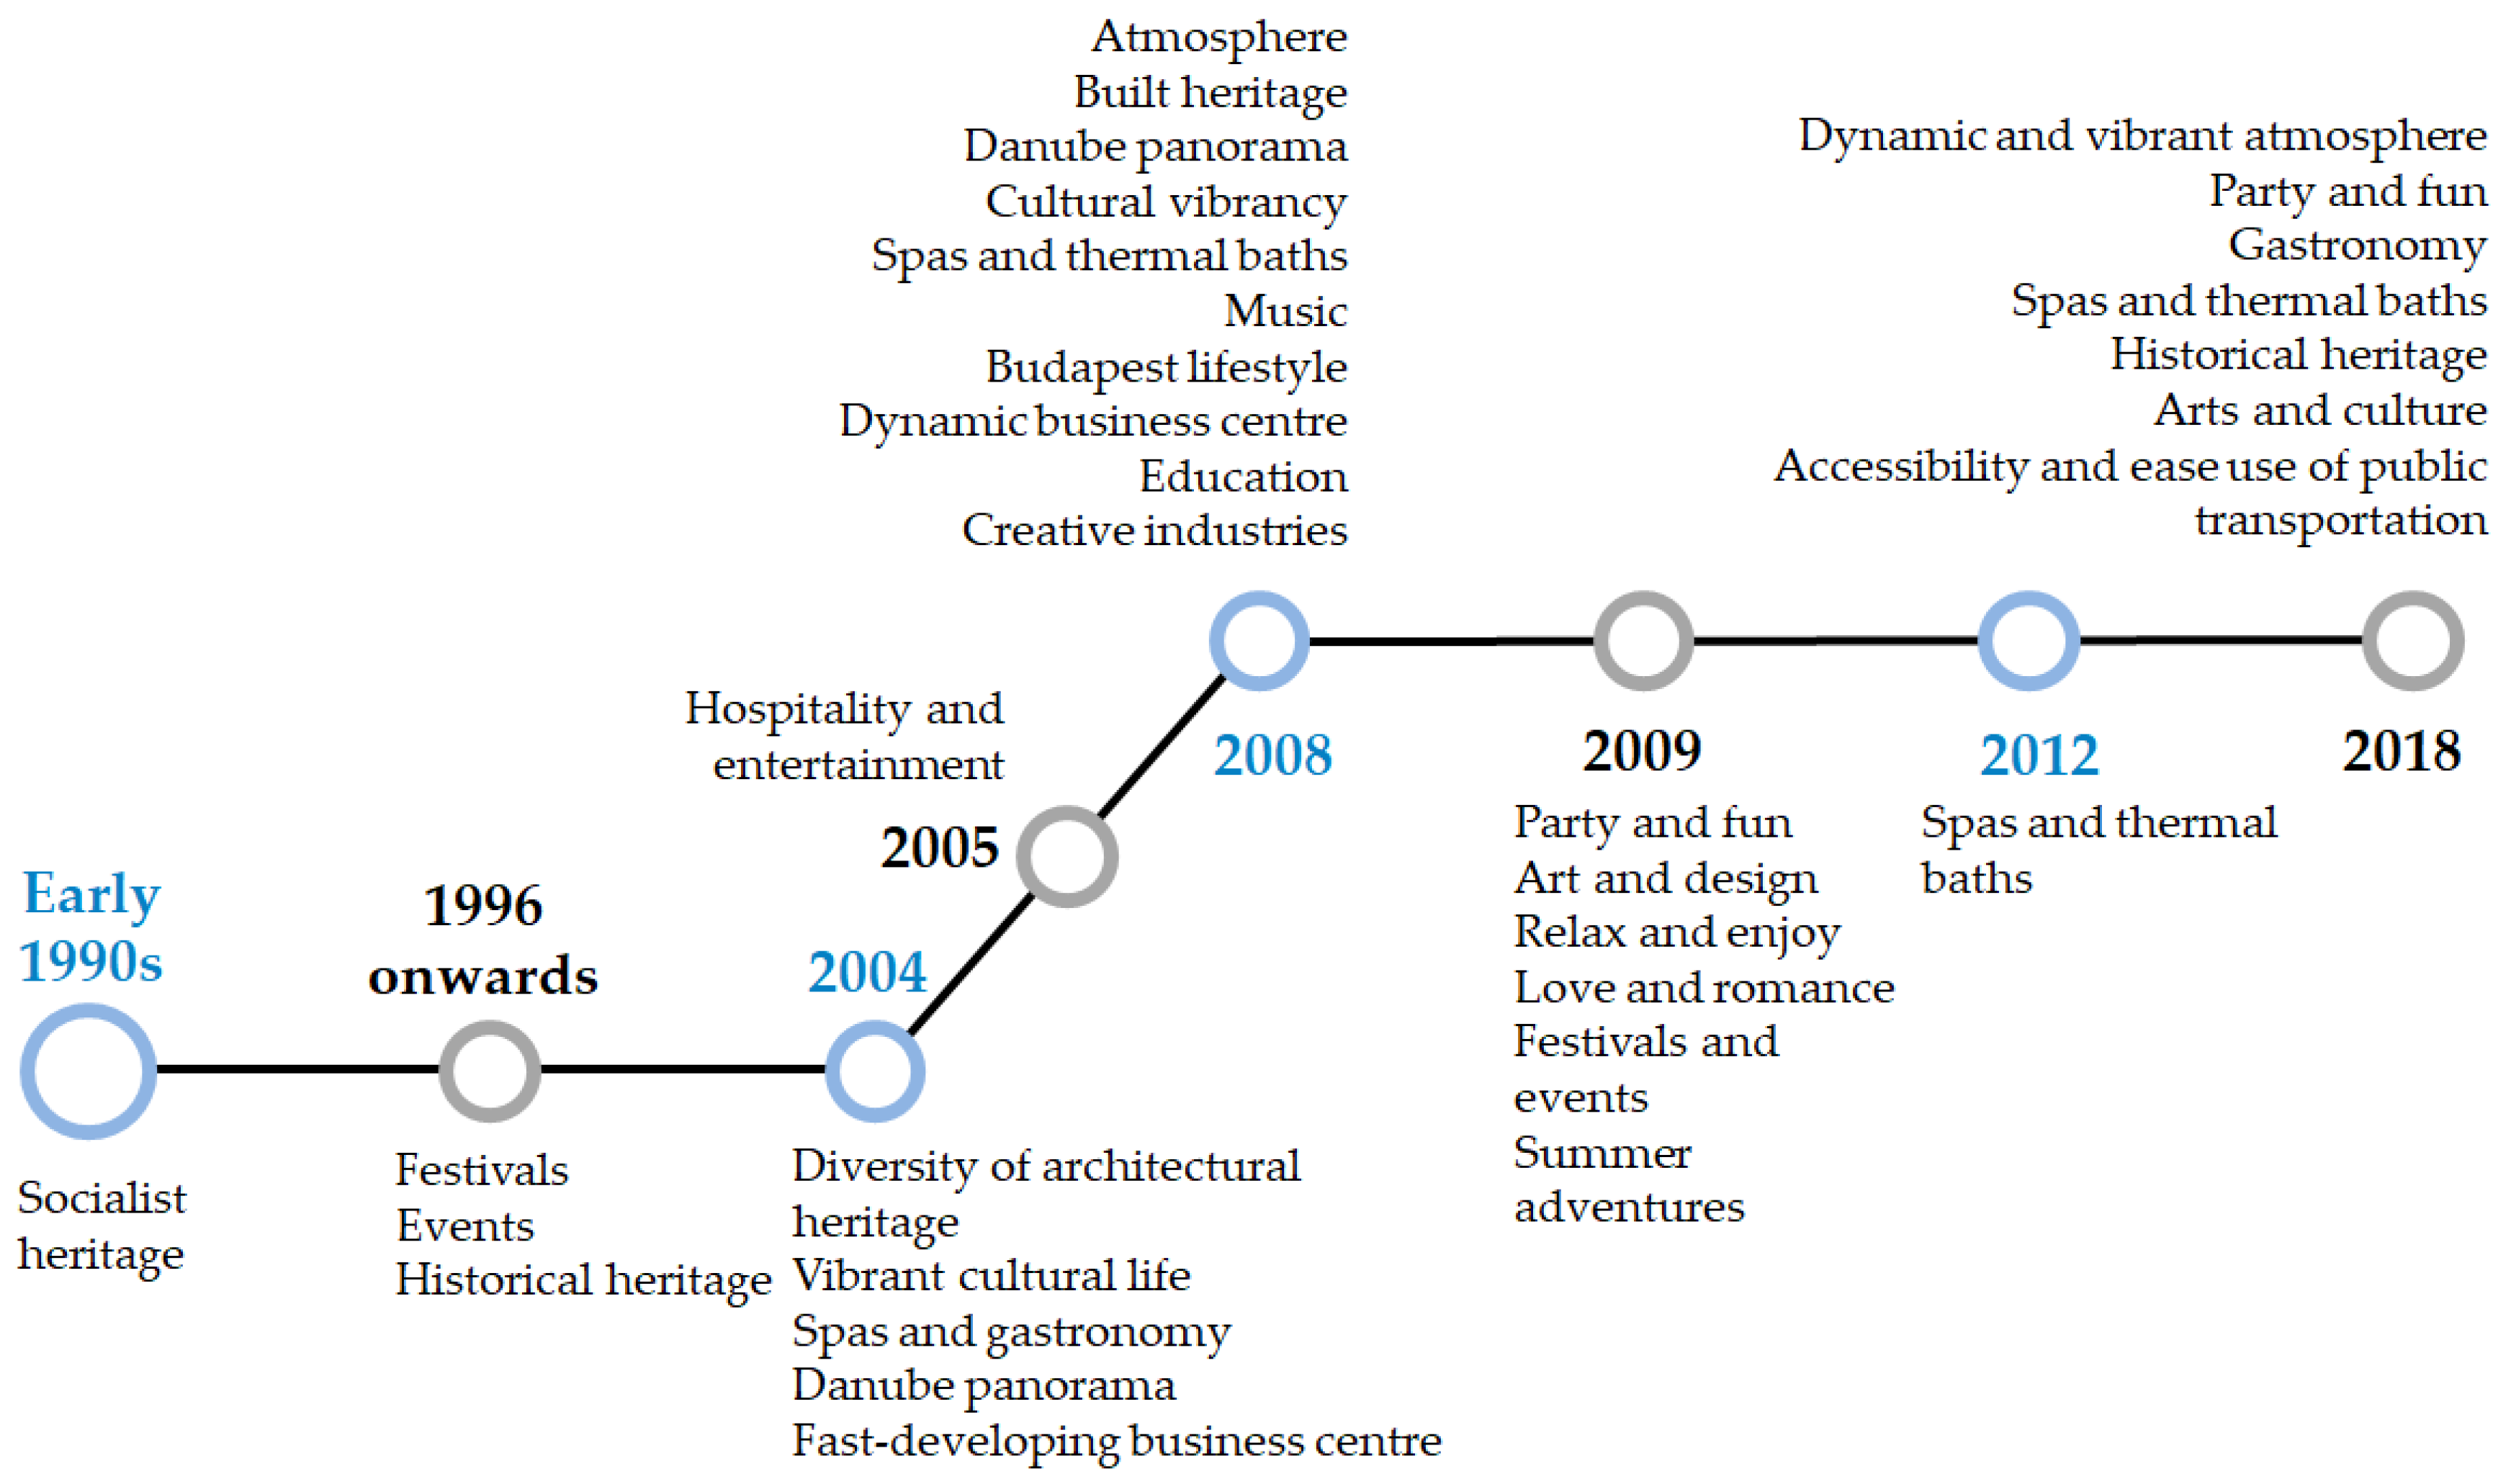
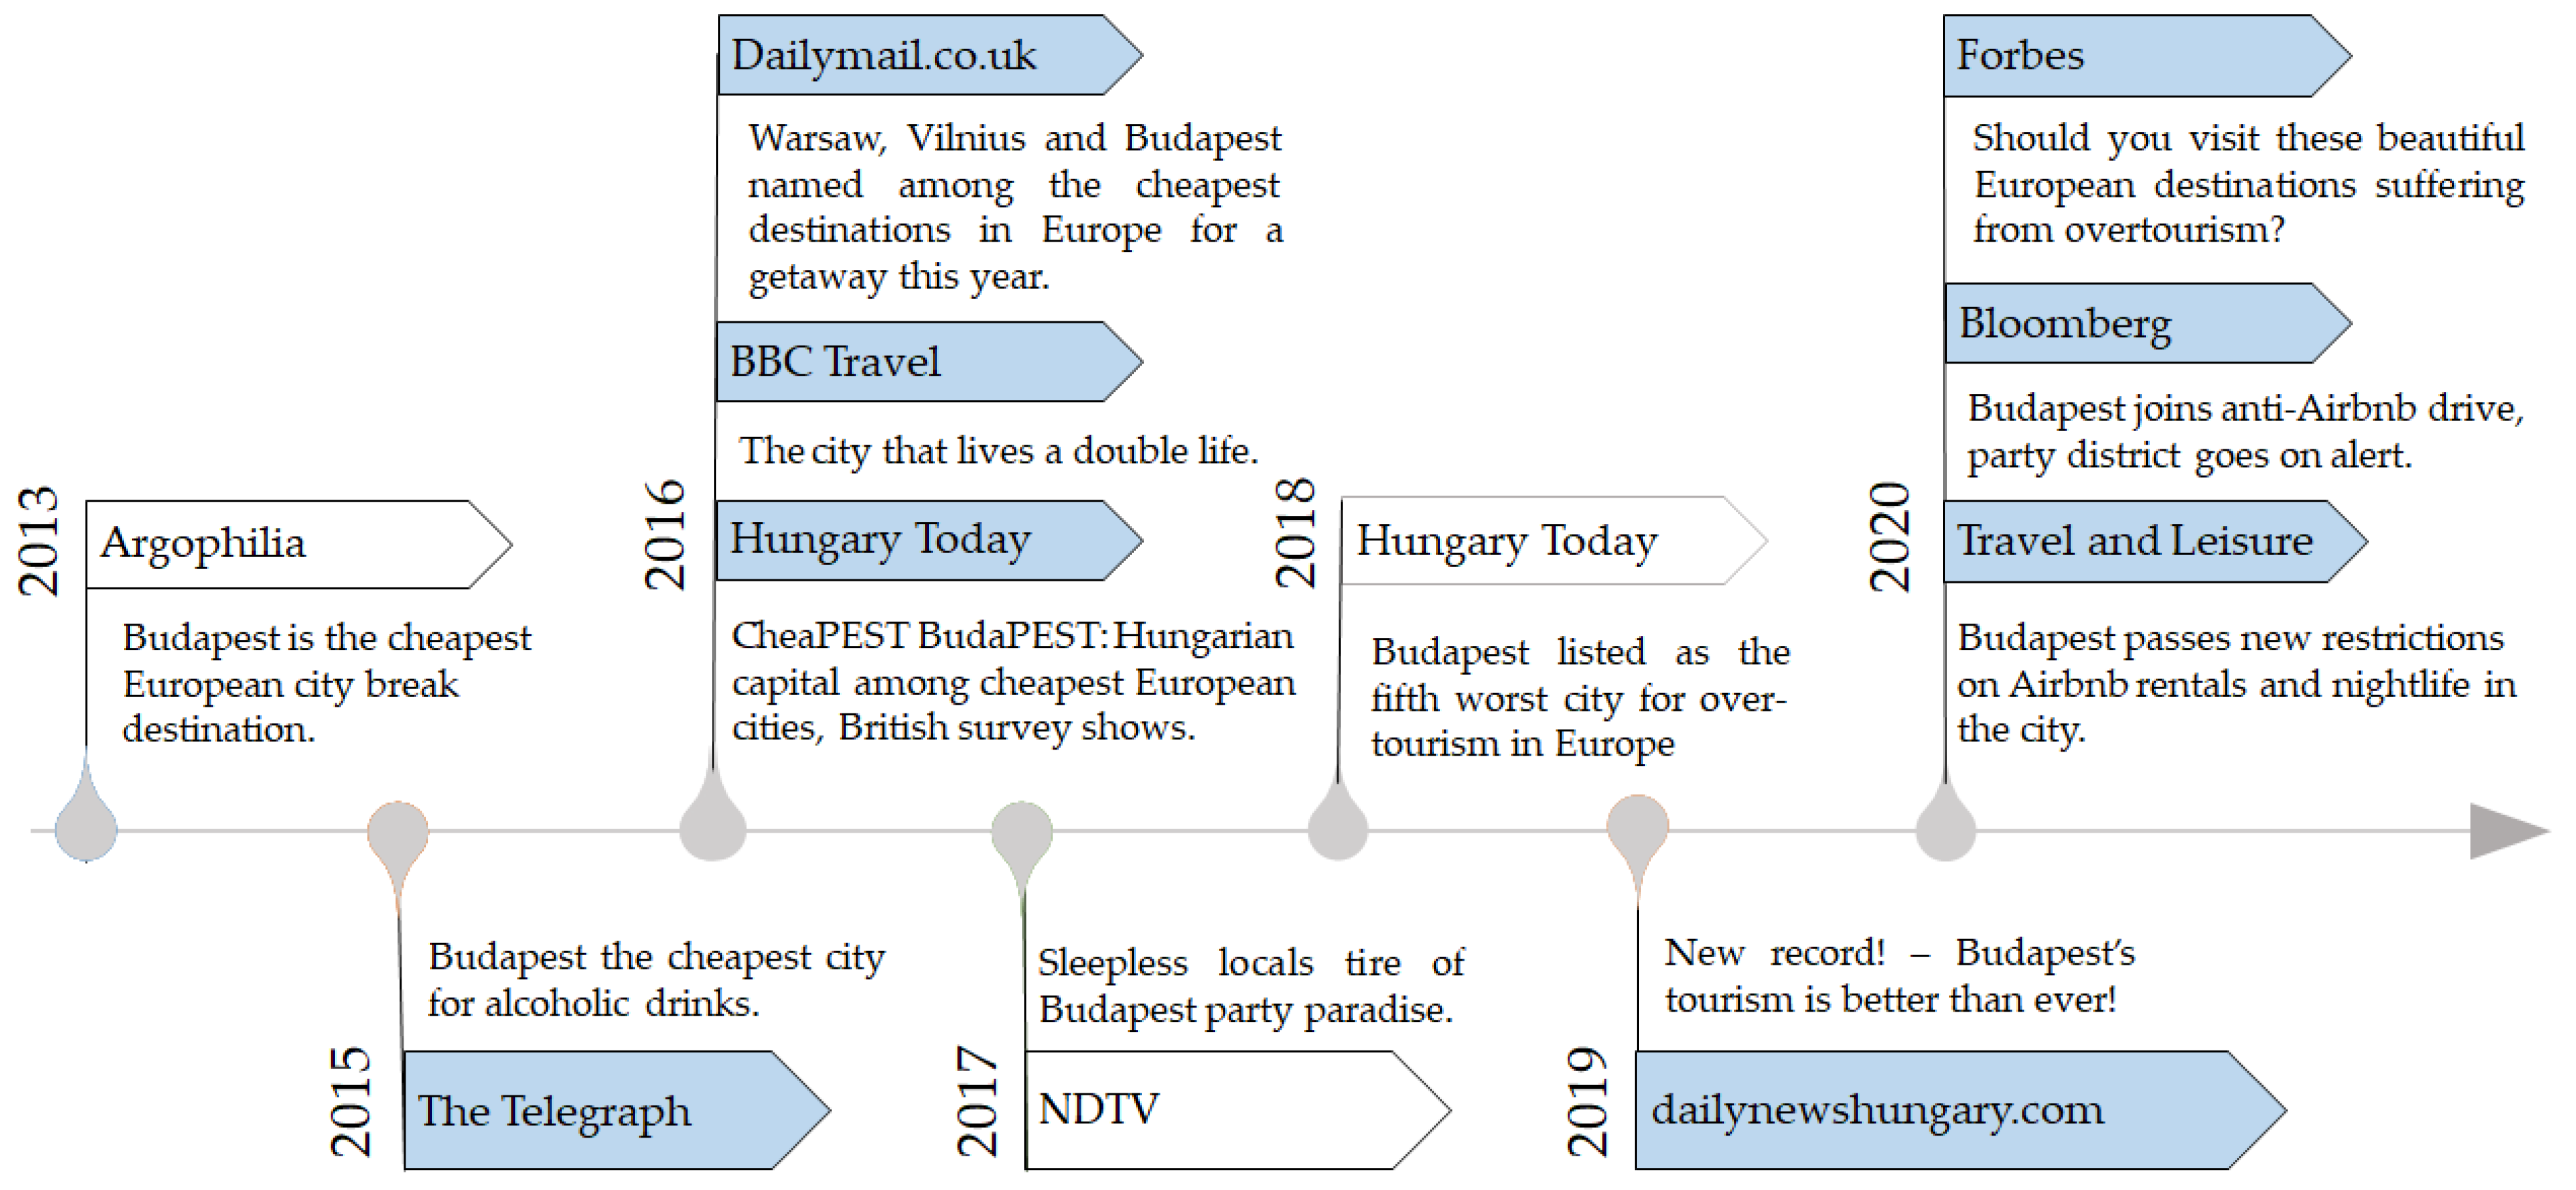
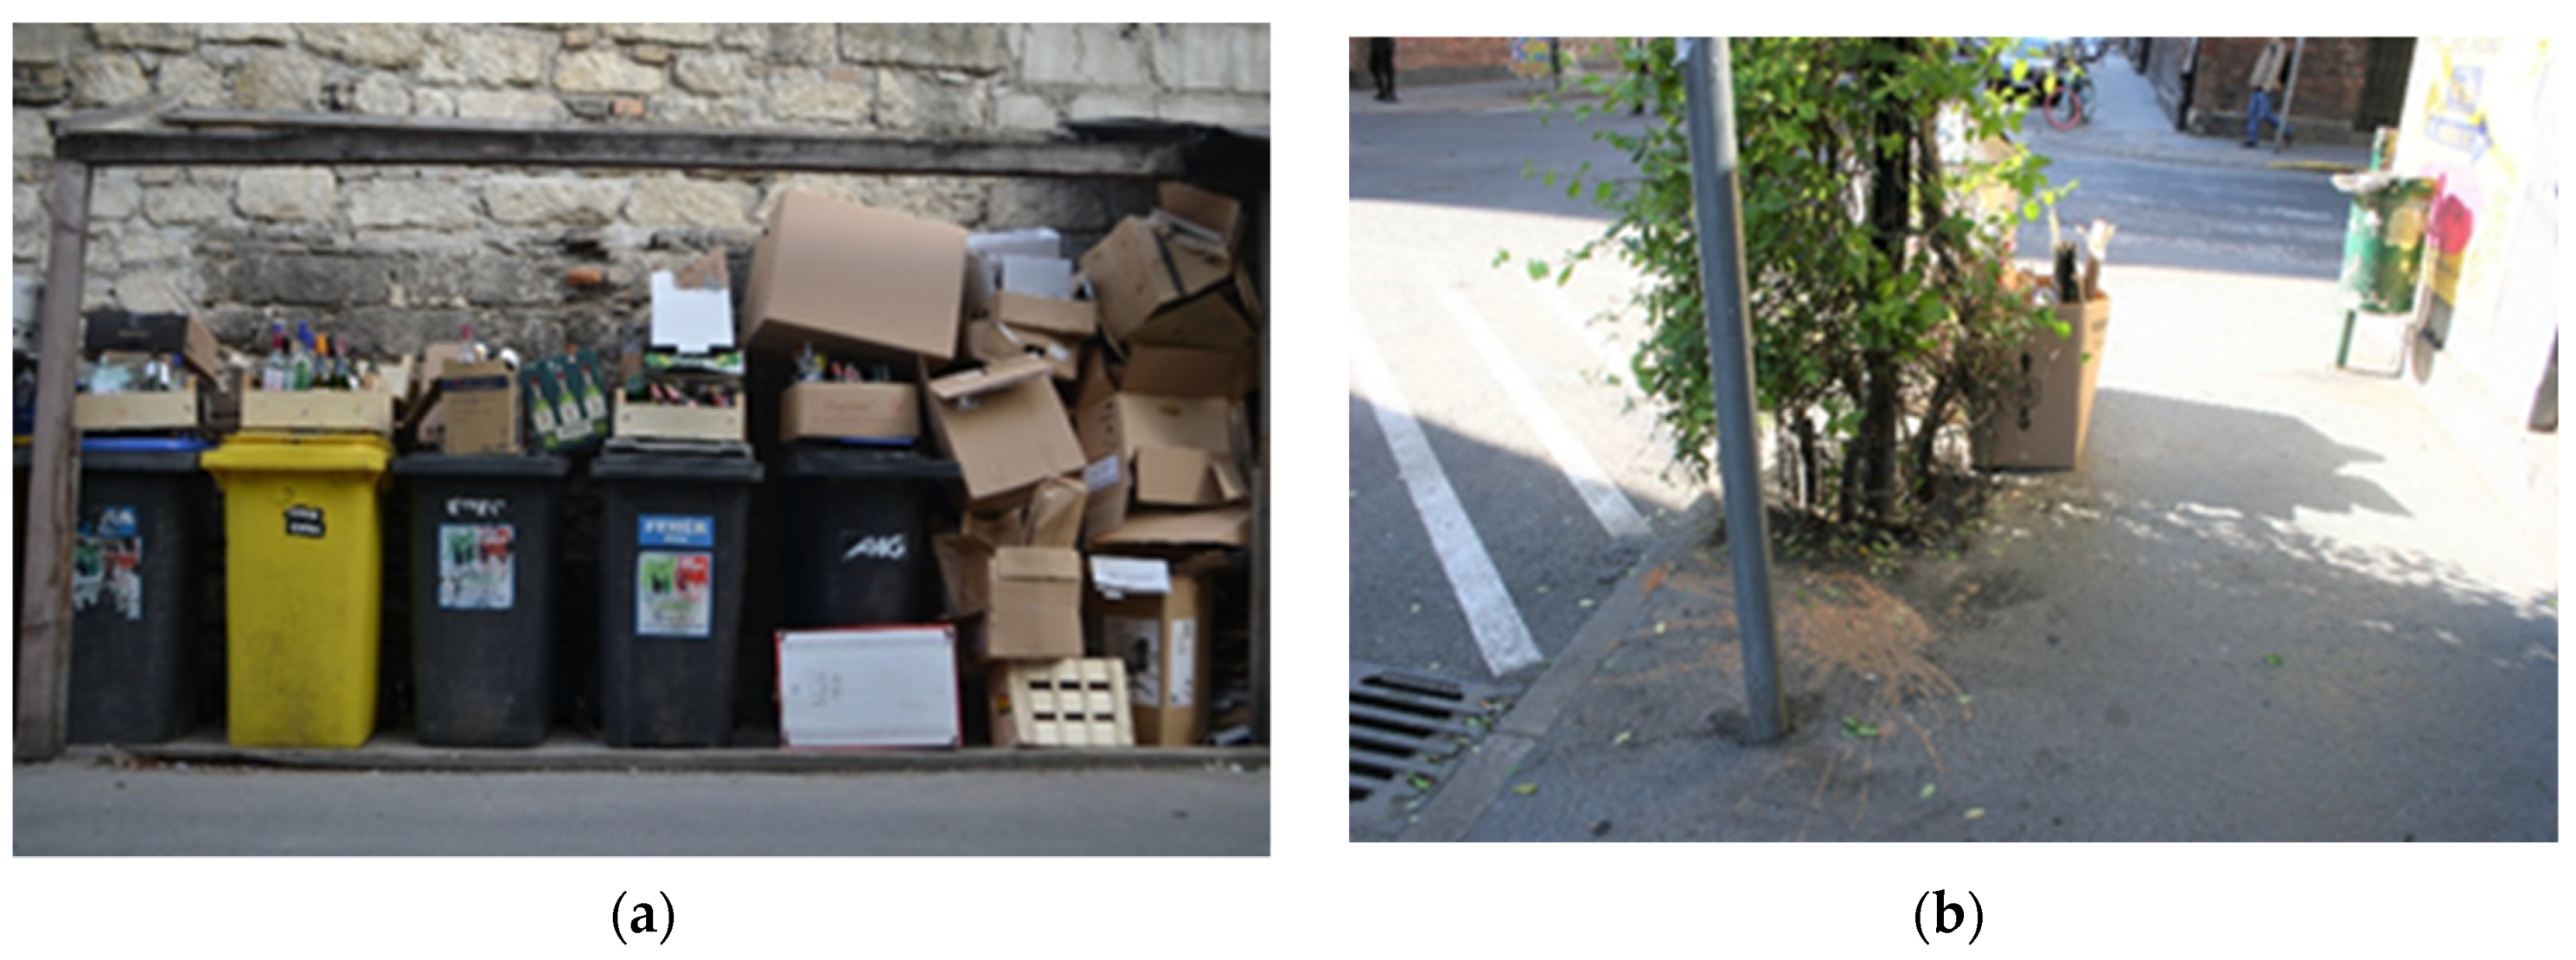
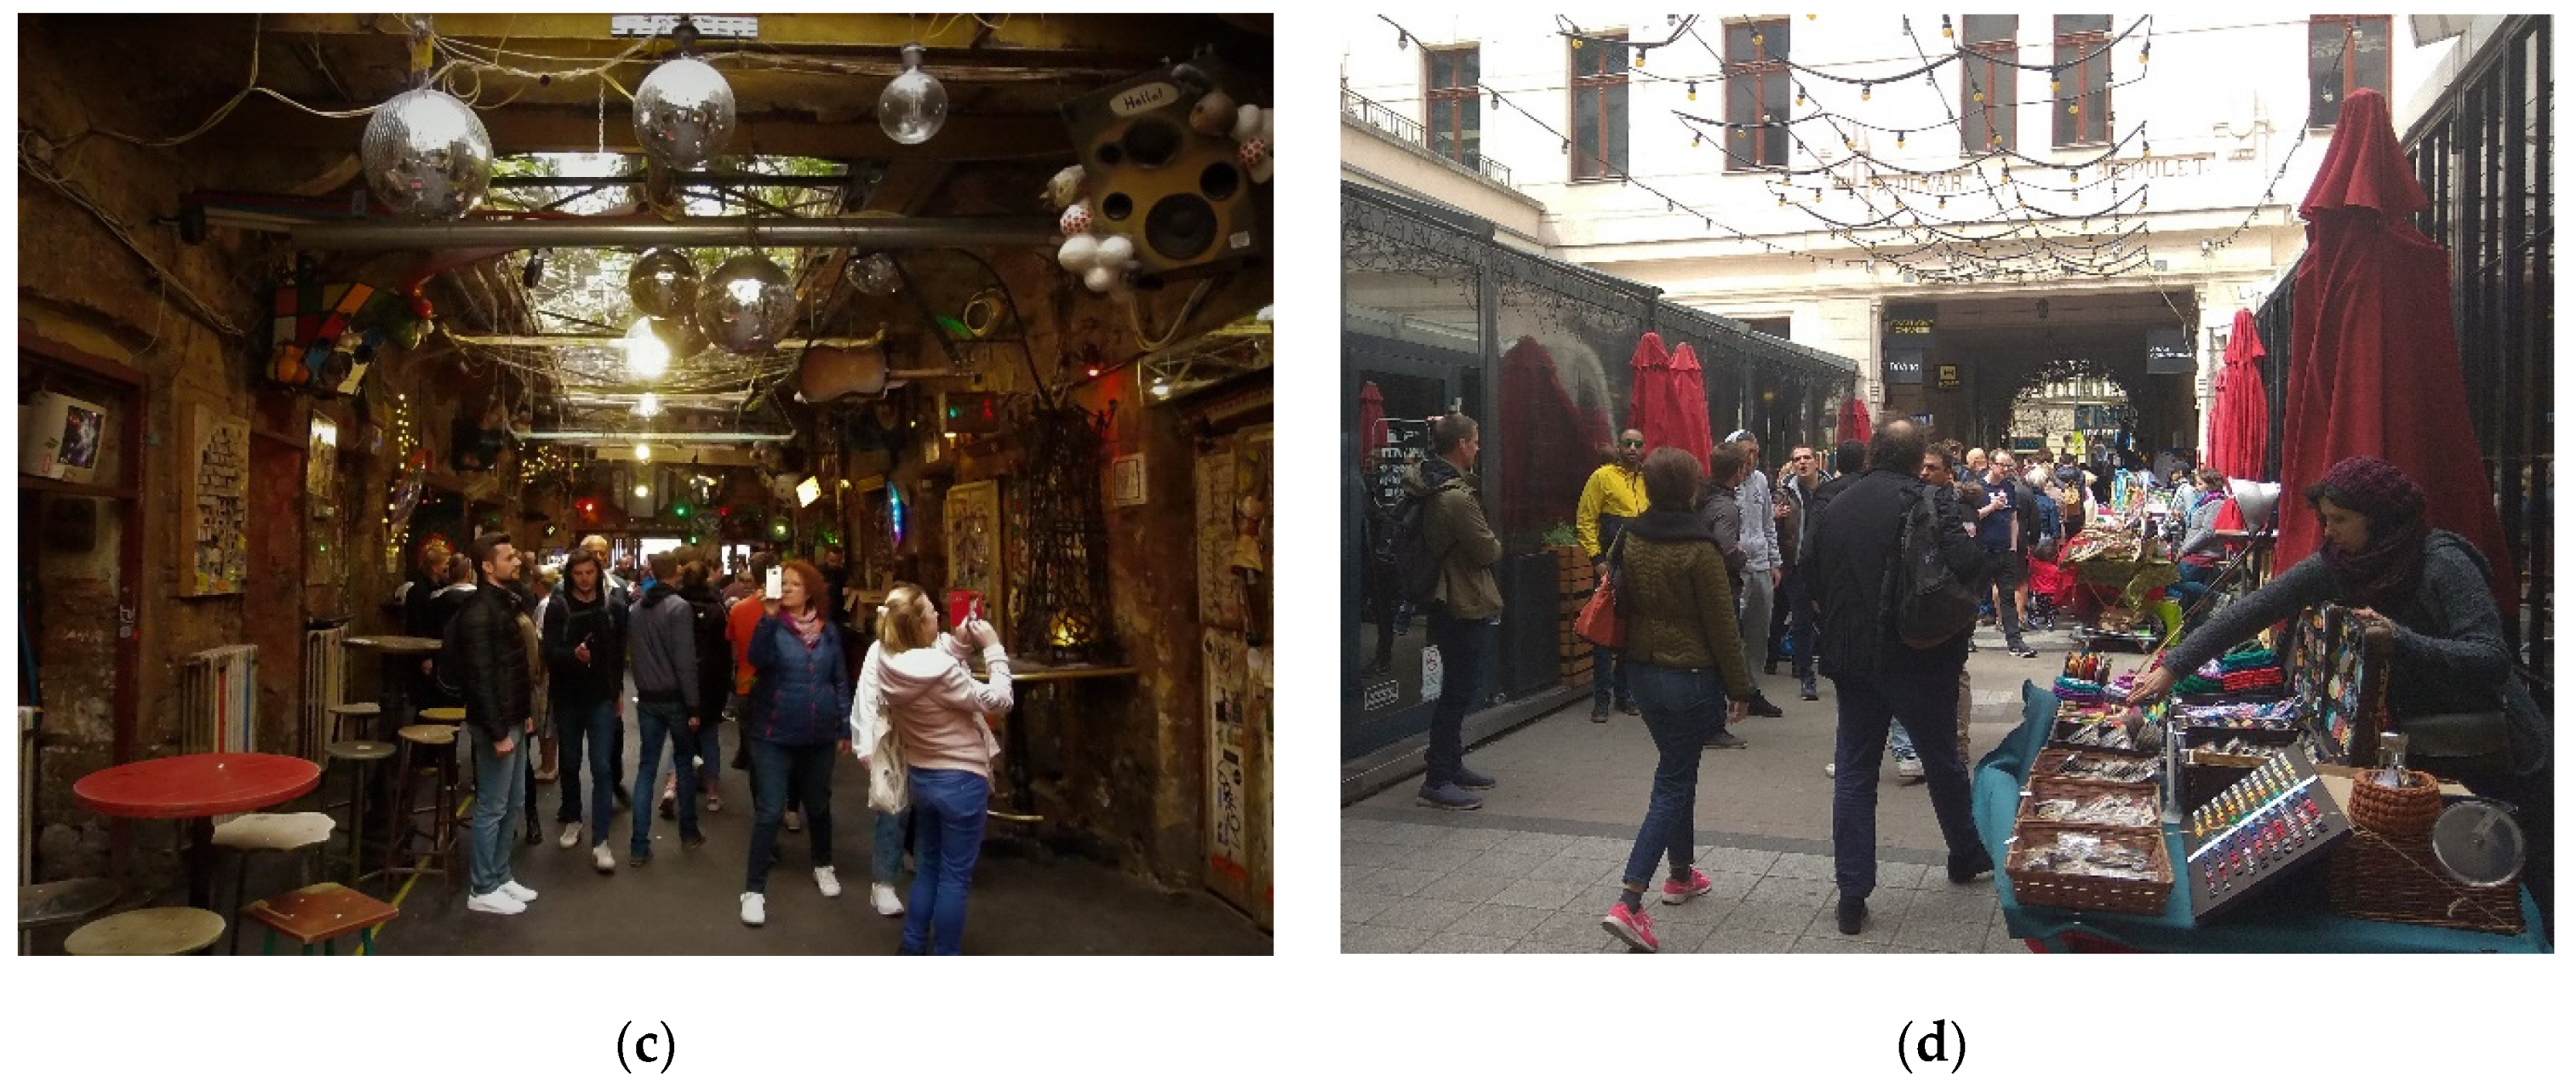
4.1. Appearance of Overtourism in Budapest

With EU accession in 2004, the tourism industry in Budapest experienced rapid growth in international visitor numbers [11]. Low-cost airlines and numerous Airbnb units leveraged the number of tourists in Budapest, particularly younger tourists whose main motives were having fun and partying in the so-called Jewish ghetto of Budapest, located in the city center [9]. Besides these factors, the government and Hungary’s tourism marketing organization, which covers Budapest, share responsibility for this boom in party tourism due to the lack of a consistent and strong marketing campaign between the years of 1990 and 2010 that resulted in an ambiguous brand image for the city [64,65]. The figure presented below (Figure 1) demonstrates the marketing strategies of Budapest; note that the focal point in 2012 differs from the image creation strategy in 2018.
The other factor that boosted demand for the night-time economy was news about cheap alcohol and entertainment opportunities. In the mid-2000s, budget airlines promoted the low price of beer in Hungary in their marketing campaigns [9]. News on websites until 2016 similarly portrayed Budapest as the cheapest urban destination among European cities with a focus on alcoholic beverages. Problems caused by heavy alcohol consumption and party tourism created resistance among locals against tourism development in the city [9]. Since 2018, the news has centered upon overtourism and its negative consequences. In order to mitigate the phenomenon, the government introduced new regulation that authorizes municipalities to decide on or limit the maximum period of Airbnb rentals. Figure 2 exemplifies the evolution of online news about the capital city for 2013–2020.
Pinke-Sziva et al. [11] conducted interviews with locals and tourists, and identified that most of the complaints arising from overtourism came from the city center of Budapest (District VII), which became a party and alcohol-centered quarter that provided an authentic visitor experience due to its ruin bars and the traces of Jewish cultural heritage. The concentration of short-term vacation rentals on Airbnb in this area is, likewise, influential in terms of leveraging the number of non-cultural tourists [78]. The touristification of the city center rapidly increased housing prices [9]. Based on data from the Hungarian Central Statistical Office (HCSO), housing prices increased 80% from 2007 to 2019 [6], which generated gentrification [9]. Other complaints about overtourism included public urination, street crime, litter, dirty streets, and the number of drunk people [11]. The photos below (Figure 3), taken in April–May 2019, demonstrate the negative environmental impacts of overtourism (cluttered streets caused by overloaded garbage containers, vomit-stained streets, and the social issue of overcrowding).

4.2. Indicators of Overtourism

This section explores the phenomenon of overtourism in Budapest considering four indicators: (1) tourism density, (2) tourism intensity, (3) the sharing economy, Airbnb, and (4) total occupation of hotels. The first three indicators are described in Table 1, while the last one describes the historical evolution of the total occupation rate in hotels.

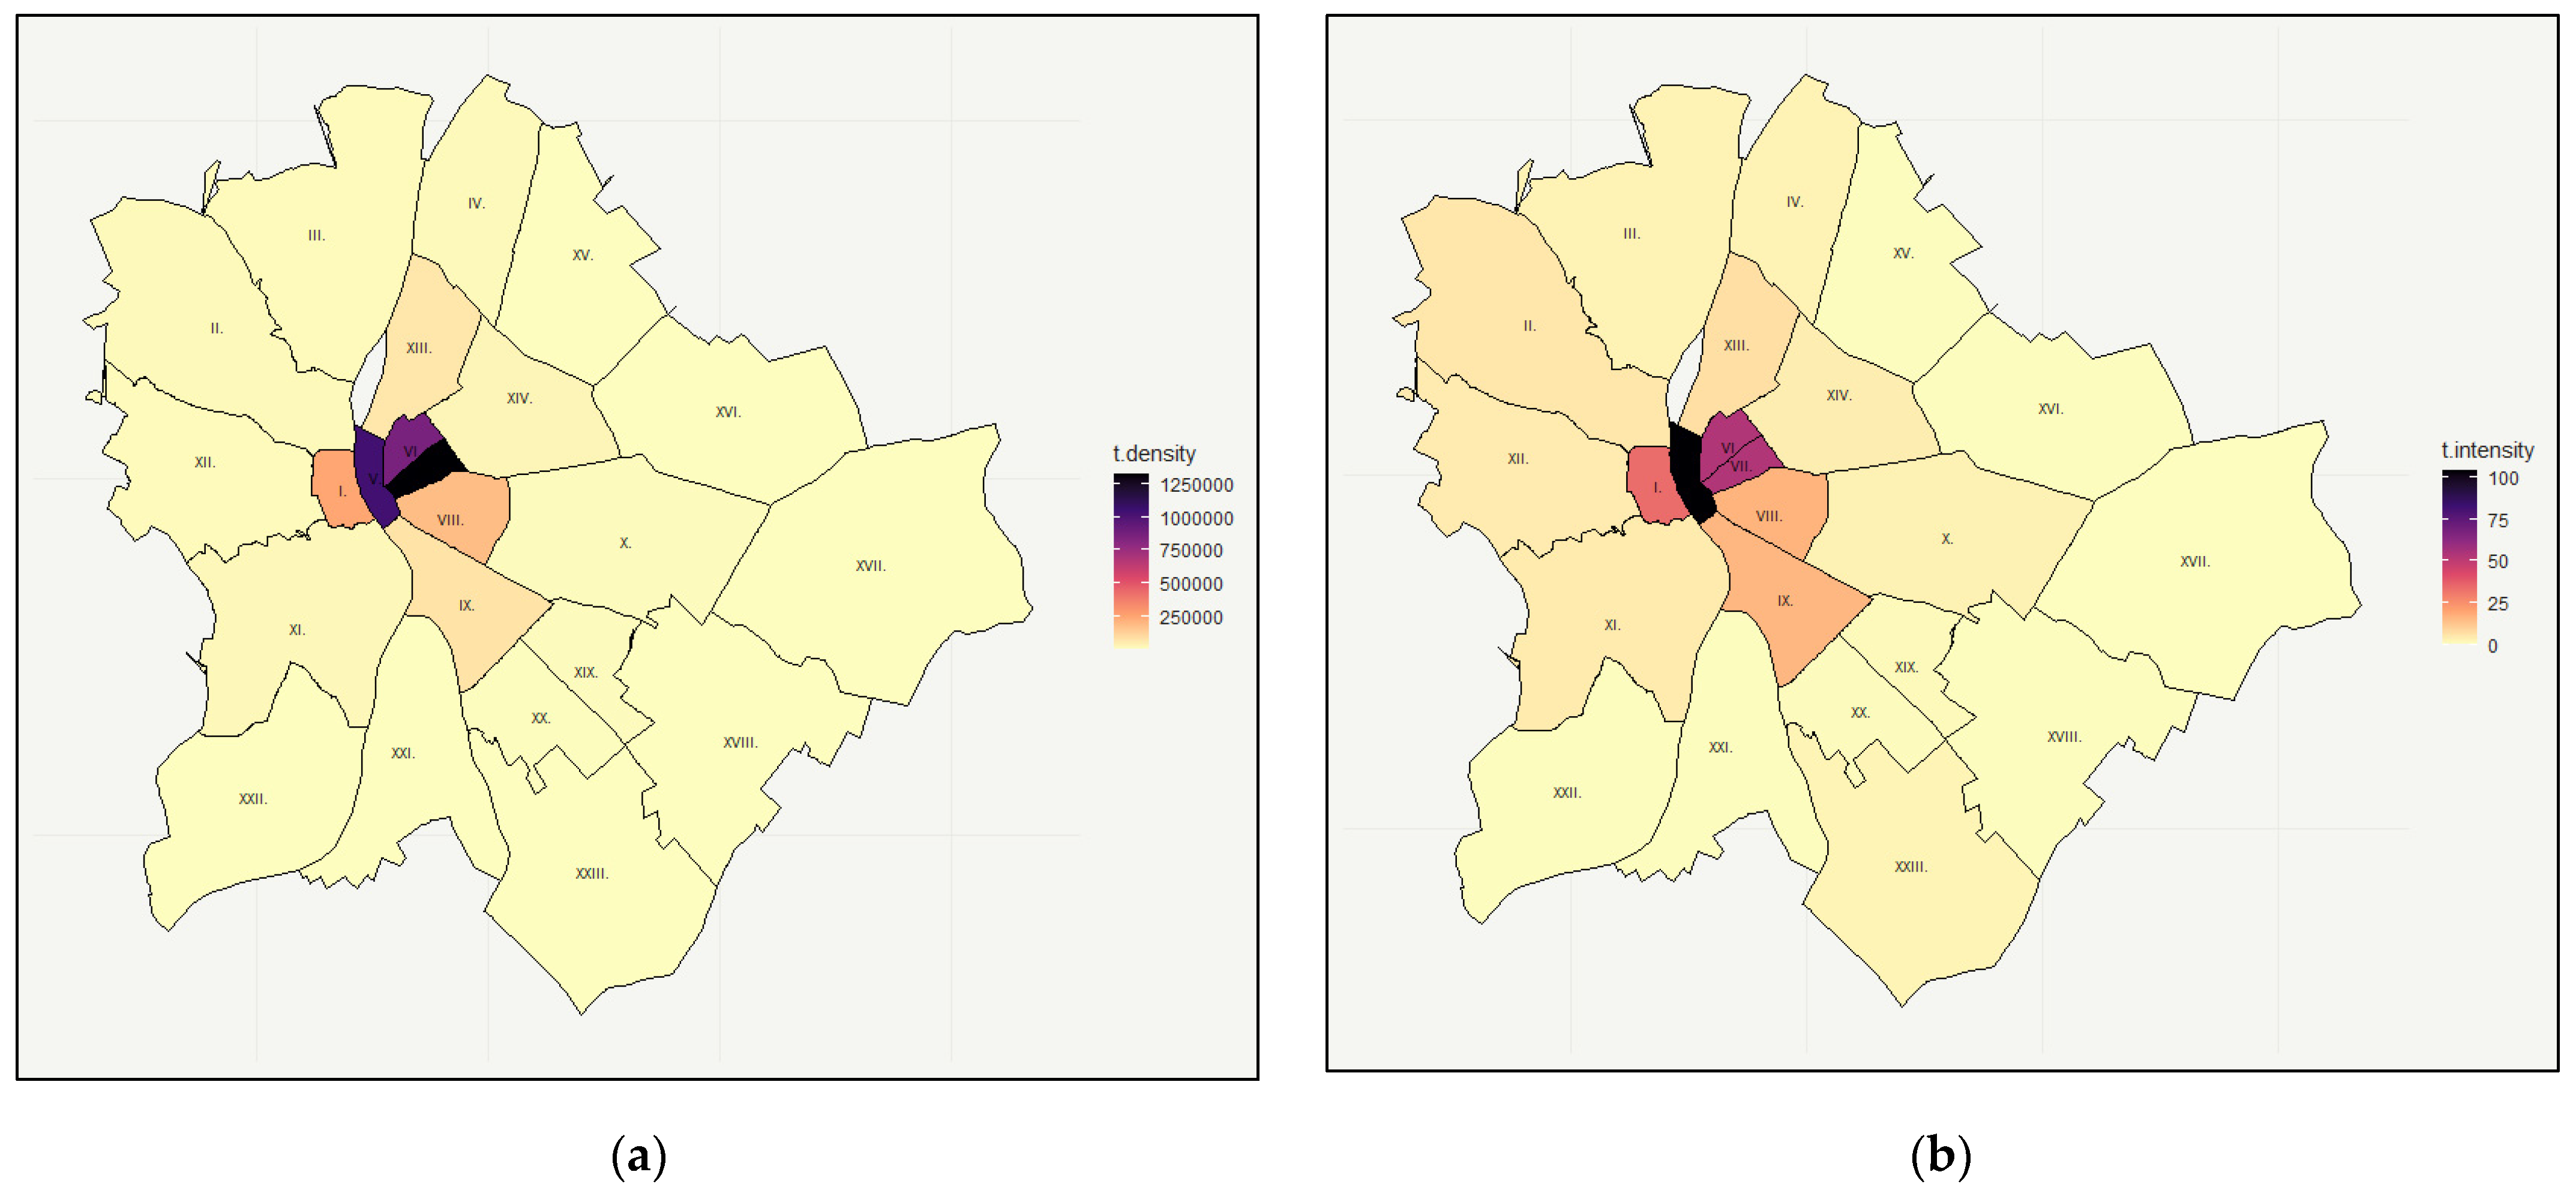
4.2.1. Tourism Density and Intensity

According to Peeters et al. [40], the phenomenon of overtourism is primarily associated with tourism density (tourists per square kilometer) and tourism intensity (tourists per resident). Table 2 shows the calculation of both indicators considering Budapest (as a city) and five selected districts.
The results show that both indicators of overtourism vary significantly from district to district (see full table in the Supplementary Material). For instance, the minimum value for tourism density is associated with District XVII (value 65.3), while the maximum occurs in District VII (value 1,319,903.3). In the case of tourism intensity, the minimum also occurs in District XVII (value zero; after rounding 0.0408), while the maximum occurs in District V (value 103.5). Figure 4 shows both indicators graphically.
Based on Figure 4, the area most affected in terms of both measures is the center of Budapest (formed by districts I, V, VII, VII, and VIII). Moreover, tourism intensity also affects the nearest districts, such as districts II, IX, XI, XII, and XIII.
Table 3 presents the data per percentile group. Note that the last group (the 5th percentile) captures most of the range of values—approximately 90% in the case of tourism density and 85% in terms of tourism intensity (skewed distribution). It also shows that the districts within the 1st, 2nd, and 5th group are the same for both indicators.

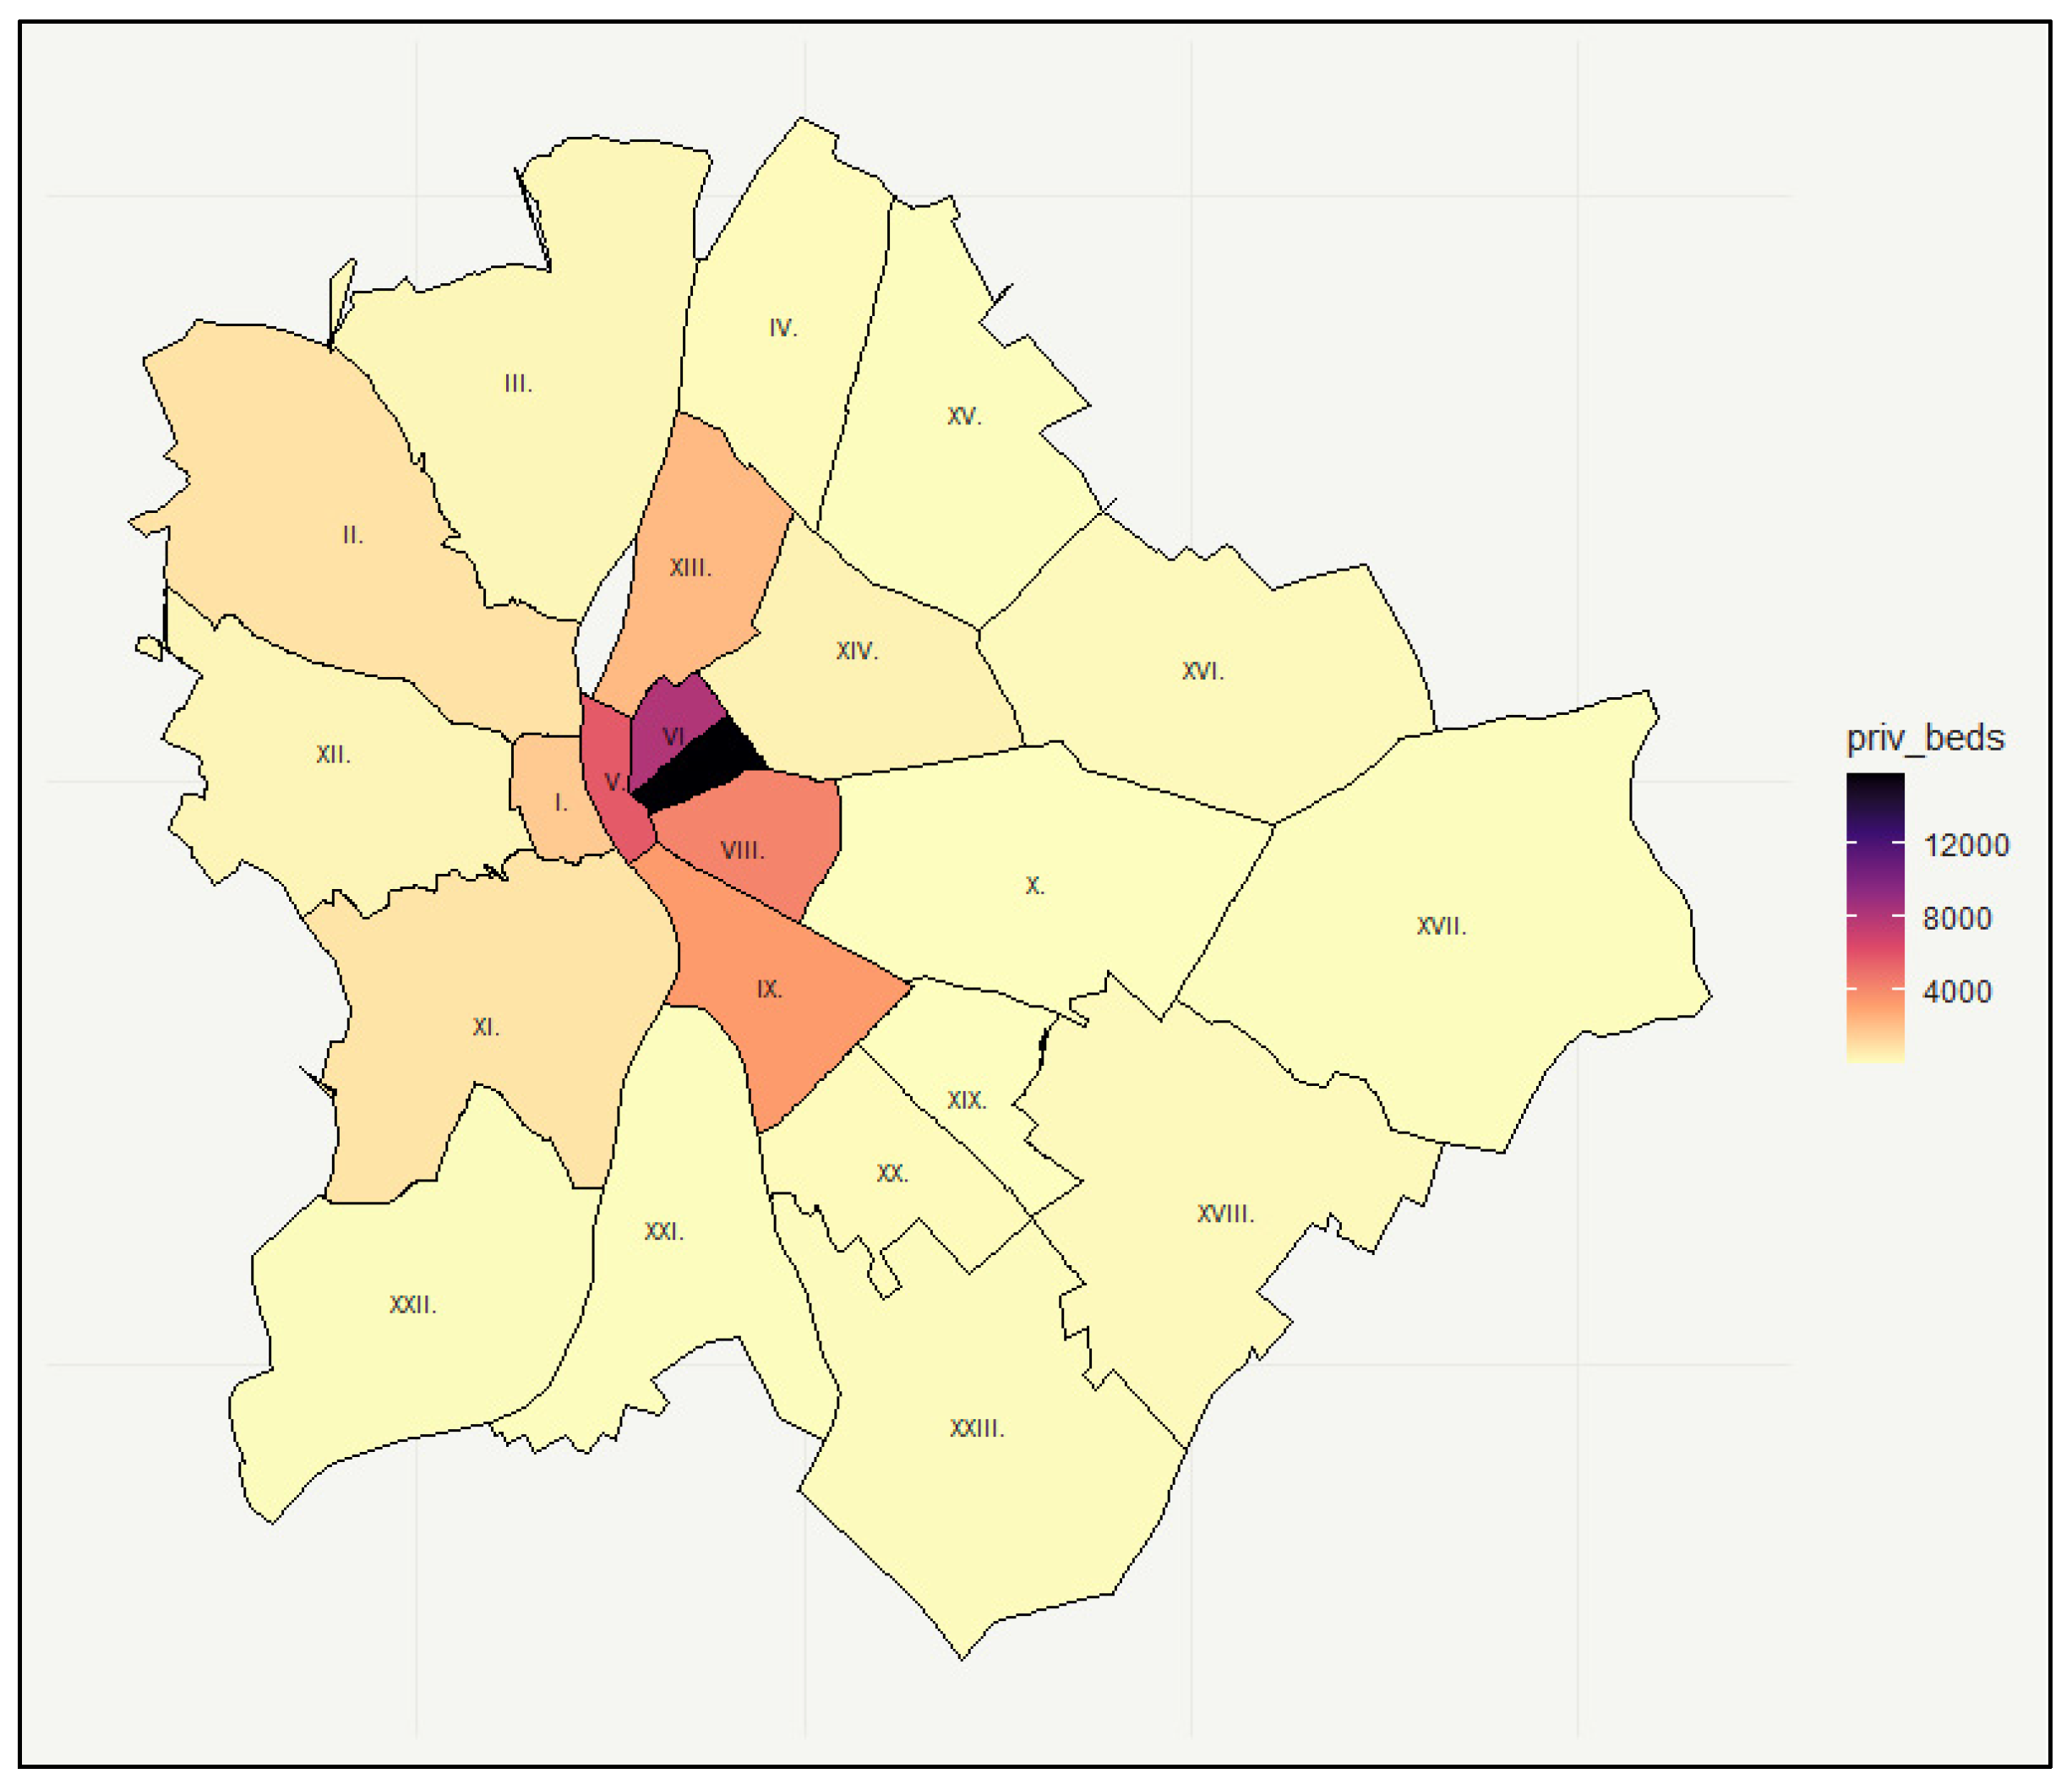
4.2.2. Sharing Economy: Airbnb

Peeters et al. [40] also suggested monitoring the number of Airbnb offerings in the destination since this might be an indicator of overtourism (e.g., in the form of uncontrolled offerings in destinations, or their uncontrolled growth). Figure 5 presents the number of offerings in private accommodation (including Airbnb) by district.
Figure 5 shows that private accommodation is highly concentrated in the center of Budapest (formed by districts I, V, VI, VII, and VIII). Indeed, this zone concentrates 79.1% of the total offerings of the city. It also shows that nearby districts were also affected, such as districts II, IX, XI, and XIII.

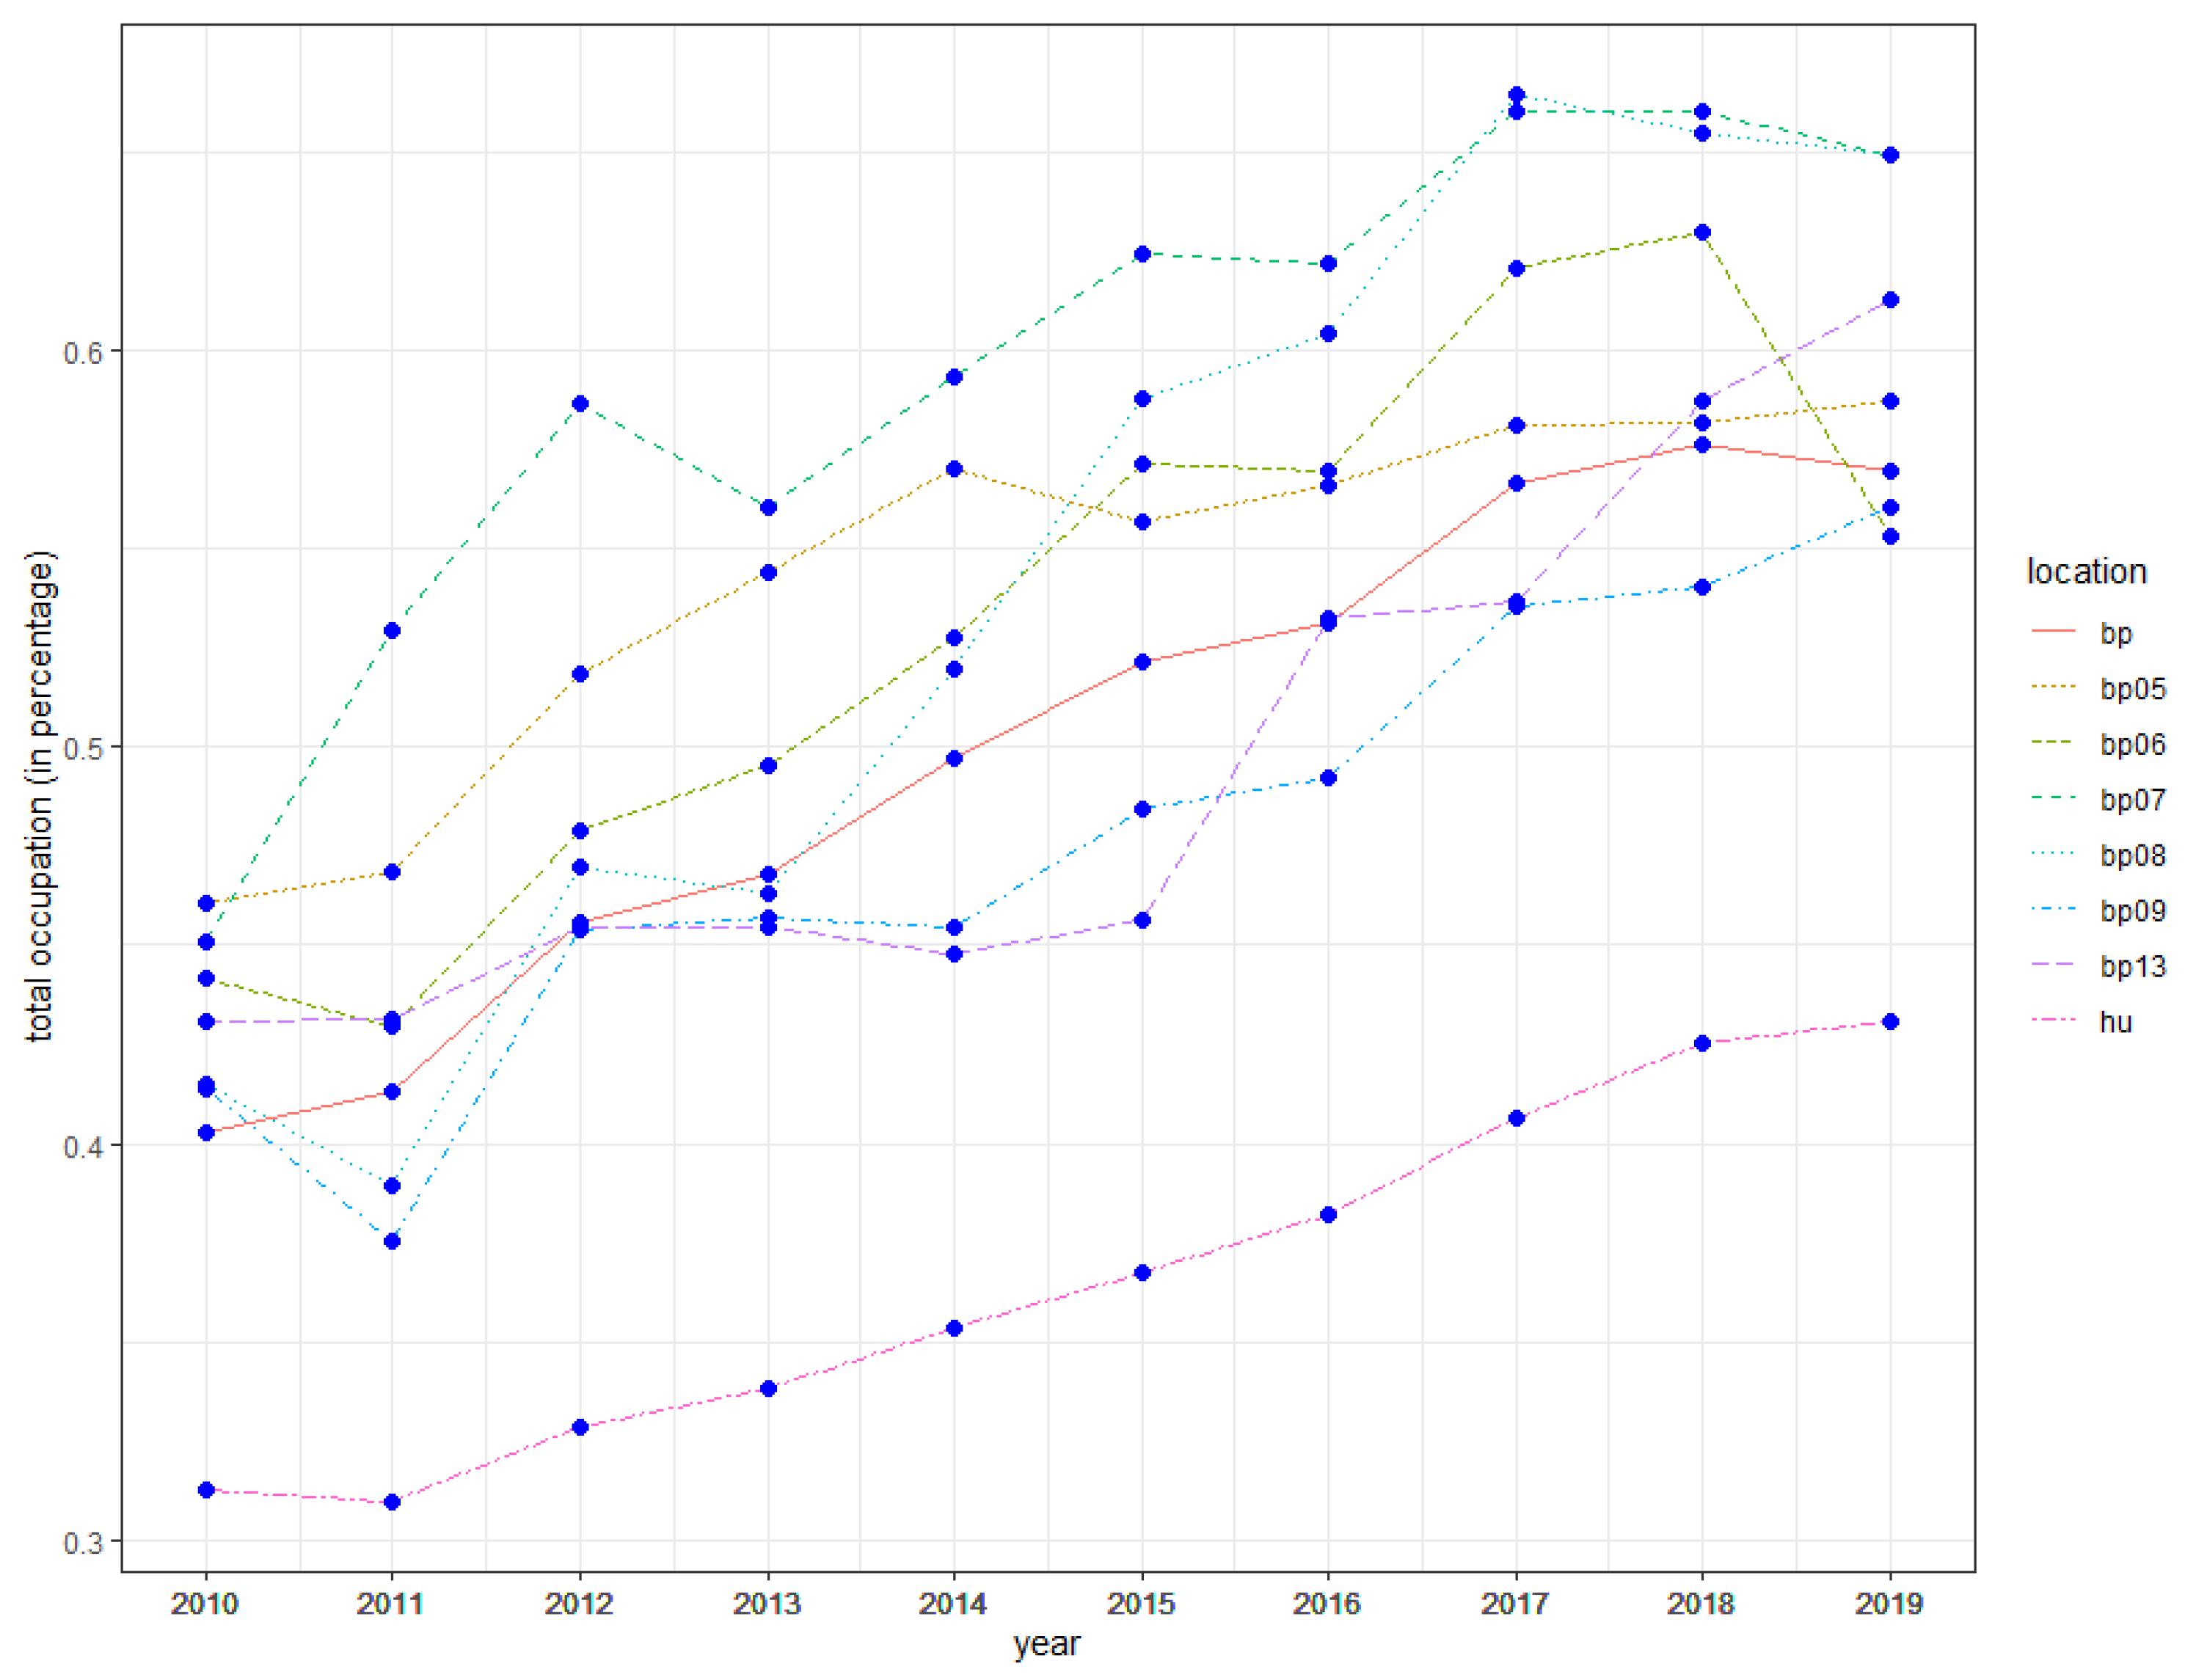
4.2.3. Total Occupation in Hotels

The last indicator, as exemplified by Figure 6, illustrates the historical evolution of the total occupation of hotels (from 2010 to 2019).
The figure displays the information at various geographical levels. At the national level, denoted as ‘hu’, the occupation rate in hotels increased by 37.7% (up from 31.3% in 2010 to 43.1% in 2019). In Budapest, denoted as ‘bp,’ the rate increased by 41.2% (from 40.3% in 2010 to 56.9% in 2019). However, at the district level the occupation rate increased unevenly. For instance, consider two districts located in the center of Budapest: in District VI, the occupation rate increased by 25.1% (from 44.2% in 2010 to 55.3% in 2019), while in District VIII the rate was 56.6% (from 41.5% in 2010 to 64.9% in 2019). Based on Figure 6, we conclude that the hotel occupation rate in Budapest displayed a robust increasing trend in the 2010s, and the rates for inner districts reached a high value by the end of the decade.

4.3. Estimation of Tourist Carrying Capacity

This section presents the first attempt to identify the optimal number of tourists in Budapest using an unconventional optimization method called FLP. The FLP problem can be formulated as
maximize z ˜ c ˜ x s . t . A ˜ x b ˜ x 0
where x = ( TH , TO , TP ) T represents three types of tourists visiting Budapest: tourists staying in hotels (TH), tourists staying in other types of commercial accommodation excluding hotels (TO), and tourists staying in private accommodation (TP). The vector c ˜ T = ( c ˜ 1 , c ˜ 2 , c ˜ 3 ) T represents the economic benefit per day generated by each type of tourist. To capture the uncertainty associated with these values we use fuzzy numbers:
c ˜ 1 = ( 25,200 ;   28,000 ;   30,800 ) , c ˜ 2 = ( 18,900 ;   21,000 ;   23,100 ) , c ˜ 3 = ( 22,050 ;   24,500 ;   26,950 )
The limitations of the city, represented by A ˜ x b ˜ , have been selected based on the available information. Table 4 summarizes the selected constraints.
Table 4 presents some limitations of the city in terms of tourism. The first three constraints are associated with the capacity of the city in terms of accommodation. This study considers three types of accommodation: commercial accommodation in hotels, commercial accommodation excluding hotels, and private accommodation (including Airbnb). The fourth constraint shows the most frequently used forms of public transportation in the city: buses, trams, trolleybuses, and subway lines. The fifth constraint is related to the capacity of the Hungarian Parliament Building, which is considered one of the most scenic buildings in Budapest, and it symbolizes Hungary itself [79]. The following constraints are associated with two attractive places in the city: the Széchenyi and Gellért thermal baths. Typically, 90% of visitors who purchase daily tickets to these baths are foreign tourists [80]. Finally, the last constraint is related to an environmental aspect of the city in terms of waste production.
Table 4 also displays the utilization rates considering our three types of tourists: TH, TO, and TP. The utilization rates associated with tourist attractions (the Hungarian Parliament Building, and the Széchenyi and Gellért thermal baths) were estimated using a survey. We distributed a survey among Hungarian experts in the field of tourism [questionnaire in the Supplementary Material]. The survey contains four questions. For each question we asked for an approximation of the minimum, central, and maximum value. After the responses were collected, we calculated the means of the latter estimations. The resulting mean values were entered into the model through the following fuzzy numbers:
a ˜ 51 = ( 0.31 ; 0.41 ; 0.50 ) ,   a ˜ 61 = ( 0.20 ; 0.30 ; 0.40 ) ,   a ˜ 71 = ( 0.20 ; 0.30 ; 0.40 ) ,   a ˜ 81 = ( 0.8 ; 1.1 ; 1.4 )
a ˜ 52 = ( 0.28 ; 0.39 ; 0.50 ) ,   a ˜ 62 = ( 0.16 ; 0.28 ; 0.39 ) ,   a ˜ 72 = ( 0.16 ; 0.28 ; 0.39 ) ,   a ˜ 82 = ( 0.7 ; 1.0 ; 1.4 )
a ˜ 53 = ( 0.30 ; 0.43 ; 0.55 ) ,   a ˜ 63 = ( 0.20 ; 0.31 ; 0.42 ) ,   a ˜ 73 = ( 0.20 ; 0.31 ; 0.42 ) ,   a ˜ 83 = ( 0.7 ; 1.0 ; 1.3 )
The last column in Table 4 shows the elements of vector b ˜ = ( b ˜ 1 , , b ˜ 8 ) T . The fuzzy numbers, b ˜ i s , were created in line with the following intuitive idea: consider the maximum daily capacity associated with the first constraint, b ˜ 1 . From HCSO, we know that the maximum number of bed places in hotels is 45,546. Based on this value, we created the fuzzy number (36,892; 40,991; 45,546), which indicates that the desirable number of occupied bed places in hotels is 90% of the maximum capacity (a value of 40,991), the minimum corresponds to 80% of maximum capacity (36,892), and the maximum represents 100% of maximum capacity (45,546). Using the same idea, we created the fuzzy numbers:
b ˜ 1 = ( 36,892 ; 40,991 ; 45,546 ) ,   b ˜ 5 = ( 2734 ; 3038 ; 3375 ) ,   b ˜ 8 = ( 40,500 ; 45,000 ; 50,000 )
b ˜ 2 = ( 5311 ; 5901 ; 6557 ) ,   b ˜ 6 = ( 6184 ; 6872 ; 7635 )
b ˜ 3 = ( 36 , 357 ; 40 , 397 ; 44 , 885 ) ,   b ˜ 7 = ( 2809 ; 3121 ; 3468 )
The fourth fuzzy number, b ˜ 4 , was created slightly differently. In this case, b ˜ 4 represents the proportion of public transportation in Budapest (buses, trams, trolleybuses, and subway trips) associated with tourists. To our knowledge, there is no such information; thus, we asked experts to provide an approximation [questionnaire in the Supplementary Material]. According to the experts, the approximate proportion of public transportation accounted for by tourists in Budapest ranges from 7.3% to 18.8% of maximum daily capacity. Finally, based on the information provided by BKK Zrt., the estimated maximum daily capacity of public transportation in Budapest is 3,898,800 places, yielding the fuzzy number b ˜ 4 = (304,106; 518,540; 732,974).
The solution of the FLP problem (2) was generated using the package FuzzyLP implemented in R [81,82]. Since the solution requires the use of ranking functions, we considered the following ones:
Yager s   F 1   function :   R ( a ˜ ) = 1 3 · [ ( a R ) 2 ( a L ) 2 ] + ( R 2 L 2 ) + ( R a R L a L ) ( a R a L ) + ( R L )
Yager s   F 3   function :   R ( a ˜ ) = L + a L + a R + R 4
where a ˜ = ( a L , a R , L , R ) is a trapezoidal fuzzy number, being L < a L < a R < R real numbers.
Before introducing the results of our model, we reviewed the official information provided by HSCO. According to this institution, in total 5,694,027 tourists visited Budapest in 2019, staying at one of our three types of accommodation (TH, TO, or TP). This means that approximately 15,600 tourists visited the city per day (omitting the seasonality factor). Of these 15,600 tourists, approximately 11,269 (72.24%) stayed in hotels (TH); 1,378 (8.83%) stayed in other types of commercial accommodation excluding hotels (TO); and 2953 (18.93%) tourists stayed in private accommodation (TP).
Table 5 presents the estimation of the maximum number of tourists in Budapest using FLP. Considering our current information, the model suggests that the optimal number of visitors staying in hotels in Budapest is 7560 (right-hand side of Table 5) per day. Furthermore, we conducted a simulation study to explore under which circumstances it may be possible to accept more types of tourists into the city. Table 5 also displays the result of two selected simulations. In both cases, we modified the utilization rates associated with tourist attractions (the Hungarian Parliament Building, and the Széchenyi and Gellért baths), affecting three out of eight constraints of the model. The simulated utilization rates reported in Simulation 1 yield the optimal number of visitors: 9026 tourists staying in hotels, and 2643 tourists staying in other types of commercial accommodation. Similarly, the simulated utilization rates reported in Simulation 2 yield the optimal number of visitors per day: 8103 tourists staying in hotels, 5923 tourists staying in another type of commercial accommodation, and 991 tourists staying in private accommodation.
The challenging problem of defining the optimal number of tourists in Budapest seems to be complex. In this section, we have made a first attempt to solve this problem using FLP.

5. Discussion and Conclusions

An initial objective of the study was to examine how the selected urban destination is affected by overtourism. First, the authors discussed the factors that caused overtourism in Budapest and presented the evolution of the marketing strategy in Budapest from the early 1990s to 2018 that resulted in unsustainable tourism in the city, associated with an ambiguous brand that focused on party tourism and cheap alcoholic beverages.
Second, the presence of tourists was estimated based on indicators such as tourism density and tourism intensity, the number of offerings in private accommodation, and total occupation in hotels. The calculation of tourism density and intensity at the district level revealed the uneven distribution of the former in the city. The center of Budapest (formed by districts I, V, VI, VII, VIII, and IX) was most affected by the presence of tourists in terms of the number of tourists per square kilometer and the number of tourists per resident. In contrast, districts XVI, XVII, XVIII, XXI, and XXII, which are physically far from the center, were less affected. This finding is consistent with that of Koens et al. [14], who stated that the impact of overtourism was not city-wide and could predominantly be observed in the more popular parts of the city. In the context of Budapest, Remenyik et al. [6] detected the rapid development of tourism in all 23 districts, with the downtown districts most affected. In this area, the mass of tourists and their behavior reached intolerable levels for locals.
Another important finding is related to accommodation. The number of offers of private accommodation, including Airbnb, is highly concentrated in the center of Budapest (districts I, V, VI, VII, and VIII). According to our calculations, this zone concentrated 79.1% of all offerings. This fact might partly explain the phenomenon of overtourism in these districts. This outcome was reported by Smith et al. [7], who highlighted the highest density of Airbnb accommodation in District VII and its neighboring districts.
In reviewing the literature, no data was found in relation to determining the sustainable number of visitors in Budapest. However, studies have noted the importance of defining the optimal number of tourists [15,16,43,45,46] in order to plan and manage their influx [41]. In the present study we have attempted to specify the optimal number of tourists in Budapest using an unconventional optimization method called FLP. The aim was to maximize the total revenue generated by tourists in Budapest considering a set of limitations associated with the city—specifically, in terms of accommodation, public transportation, tourist attractions (the Hungarian Parliament building, and the Széchenyi and Gellért thermal baths), and waste production. The results suggest that the optimal number of tourists per day is 7560 staying in hotels, compared to the actual, approximately 15 thousand in the peak year of 2019.
The major limitation of this approach is associated with the availability of data. Hence, we suggest incorporating additional information that was not available for the present study. For instance, this could include more types of tourists (e.g., one-day tourists or cruise tourists that transit along the Danube River), or more constraints (e.g., number of seating places available in restaurants, bars, cafes, pubs, number of available parking spaces, capacity in theaters or museums, and the like).
The complexity of the city environment demands that more attention be paid to estimating the optimal number of tourists in Budapest. One policy implication is that the implementation of a centralized system might contribute to the periodic collection of the information required for analysis. The use of technologies can be helpful in the data collection process. For example, Camatti et al. [15] proposed employing new sources of data, including sensors, telecommunication data, cameras, and data from connected objects, for constructing new indicators. Pásková et al. noted that the utilization of TCC could be facilitated by recent advances in tourism studies and information technologies—namely, in the fields of big data collection, advanced data analysis, and modeling [17]. Another policy recommendation is monitoring the places visited by tourists in Budapest using different technologies. This information could be useful for thoroughly evaluating the phenomenon of overtourism in the city.
The data-driven management of visitors may be appropriate for regulating the tourist flows, local traffic, and housing sector. The regulation of private accommodation offers is seen as a significant means of alleviating the situation of overtourism in the downtown area of Budapest. We encourage the local authorities to implement more sustainable tourism strategies and policies by restricting Airbnb apartments in Districts V, VI, and VII, but encouraging their operation in Districts VIII, IX, and XI, and other places, as well as opening new hotels and other types of commercial accommodation on the periphery of the city. Overall, visitors should be dispersed to the less crowded districts of the capital. Thereby, the heterogeneous character of overtourism in Budapest calls for a careful investigation of this phenomenon at the district level.
In agreement with Koens et al. [14], we conclude that overtourism cannot be alleviated by focusing on tourism alone, insofar as the wider usage of the city should be considered. With the help of the insight and knowledge obtained from the application of unconventional analytical methodology, local authorities would be able to better monitor their policy responses and improve the urban infrastructure—for example, by promoting alternative routes and attractions on the city outskirts. Increasing cooperation between multiple city departments and other stakeholders, including residents, is also advised.

Supplementary Materials

The following are available online at https://www.mdpi.com/article/10.3390/su14042268/s1: Table S1, Tourism density and intensity in Budapest and its districts, 2019. Questionnaire S1, Survey for experts.

Author Contributions

Conceptualization, S.S.S., B.P.G. and G.M.; methodology, V.S. and B.P.G.; code preparation and formal analysis, B.P.G.; investigation, V.S., S.S.S., B.P.G., G.M. and D.B.; resources, G.M., V.S., S.S.S., B.P.G. and D.B.; writing—original draft preparation, V.S., S.S.S., B.P.G. and D.B.; writing—review and editing, V.S., G.M., S.S.S., B.P.G. and D.B.; visualization, B.P.G.; supervision, S.S.S., B.P.G. and G.M.; project administration, S.S.S. All authors have read and agreed to the published version of the manuscript.

Funding

V.S. would like to thank the National Bank of Hungary for financial support under the Research Excellence Award. S.S.S. and B.P.G. are obliged to Project No. TKP2020-NKA-02 that was implemented with support from the National Research, Development, and Innovation Fund of Hungary, financed under the Thematic Excellence Programme funding scheme. The contribution of G.M. is supported by the OTKA K134877 project. S.S.S. and B.P.G. also wish to acknowledge research support from the Corvinus Institute for Advanced Studies (CIAS). The dissemination of research outcomes was supported by The Hungarian Tourism Association Foundation.

Institutional Review Board Statement

Ethical review and approval were waived for this study since the survey used only collects opinions from experts. The participation in the survey was voluntary. All participants were informed about the anonymity and confidentiality of their answers. The survey was performed in compliance with the Helsinki Declaration guidelines and supervised by the Corvinus University of Budapest.

Informed Consent Statement

Not applicable.

Data Availability Statement

Data was requested from the Hungarian Central Statistical Office, website: https://www.ksh.hu/?lang=en (accessed on 20 January 2022). BKK Centre for Budapest Transport, website: https://bkk.hu/en/. Budapest Spas cPlc., (accessed on 20 January 2022). Budapest Spas cPlc., website: https://www.spasbudapest.com/ (accessed on 20 January 2022). Office of the Hungarian National Assembly, website: https://www.parlament.hu/web/visitors/contact-us (accessed on 20 January 2022).

Conflicts of Interest

The authors declare no conflict of interest.

References

  1. Best Places to Travel in 2019. Available online: http://www.europeanbestdestinations.com/european-best-destinations-2019/ (accessed on 27 January 2022).
  2. Butler, A. These Are the Best-Value Destinations for an Affordable Adventure in 2020. Available online: https://www.lonelyplanet.com/articles/affordable-destinations-best-in-travel (accessed on 27 January 2022).
  3. Kovács, Z. Year in Review: Hungary’s Tourism Industry Had a Booming Year. Available online: https://abouthungary.hu//blog/2019-year-in-review-hungarys-tourism-industry-had-a-booming-year (accessed on 27 January 2022).
  4. Hungarian Tourism Agency. Report on the Record Year. Tourism in Hungary. 2019. Available online: https://mtu.gov.hu/documents/prod/Report-on-the-record-year-2019..pdf (accessed on 27 January 2022).
  5. Lock, S. European Cities Ranked Worst for Over-Tourism 2017. Available online: https://www.statista.com/statistics/778687/overtourism-worst-european-cities/ (accessed on 27 January 2022).
  6. Remenyik, B.; Barcza, A.; Csapó, J.; Szabó, B.; Fodor, G.; Dávid, L.D. Overtourism in Budapest: Analysis of Spatial Process and Suggested Solutions. Reg. Stat. 2021, 11, 179–197. [Google Scholar] [CrossRef]
  7. Smith, M.K.; Egedy, T.; Csizmady, A.; Jancsik, A.; Olt, G.; Michalkó, G. Non-Planning and Tourism Consumption in Budapest’s Inner City. Tour. Geogr. 2018, 20, 524–548. [Google Scholar] [CrossRef]
  8. Smith, M.; Puczkó, L.; Rátz, T. Twenty-Three districts in search of a city: Budapest—The capitaless capital? In City Tourism: National Capital Perspectives; Maitland, R., Ritchie, B.W., Eds.; CABI: Wallingford, UK, 2009; pp. 201–213. ISBN 9781845935467. [Google Scholar]
  9. Smith, M.K.; Sziva, I.P.; Olt, G. Overtourism and Resident Resistance in Budapest. Tour. Plan. Dev. 2019, 16, 376–392. [Google Scholar] [CrossRef]
  10. Miskolczi, M.; Jászberényi, M.; Munkácsy, A.; Nagy, D. Accessibility of Major Central and Eastern European Cities in Danube Cruise Tourism. Deturope 2020, 12, 133–150. [Google Scholar]
  11. Pinke-Sziva, I.; Smith, M.; Olt, G.; Berezvai, Z. Overtourism and the Night-Time Economy: A Case Study of Budapest. Int. J. Tour. Cities 2019, 5, 1–16. [Google Scholar] [CrossRef]
  12. Michalkó, G. Social and Geographical Aspects of Tourism in Budapest. Eur. Spat. Res. Policy 2001, 8, 105–118. [Google Scholar]
  13. Khomsi, M.R.; Fernandez-Aubin, L.; Rabier, L. A Prospective Analysis of Overtourism in Montreal. J. Travel Tour. Mark. 2020, 37, 873–886. [Google Scholar] [CrossRef]
  14. Koens, K.; Postma, A.; Papp, B. Is Overtourism Overused? Understanding the Impact of Tourism in a City Context. Sustainability 2018, 10, 4384. [Google Scholar] [CrossRef] [Green Version]
  15. Camatti, N.; Bertocchi, D.; Carić, H.; van der Borg, J. A Digital Response System to Mitigate Overtourism. The Case of Dubrovnik. J. Travel Tour. Mark. 2020, 37, 887–901. [Google Scholar] [CrossRef]
  16. Bertocchi, D.; Camatti, N.; Giove, S.; van der Borg, J. Venice and Overtourism: Simulating Sustainable Development Scenarios through a Tourism Carrying Capacity Model. Sustainability 2020, 12, 512. [Google Scholar] [CrossRef] [Green Version]
  17. Pásková, M.; Wall, G.; Zejda, D.; Zelenka, J. Tourism Carrying Capacity Reconceptualization: Modelling and Management of Destinations. J. Destin. Mark. Manag. 2021, 21, 100638. [Google Scholar] [CrossRef]
  18. Mexa, A.; Coccossis, H. Tourism carrying capacity: A theoretical overview. In The Challenge of Tourism Carrying Capacity Assessment: Theory and Practice; Coccossis, H., Mexa, A., Eds.; Ashgate Publishing: Aldershot, UK, 2004; pp. 37–54. ISBN 9780754635697. [Google Scholar]
  19. World Tourism Organization (UNWTO). International Tourism Highlights, 2020 ed.; World Tourism Organization (UNWTO): Madrid, Spain, 2021; ISBN 9789284422456. [Google Scholar]
  20. Yuval, F. To Compete or Cooperate? Intermunicipal Management of Overtourism. J. Travel Res. 2021, 00472875211025088. [Google Scholar] [CrossRef]
  21. Wagar, J.A. The Carrying Capacity of Wild Lands for Recreation. For. Sci. 1964, 10, a0001-24. [Google Scholar] [CrossRef]
  22. Plog, S.C. Why Destination Areas Rise and Fall in Popularity. Cornell Hotel Restaur. Adm. Q. 1974, 14, 55–58. [Google Scholar] [CrossRef]
  23. Emerson, R.M. Social Exchange Theory. Annu. Rev. Sociol. 1976, 2, 335–362. [Google Scholar] [CrossRef]
  24. Boissevain, J. Tourism and Development in Malta. Dev. Change 1977, 8, 523–538. [Google Scholar] [CrossRef]
  25. Williams, T.A. Impact of Domestic Tourism on Host Population. Tour. Recreat. Res. 1979, 4, 15–21. [Google Scholar] [CrossRef]
  26. Butler, R.W. The Concept of a Tourist Area Cycle of Evolution: Implications for Management of Resources. Can. Geogr. Géographe Can. 1980, 24, 5–12. [Google Scholar] [CrossRef]
  27. World Tourism Organization (UNWTO); Centre of Expertise Leisure, Tourism & Hospitality; NHTV Breda University of Applied Sciences; NHL Stenden University of Applied Sciences. ‘Overtourism’?—Understanding and Managing Urban Tourism Growth beyond Perceptions, Executive Summary; UNWTO: Madrid, Spain, 2018. [Google Scholar] [CrossRef]
  28. Bock, K. The Changing Nature of City Tourism and Its Possible Implications for the Future of Cities. Eur. J. Futur. Res. 2015, 3, 20. [Google Scholar] [CrossRef] [Green Version]
  29. Mihalic, T. Conceptualising Overtourism: A Sustainability Approach. Ann. Tour. Res. 2020, 84, 103025. [Google Scholar] [CrossRef]
  30. Szromek, A.R.; Kruczek, Z.; Walas, B. The Attitude of Tourist Destination Residents towards the Effects of Overtourism—Kraków Case Study. Sustainability 2020, 12, 228. [Google Scholar] [CrossRef] [Green Version]
  31. Wilhelmsson, M.; Ismail, M.; Warsame, A. Gentrification Effects on Housing Prices in Neighbouring Areas. Int. J. Hous. Mark. Anal. 2021. ahead-of-print. [Google Scholar] [CrossRef]
  32. Celata, F.; Romano, A. Overtourism and Online Short-Term Rental Platforms in Italian Cities. J. Sustain. Tour. 2020, 1–20. [Google Scholar] [CrossRef]
  33. Casagrande, M. Heritage, Tourism, and Demography in the Island City of Venice: Depopulation and Heritagisation. Urban Isl. Stud. 2016, 2, 121–141. [Google Scholar] [CrossRef]
  34. Fontanari, M.; Traskevich, A. Consensus and Diversity Regarding Overtourism: The Delphi-Study and Derived Assumptions for the Post-COVID-19 Time. Int. J. Tour. Policy 2021, 11, 161–187. [Google Scholar] [CrossRef]
  35. Szromek, A.R.; Hysa, B.; Karasek, A. The Perception of Overtourism from the Perspective of Different Generations. Sustainability 2019, 11, 7151. [Google Scholar] [CrossRef] [Green Version]
  36. Sunlu, U. Environmental impacts of tourism. In Local Resources and Global Trades: Environments and Agriculture in the Mediterranean Region; Camarda, D., Grassini, L., Eds.; CIHEAM: Bari, Italy, 2003; pp. 263–270. [Google Scholar]
  37. Atzori, R. Destination Stakeholders’ Perceptions of Overtourism Impacts, Causes, and Responses: The Case of Big Sur, California. J. Destin. Mark. Manag. 2020, 17, 100440. [Google Scholar] [CrossRef]
  38. Frey, B.S.; Briviba, A. Revived Originals—A Proposal to Deal with Cultural Overtourism. Tour. Econ. 2021, 27, 1221–1236. [Google Scholar] [CrossRef]
  39. Simancas Cruz, M.; Peñarrubia Zaragoza, M.P. Analysis of the Accommodation Density in Coastal Tourism Areas of Insular Destinations from the Perspective of Overtourism. Sustainability 2019, 11, 3031. [Google Scholar] [CrossRef] [Green Version]
  40. Peeters, P.; Gössling, S.; Klijs, J.; Milano, C.; Novelli, M.; Dijkmans, C.; Eijgelaar, E.; Hartman, S.; Heslinga, J.; Isaac, R.; et al. Research for TRAN Committee—Overtourism: Impact and Possible Policy Responses; European Parliament, Policy Department for Structural and Cohesion Policies: Brussels, Belgium, 2018. [Google Scholar]
  41. Coccossis, H.; Mea, A.; Collovini, A.; Parpairi, A. Defining, Measuring and Evaluating Carrying Capacity in European Tourism Destination; University of the Aegean: Lesvos, Greece, 2000. [Google Scholar]
  42. Tanguay, G.A.; Rajaonson, J.; Therrien, M.-C. Sustainable Tourism Indicators: Selection Criteria for Policy Implementation and Scientific Recognition. J. Sustain. Tour. 2013, 21, 862–879. [Google Scholar] [CrossRef] [Green Version]
  43. Navarro Jurado, E.; Damian, I.M.; Fernández-Morales, A. Carriying Capacity Model Applied in Coastal Destinations. Ann. Tour. Res. 2013, 43, 1–19. [Google Scholar] [CrossRef]
  44. World Tourism Organization (UNWTO). Tourist Makerts, Promotion and Marketing, Saturation of Tourist Destinations; World Tourism Organization (UNWTO): Rome, Italy, 1981. [Google Scholar]
  45. Canestrelli, E.; Costa, P. Tourist Carrying Capacity. Ann. Tour. Res. 1991, 18, 295–311. [Google Scholar] [CrossRef]
  46. Feliziani, V.; Miarelli, M. How Many Visitors Should There Be in the City? The Case of Rome. Rev. Eur. Stud. 2012, 4, 179–187. [Google Scholar] [CrossRef] [Green Version]
  47. Costa, P.; van der Borg, J. Un Modello Lineare per La Programmazione De1 Turismo. CoSES Inf. 1988, 18, 21–26. [Google Scholar]
  48. Liberatore, G.; Biagioni, P.; Talia, V.; Francini, C. Overtourism in Cities of Art: A Framework for Measuring Tourism Carrying Capacity. SSRN Electron. J. 2019, 1–28. [Google Scholar] [CrossRef]
  49. McCool, S.F.; Lime, D.W. Tourism Carrying Capacity: Tempting Fantasy or Useful Reality? J. Sustain. Tour. 2001, 9, 372–388. [Google Scholar] [CrossRef]
  50. Marsiglio, S. On the Carrying Capacity and the Optimal Number of Visitors in Tourism Destinations. Tour. Econ. 2017, 23, 632–646. [Google Scholar] [CrossRef] [Green Version]
  51. Wang, J.; Huang, X.; Gong, Z.; Cao, K. Dynamic Assessment of Tourism Carrying Capacity and Its Impacts on Tourism Economic Growth in Urban Tourism Destinations in China. J. Destin. Mark. Manag. 2020, 15, 100383. [Google Scholar] [CrossRef]
  52. Lu, J.; Nepal, S.K. Sustainable Tourism Research: An Analysis of Papers Published in the Journal of Sustainable Tourism. J. Sustain. Tour. 2009, 17, 5–16. [Google Scholar] [CrossRef]
  53. Jick, T.D. Mixing Qualitative and Quantitative Methods: Triangulation in Action. Adm. Sci. Q. 1979, 24, 602. [Google Scholar] [CrossRef] [Green Version]
  54. Scandura, T.A.; Williams, E.A. Research Methodology in Management: Current Practices, Trends, and Implications for Future Research. Acad. Manage. J. 2000, 43, 1248–1264. [Google Scholar] [CrossRef] [Green Version]
  55. Decrop, A. Triangulation in Qualitative Tourism Research. Tour. Manag. 1999, 20, 157–161. [Google Scholar] [CrossRef]
  56. Koc, E.; Boz, H. Triangulation in Tourism Research: A Bibliometric Study of Top Three Tourism Journals. Tour. Manag. Perspect. 2014, 12, 9–14. [Google Scholar] [CrossRef]
  57. Oppermann, M. Triangulation? A Methodological Discussion. Int. J. Tour. Res. 2000, 2, 141–145. [Google Scholar] [CrossRef]
  58. Flick, U. Triangulation in Data Collection. In The SAGE Handbook of Qualitative Data Collection; SAGE Publications Ltd.: London, UK, 2018; pp. 527–544. [Google Scholar]
  59. Johnson, R.B.; Onwuegbuzie, A.J. Mixed-methods research: A research paradigm whose time has come. In Mixed-Methods; Bryman, A., Ed.; Sage Publications Ltd.: London, UK, 2006; Volume 2, pp. 3–24. [Google Scholar]
  60. Garrod, B. Exploring Place Perception a Photo-Based Analysis. Ann. Tour. Res. 2008, 35, 381–401. [Google Scholar] [CrossRef]
  61. Steen Jacobsen, J.K. Use of Landscape Perception Methods in Tourism Studies: A Review of Photo-Based Research Approaches. Tour. Geogr. 2007, 9, 234–253. [Google Scholar] [CrossRef]
  62. Jenkins, O.H. Understanding and Measuring Tourist Destination Images. Int. J. Tour. Res. 1999, 1, 1–15. [Google Scholar] [CrossRef]
  63. Nasseri, S.H.; Ebrahimnejad, A.; Cao, B.-Y. Fuzzy linear programming: Solution techniques and applications. In Studies in Fuzziness and Soft Computing; Springer: Cham, Switzerland, 2019; ISBN 9783030174217. [Google Scholar]
  64. Puczko, L.; Ratz, T.; Smith, M. Old City, New Image: Perception, Positioning and Promotion of Budapest. J. Travel Tour. Mark. 2007, 22, 21–34. [Google Scholar] [CrossRef]
  65. Smith, M.; Puczko, L. Out with the Old, in with the New? Twenty Years of Post-Socialist Marketing in Budapest. J. Town City Manag. 2010, 1, 288–299. [Google Scholar]
  66. Smith, M.; Puczkó, L. Budapest: From Socialist Heritage to Cultural Capital? Curr. Issues Tour. 2012, 15, 107–119. [Google Scholar] [CrossRef]
  67. Budapest Is the Cheapest European City Break Destination. Available online: https://www.argophilia.com/news/budapest-cheapest-destination/210019/ (accessed on 27 January 2022).
  68. Budapest the Cheapest City for Alcoholic Drinks. Available online: https://www.telegraph.co.uk/travel/destinations/europe/hungary/budapest/articles/Budapest-the-cheapest-city-for-alcoholic-drinks/ (accessed on 27 January 2022).
  69. Diebelius, G. Warsaw, Vilnius and Budapest Named Top Three Cheapest Destinations in Europe for a Getaway This Year. Mail Online. Available online: https://www.dailymail.co.uk/travel/travel_news/article-3500066/Warsaw-Vilnius-Budapest-named-cheapest-destinations-Europe-getaway-year.html (accessed on 27 January 2022).
  70. The City That Lives a Double Life. Available online: https://www.bbc.com/travel/article/20160831-the-city-that-lives-a-double-life (accessed on 27 January 2022).
  71. CheaPEST BudaPEST: Hungarian Capital among Cheapest European Cities, British Survey Shows. 2016. Available online: https://hungarytoday.hu/cheapest-budapest-hungarian-capital-cheapest-city-travel-barometer-90235/ (accessed on 27 January 2022).
  72. Sleepless Locals Tire of Budapest Party Paradise. Available online: https://www.ndtv.com/world-news/sleepless-locals-tire-of-budapest-party-paradise-1789785 (accessed on 27 January 2022).
  73. Budapest Listed as the Fifth Worst City for Over-Tourism in Europe. 2018. Available online: https://hungarytoday.hu/hungary-listed-as-the-fifth-worst-city-for-over-tourism-in-europe/ (accessed on 27 January 2022).
  74. New Record!—Budapest’s Tourism Is Better than Ever! Available online: https://dailynewshungary.com/new-record-budapests-tourism-is-better-than-ever/ (accessed on 27 January 2022).
  75. Should You Visit These Beautiful European Destinations Suffering from Overtourism? Available online: https://www.forbes.com/sites/ceciliarodriguez/2020/01/30/to-go-or-not-to-go-to-these-beautiful-european-places/ (accessed on 27 January 2022).
  76. Budapest Joins Anti-Airbnb Drive, Party District Goes on Alert. Available online: https://www.bloomberg.com/news/articles/2020-07-15/budapest-joins-anti-airbnb-drive-party-district-goes-on-alert (accessed on 27 January 2022).
  77. Budapest Passes New Restrictions on Airbnb Rentals and Nightlife in the City. Available online: https://www.travelandleisure.com/travel-news/budapest-airbnb-nightlife-overtourism-restrictions (accessed on 27 January 2022).
  78. Dudás, G.; Boros, L.; Kovalcsik, T.; Kovalcsik, B. The Visualization of the Spatiality of Airbnb in Budapest Using 3-Band Raster Representation. Geogr. Tech. 2017, 12, 23–30. [Google Scholar] [CrossRef]
  79. Técsi, Z.; Orczy, Z.; Naszradi-Mészáros, O. Csodálatos Budapest: Wonderful Budapest; Pannon-Literatúra Kft: Kisújszállás, Hungary, 2014; ISBN 9789632514291. [Google Scholar]
  80. Record Number of Visitors at Budapest Baths. Available online: https://www.budapestinfo.hu/record-number-of-visitors-at-budapest-baths (accessed on 27 January 2022).
  81. R Core Team. R: A Language and Environment for Statistical Computing: R Foundation for Statistical Computing, Vienna, Austria. 2020. Available online: http://www.R-project.org/ (accessed on 27 January 2022).
  82. Villacorta, P.J.; Rabelo, C.A.; Pelta, D.A.; Verdegay, J.L. FuzzyLP: An R package for solving fuzzy linear programming problems. In Granular, Soft and Fuzzy Approaches for Intelligent Systems; Kacprzyk, J., Filev, D., Beliakov, G., Eds.; Springer International Publishing: Cham, Switzerland, 2017; Volume 344, pp. 209–230. ISBN 9783319403120. [Google Scholar]
Figure 1. Main developments in the destination marketing strategy of Budapest. Source: Adapted from Ref. [66].
Sustainability 14 02268 g001
Figure 2. Online news about Budapest between 2013 and 2020. Sources: [67,68,69,70,71,72,73,74,75,76,77].
Sustainability 14 02268 g002
Figure 3. Impacts of overtourism in District VII, Budapest. (a) Overloaded garbage container; (b) dirty street; (c) overcrowding in Szimpla Garden (a ruin pub); and (d) overcrowding in Gozsdu Court. Source: Authors.
Sustainability 14 02268 g003aSustainability 14 02268 g003b
Figure 4. Tourism density and intensity by district: (a) tourism density by district; and (b) tourism intensity by district. Source: HCSO, calculations by authors.
Sustainability 14 02268 g004
Figure 5. Number of units of private accommodation (including Airbnb). Budapest and its districts in 2019. Source: HCSO, calculations by authors.
Sustainability 14 02268 g005
Figure 6. Occupation rate in hotels from 2010 to 2019. Source: HCSO, calculations by authors.
Sustainability 14 02268 g006
Table 1. Indicators of overtourism. Source: [40].
IndicatorDefinitionDescription
Tourism densityBed-nights/km2Annual number of bed-nights per km2
Tourism intensityBed-nights/residentAnnual number of bed-nights per resident in the destination
Sharing economy: AirbnbNumber of Airbnb offersNumber of Airbnb offers in a destination
Share of tourism contribution to GDP
Air transport intensityAir passengers/Bed-nightsRatio of the number of air passengers to the number of bed-nights
Closeness to airports
Closeness to cruise ports
World Heritage Sites closeness
Arrivals within 50 km
Number within 10 km
Number within 30 km
Table 2. Tourism density and intensity, Budapest and selected districts, 2019. Source: HCSO, calculations by authors.
RegionBed-Nights (Annual Number)Estimated Area (km2)Estimated Number of Residents *Tourism DensityTourism Intensity
(Bed-Nights/km2)(Bed-Nights/Resident)
Budapest1,405,548525.141,751,25126,765.208
District I837,9863.4125,181245,743.7033.3
District V2,688,1922.5925,9751,037,912.00103.5
District VI2,050,4512.3838,670861,534.0053
District VII2,758,5982.0951,8961,319,903.3053.2
District VIII1,240,0926.8576,784181,035.3016.2
* Resident population in the middle of the year.
Table 3. Percentiles for the 23 districts of Budapest, 2019. Source: HCSO, calculations by authors.
PercentileTourism Density
(Bed-Nights/km2)
DistrictsTourism Intensity
(Bed Nights/Resident)
Districts
1st65.3–709.4XVI, XVII, XVIII, XXI, XXII0–0.2XVI, XVII, XVIII, XXI, XXII
2nd709.4–6292.3XV, XIX, XX, XXIII0.2–2.3XV, XIX, XX, XXIII
3rd6292.3–13,855.3II, III, IV, X, XII2.3–4.0III, IV, X, XII, XIV
4th13,855.3–138,265.1IX, XI, XIII, XIV4.0–15.9II, IX, XI, XIII
5th138,265.1–1,319,903.3I, V, VI, VII, VIII15.9–103.5I, V, VI, VII, VIII
Table 4. Selected constraints for Budapest.
Tourism SystemDescriptionSourceUtilization RatesMaximum Daily Capacity
THTOTP
1Commercial accommodation: HotelsNumber of bed places in hotels (from 1 to 5 stars)HCSO100 b ˜ 1
2Commercial accommodation: Excluding hotelsNumber of bed places excluding hotelsHCSO010 b ˜ 2
3Private accommodationNumber of bed places in private accommodation (e.g., Airbnb platform, etc.)HCSO 001 b ˜ 3
4Public transportation (Buses, Trams, Trolleybuses and Subway)Daily maximum capacity for tourists (persons)BKK Zrt. and authors’ calculations111 b ˜ 4
5Tourist attractions (The Hungarian Parliament Building)Maximum capacity (persons)Tourism Departments, Office of the Hungarian National Assembly a ˜ 51 a ˜ 52 a ˜ 53 b ˜ 5
6Tourist attractions: (Széchenyi thermal bath)Maximum capacity (persons)Budapest Spas cPlc. a ˜ 61 a ˜ 62 a ˜ 63 a ˜ 6
7Tourist attractions (Gellért thermal bath)Maximum capacity (persons)Budapest Spas cPlc. a ˜ 71 a ˜ 72 a ˜ 73 b ˜ 7
8EnvironmentWaste production per person (in kilograms)HCSO and authors’ calculations a ˜ 81 a ˜ 82 a ˜ 83 b ˜ 8
Note: the acronym HCSO stands for Hungarian Central Statistical Office.
Table 5. Optimal number of tourists. Estimated result vs. Simulations.
Tourism System Utilization Rates: Estimated and via SimulationsOptimal Number of Tourists
THTOTPTHTOTP
Tourist attractions (The Hungarian Parliament Building)From experts(0.31; 0.40; 0.50)(0.28; 0.39; 0.50)(0.30; 0.42; 0.55)756000
Simulation 1(0.24; 0.28; 0.32)(0.16; 0.20; 0.24)(0.17; 0.24; 0.32)902626430
Simulation 2(0.16; 0.23; 0.30)(0.13; 0.17; 0.20)(0.15; 0.20; 0.25)81035923991
Tourist attractions (Services of baths: Széchenyi and Gellért)From experts(0.20; 0.30; 0.40)(0.16; 0.27; 0.39)(0.20; 0.31; 0.42)
Simulation 1(0.16; 0.23; 0.30)(0.38; 0.40; 0.41)(0.16; 0.23; 0.30)
Simulation 2(0.13; 0.17; 0.20)(0.18; 0.26; 0.35)(0.16; 0.23; 0.30)
Publisher’s Note: MDPI stays neutral with regard to jurisdictional claims in published maps and institutional affiliations.

