1. Introduction
Water utilities are always susceptible to the possibility of contamination in water distribution networks (WDNs). Although contamination does not occur frequently, it can potentially harm users in terms of public health, socio-economic status, and psychology [
1]. Typically, a contamination event in a WDN goes through the phases of contamination, sensing, warning, noticing, inspection, and recovery [
2]. Following a contamination event, water utilities should have prepared a response plan that addresses each phase to minimize consumer damage.
A contamination event begins with the intrusion of contaminants in the WDN. Contamination can be caused by accidents, such as aging pipes, poor connections, and breaks [
3]. Intentional contamination can also occur as a direct or cyber-physical attack on the network [
4]. The severity of the contaminant can range from red water from corrosion [
5] to the presence of pathogens [
6]. After the contaminant is noticed by the detection system (e.g., water quality sensors in supervisory control and data acquisition [SCADA] systems), warnings are promptly signaled for the water utilities to take action. During this warning phase, several actions can be performed simultaneously, including the termination of the water supply, sending warnings to users, and identification of the cause and location of the contamination intrusion. When the cause of contamination is found, the recovery phase begins.
The goal of the recovery phase is to return the network to normal conditions by repairing the contamination cause and flushing out the contaminated water from the system. Specifically, it must be performed in a rapid and nondetrimental manner on the flushing part. Flushing is considered appropriate for maintaining water quality in WDNs. Flushing includes the removal of accumulated silt and sediment from pipe networks. It reduces turbidity, restores disinfectant residuals, and improves microbial growth control [
7].
In the case of contamination, flushing is conducted to displace the contaminated water with clean water. Conventionally, hydrants are used for contamination flushing [
8]. The hydrant operation is performed by opening several hydrants in the network until the flushed water reaches an acceptable quality criterion (e.g., chemical quality, turbidity, or color). Considerable research has addressed the flushing technique regarding hydrant location and operation. Haxton and Uber [
9] proposed a method to identify the most effective hydrant locations in source uncertainties. Poulin et al. [
10] discussed a flushing procedure that implemented unidirectional flushing by sequentially isolating and flushing parts of the network. Shafiee and Zechman [
11] proposed a flushing strategy that included the choice of hydrants and a decision on its opening and closing times based on considerations of sociotechnical factors among users, such as demographic and communication. Another research by Shafiee and Zechman [
12] developed a decision-making approach that selected the best hydrant flushing strategies based on sensor-hydrant decision trees.
Hydrants are not located in every corner of the WDN. Depending on the network configuration and the spread of the contamination, there could be cases in which the hydrant cannot drain part of the network. An example of this case is for a dead-end node that does not have a hydrant. When hydrants are not available, household or public faucets can be used alternatively as outlets for contaminated water. Even with hydrant availability, after the flushed water is free of contaminants, the residential service line or household plumbing still contains contaminants, and households still need to flush their plumbing system following proper guidelines [
13].
With the growth of technology, emergency warnings can be broadcasted to mobile devices [
14]. In view of the massive number of cellular phone subscribers, 8.3 billion in 2019 [
15], information can be easily publicized. Recently, mobile alerting has been proven to effectively contain the spread of the COVID-19 in Taiwan [
16] and South Korea [
17]. During the warning phase of the contamination system, push messaging can be used to quickly alert everyone in the contaminated area to stop using water and convey additional mitigation guidance.
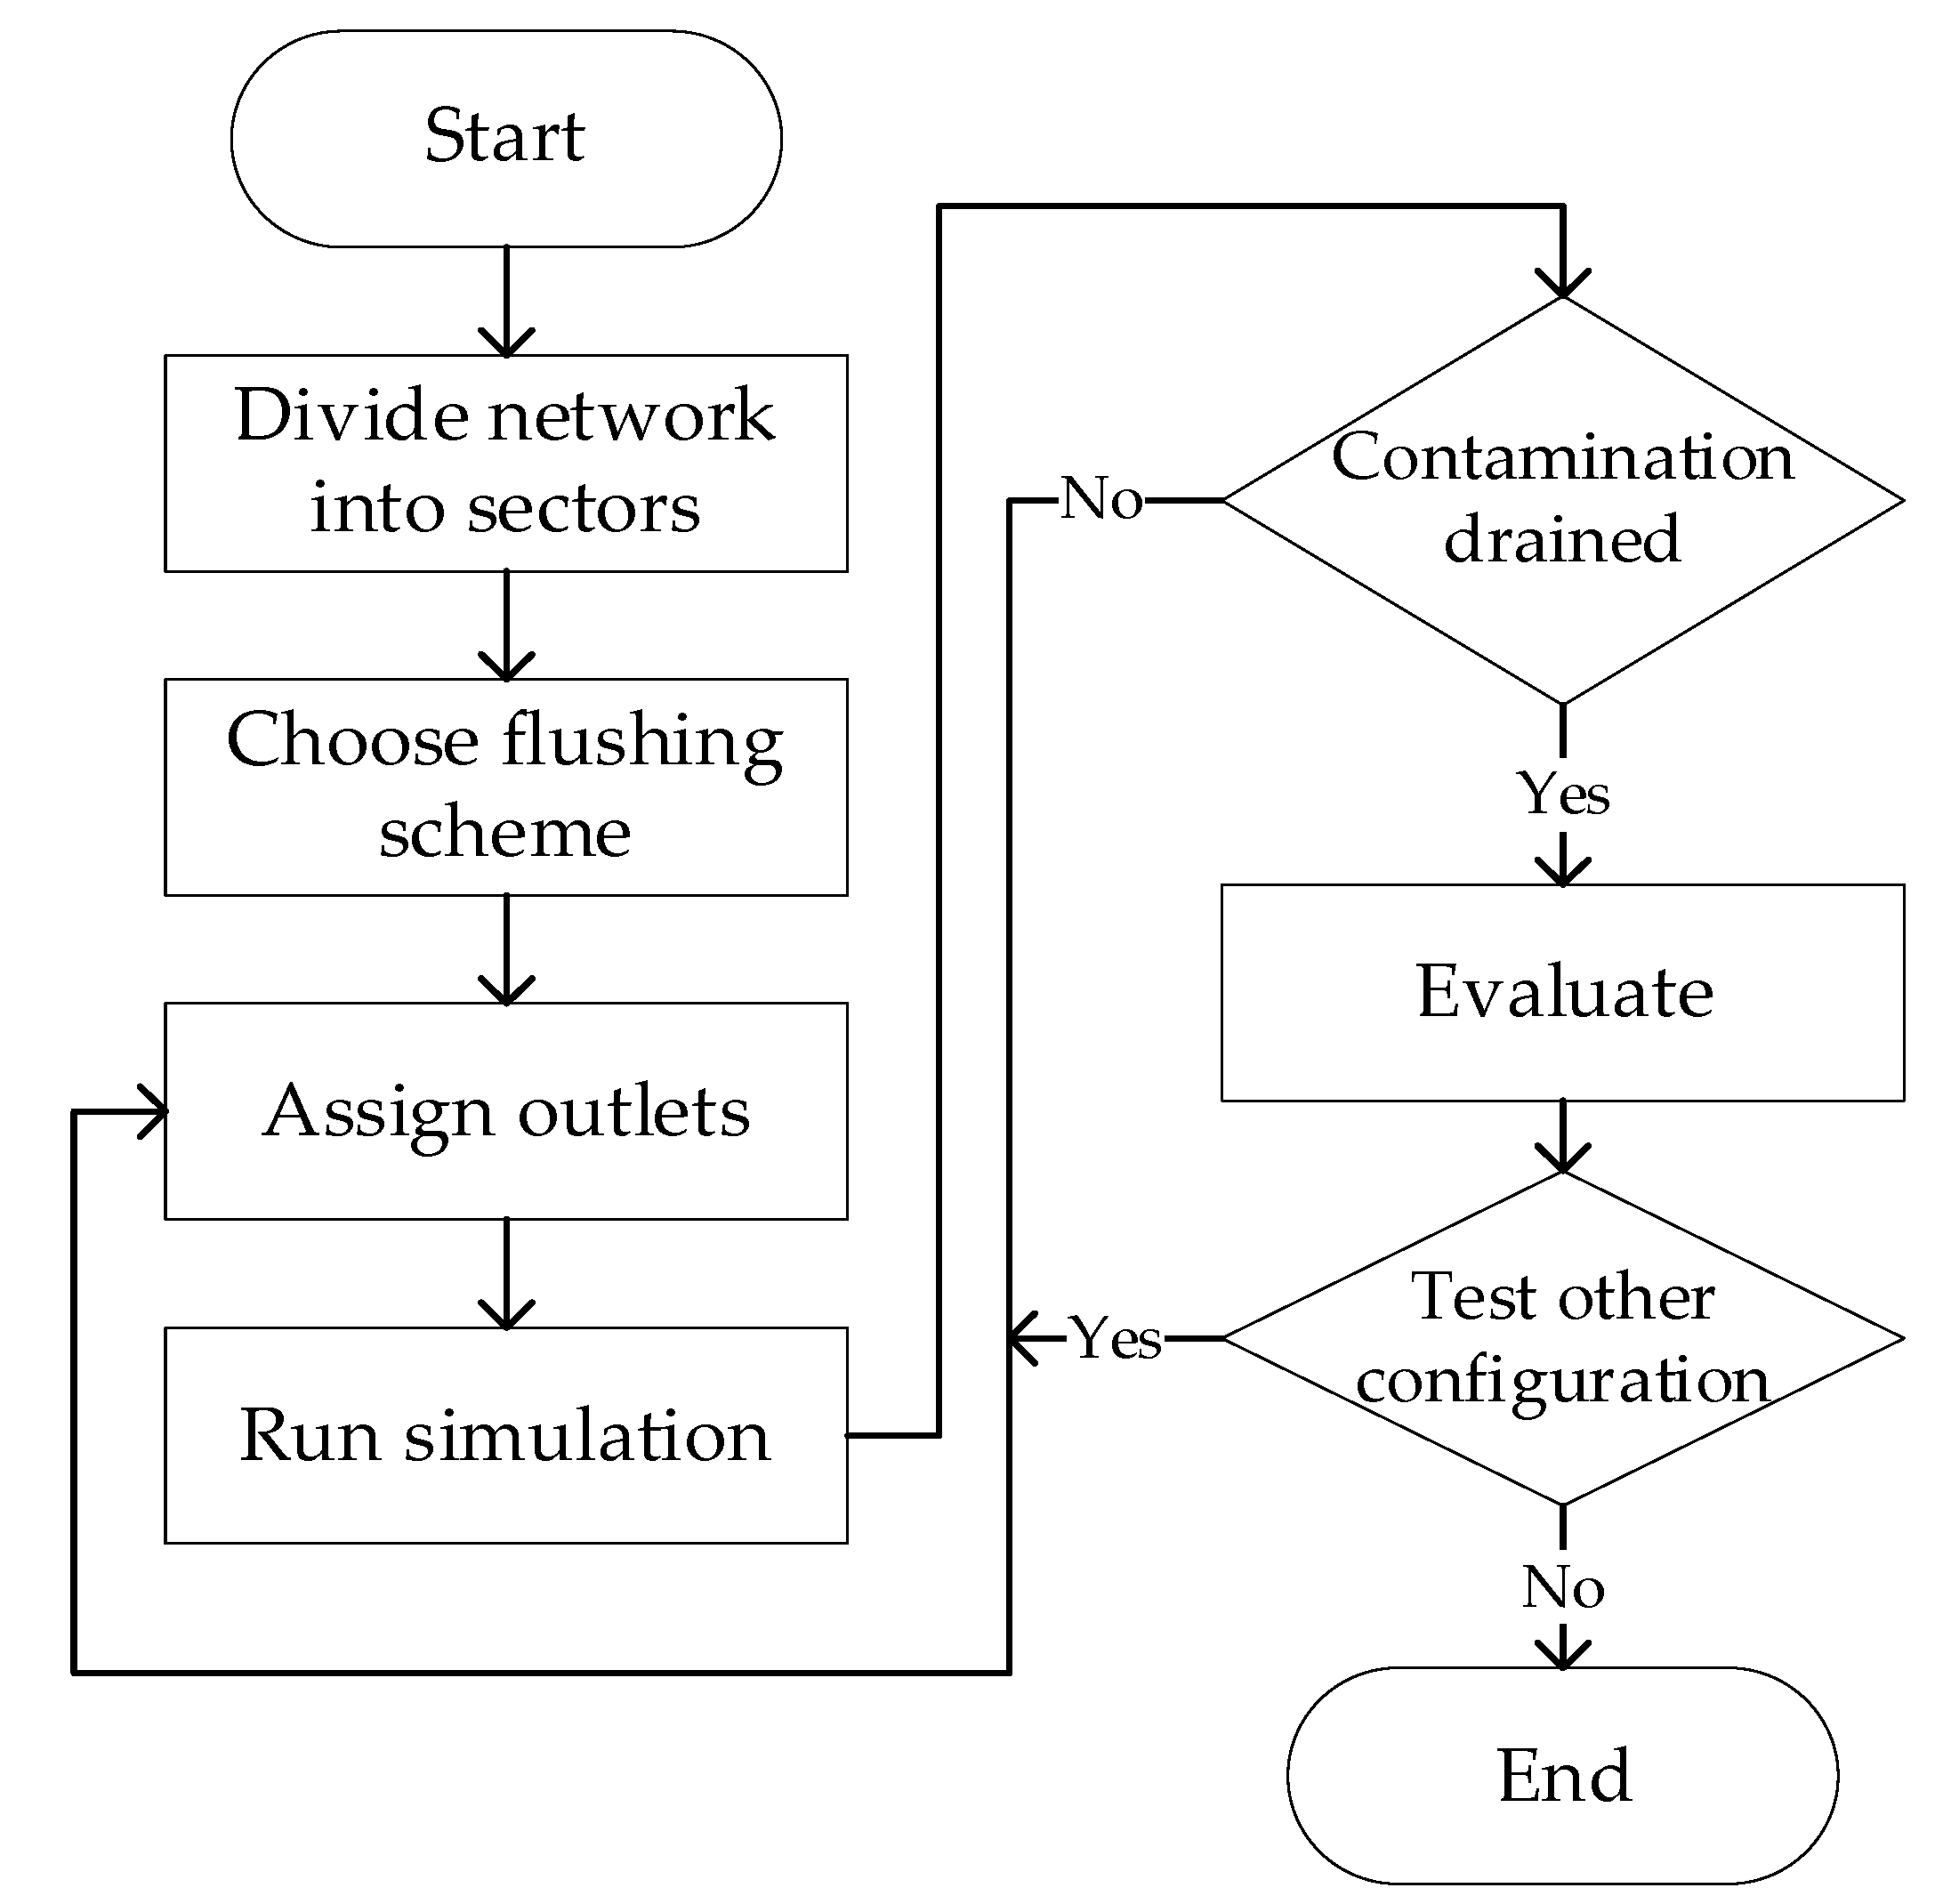
Considering the capability of household faucets to flush out contamination and advanced information and communication technology (ICT), water utilities can coordinate users in the contaminated area to control their faucets in an effort to assist in the decontamination process. When technical issues such as hydrant availability or team mobilization occur, faucets could be the main flushing option. This study assesses the possibility of active customer involvement in a contamination flushing scheme. The flushing scheme involves determining the participating area and the opening and closing times of customer faucets. The use of faucets is applied in two flushing schemes, namely, faucets only and faucets in conjunction with hydrants. The effectiveness of the flushing schemes was evaluated using simple metrics that consider efficiency and safety. Efficiency considers the time duration and amount of water needed for the flushing, while safety considers the likelihood of secondary contamination owing to hydraulic changes during the flushing.
As this study mainly aims to present the viability of this new approach, several assumptions were postulated for simulation. The scheme was applied to a district metered area (DMA)-sized WDN that can also represent an isolated area. The WDN was fully contaminated. In other words, the volume of contaminated water was equal to the pipe volume of the network. During the flushing, there was no water usage in addition to flushing purposes. No optimization method was applied to determine the participating area and flush duration. Instead, only a simple trial-and-error simulation was applied. In actual conditions, the characteristics of the contaminated area vary depending on the contamination source and time. Optimization work will take into account a considerable amount of time owing to the complexity of the problem, and the network needs to return to normal conditions rapidly. The uncertainty of the faucet opening time was not considered, and it was assumed that all participating customers opened their faucets simultaneously following the instructions of water utilities via a mobile alert system.
The remainder of this paper is structured as follows.
Section 2 discusses the flushing methodology, which includes determining the participating area, flushing method, and performance metric. The application results and discussion are presented in
Section 3. Finally,
Section 4 presents the conclusions of this study.
3. Results and Discussion
3.1. Flushing Scheme Comparison
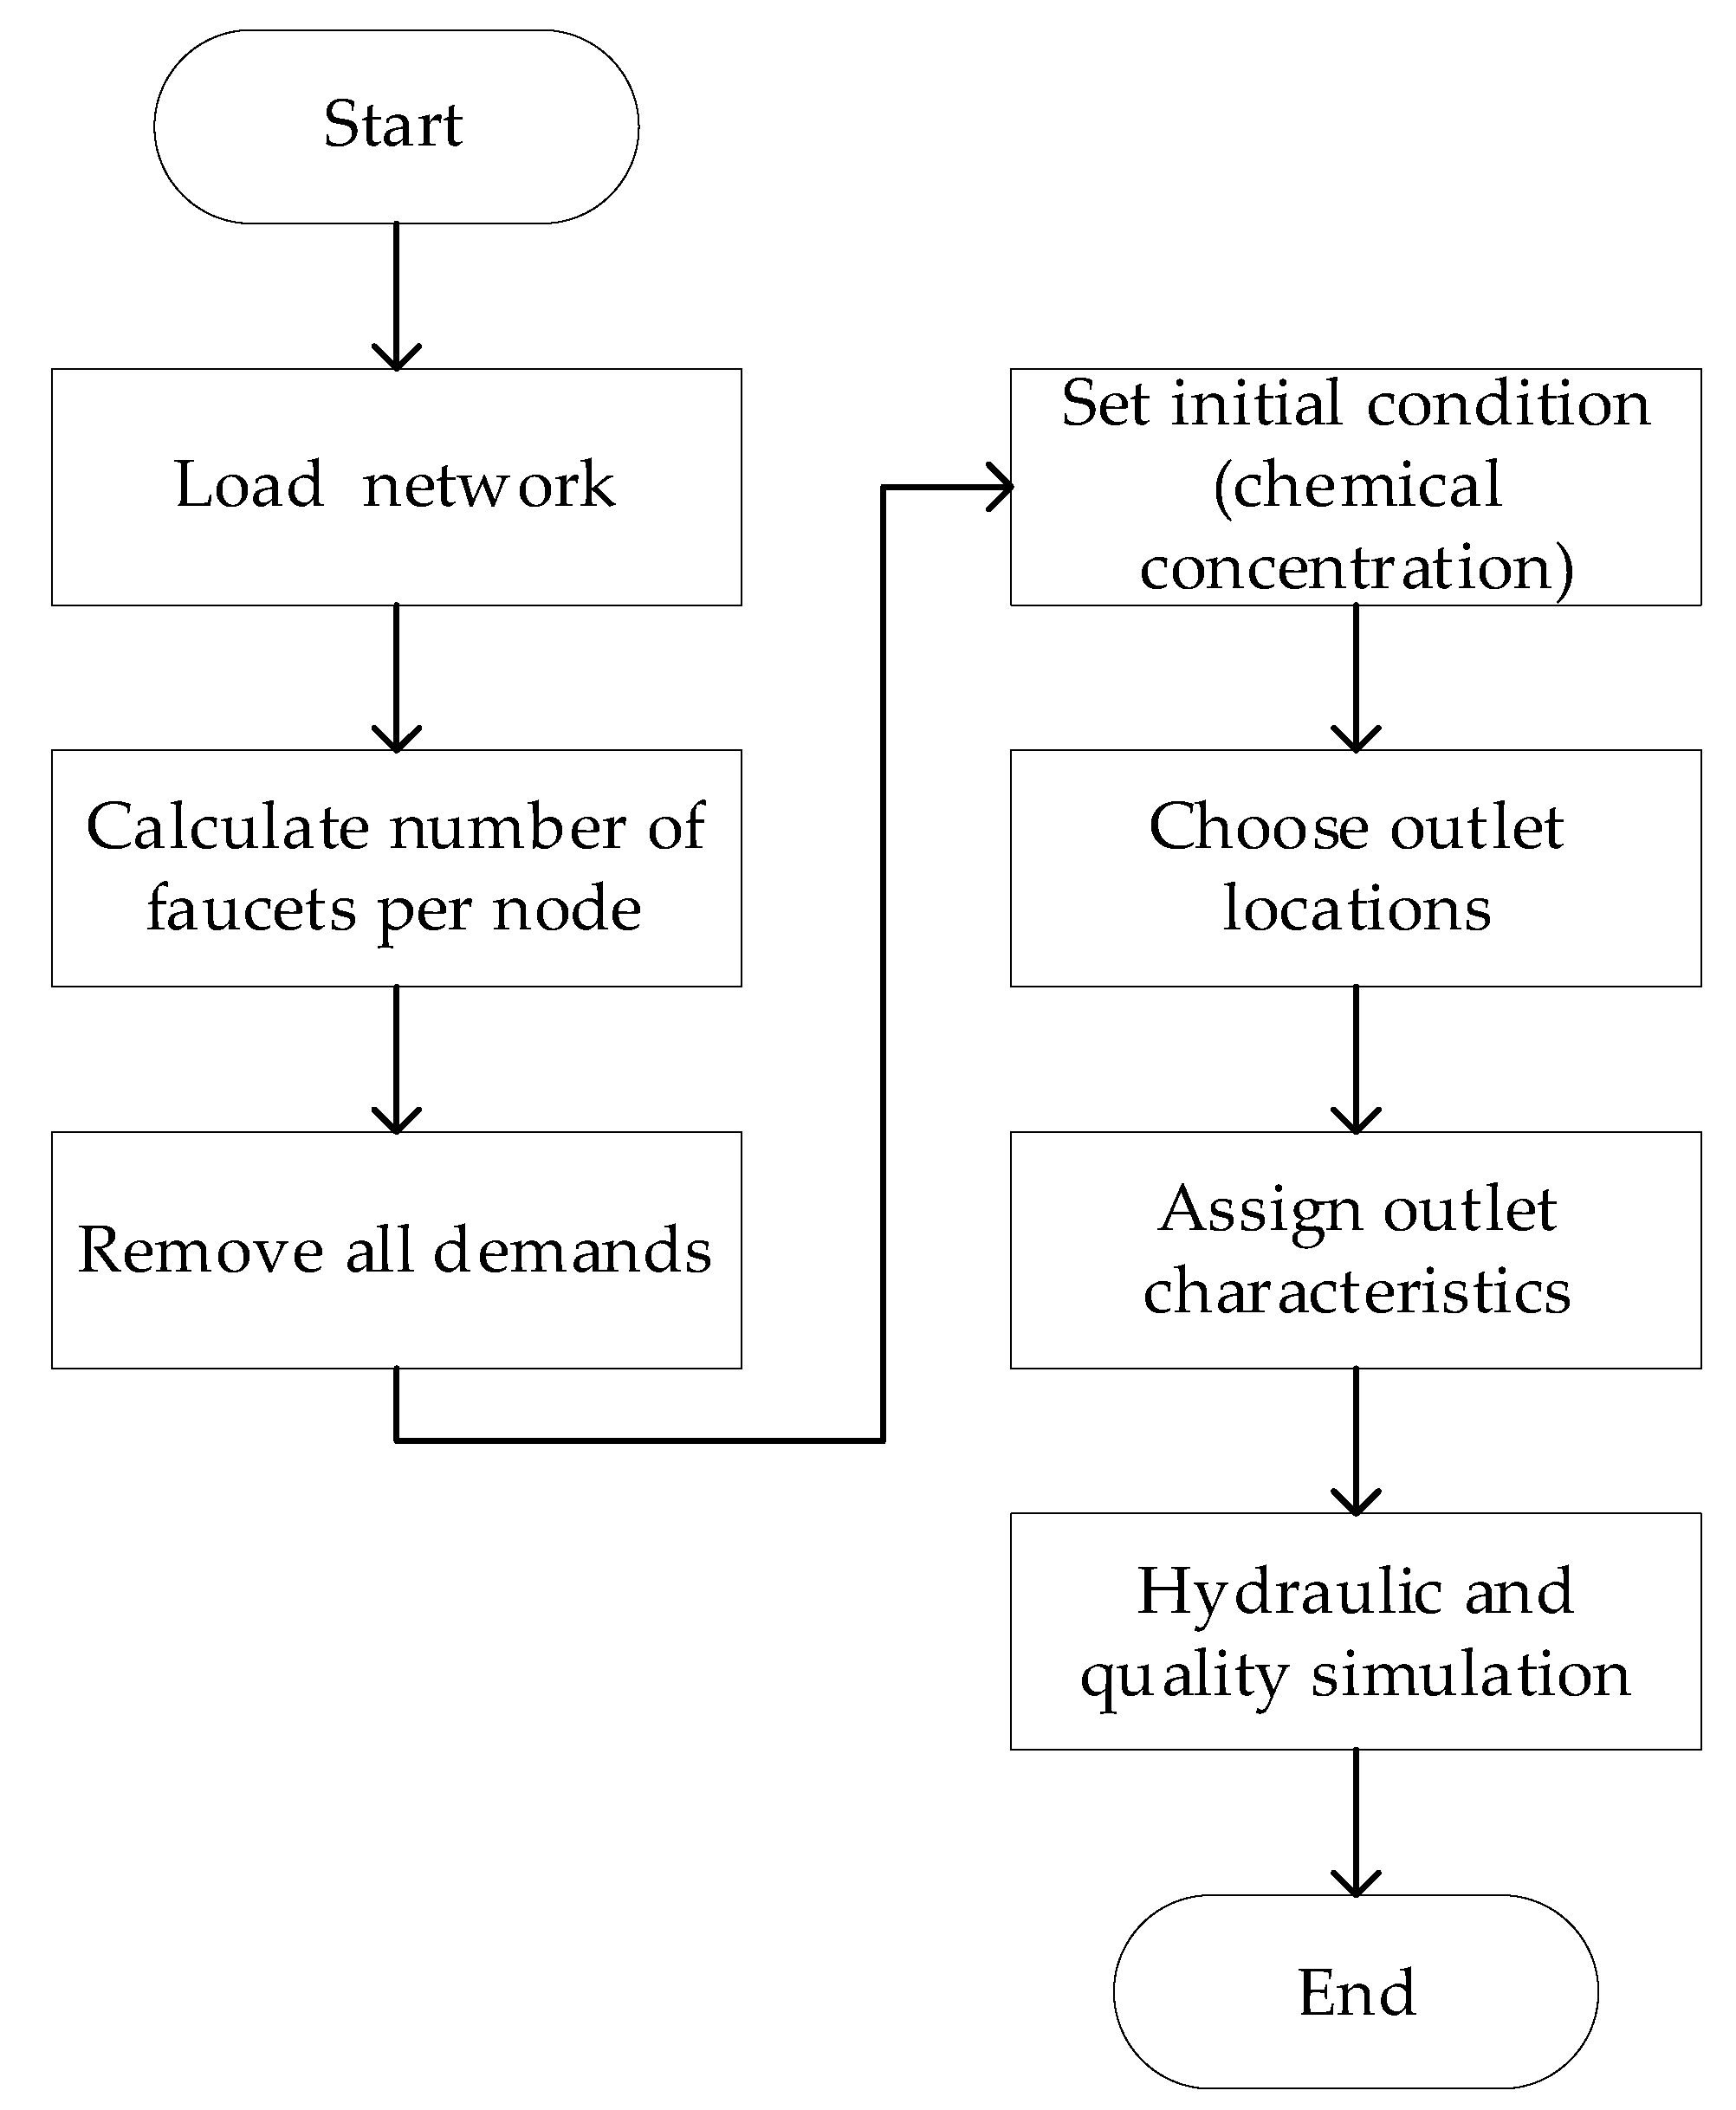
This section focuses on the performance comparison between each scheme (faucet-only, hydrant-only, and combination). For each network, the sector and location of the outlets were defined first. The outlets shown here were determined based on an empirical, trial-and-error method, as described next. The simulations conducted in this section assume full participation; hence, all available faucets in the participating node are opened.
3.1.1. Performance Comparison for Net-A
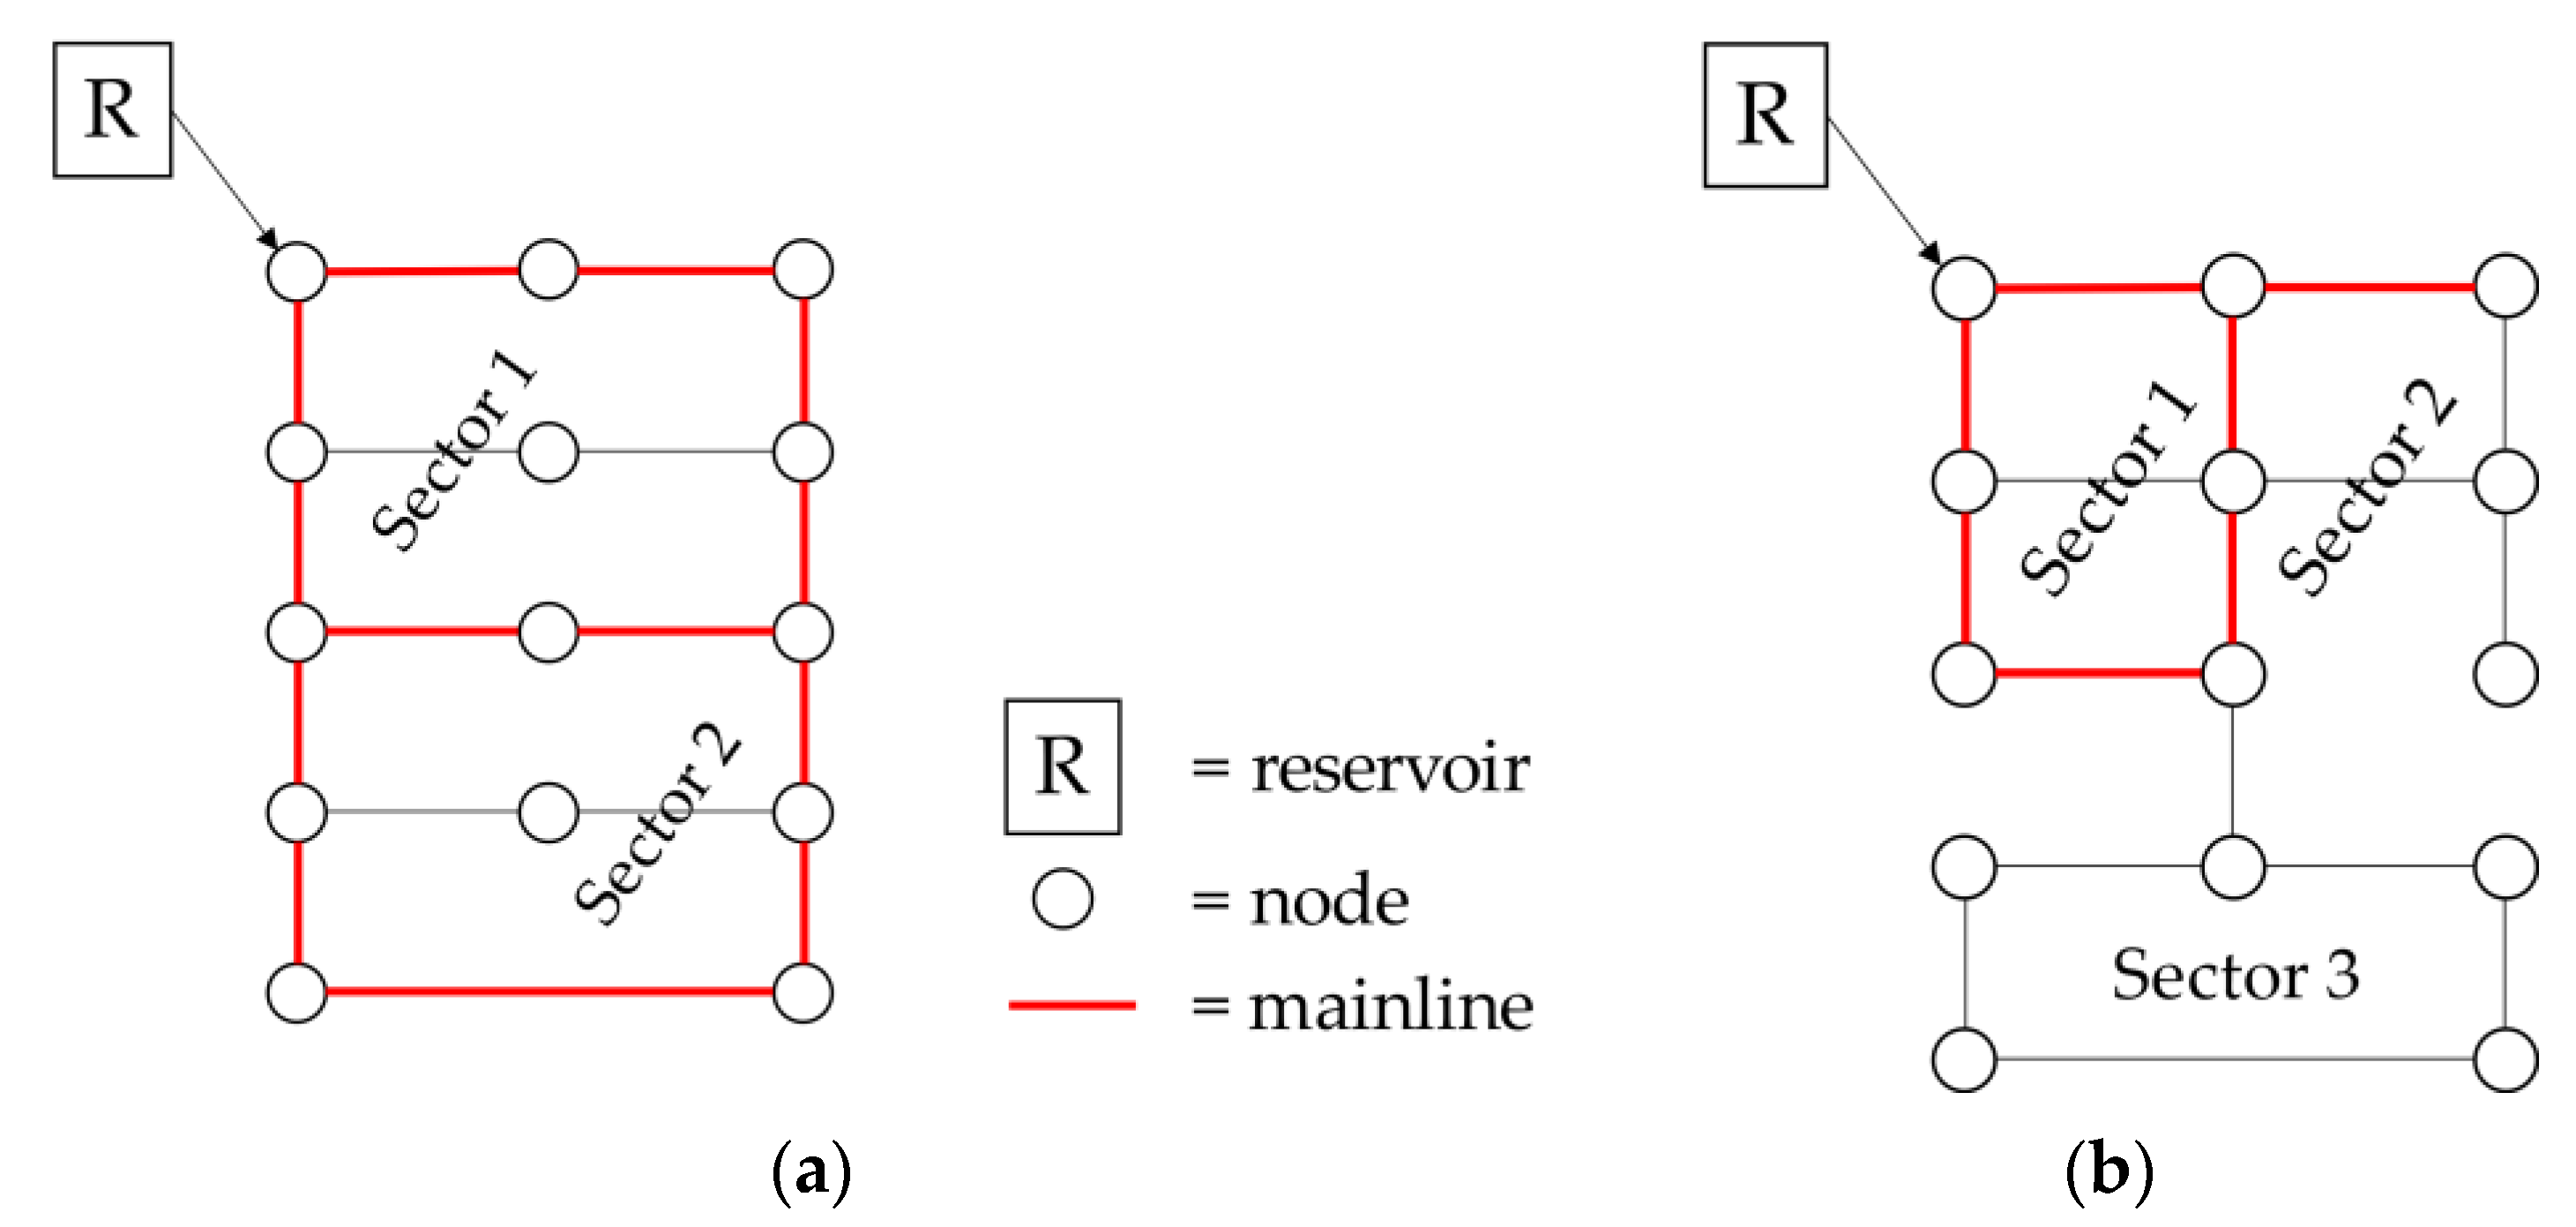
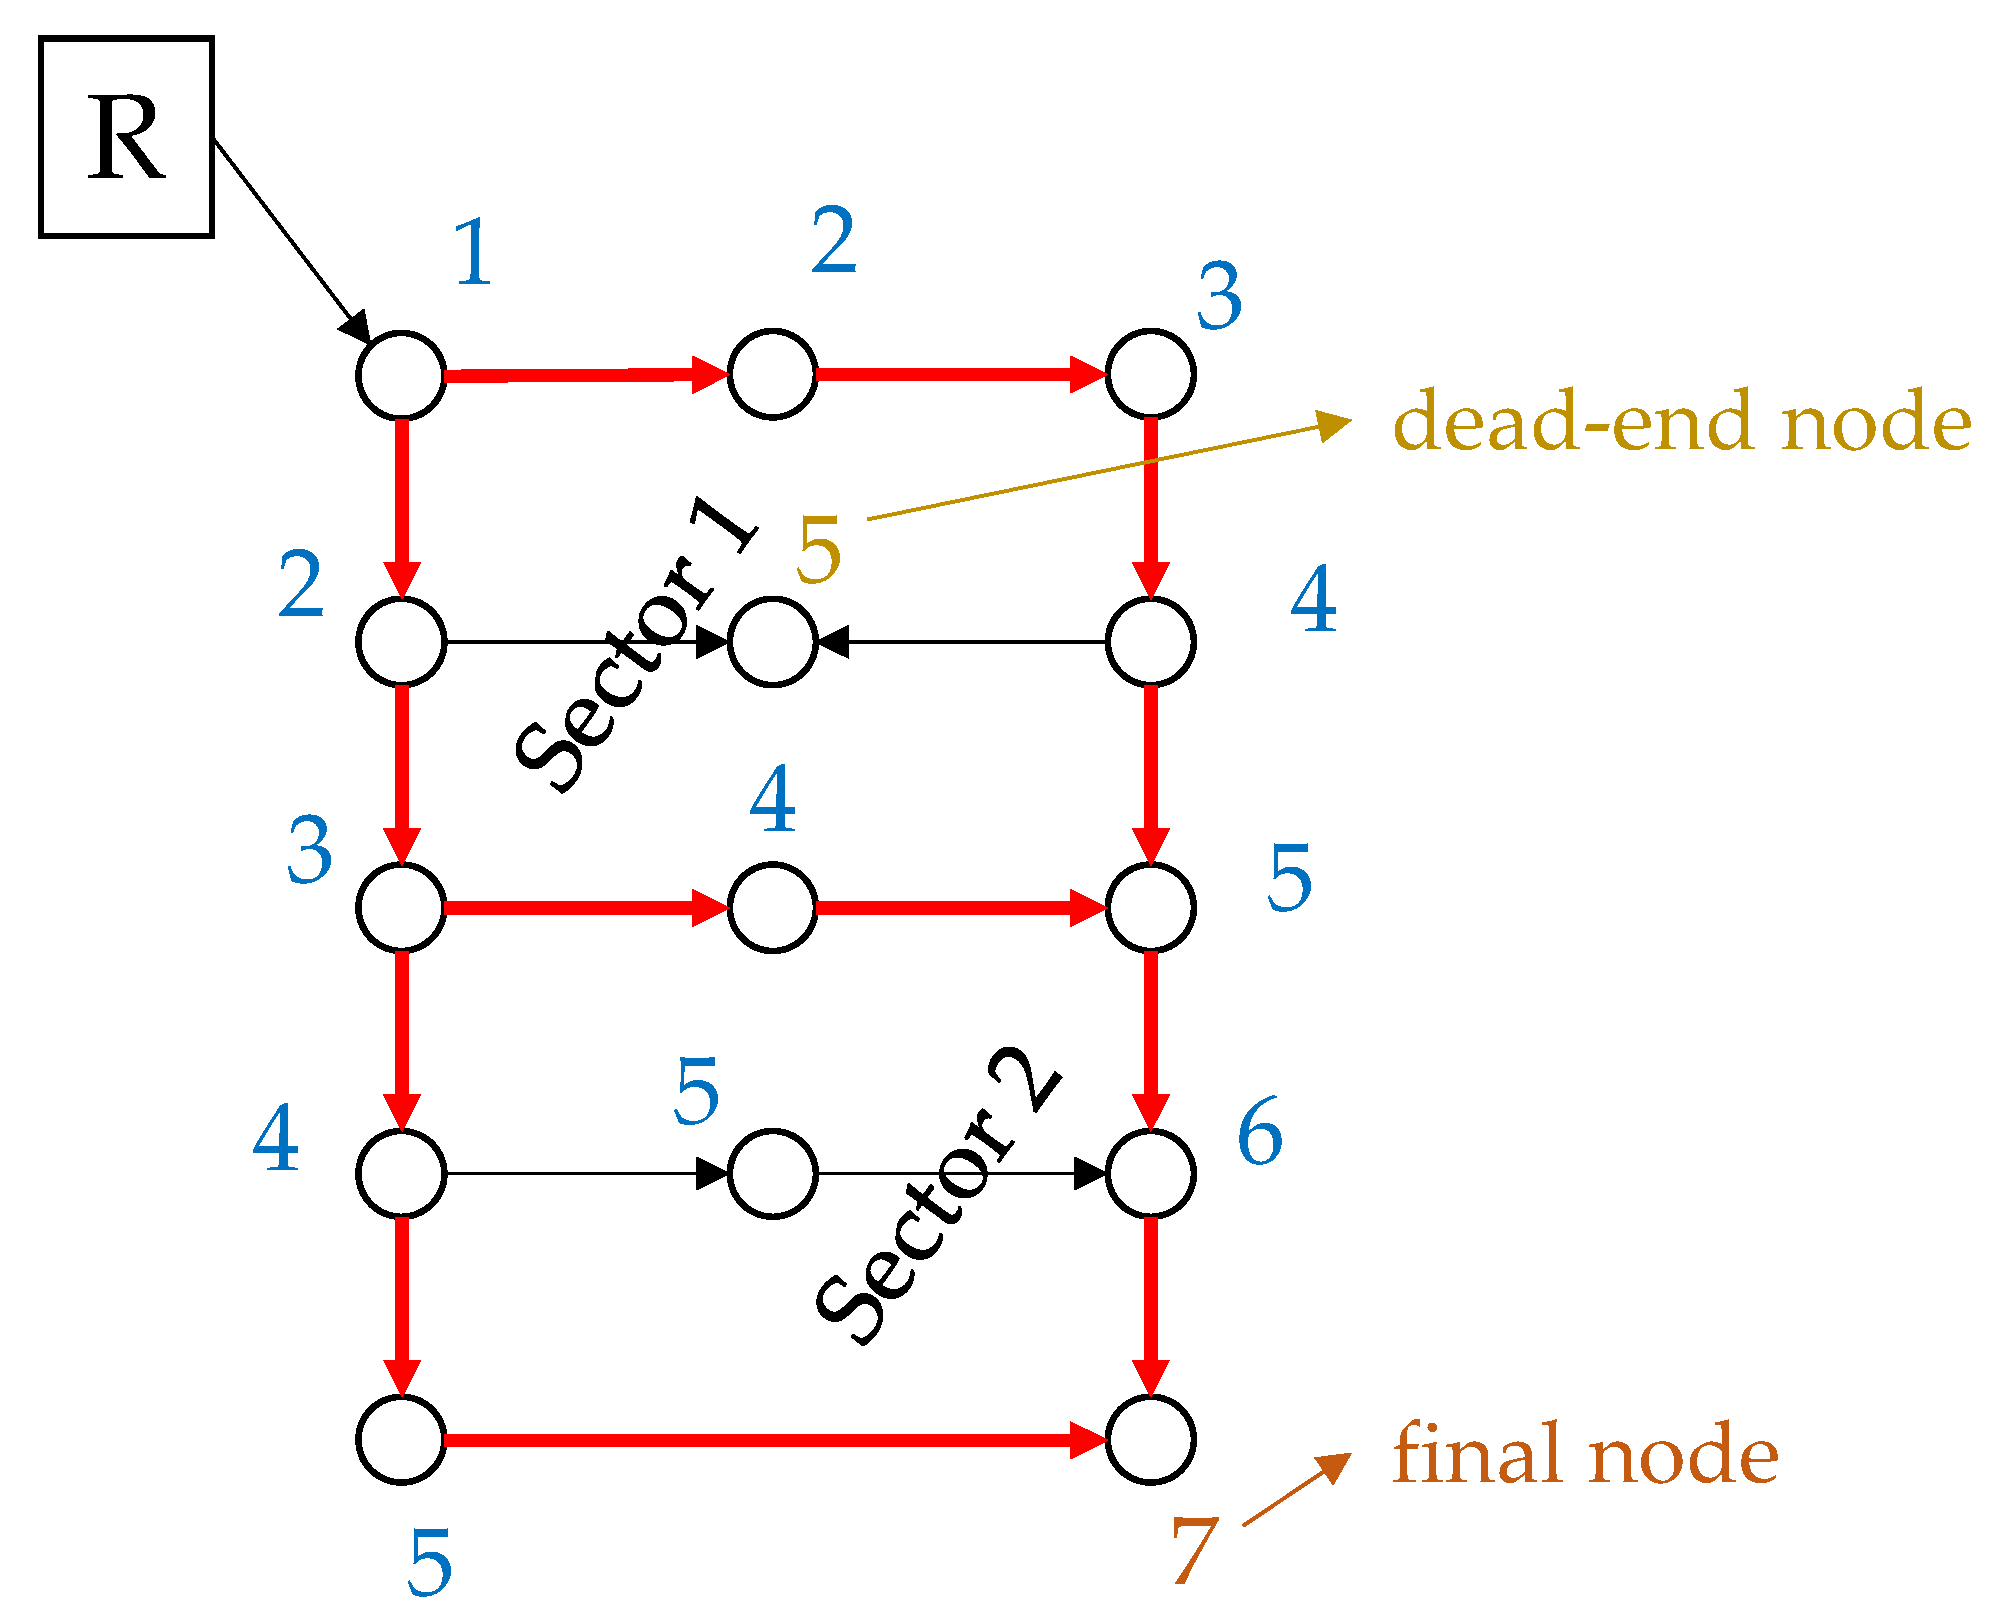
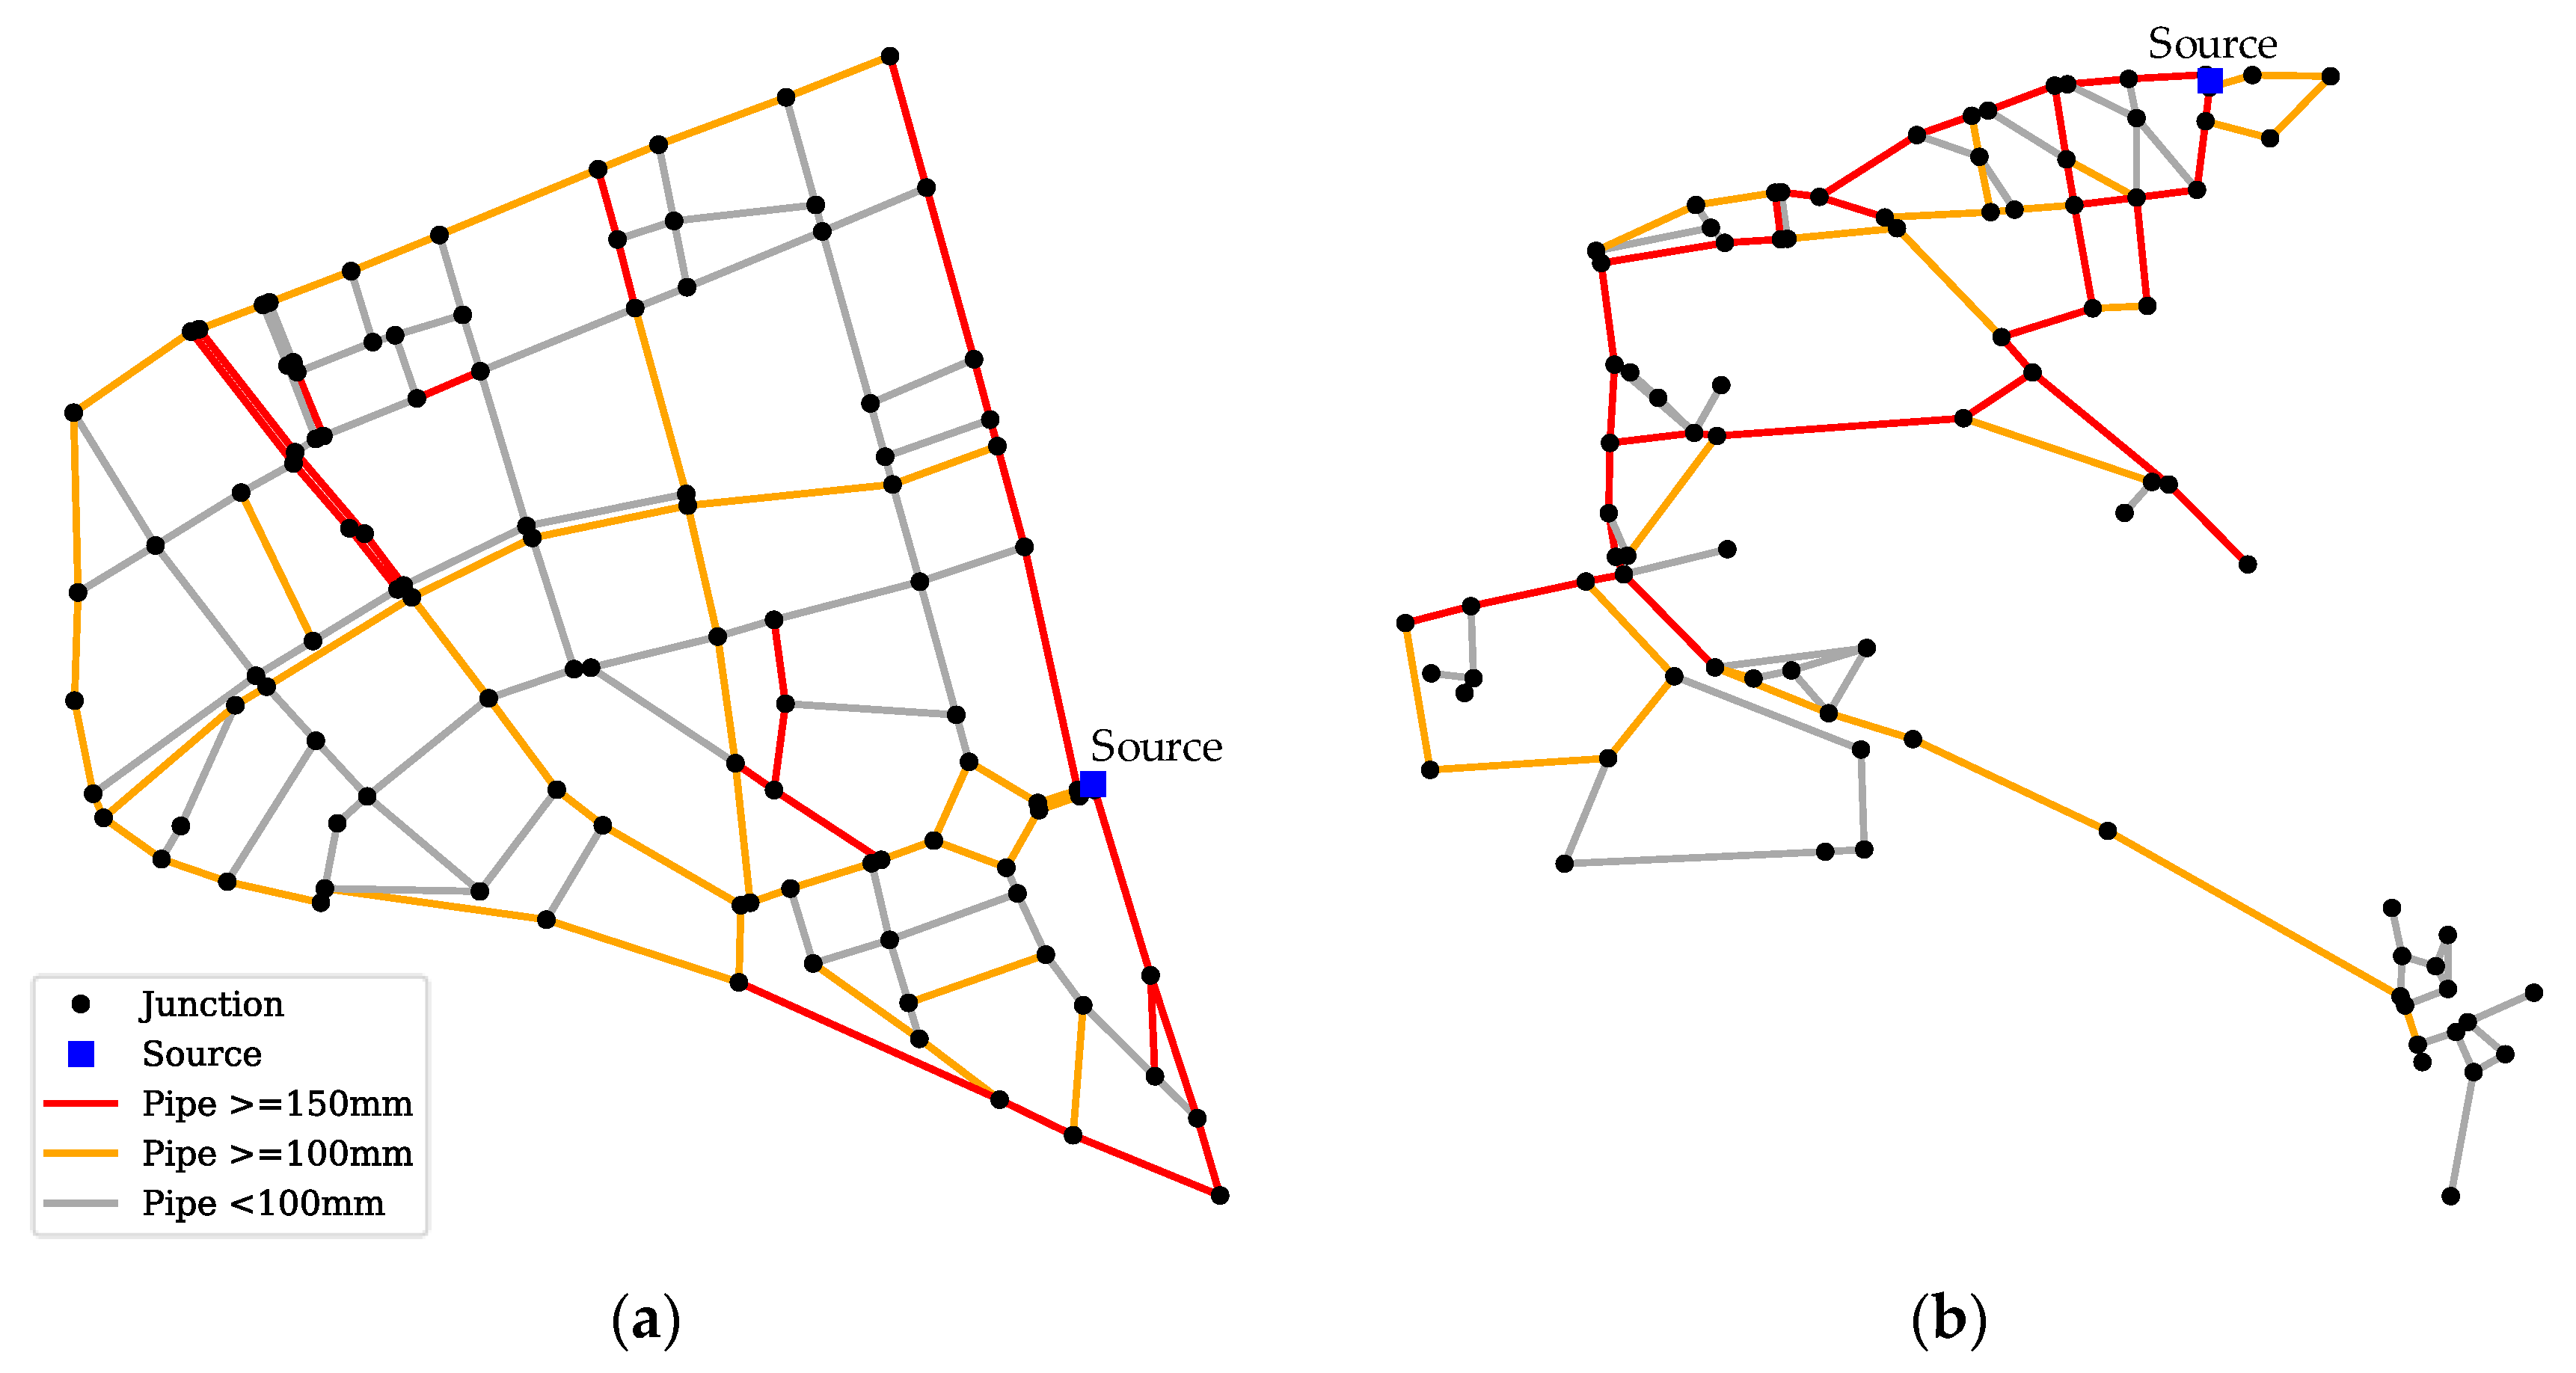
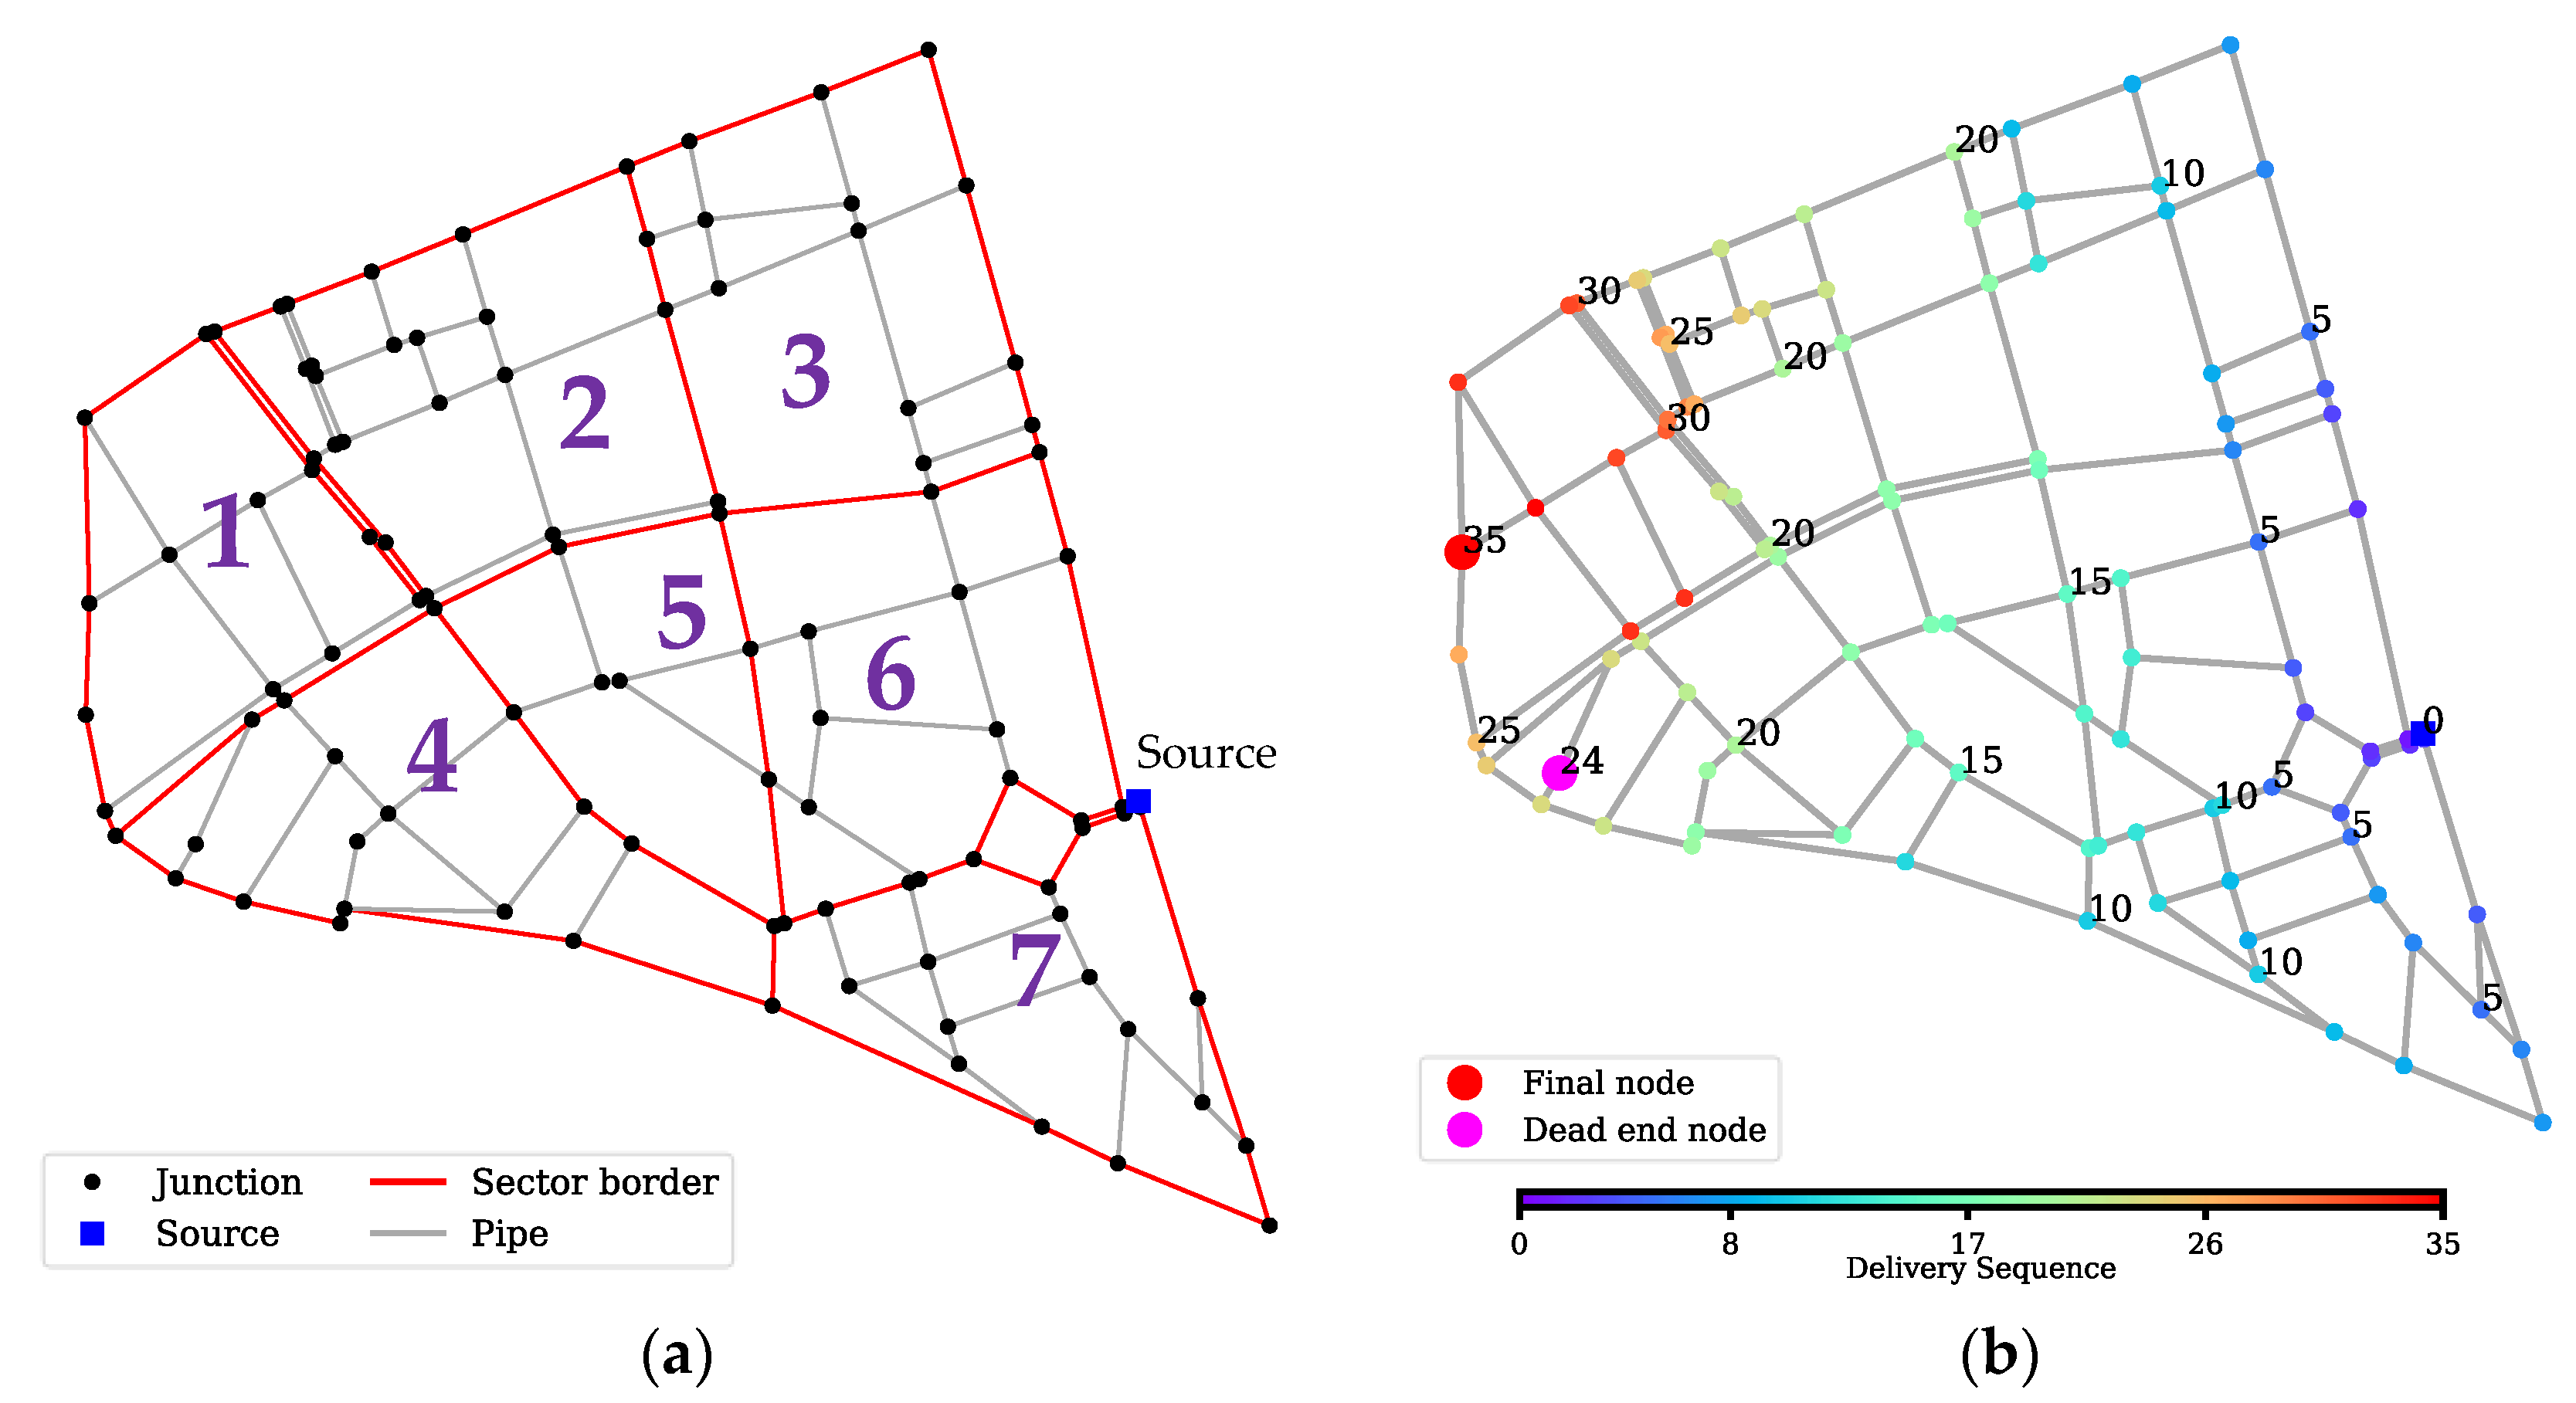
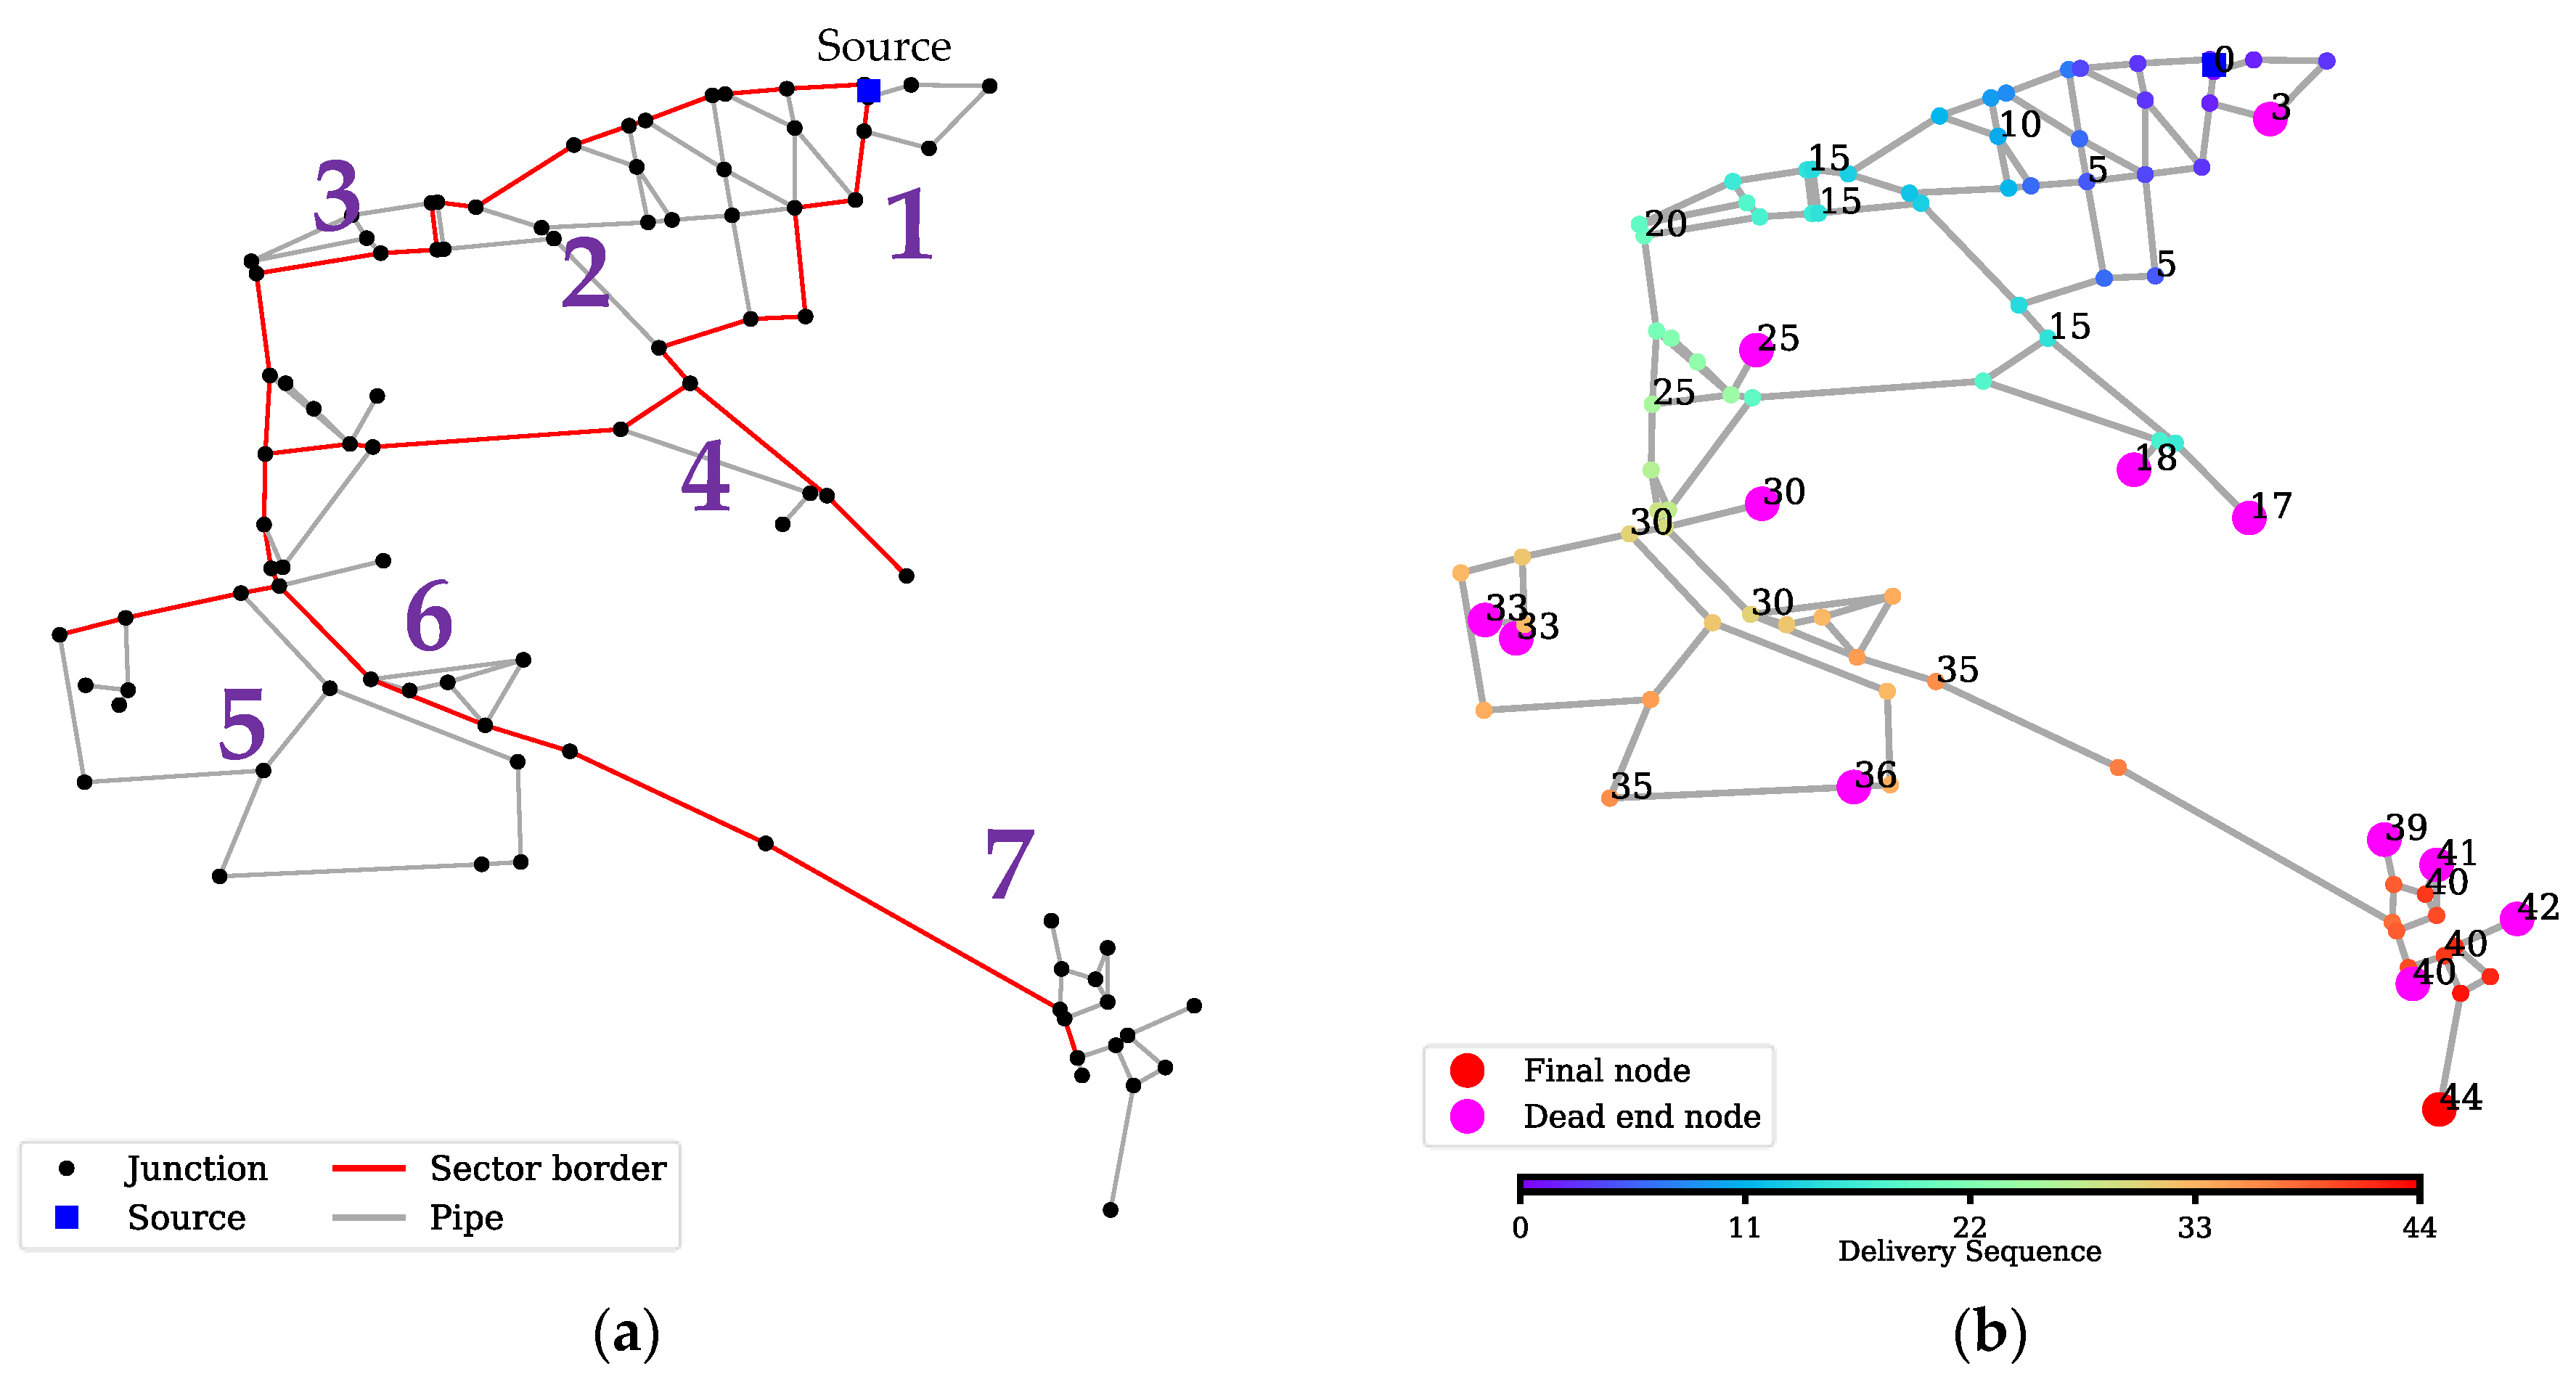
Net-A features a fully looped network. Based on the mainline, the network is divided into seven sectors. The layout of the sectors and the water delivery sequence are shown in
Figure 6. The last delivered node was found to be in Sector 1, which was used as the outlet in the first test. Then, other sectors were sequentially tested as the flushing outlet and performance were compared.
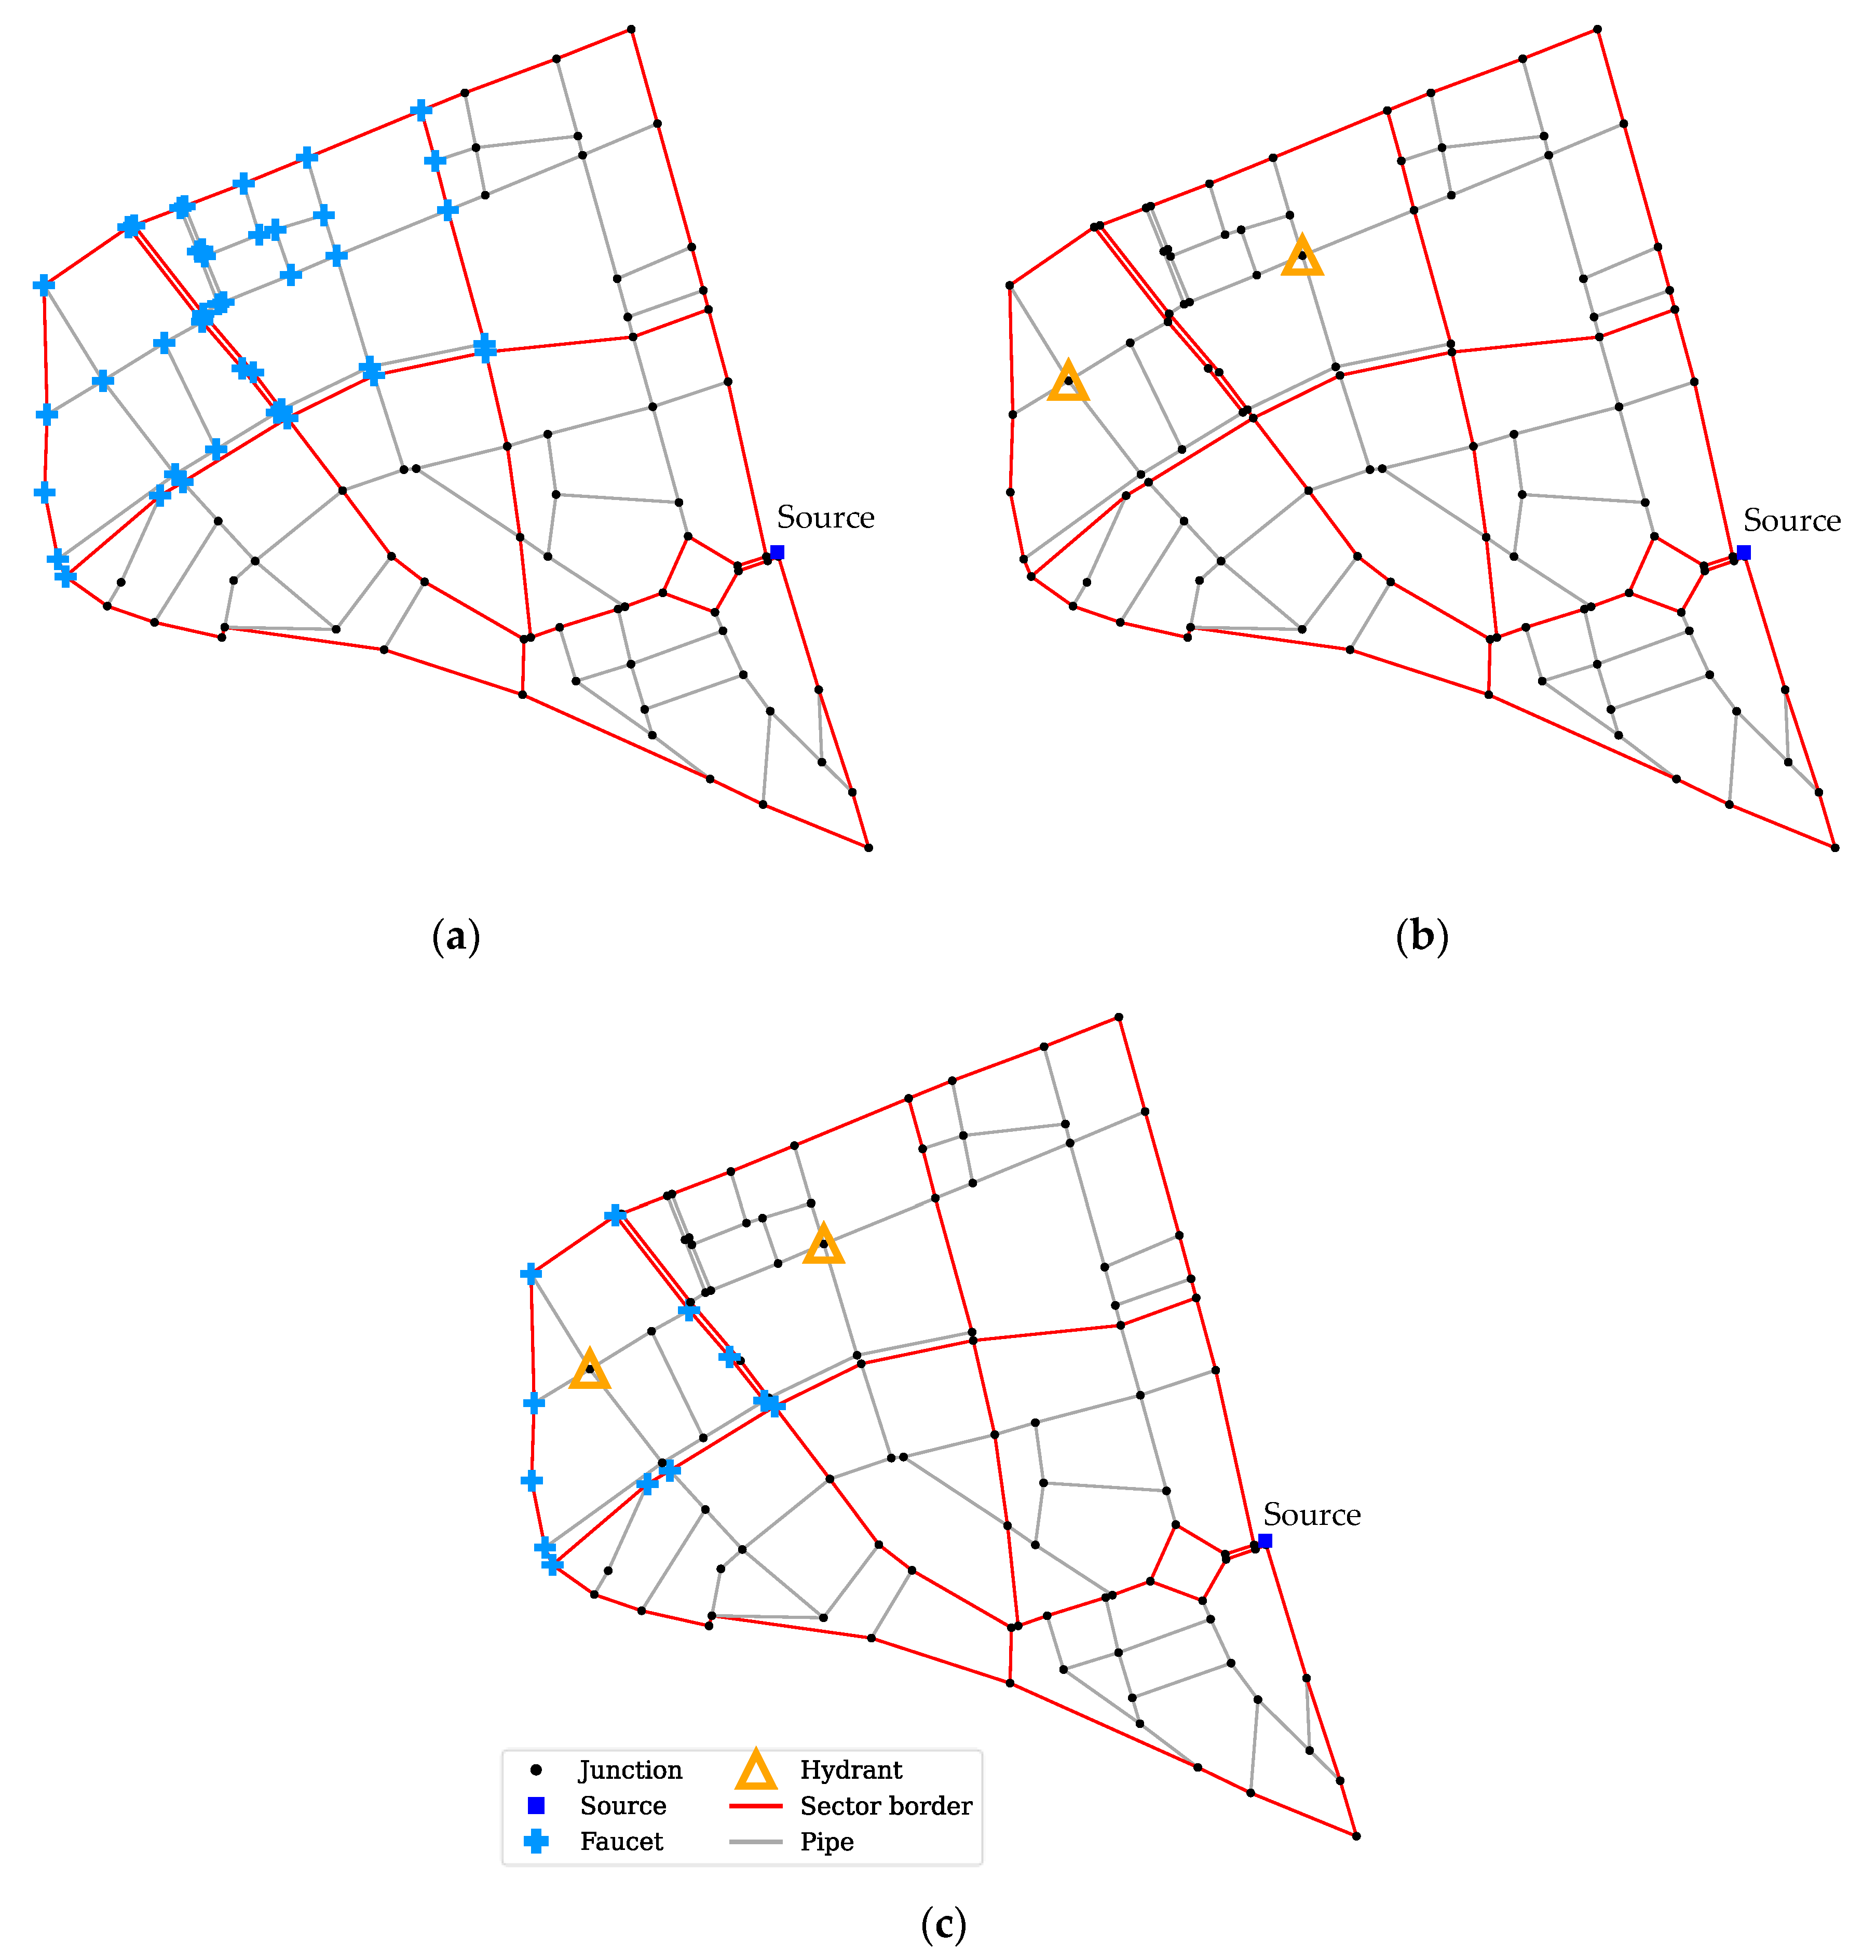
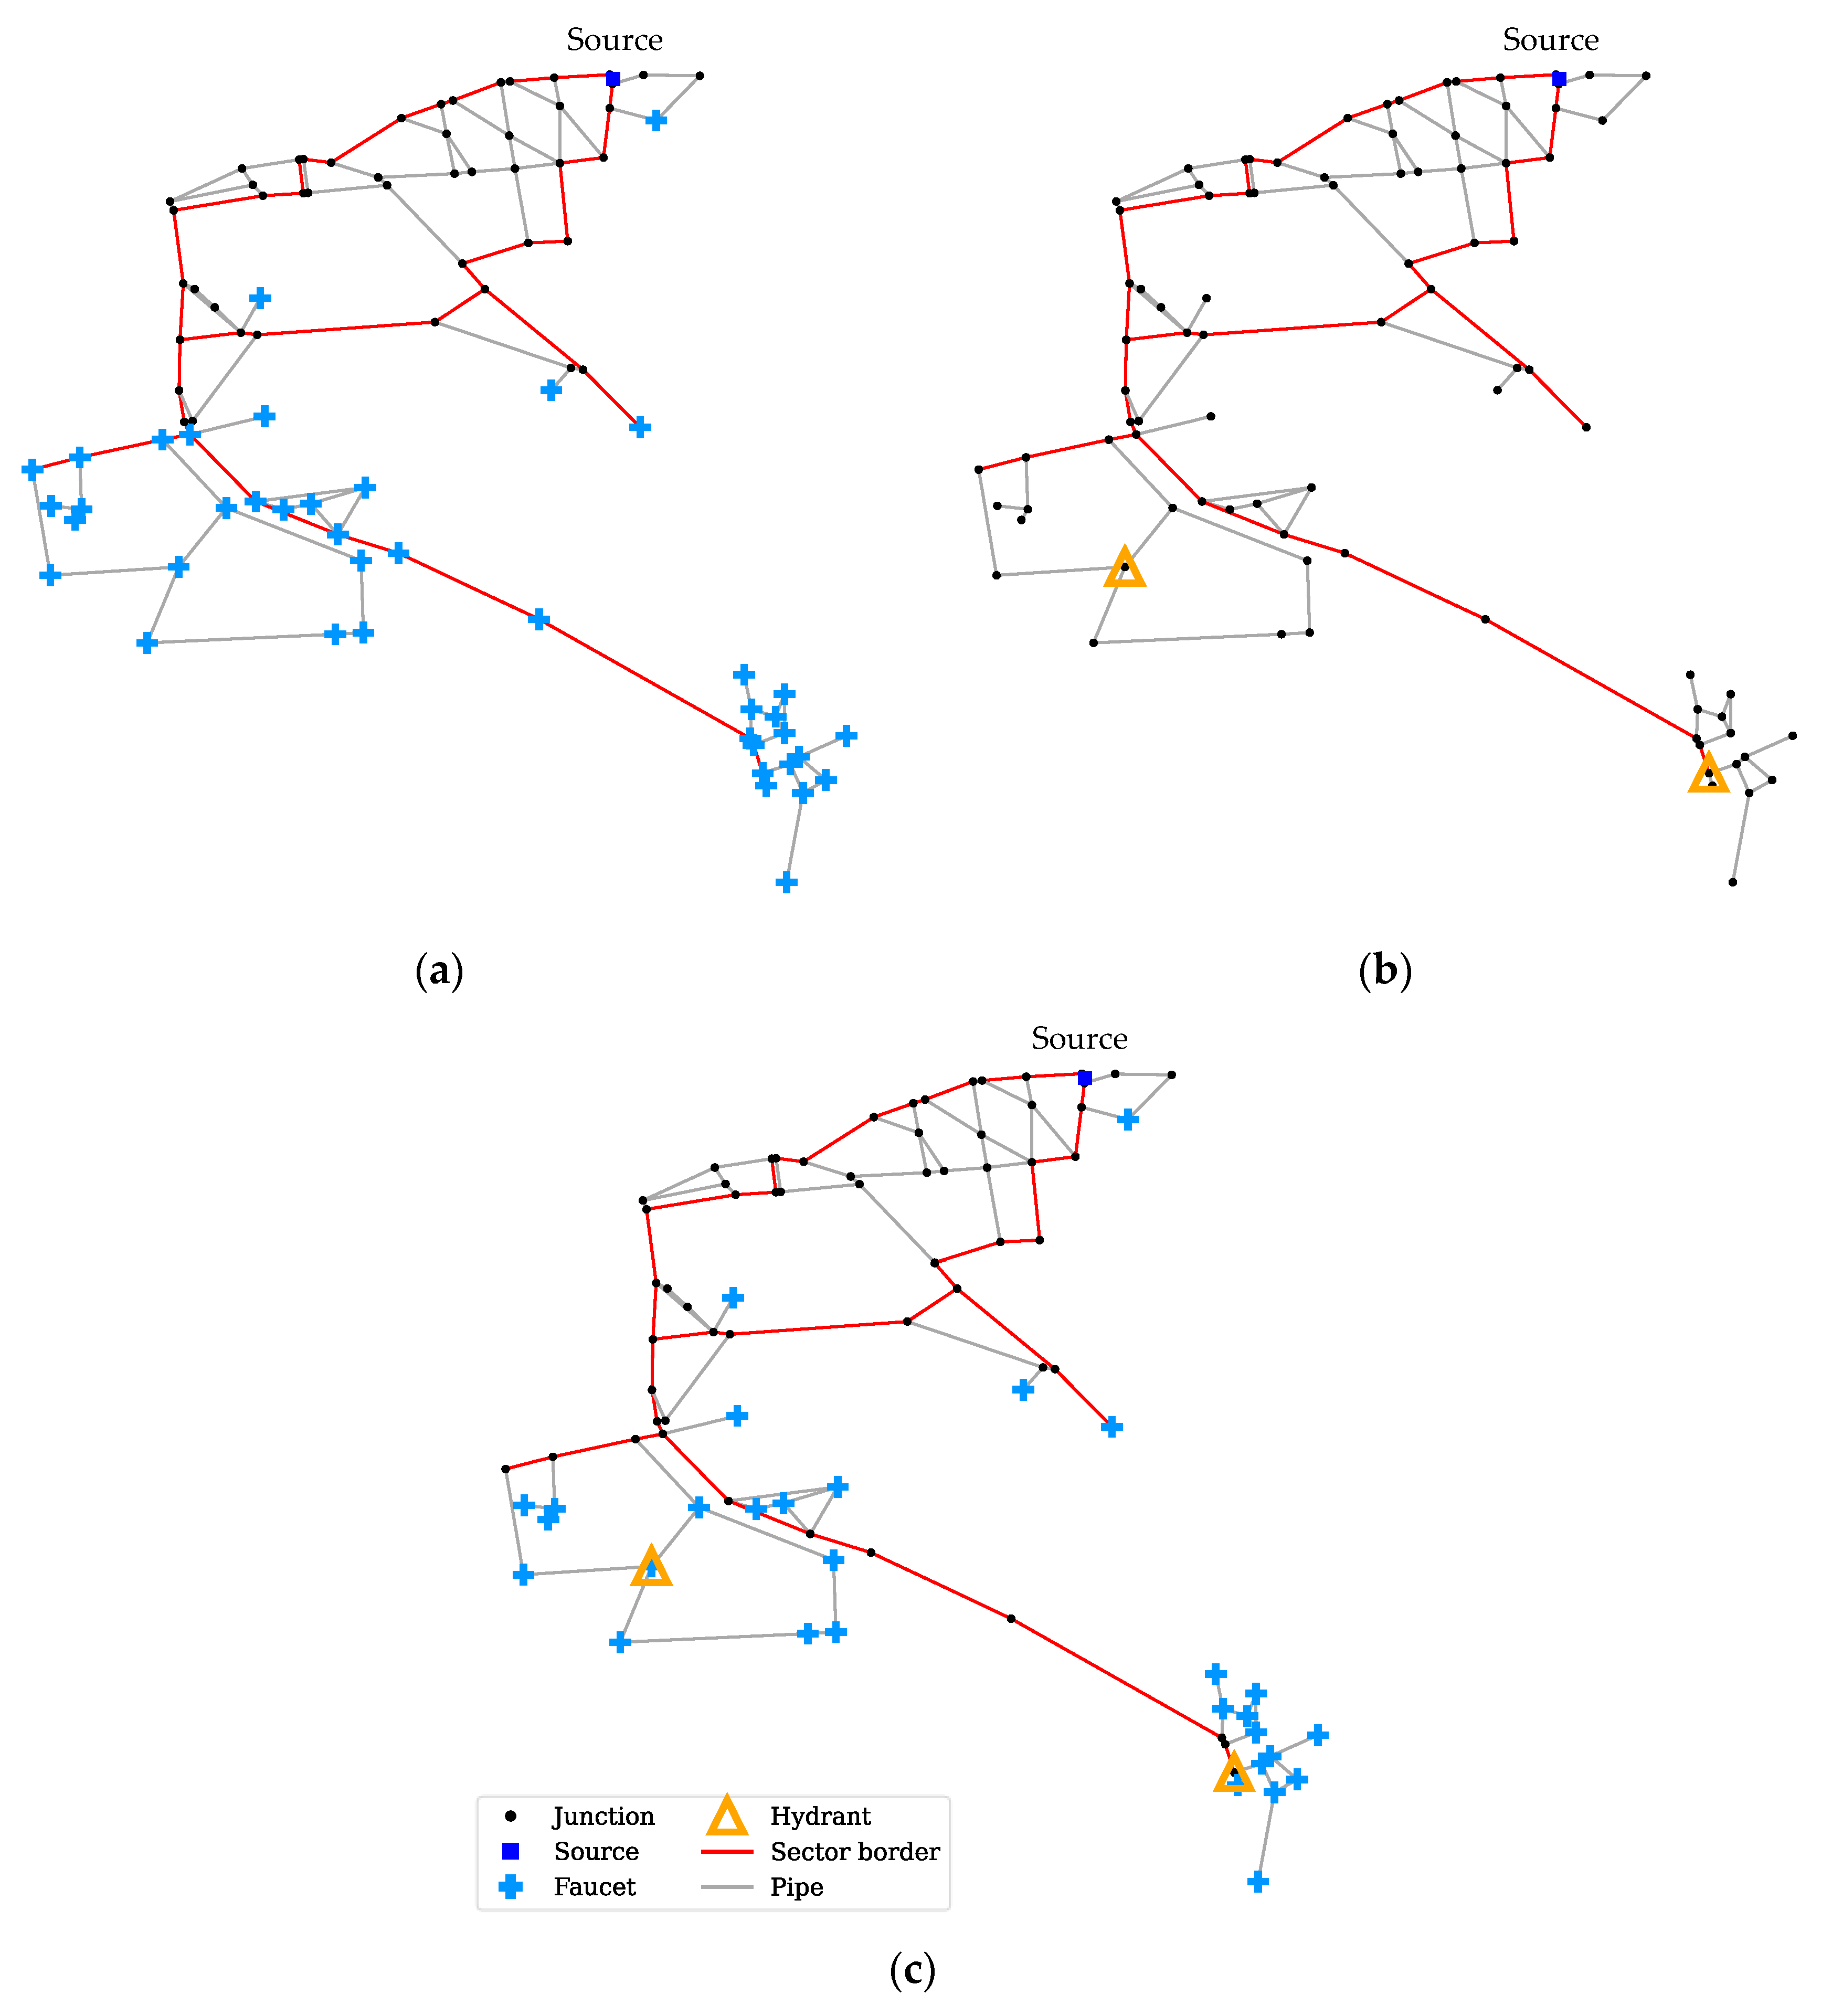
The trial-and-error begins with only Sector 1 as the first comparator. Then, the neighboring Sectors are added to the participants. The analysis found that using more than two sectors would cause performance loss due to excessive demands; hence, the possible pair to Sector 1 is only Sector 2 or 4. Based on the tests, it was found that the best performance was achieved when Sectors 1 and 2 were involved. The outlet locations for all schemes are shown in
Figure 7. For the faucet-only scheme, all faucets in Sectors 1 and 2 were opened simultaneously (
Figure 7a). For the hydrant-only scheme, two hydrants were opened simultaneously, which are located at the center of Sectors 1 and 2, respectively, as shown in
Figure 7b. For the combination scheme, only the faucets located along the mainline of Sector 1 were opened simultaneously with the two opening hydrants (
Figure 7c). This modification was needed because having too many outlets in the network will lead to a significant pressure drop, which could negatively affect the flushing performance. Finally, the simulation results are provided in
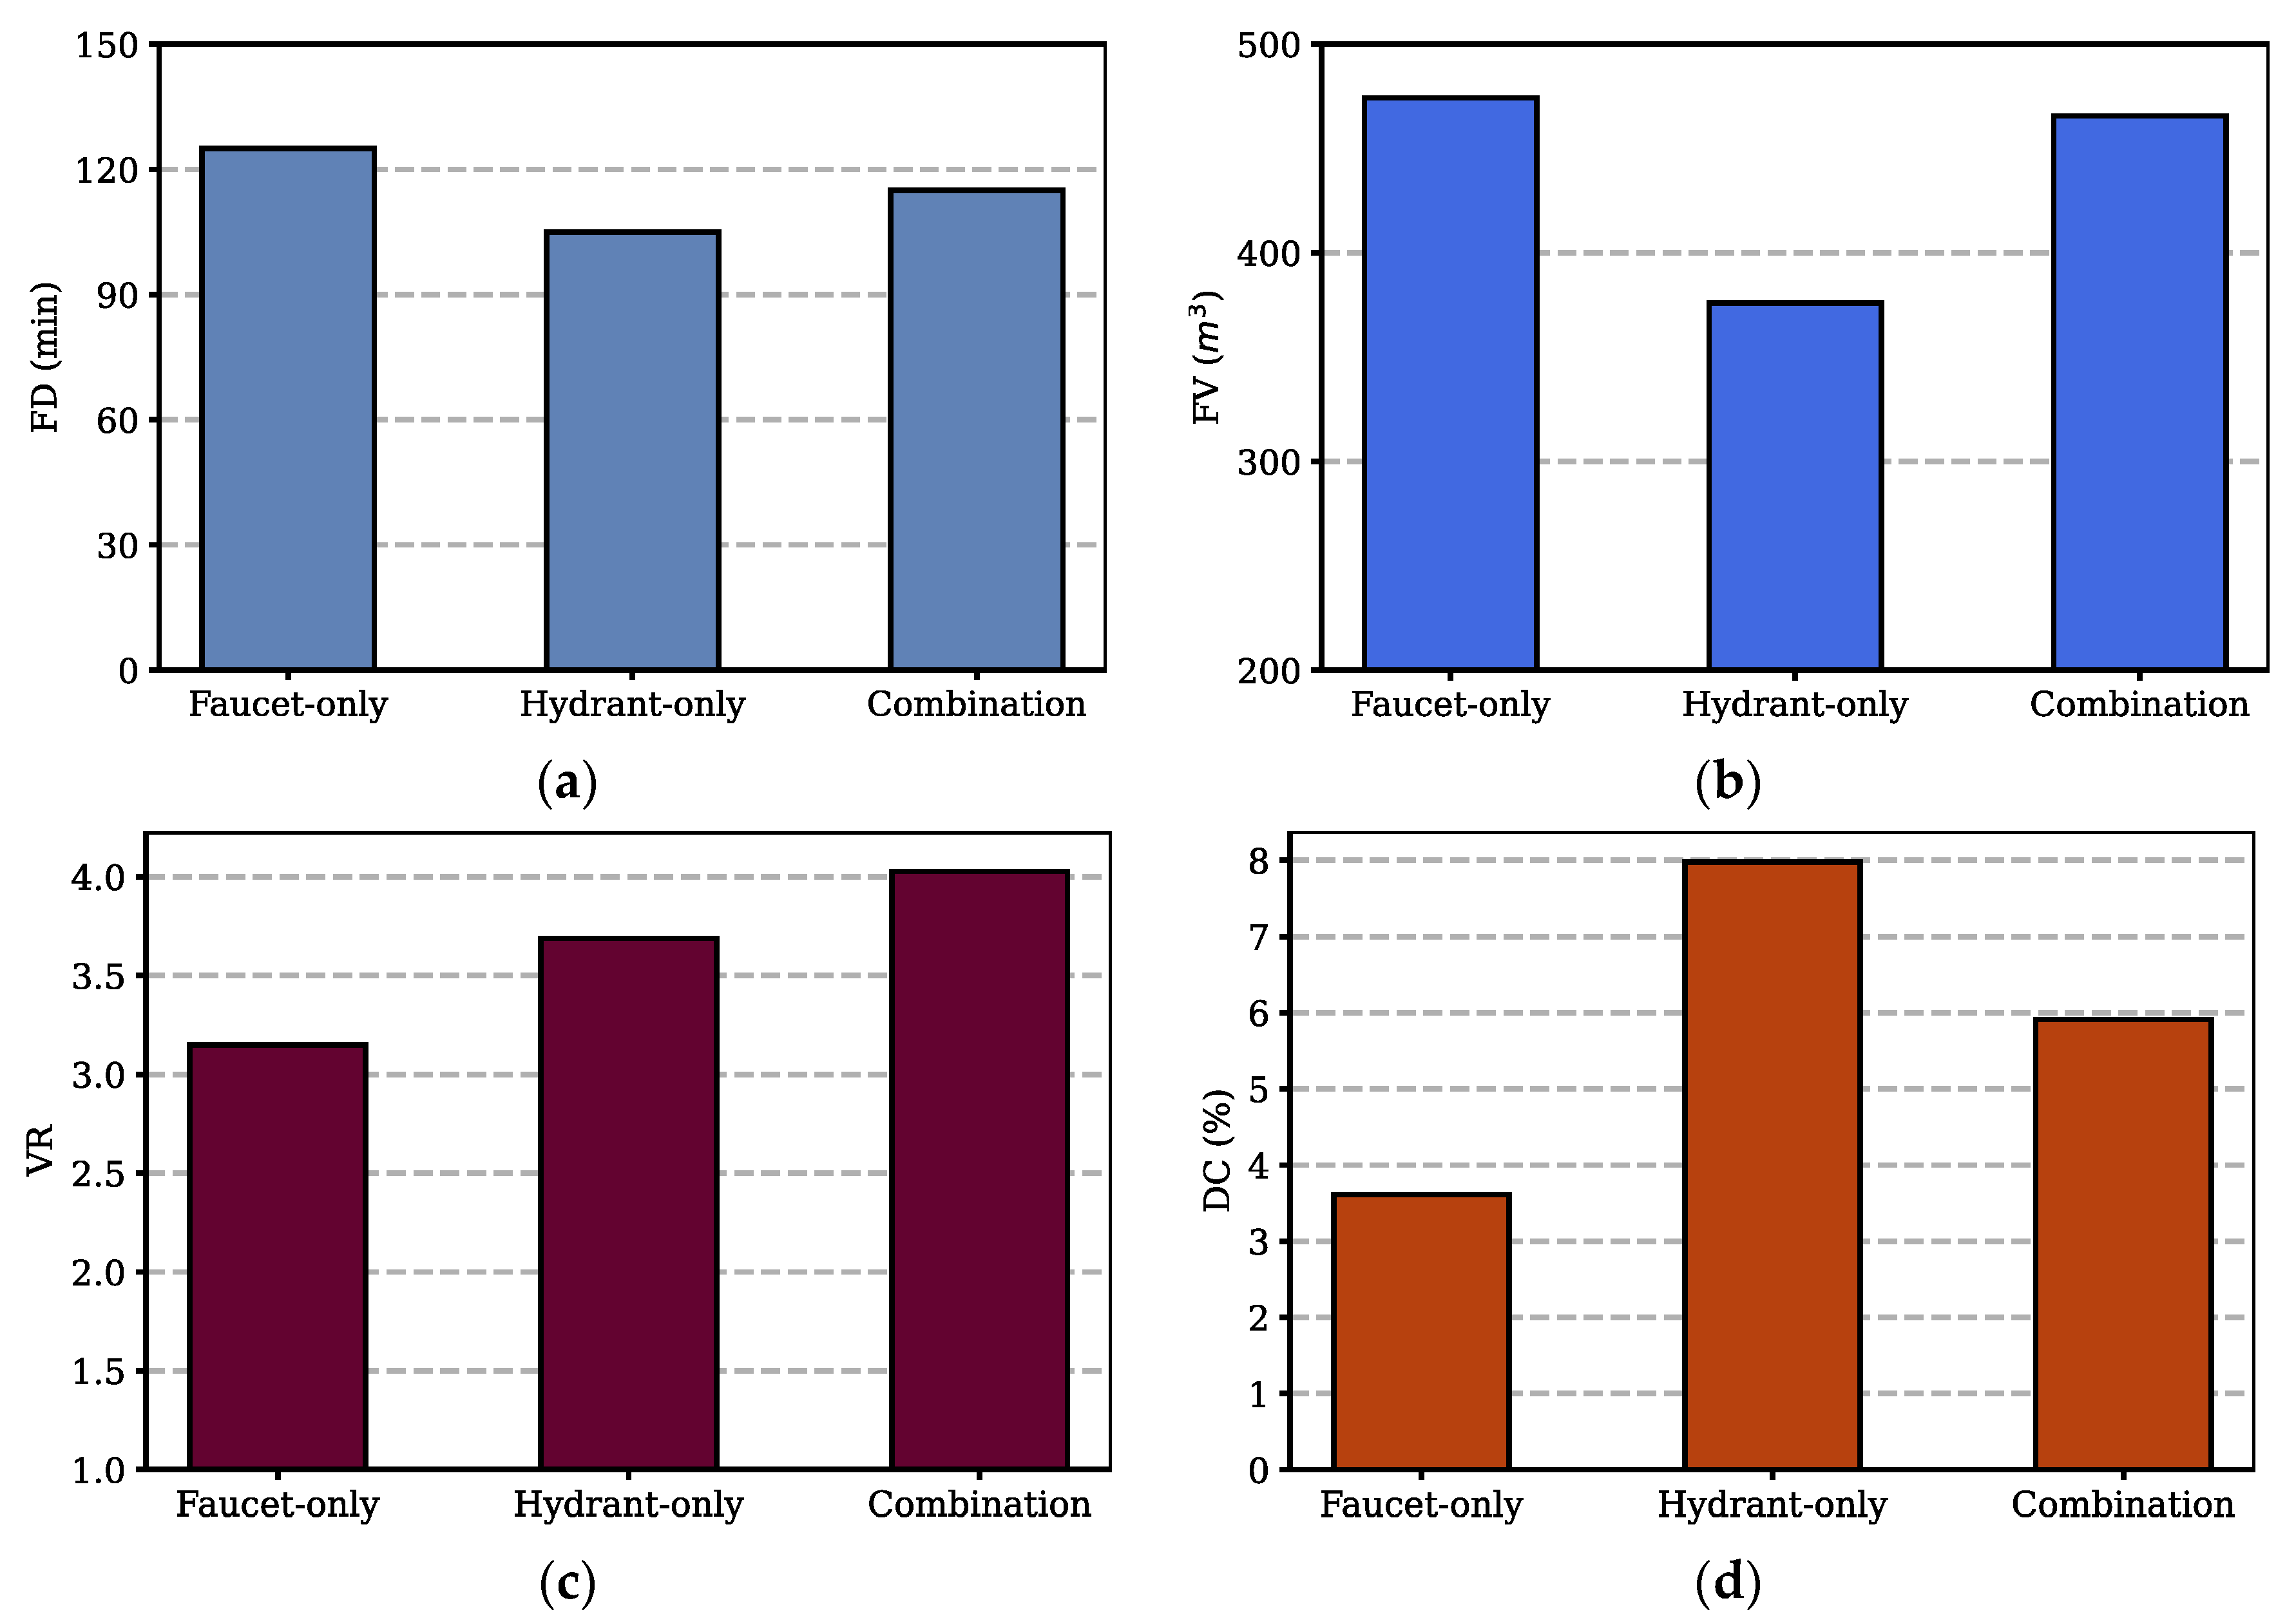
Table 3 and
Figure 8.
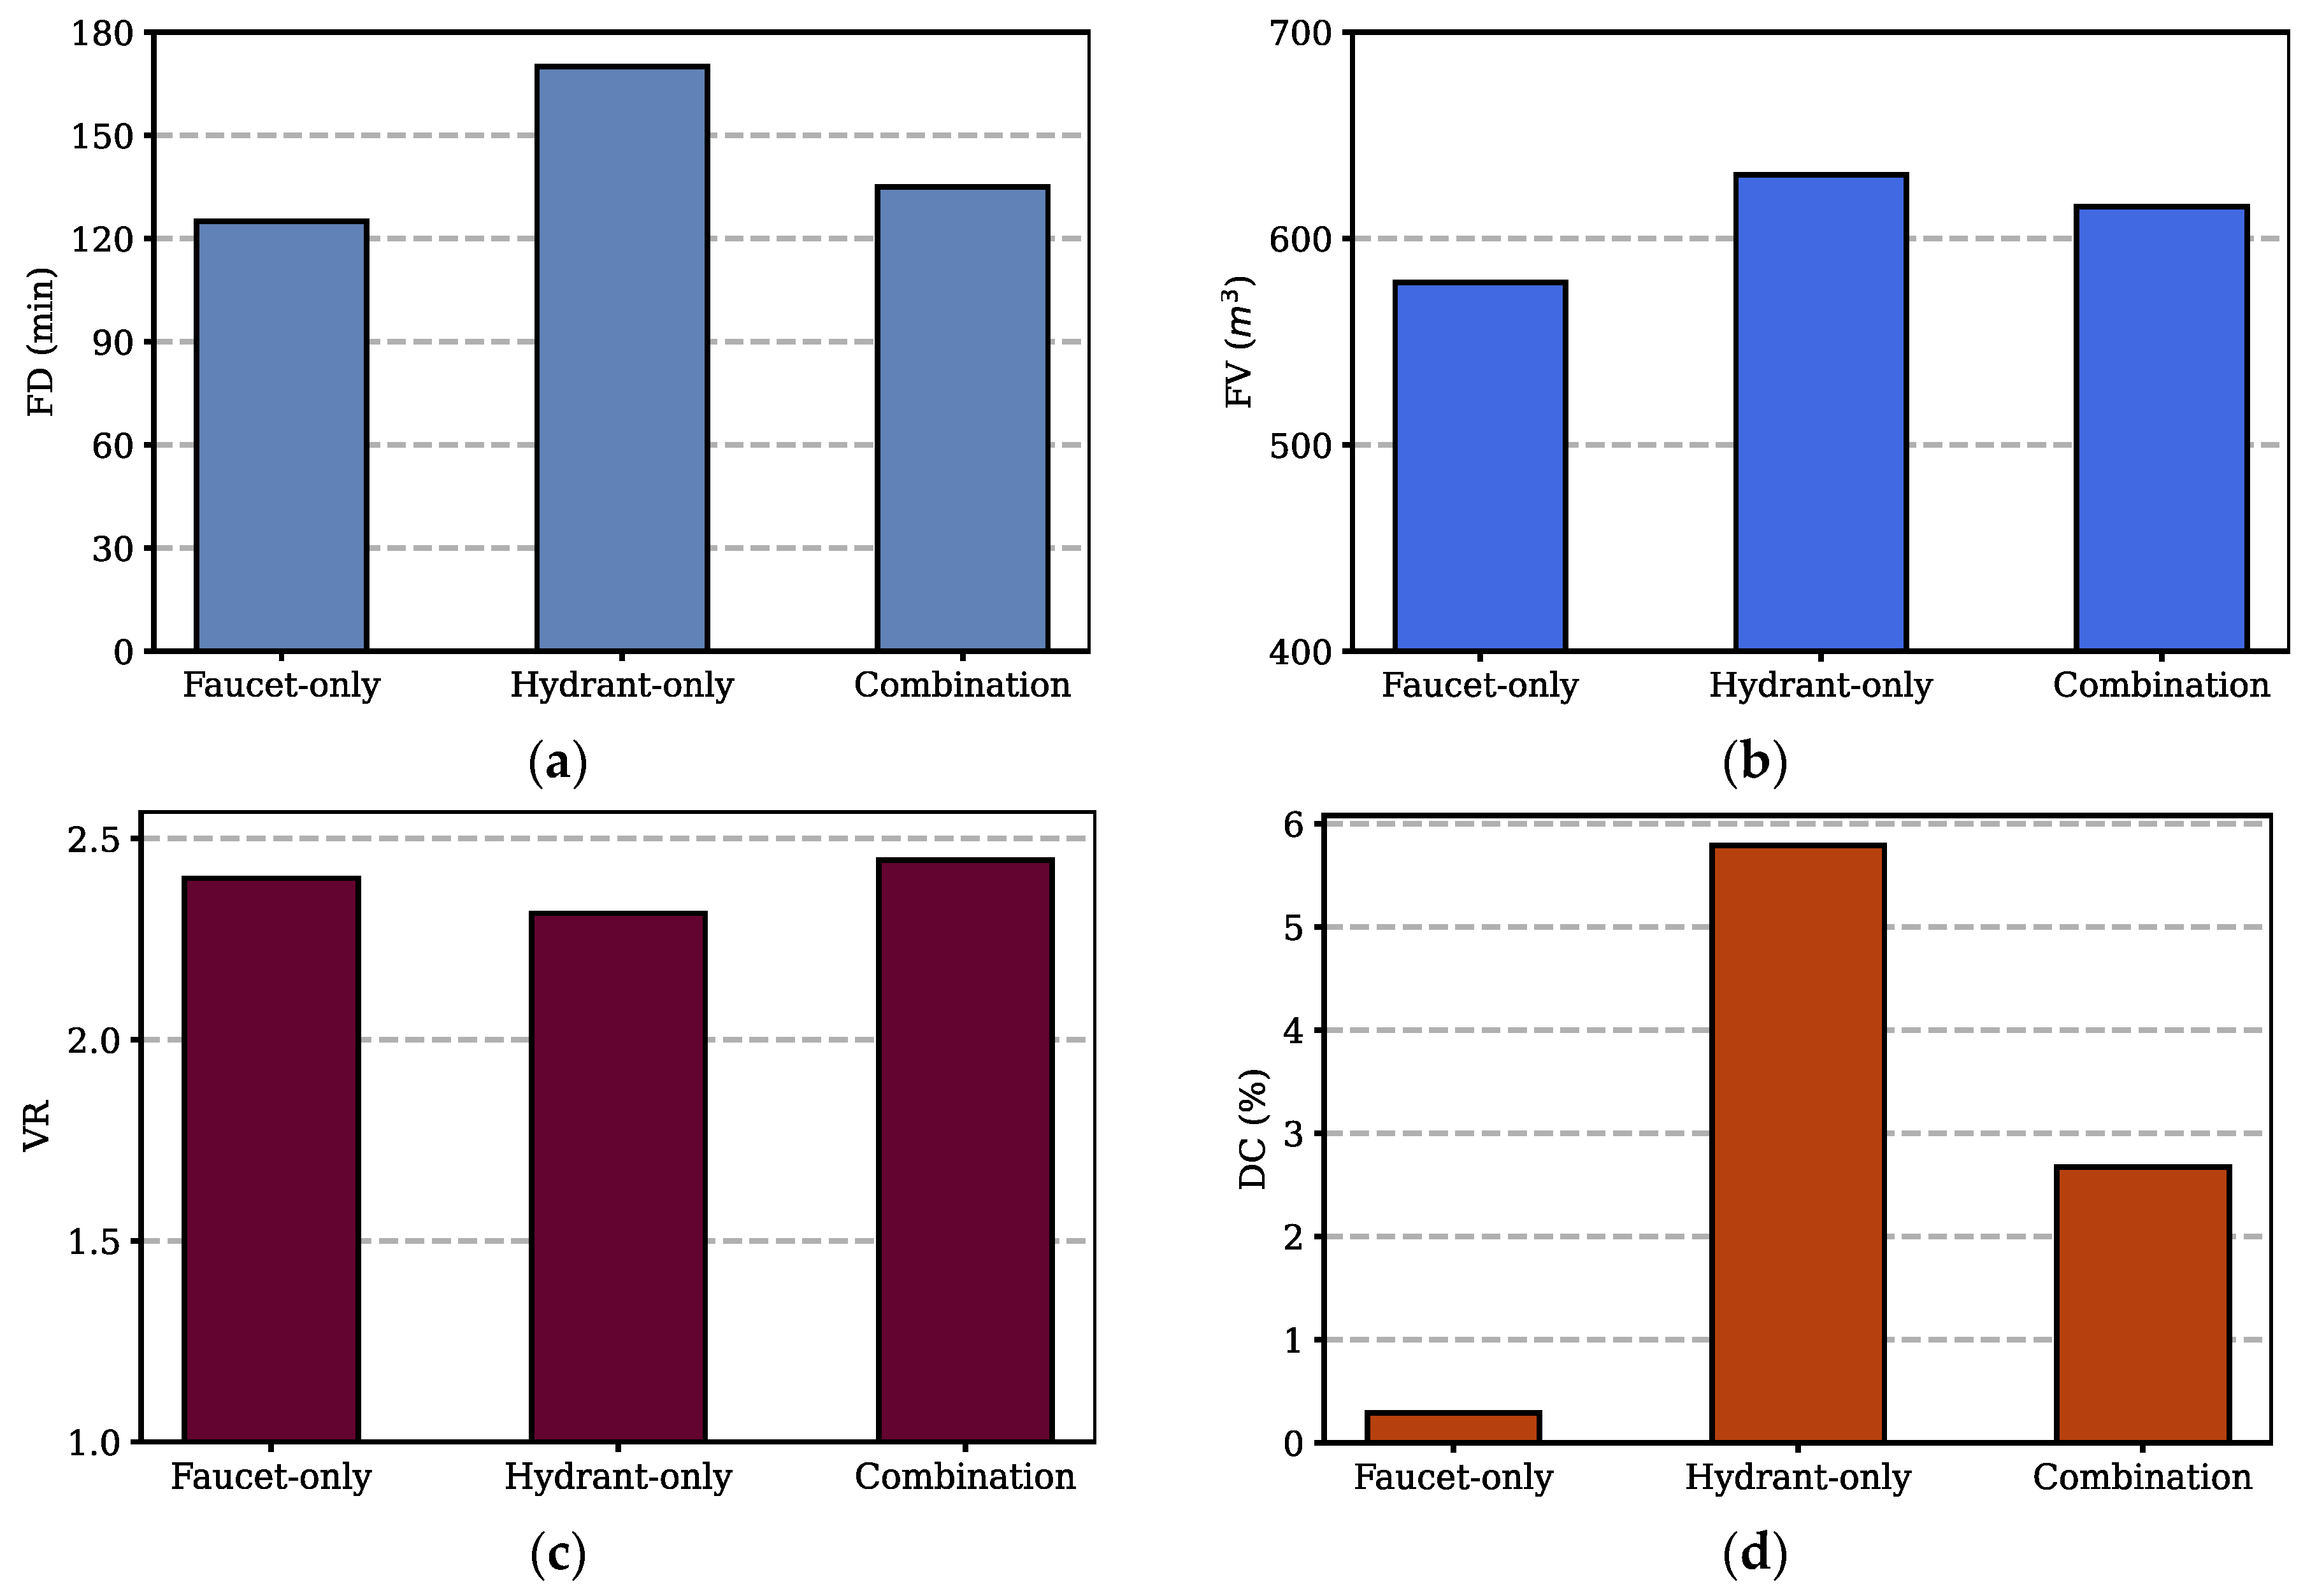
It is worth noting that for all evaluation metrics, the lower values indicate a better flushing performance. A slight difference was found in the FD for all schemes. The hydrant-only scheme has the shortest duration (1 h and 45 min) compared with the faucet-only and combination schemes, which take 20 and 10 min longer, respectively. There was a more apparent difference in FV. There are only two outlets in the hydrant flushing, where the contaminant was discharged and immediately closed when the flushing was over. The faucet flushing scheme has many scattered outlets connected from upstream to downstream. Following the coordinated command, all the faucets were opened and closed at the same time. During flushing, the upstream area will be free of contaminants first, but the faucets are still open and discharging, thus leading to more water waste than the hydrant-only approach. VR is directly related to the discharging flow rate. A higher flow rate will result in a higher VR. Faucet flushing has a lower flow rate at multiple locations compared to the concentrated hydrant flushing. The combination method employed the same hydrants, but with the addition of faucets, and the highest flow rate was produced among the three schemes. The DC shows a stark difference when the faucet- and hydrant-only schemes were compared. There is a minor change in the flow direction when the faucet-only scheme was employed; owing to the spread of the outlet in the sector, it acted more similarly to the normal condition. Conversely, hydrants caused a significant change in hydraulics owing to the focus on the very high flow on only two outlets. The combination method produces results for all metrics except for VR, which ranks in the middle of the range of outcomes (compared with the outcomes of the other two schemes).
3.1.2. Performance Comparison for Net-B
Net-B is a hybrid looped-branch network. The network mainline is structured as a single encirclement with extended branches wherein smaller pipes are hanging. The encircled area and the hanging areas comprise seven sectors. By analyzing the energy and delivery sequence of water, the lowest energy node was in sector 7. In addition to the lowest energy node, several dead-end nodes were located in the branch part of the network. The layout for both sectors and the delivery sequence of Net-B are shown in
Figure 9.
The test starts with only Sector 7 as the base performance. The subsequent comparison was created by the combination of connected upstream sectors. After performing the preliminary tests, three sectors (Sectors 5, 6 and 7) were selected to participate in the faucet flushing scheme. Hydrant flushing employs two hydrants in Sectors 5 and 7. Due to the existence of dead-end nodes, the pipes that are delivered to these nodes will not be drained by the hydrant. Therefore, the simulation is conducted until the safe threshold concentration is met in the network except for the dead-end pipes. In the combination flushing, the same hydrant position is used again, and the faucets are located in Sectors 5 and 7, with the exception of the mainline. Once again, this decision was made to preserve the pressure of the system. Note that several additional faucets are opened in the hanging parts owing to dead ends.
Figure 10 shows the outlet locations for all schemes, and the simulation results are presented in
Table 4 and
Figure 11.
For Net-B, the application of faucet flushing exhibited the best performance in all metrics, except for VR. Faucet flushing was 45 min faster than hydrant flushing and 10 min faster than combination flushing. The FV achieved the same ranking; the difference from lowest to highest was 52 m3. In this hybrid network, outlets at the branched parts were more effective in draining the contamination. A hydrant imposes a greater demand when used. In this network, opening another hydrant will cause considerable pressure loss. Thus, it is difficult to achieve the optimal flow and pressure using hydrants only. Conversely, faucets generally impose lower flows and are more widely available. The highest flow rates were produced by the combination scheme, followed by the faucet-only and the hydrant-only schemes. Faucet flushing preserved the normal flow direction of the network better, while hydrant flushing changed the flow direction in 5.79% of the total pipe length. Combination flushing produces a result that ranks as average in comparison with the results of the other schemes.
From the simulation results for both networks, it is observed that the faucet flushing scheme is comparable to the conventional hydrant flushing scheme. In terms of FD and FV, faucet flushing performs slightly worse in Net-A but better in Net-B. However, for both networks, faucet flushing produced a lesser flow direction change in pipes. Hence, when the conditions are appropriate, faucet flushing can be considered as a suitable option in the decontamination procedure.
3.2. Effects of User Participation Rate on Faucet Flushing
The faucet flushing scheme relied on the user to participate in flushing, therefore, their compliance will significantly impact flushing effectiveness. Users may be absent from the faucet location because they are outside for work or for other reasons. A reduced number of opened faucets will reduce the flushing flow rate, which will impact the flushing scheme’s effectiveness. The effect of this possibility is analyzed for the faucet-only flushing scheme in the two networks. The user participation rates were randomly reduced to assess this effect, and Monte Carlo simulations (MCSs) were conducted. Four minimum participation rates were chosen as 0.9, 0.8, 0.7, and 0.6. A participation rate of 0.9 implies that a node with
n faucets could have (0.9–1.0) *
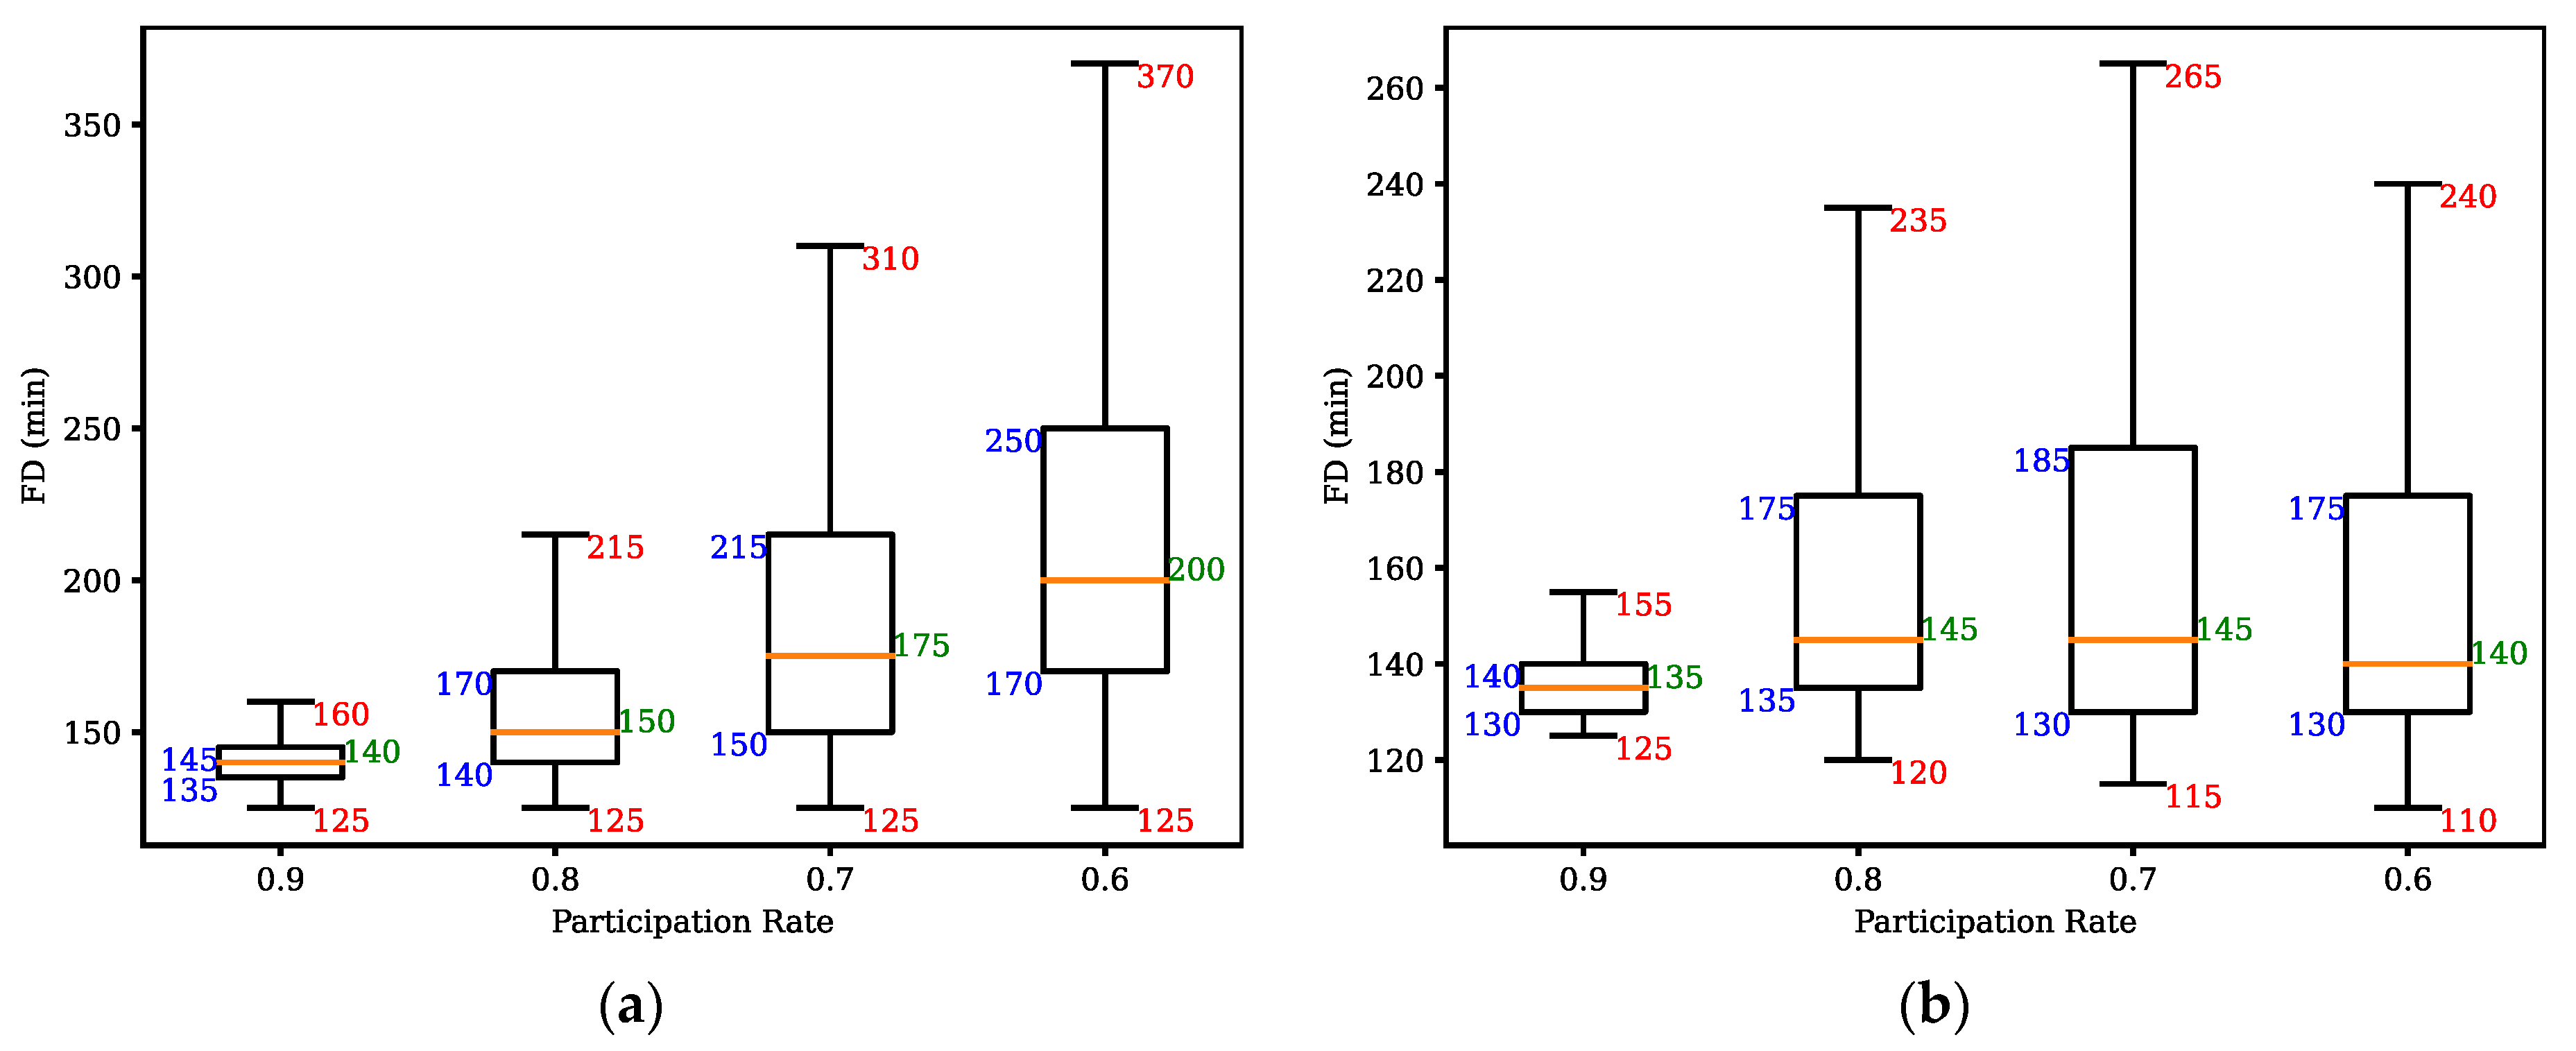
n opened faucets for the flushing simulation. The number of samples for the MCS was 1000. The only efficiency metric considered in the analysis was FD, as FV is proportional to it. VR depends on the flushing flow, and reduced participation will cause reduced VR in turn. Using the same outlets but with different demands did not cause much change in DC. A summary of the results of this analysis is presented in
Figure 12.
Figure 12a shows that the median and deviation of FD in Net-A tend to increase as the uncertainty of the user participation rate increases. The increasing median shows the expected behavior of a high possibility for the FD to increase with less participation under this uncertainty. All of the lower whiskers exhibit a value of 125 min, which is equal to the full participation FD. There is a possibility that the FD will take three times longer (i.e., 370 min) when the minimum participation rate of 0.6 is applied.
Applying the participation uncertainty to the hybrid network (Net-B) causes more variation in the results, as shown in
Figure 12b. As expected, the median and upper whisker values of FD increased when the minimum participation rate reduced from 0.9 to 0.8 and 0.7; however, both values decreased when the minimum participation rate was 0.6. Whilst the lower whiskers indicate a gradual decrease (i.e., reducing FD) as the participation rate decreases. Due to the rigid rule applied for choosing the participating area, it is clear that dividing by sectors did not produce the most effective flushing result.
Figure 12b shows that a more optimized result could be found if, for example, the participants are chosen via a node combination that produces a demand similar to the 0.6 participation rate’s samples instead of being limited by sector combination. A reduction in participation directly influences the variability of the results, as indicated by the increasing deviation, especially in the upper whiskers.
The behavior after applying a 0.6 participation rate in Net-B was analyzed in more detail. It is found that the configurations that produced a lower whisker value of 110 min are similar in that the upstream Sectors 5 and 6 have a lower participation rate compared to the downstream Sector 7. Under a full participation rate, the participating upstream sector was cleaned first before Sector 7 was cleaned. Thus, if we classify the FD by sectors, the upstream sectors should have a lower FD than the downstream sector. If fewer participants were in the upper sectors, there would be more available pressure on the downstream sector, allowing for a higher flowrate. Hence, it is possible that when lower upstream participation occurs, the upstream FD will increase, and the downstream FD will decrease, balancing to a lower value compared to full participation. This behavior is further analyzed in the following section.
3.3. Effect of the Closing Initiative
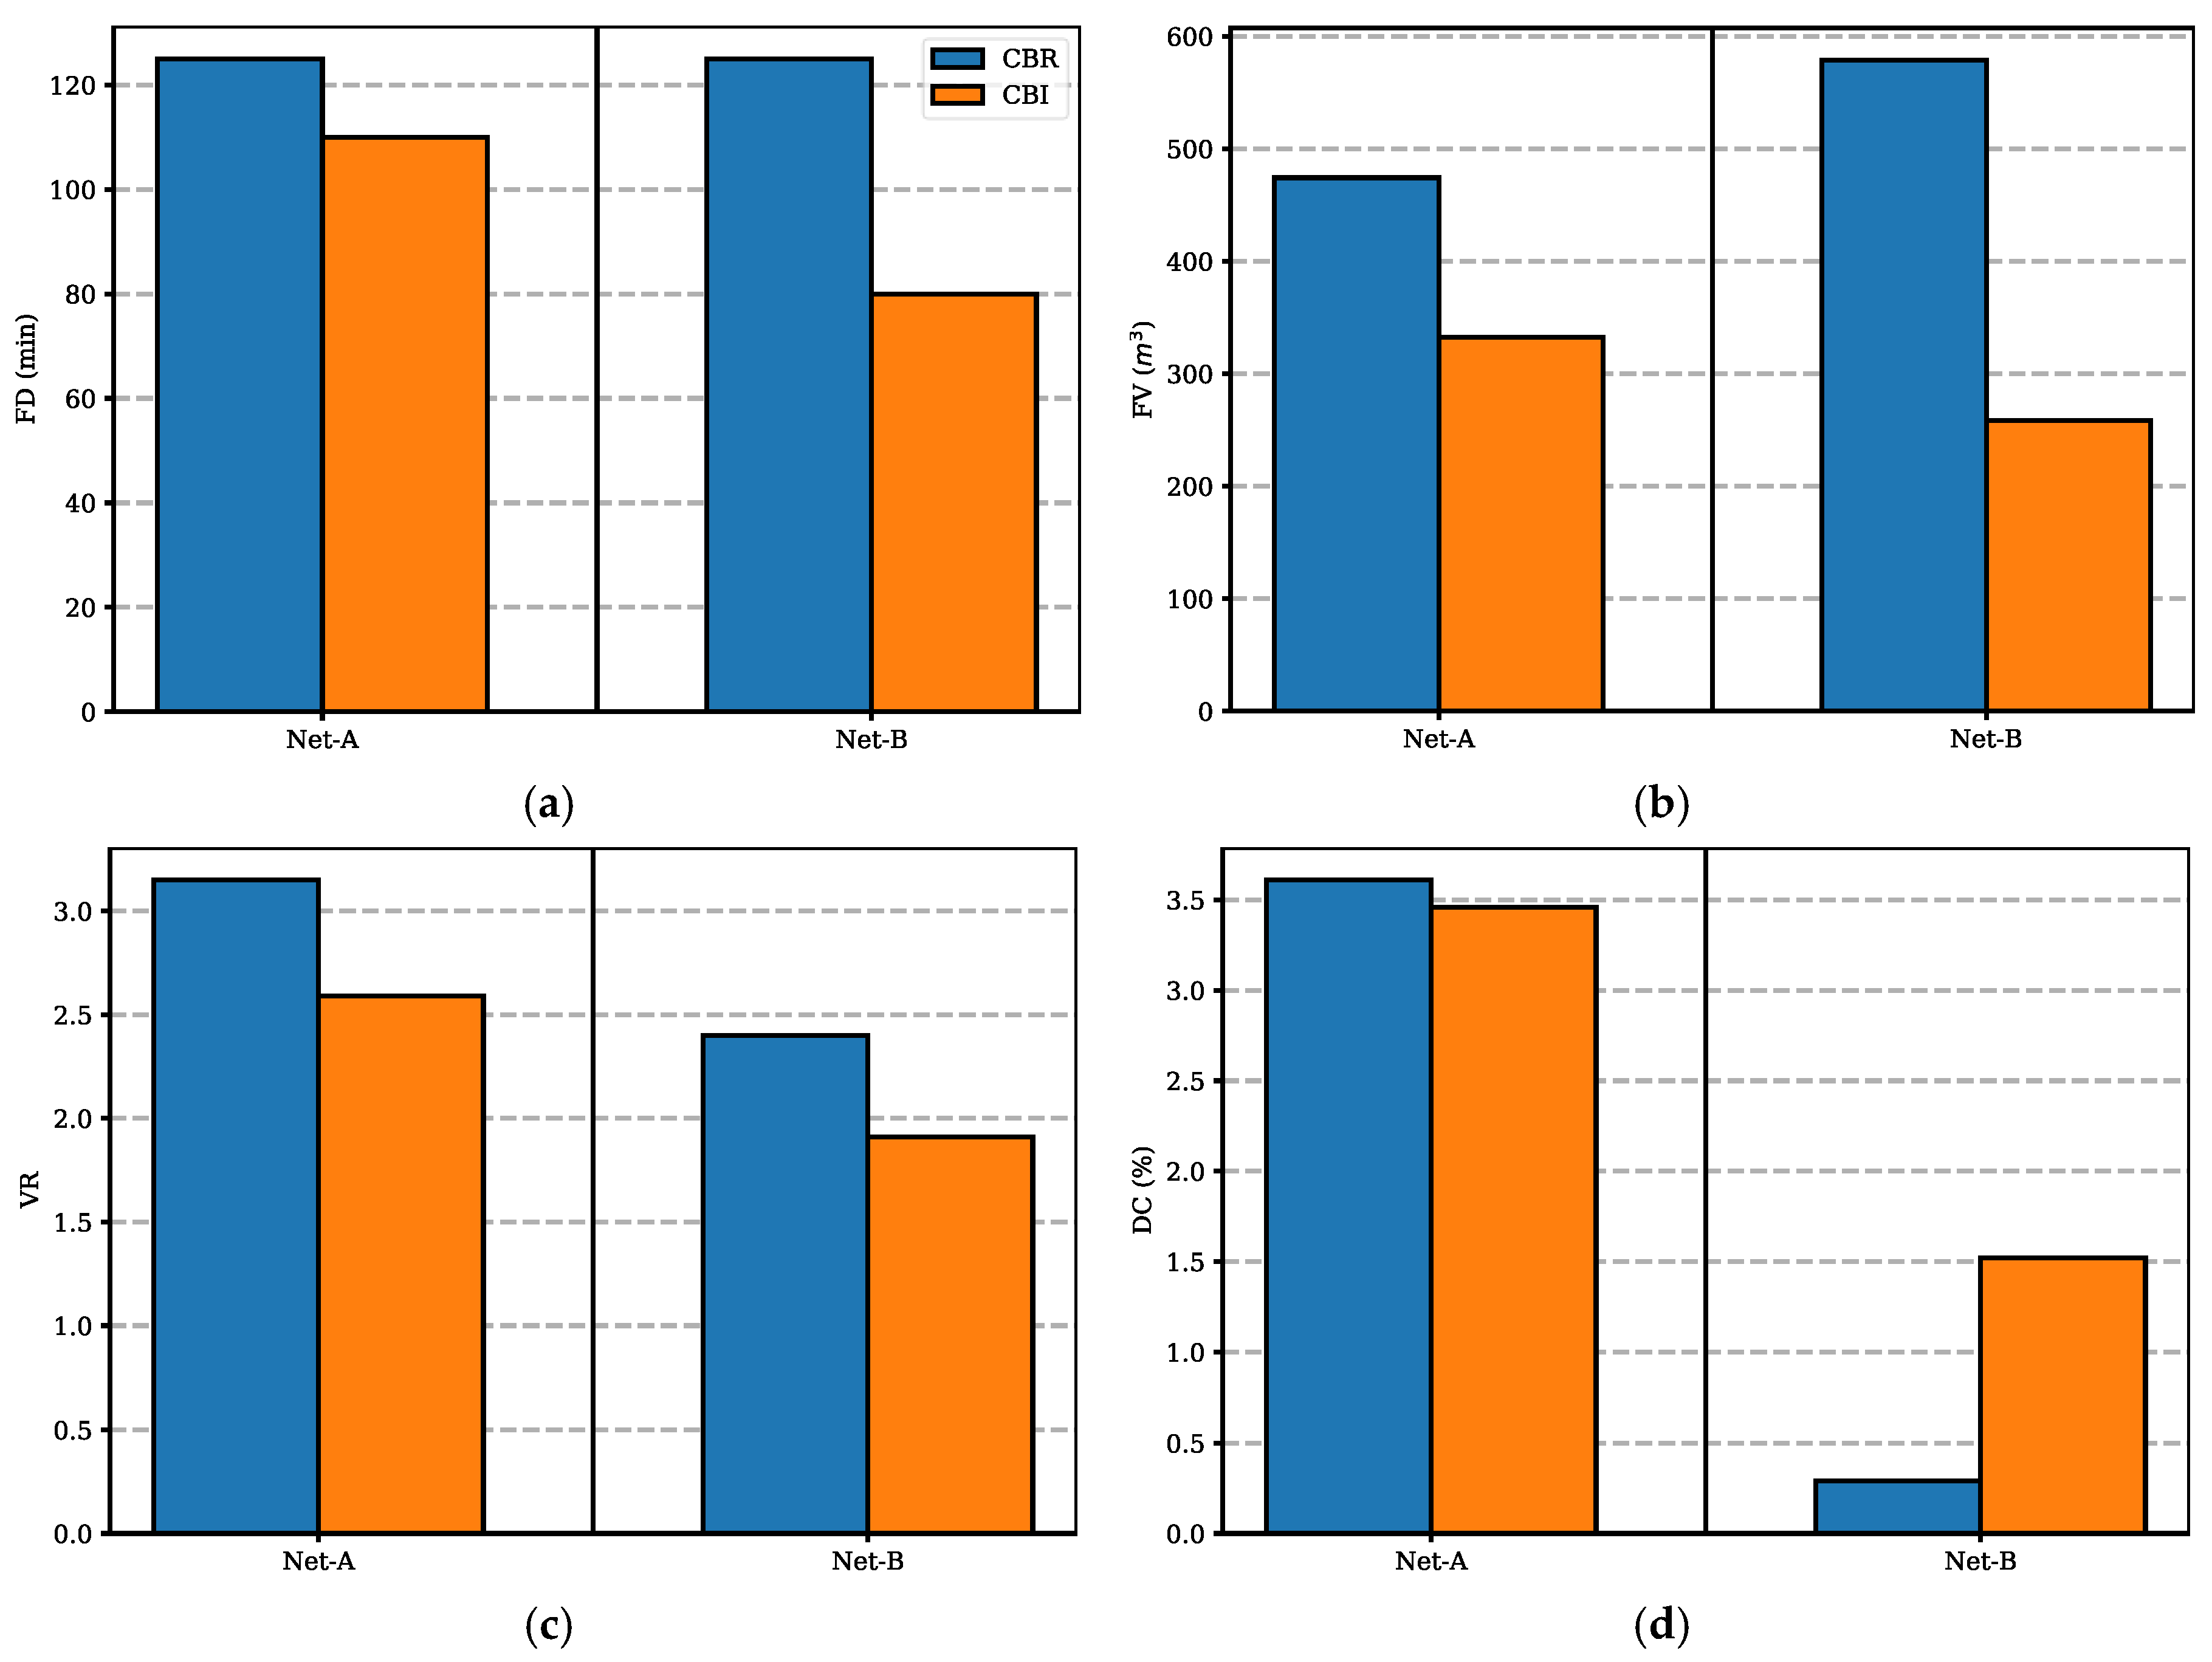
The flushing simulation conducted in this study followed the rule that all outlets are controlled simultaneously to open or close according to the designated time. However, it is more appropriate to close the outlets when the outflowing water reaches an acceptable water quality in actual conditions. While there was no way for household residents to know the water quality, except for color and smell, there are cases wherein color and smell are sufficient to determine the safety of the water, such as red-water contamination. When the condition is appropriate, household residents should close their faucets at their initiative. Therefore, another simulation was performed to reflect the effect of the closing outlet when there was no more contamination from the concerned outlet. The simulation was conducted using the same networks and scheme (i.e., faucet-only) as described in
Section 3.1. A comparison of the results from the close-by-regulation (CBR) and close-by-initiative (CBI) flushing is summarized in
Table 5, and a visual comparison is provided in
Figure 13.
Regarding the efficiency aspect (FD and FV), the CBI always performs better than the CBR. This effect is more apparent in Net-B owing to its hybrid nature. The water flow path is limited; hence, some upstream pipes will have a large load because they serve many downstream locations. The load is reduced with the closing of cleaned nodes; thus, flushing downstream becomes more efficient as more upstream nodes are closed. The amount of FV improvement was also greater than that of FD, as now there is no wasted water on already cleared nodes.
The safety aspect (VR and DC) in the CBR flushing was quantified as a single value because the hydraulic conditions did not change during the flushing. In the case of CBI flushing, however, the hydraulic conditions changed over time due to the outlets being sequentially closing. Hence, the value was evaluated at every timestep, and the time-averaged value was estimated. The VR in CBI flushing will initially have the same value as that in CBR flushing. However, it will naturally decrease as more outlets close. Therefore, all VR values in the CBI simulations are lower. The DC for both networks was already small at below 5%. Although Net-A shows an improvement of 4% in CBI flushing, it only translates to a 0.15% reduction in the DC rate from the original value. This result is mainly caused by the pipes whose direction changed in CBR flushing and returned to their normal flow direction when the hydraulic conditions changed by closing the cleansed nodes. The CBR flushing for Net-B showed almost no change in the flow direction, however, applying the CBI deteriorated the DC by 416%, which nominally translates to only a 1.23% increase in the DC rate, still performed better than the hydrant-only and combination flushing schemes. Upon close inspection of the CBI flushing on Net-B, the pipes that exhibited a direction change were found in the upstream looped area. Due to the various relations that affect the water flow path in the network, as more nodes remove their demand, the flow path increasingly differs from the normal demand distribution condition. Flow direction changes mainly occur on the looped part when a node or connection to branch parts is supplied by more than one pipe; when that node or connection closes the demand, the flow in the loop section will shift to the side that still needs to be supplied.
Considering the benefits of CBI flushing, as long as the flushing water quality can be assessed visually, it is considered safe and effective for customers to close their faucet by initiative. There is minimal risk of the contaminant circulating back because faucets are closed starting from the upstream area, and clean water is continuously delivered from the source.
4. Conclusions
The viability and effectiveness associated with the use of faucets as decontamination outlets were examined in this study. Faucets are presented as an option instead of the conventional method of using hydrants. This method is deemed practical considering the growth of communication technology; customers can be coordinated to control their faucets. The proposed method is evaluated by applying it to two DMA-scale WDNs with different characteristics. Three flushing schemes were compared: faucet-only, hydrant-only, and a combination of the two. The faucet flushing strategy was incorporated in the simulation by first dividing the networks using a simple rule, then determining the flushing sectors based on trial-and-error to identify the most effective configuration. The effectiveness was evaluated by measuring efficiency indicators (FD and FV) and safety measures (VR and DC).
The flushing outlet locations were configured using a simple network division rule based on mainline pipes, which were then optimized through trial-and-error. The faucet flushing scheme was shown to be capable of fully draining the contamination in both networks and exhibited a performance comparable to that of hydrant flushing. Faucet flushing performs better than hydrant flushing in terms of FD and FV in the hybrid network with limited flow paths. In terms of safety, faucet flushing performs better in preserving the normal network condition during the flushing period. The combination method consistently resulted in a measurement value between the faucet- and hydrant-only schemes, except for the VR value, which directly correlates to the amount of demand and was higher using the combination scheme. As the faucet flushing scheme depends on user participation, an analysis of the effect of participation rate with FD was conducted using the MCS method. Generally, there is a strong possibility for the FD to increase as the participation rate decreases. However, some small amounts of the samples observed a lower FD, which can be related to participant distribution in the network. A decrease of participants in upstream sectors could benefit the downstream sectors in creating a balanced cleaning time. Another analysis was conducted to quantify the effect of customers adopting the initiative of closing their faucets earlier than the regulation based on their judgment. Compared with the CBR flushing, the CBI flushing always resulted in better performance metrics, and it is especially more prominent in reducing the FV. Hence, if the contaminant can be visually assessed in actual conditions, customers’ closing of faucets should be granted. These results show that faucets have the potential to be used as the main draining outlets for contamination flushing and have comparable benefits to the hydrant flushing.
This study was based on many assumptions and simplifications because the main focus was to assess the applicability of the faucet flushing scheme. The practical application of this scheme should be explored in future studies. A more detailed, yet fast and practical, rule or method to divide the sector could be developed so that simulations can be conducted efficiently, as it was found that it is possible to reach a better performance when the faucet flow rate changes. Social factors, such as user compliance and attention, could also be studied to predict a more accurate user response, in turn creating a more realistic scenario.
