1. Introduction
In the academic departments of science and engineering at universities, the phenomenon of students dropping out from the most demanding subjects occurs much more frequently than ever before [
1]. In most cases this is triggered when students are asked to show their competence by solving a complex problem in a particular engineering subject [
2]. This situation is aggravated when the student must utilize concepts and knowledge from more than one engineering subject. Complex problem solving has topped the list in both the 2015 and 2020 World Economic Forum (WEF) report presented in its five-year report on most desired job skills, focusing on cognitive aspects [
3].
In Engineering, it is common to present problems that are related to real situations for training or evaluation. Tasks such as design, optimization or application of different mechanisms (whether they are pulleys or gears in vehicles or industrial machines) are commonly included in highly difficult engineering situations that can represent a challenge for most students [
4].
The relevance of practice in engineering education has been documented. Brumm et al. found that 90% of engineering graduates who had cooperative experiences were practicing engineers, compared to only 54% of graduates from 1996 to 2009 who had no experiential education [
5,
6]. In addition, practice-based activities could enhance students’ job skills, work experience, and teamwork [
7]. These promote mentoring and less superficial learning [
8]. Among the different tools and techniques used so that students have experiences of solving real cases, when conditions are risky, are their simulations through specialized programs [
9].
Contemporary life in the workplace is increasingly demanding. Engineering graduates are under heavy pressure to learn how to solve problems fresh out of college. Although one of the problems in the application of the Project-Based Learning (PBL) strategy within the subjects that addresses real issues, cases and situations, is that they are decontextualized to be an effective training [
10]. In addition to the above, studies have been carried out in which it is essential to consider professional training in engineering, considering its scientific basis as a fundamental part [
11].
Regarding the mentioned high-difficulty engineering problems, multidisciplinary subjects are needed to provide an accurate solution, such as physics, mechanics, ergonomics or materials science, to name just a few. Taking into consideration that engineering problems of high complexity ultimately lead students to desert before having a complete solution to the problem in question. Desertion often generates frustration that slows down the teaching and learning process, additionally, in critical cases, the desertion concludes in the termination of the student career due to a great loss of motivation [
2].
Considering the above, the research objective of this work is to explore the results using a four-step methodology that aims to help students find a well-organized, coherent and efficient solution to highly complex engineering problems.
The general objective of this research triggers to study and validate hypotheses about how the four-step methodology could improve student performance and reflect higher levels in their proficiency assessments. In doing so, the findings will guide the authors in future studies to discover how the method could be correlated with a significant decrease in dropout from higher education STEM courses.
In order to design an automated tool to solve a significant set of problems we focus on the development of the fundamental steps in this task, which is based in the scientific method. These steps, in which is focused the present paper, were practiced by the students of the present study, while performing course contents during regular class sessions, in groups or individually, having access to the educator’s help to guide those who don’t apply it correctly. The path to reach gets the solution of complex problems can now be seen less hidden, that is, in the case it was obtained, the student outcome in this way has been developed. The intervention showed in the past sentence, is one strategy commonly in high school and lower grades, nevertheless has showed good result at university [
12,
13].
Section 2 presents the review of the literature on the development of competencies in complex problems and how this is a relevant topic, especially in Science, Technology, Engineering and Mathematics (STEM) courses. Furthermore, the relevance of education is discussed, particularly for the competence of solving complex problems in today’s society.
Section 3 describes the methodology and experimentation with the student population. In
Section 4 the results are presented, before and after the application of the method, using the different statistical tests to validate the analysis. Finally,
Section 5 shows the conclusions of the experimental results obtained, in accordance with the hypothesis presented at the beginning of this work.
2. Relevance of Student Outcomes in Engineering Education
In the development of societies, the emphasis on the role of education serves as a critical factor on a worldwide basis. Examples of forums in which different ideas and collaborations on education are: summits of world organizations such as United Nations Educational, Scientific and Cultural Organization (UNESCO) and Economic Commission for Latin America and the Caribbean (ECLAC); conferences specialized in education as Educon from the Institute of Electrical and Electronics Engineers (IEEE), the Congreso Internacional de Innovación Educativa (CIIE), the European Conference on Education (ECE), etc.; and legislative congresses in different countries. These are only a small sample of different forums into which the relevance of education is mentioned, as it is a recurring theme, on the world agenda.
Talking specifically about education on the engineering field, there is a large number of definitions about engineering and STEM education, into which is important to identify the different dimensions that make it up to guide efforts in its study [
14,
15]. In the context of this article, engineering education is an activity in which a person acquires different skills with the objective of developing the ability to solve complex problems in science and engineering.
Engineering is classified as a region in which singularities are found, concepts from pure areas such as mathematics and physics are combined to solve specific situations in a realistic context related to the fundamentals reviewed in the theory [
16]. Furthermore, Bao et al. emphasize the relevance of paying attention not only to the pragmatic competences of a university degree, but also to the formation of high reasoning skills, without conforming to the most applicable part [
17]. Some factors internal to the undergraduate problem solver, both cognitive and affective, influence the development of problem-solving skills [
10]. Being from this study’s perspective, the different backgrounds with which they start university, time they have to get a correct answer, its interpretation, feedback where mistakes made are corrected, to mention a couple of them. According to Jonassen the three mainly individual internal differences that mediate the ability to solve problems are prior domain knowledge, prior experience in solving similar problems, and cognitive skills [
18].
Furthermore, teachers, as an empiric learning along years, have faced the experience where they find theoretical problems without a realistic and applied context, which, when solved by students, only a few are successful, and many of them drop out [
19].
Lee et al. [
4] report that students, in general, grow different strategies in order to solve problems, which could be resumed in the next steps: 1. to locate the related formulas, materials, and material properties to solve specific problems; 2. to use solved problems which are very similar to the one being studied, that could be situations where the same variable is asked; and 3. a desire to access external sources as a supplement or alternative to the textbook.
A good way for students to acquire required competences to solve complex problems consists in exposing them to real life situations [
19,
20]. In the last twenty years, students have greater access to information in digital broadcast media, and this amount is continuously growing; most of the information is related to leisure activities and general culture [
21]. The previous mentioned motivates the search for strategies in teaching-learning activities, that incorporate elements belonging to these new characteristics of the environment around the university student, refocused on gaining competencies within their scope of professional preparation.
Considering that, just as high-performance athletes require adequate training, an engineer needs to train their scientific logic thinking in order so that their results are significant contributions to knowledge and have the potential to transform their surrounding reality and the social sector [
22]. Therefore, giving the student the ability to carry out systematized activities that are part of the complex thinking that leads to the construction of knowledge [
23].
Due to the increase of distractors during last years [
24] and the number of dropouts in courses considered hard or difficult within the engineering area [
1,
25], it is of interest to focus special attention on pedagogical alternatives to be implemented within the classroom that would allow the student to reach intermediate goals and develop skills to achieve progress in complex problem solving.
3. Materials and Methods
3.1. The Four-Step Proposal Methodology
The four-step proposal methodology can be used in diverse STEM courses. The main objective is helpful to identify the phase(s) where the student usually fails when solving a complex problem. The process and method can help alumni to be able to improve their effectiveness and develop structure in their solutions, thus raising their performance regarding the resolution time (minutes) and score (0/100 points) and competencies in complex-problem solving.
Due to the findings in the literature review, described in
Section 1, a series of steps that the student goes through when approaching a problem are proposed, discretizing its solution. The method arises first from professors’ teaching experience and later on complemented by being collated doing literature review on methodologies focused on engineering problems.
Therefore, the following stages in
Section 3.2 and
Section 3.3 are summarized as a compilation of the practice of counseling that a teacher typically offers to a student when they ask for an assessment in tasks assigned within a subject, or by their own initiative, based on the search for metacognitive learning. After several iterations, these stages are presented in a sufficiently simple form that can serve as a guide solving a complex problem.
3.2. Stages of the Methodology
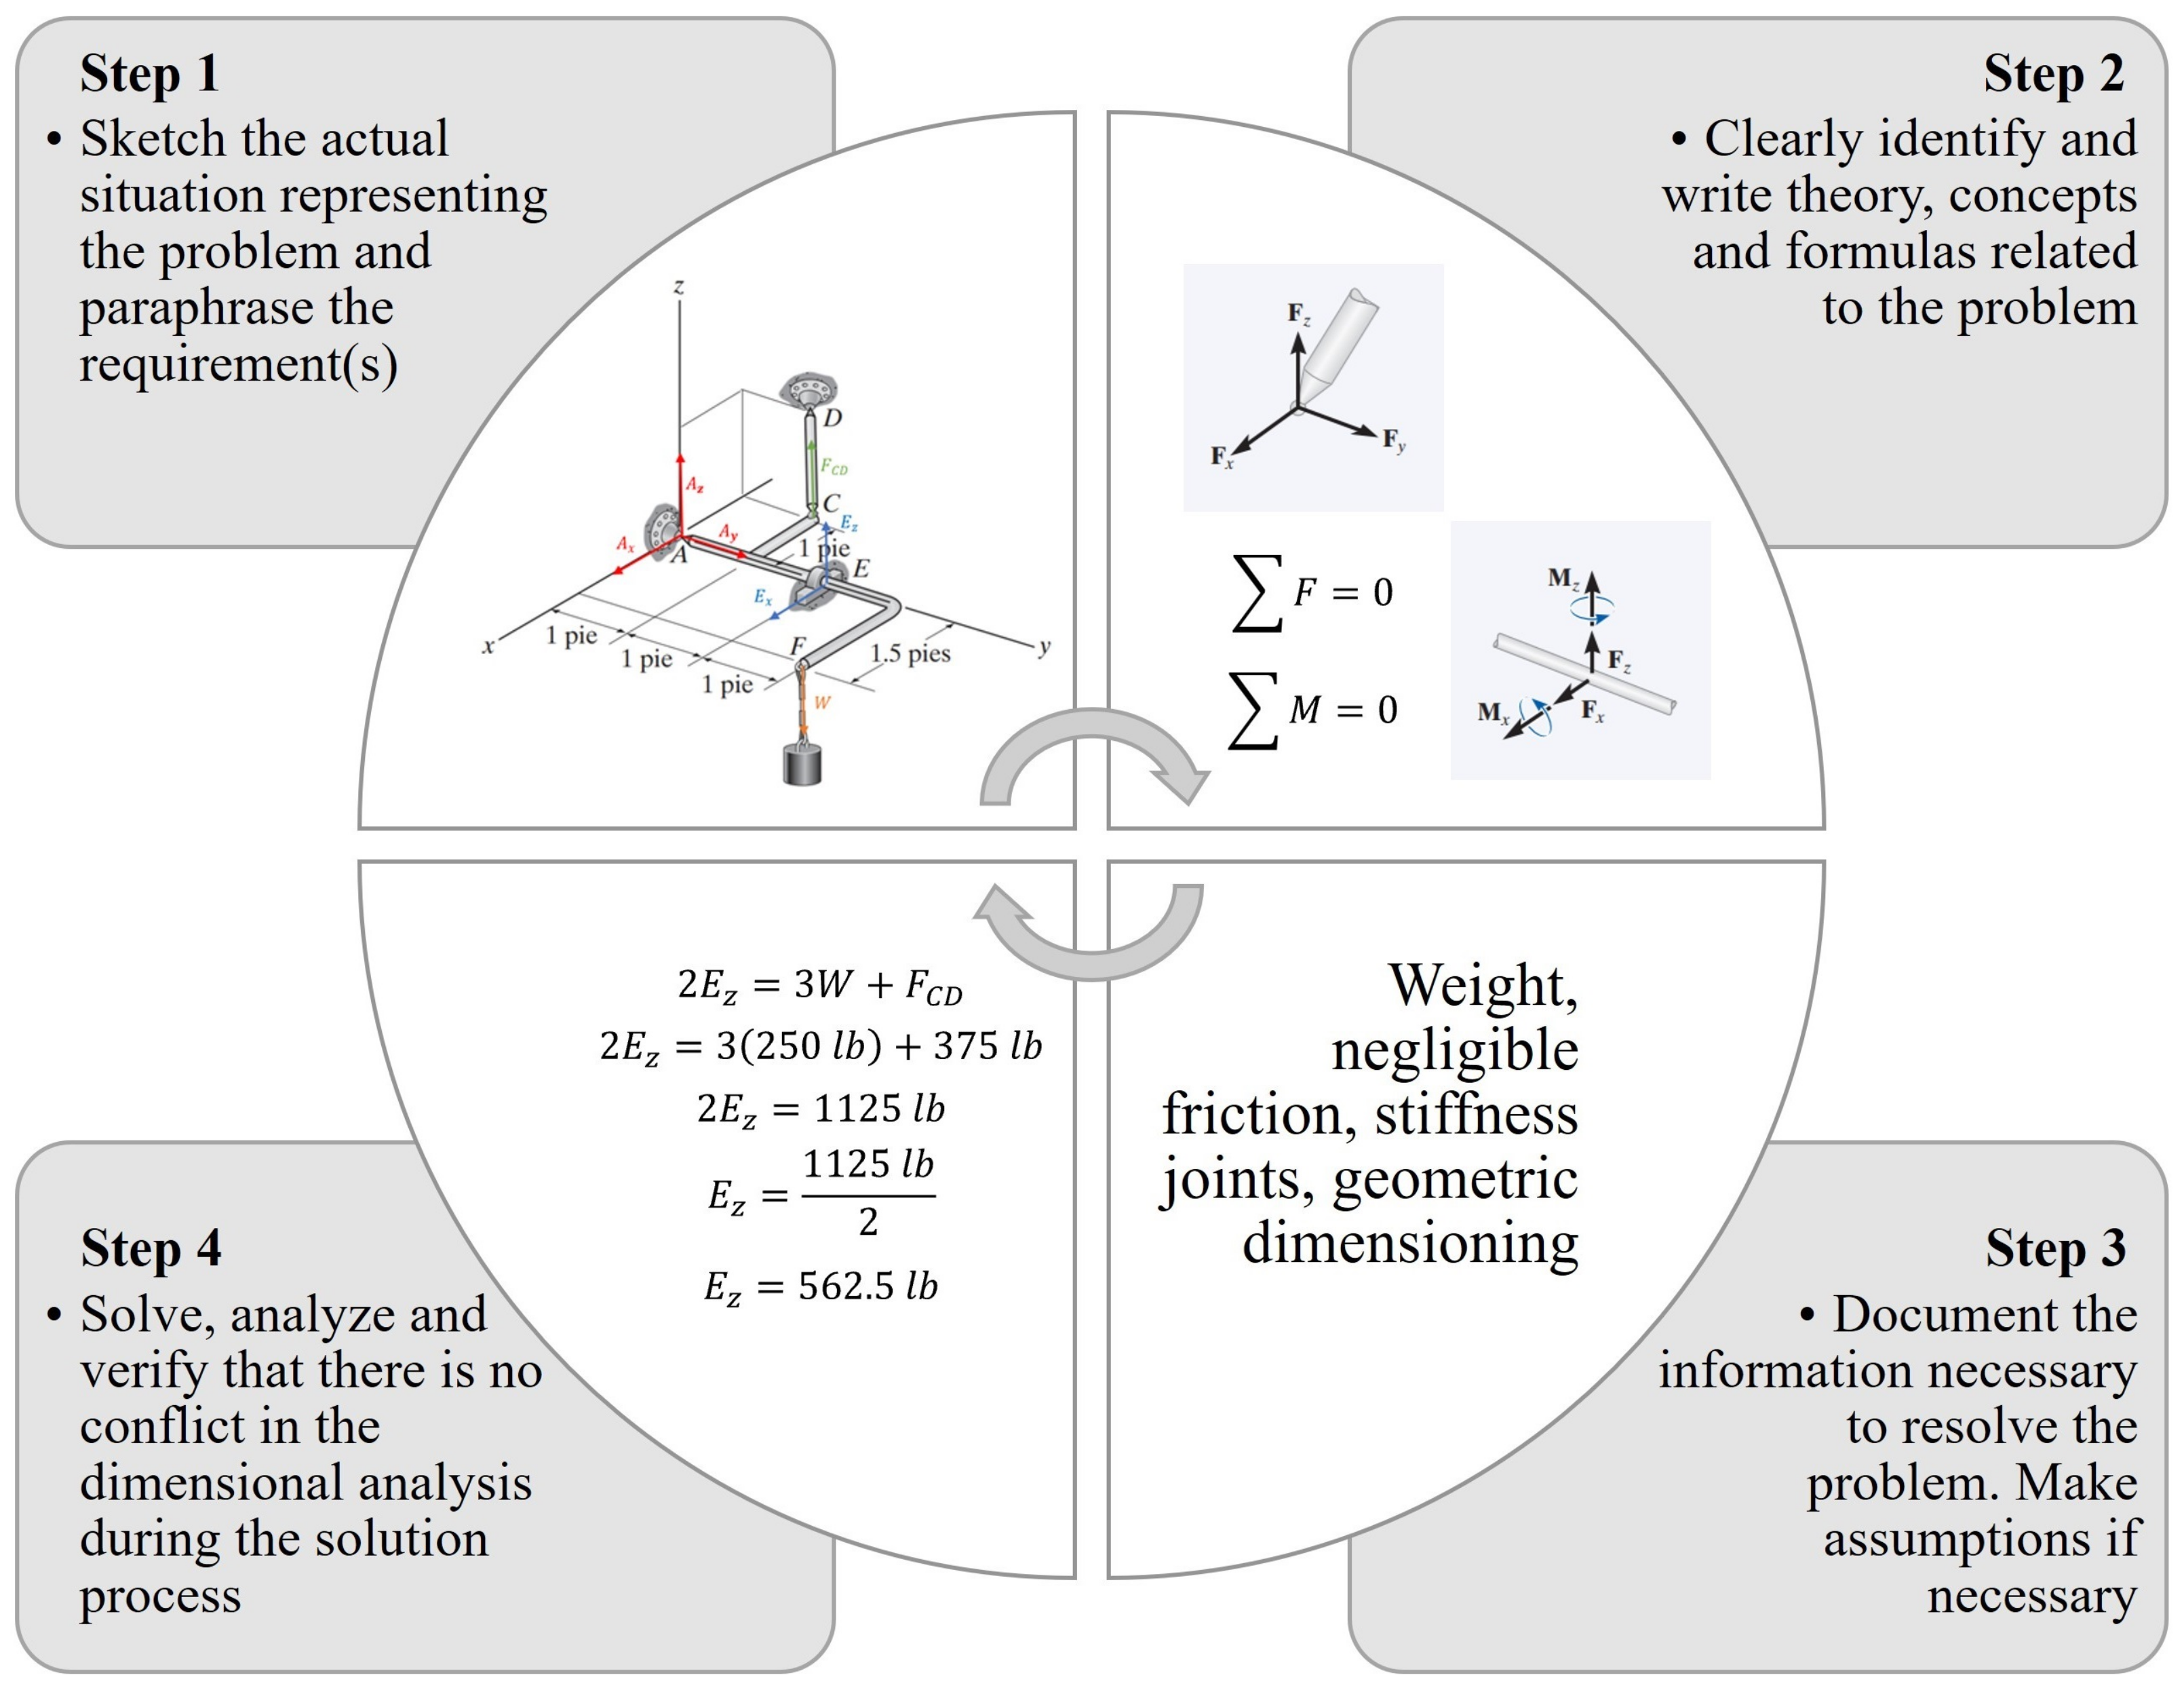
Even though reading the problem carefully, it is an inherent step when solving an exercise, thus necessary to show it explicitly. Most teachers find that at the early stages of problem solving a large number of students don’t do it. The foregoing leads to the first obstacle when looking for an answer: faced with an inadequate reading, the student lacks the precise information available to them when starting the task. For this reason, once this has been done, the following stages are considered in the four-step methodology (
Figure 1):
3.2.1. Stage 1: Sketch the Actual Situation Representing the Problem and Paraphrase the Requirement(s)
The student resorts too quickly to analytical developments that involve formulas and information at hand since it appears in the text of the problem [
4]. Even when the situation has already been understood, the context and application must be specified. Stage 1 proposes developing an outline, no matter how simple, that will clarify how the problem is solved and that the solution presents a correct approach.
Once a problem is understood, solutions are created from different approaches, such solutions may be lost or diluted over time and the essence of the idea is lost. Therefore, sketching is a very effective tool for students to record clues and their mental processes for themselves and others [
26]. In addition, a graphic intelligence is being reinforced, making sure that it is carrying out a cognitive process and its understanding from its interaction (visual characteristics), coding (internal interpretation of the image), inference (internal representation of the referent based on envelope a domain of knowledge) [
27].
3.2.2. Stage 2: Clearly Identify and Write Theory, Concepts and Formulas Related to the Problem
Students analyze and describe the theory to begin addressing the problem. They register the equations and formulas and another relevant construct.
This stage is, on many occasions, the first stage that students carry out, thinking that it is the one that gives them the most significant advantage in solving the problem as described by Lee et al. [
4]. Moreover, is vitally essential to be carried out properly, according with the experiences on good practices in solving complex problems presented in this article. It should be located in the current position within the proposed methodology.
3.2.3. Stage 3: Document the Information Necessary to Resolve the Problem. Make Assumptions If Necessary
Once the equations in the previous point of the methodology have been established, the available information must be reviewed ensuring that the variables involved in the expressions previously obtained can be solved, otherwise, it can be obtained from the different means available according to the work carried out up to the third stage. These sources can be:
Technical information tables.
Simplification of an equation due to the order of magnitude of some of the variables, or the interaction of two or more variables.
The constitutive equation between two or more involved variables that had not been involved.
3.2.4. Stage 4: Solve, Analyze and Verify That There Is No Conflict in the Dimensional Analysis during the Solution Process
The different elements necessary to solve the problem have been calculated, it only remains to obtain the value of the variable(s) of interest for the specific problem. It is important to mention that there must be sensitivity and coherence in the results, so it is proposed to reflect on them to identify any numerical inconsistencies.
3.3. Requirements of the Methodology
The proposal methodology needs three constraints to consider before, during and after the application. The detailed steps and processes delivered by professors are described in the following sections.
3.3.1. Before the Application
The process begins with the design and standardization of the observation tools (See
Appendix A and
Appendix B), based on each methodology stage to solve complex problems. This design considers relevant quantitative and qualitative variables and factors, such as the time execution during the application, the student’s scores (0–100 points), the number of students per collaborator and the performance and confidence during the experience solving the complex problem (both from the students and professors in charge). Next, the roles of the instructor, collaborators and students are explained below:
Instructor/Professor: the academic and intellectual authority figure that validates the correct assessment of the answers proposed by the students, as well as the development of the design, organization and qualification of the exam. It performs a continuous and periodic rotation in each of the groups to resolve doubts and/or attend to certain validations regarding the answers given by the students, as well as to confirm that there is order and transparency throughout the evaluation.
Collaborators: instructor’s assistants available to make observations according to the checklist. They carry out continuous monitoring of the performance, development and cooperation of those evaluated at the time of developing the fundamental solution to the proposed problem. They attend to the most fundamental doubts on the subject in case there is one in particular, direct the round of questions to each member of the team in a totally impartial way. They also take evidence and notes of everything done, said or pointed out by the team members during the evaluation, and they communicate with the lead evaluator if her presence is required.
Students: the population evaluated to demonstrate the effectiveness of the methodology. They maintain academic integrity and honesty throughout the scope of the assessment. They actively participate in the group portion of the exam, caring of healthy social norms among all team members, and respect the authority of the evaluators at all times.
3.3.2. During the Application
In this step, complex problems of a heuristic nature were developed by professors (and tested on a small group of collaborators present in the application of the test) according to the experience obtained by them in previous courses (See
Section 3.4).
The tests are carried out in the same group experimentation, that is a set of dependent observations, that is measurements made on the same student’s population but under different conditions. The first condition is solving a problem before they were trained in four-step methodology, and the second condition is solving another problem with the same complexity level. In this last experimentation students use the four-step proposal methodology, once they were trained in it during regular class lectures and by practicing on exercises they must develop by themselves. Both groups solved the same problem. The observation for the declared variables and factors must be recorded in control sheets, as well as the competences directly registered on the standard rubric and checklist declared as observation tools.
It will be essential to note that the learning experience before and after using the four-step methodology and its outcomes/observations should be obtained from the same students, with the characteristics of being the same course/professor, with the same conditions of the professor, and with the standardized evaluation instruments (
Appendix A and
Appendix B).
3.3.3. After the Application
The evaluation is carried out in a group manner between the teacher and the collaborators to identify any behavior that justified the dropping out of the problem and to deliberate on the possible causes. With this, data is collected for statistical analysis.
Ethical aspects must be taken care of given the sensitivity of the students’ information. The legal aspects are formalized through the statutes of the university, the students give their consent in writing to the handling of their data in the analyzes carried out.
It is worth mentioning that before the pandemic, small groups of students were assigned to teachers and collaborators to observe the students’ performance during the resolution of the pre and post-test. During the pandemic, the same procedure is performed, but making a group through the platform of digital delivery of classes.
3.4. Case Study Description
The four-step methodology has been proven in four higher education courses in the manufacturing, materials and mechanical design discipline. This case study helps to demonstrate the method, homologation and definition of the complex problems to solve. Furthermore, the data and quantitative and qualitative observations present information and exploration for the hypothesis declared in this research work. The following sections describe information about the population characteristics and data gathering.
3.4.1. Population Size, Description and Characteristics
The following section will describe the experimentation conducted during the periods: (i) August–December 2019, (ii) January–May 2020, and (iii) August–December 2019.
Table 1 shows the experimentation consisted of three courses of the Mechanical Engineering area in the following format
Course ID-Name:
M2031-Manufacturing Technologies,
M2014-Materials Applications,
M2023-Mechanics of Materials. See
Table 1 for the details about the professors’ assignment for each course and teaching period. The total population size observed during the experimentation from August 2019 to December 2020 was 61 students.
As described in
Section 1, aligned to the research objectives, data collection and statistical analysis have obtained the response variable “score” before and after the four-step methodology. The authors recognize the implications of small sample sizes in this exploratory study for the courses observed. Therefore, future studies intend to record massive data through technological tools (apps, machine learning software) for better power in statistical analysis.
For the particular case of the M2023-Manufacturing Technologies course, the experimentation was directed by Professor A during the period (i) August–December 2019 (before the pandemic) and one year later, in the period (ii) August–December 2020 (during the pandemic in online teaching). Professor A also imparted the M2031-Manufacturing Technologies course during (iii) August–December 2020 (during pandemic in online teaching). Finally, the M2023-Mechanics of Materials course observations were gathered during the pandemic and taught by Professor B.
Each teacher selects and/or designs an exercise with the appropriate level of difficulty based on the number of variables [
28]. Findings relevant to this case study can be found in the results regarding the student score (0–100 point) performance.
It is important to mention that the observations and assessments of the (i) August–December 2019 period were carried out in a presence and synchronous learning classroom where the professor observed, evaluated, and graded face to face. The particular case of (ii) January–May 2020 period was where the first evaluation (without-steps methodology), was in a face-to-face format, and the second evaluation was in a virtual classroom in a synchronous online teaching.
From March 2020 onwards, all evaluations were online, under the same control system, with the difference that evaluations, observations, and grades were conducted virtually through the Learning Management System Canvas.
3.4.2. Data Gathering Protocols
During the experimentations within the groups defined in
Table 1, the following protocols gathered the data used for these analyses.
Once the Instructors/Collaborators performed the observation, the numerical qualification (
Appendix A) and competence level evaluation (
Appendix B) of the students in each group and period, the Professors delivered the collected data to the group of analysts for consolidation, cleaning, and proper treatment towards the next steps of statistical analysis.
3.5. Statistical Analysis Methodology
As mentioned in
Section 2, the indicators observed during the experimentation of the four-step methodology were the student’s score obtained in the complex problem, taking into account the technical aspect of the subject (Checklist-
Appendix A), their performance while solving the problem (Rubric-
Appendix B) and time of resolution.
When analyzing the behavioral data, it was clear that a more in-depth literature review and analysis and validated instruments were necessary to judge the observed behaviors to examine this qualitative variable. For the current scope of our investigation, we will avoid the interpretation of the behavioral data. Thus, only the scores will be taken into consideration, primarily due to its numerical and continuous nature, which are both characteristics that will ease the statistical analysis.
On the other hand, because the data collection methodology regarding the resolution time of each student was not standardized among the groups, unusual observations, biases, and dependence among the data were found, so it was decided to exclude them from the final analysis.
Furthermore, it is important to mention the variable score was obtained from the reported grades by the professors for each evaluation or problem. The context of periods during the pandemic because of COVID-19 produced some trends and bias within the groups’ data observations.
The statistical analysis consists in the following parts:
Section 4.1 Descriptive Statistics;
Section 4.2 Normality Test (for each group, pre and post-test);
Section 4.3 Paired
t-Tests and Wilcoxon Test;
Section 4.4 General Linear Model ANOVA (2 factors). The software utilized for the mathematical study was Minitab
®.
The first part of the analysis has the objective to illustrate the general results of the experiment, by providing general statistics of each group when they were both untrained and trained on their respective evaluations. The following part, normality tests for each group was conducted to verify the plausibility of analysis for each one of the groups involved, taking into consideration their various evaluation’s conditions. Once the normality of each group was determined, we proceeded to conduct paired t-tests to determine which groups presented a significant difference regarding their score’s means, if there was no significant difference, it was therefore stated that the methodology did not positively influence the student’s performance under pretty specific circumstances. On the contrary, if the bilateral paired t-test suggested that there was indeed a significant difference between the means, unilateral paired t-tests were conducted to determine whether the trained students performed better or worse than their untrained counterparts. In a particular case, it was not possible to conduct parametric statistics due to a non-normal distribution of the data, so a nonparametric analysis (Wilcoxon test) was used instead. Ultimately, a general linear model ANOVA of two factors was implemented to determine whether the course or the use of methodology itself was a factor that had a significant influence on the student’s performance or not.
4. Results
4.1. Descriptive Statistics
Table 2 shows the descriptive statistics of the four groups observed. The groups M2031 (i) August–December 2019 and M2014 (ii) January–May 2020 present a higher value of the means and a lower standard deviation for the tests with trained students. Other behavior was for both groups observed during period (iii) August–December 2020 M2031 and M2023. Although these two groups have different syllabus and objectives, their behaviors during the four-step methodology application were very similar, both pre-training and post-training tests. This sighting supports the exploration and findings of the four-step methodology in terms of the standardization it represents when applied to complex problem-solving.
In regard to the group M2031 (i) August–December 2019 (UTND), it is appreciated that its standard deviation and standard error are relatively high, such a behavior can be explained by analyzing the results obtained by the students. During the untrained evaluation, several students obtained a null score, primarily because of the student’s decision to give up on the problem and not presenting any formal solution, on the contrary there was an equal number of perfect scores on such evaluation, which ultimately led to a high value for the standard deviation and standard error. Once the methodology was instructed to the students and the second evaluation took place (TND), it is noticeable the change in the students’ performance, because there are not null scores for any students and the distribution was presented a more uniform behavior.
4.2. Normality Test
The results of the normality tests are displayed in
Table 3. It must be clear that the data shown corresponds to the same population of students per course and their scores before and after the training on their respective assessments.
As shown in the table, the vast majority of populations involved in the experiment followed a normal distribution, which helped us use capable and parametric statistical tests to determine whether or not the four-step methodology was effective in terms of the change of the factor “score”. A significant finding is how the three populations of the three groups studied (M2031–Manufacturing Technologies, M2014–Materials Applications and M2023–Mechanics of Materials) before training were non-normally. After training, they reach a normal distribution.
In the M2014–Materials Applications course, when the students did not have any training on the method, they did not reflect a normal distribution. This data behavior can be related to bias concerning this course’s pandemic context and teaching characteristics during the period (ii) January–May 2020, previously described in
Section 3.4.1 Once that group was trained in using a methodology, they presented a quite normal distribution, which can be interpreted as an implicit benefit of using a standardized methodology for the solution of complex problems in engineering.
4.3. Paired Test and Wilcoxon Test
The objective of this part of the analysis is to determine whether or not there was a significant difference in the mean between the trained population and the untrained population within each course defined in
Table 1. The population always remains unchanged, the only considerable difference is the training process that is between the two evaluations, so the test that will be applied is the paired
t-test, due to the dependency that UTND and TND have on each other, same sample, difficulty and professor but different circumstances on the training status about the application of the methodology.
As it can be seen in
Table 4, among the four samples there are only two that show a significant difference regarding the means of each population’s sample. However, in this case, the only information that can be concluded is that three of the analyzed samples reflect a different performance when the methodology is used, the other two could ultimately lead to various conclusions, and for thus, further analysis was conducted, primarily to demonstrate whether there was some significance regarding the use of the methodology or not. For that purpose, unilateral paired
t-test analyses were conducted, with the aim to determine whether or not there was a significantly higher mean within each population.
First of all, the group M2023 AD 2020 will be analyzed to determine if there was indeed a unilateral difference that could help us to demonstrate the progress achieved when the methodology is used. A unilateral test will be conducted, and in this case, we will always commence by analyzing if the untrained population had a lower mean when compared to the trained population. As it can be seen in the
Table 4 for the M2023 AD 2020 group we have a significant difference between the two means, and the population that was trained to use the methodology presented a higher mean, thus demonstrating the potential of the methodology.
By applying the same paired t-test on the other population that presented a significant difference between the means of the untrained and trained population, the M2031 AD 2020 group, we obtained a similar result, in which the population that was trained to use the methodology presented a higher mean, thus demonstrating the potential of the methodology.
4.4. Wilcoxon Test
In regard to the population that did not follow a normal distribution, a Wilcoxon test was applied to determine if there was a significant difference between the median obtained in the non-normal distribution and the theoretical median value. The theoretical median value corresponds to the median value obtained by the normally distributed trained population, which resulted to be 65. Finally, due to the p-value of 0.045 on the bilateral test, it was concluded that there was indeed a significant difference between the hypothesized median of seventy and the median of the untrained populations. Furthermore, in order to obtain more important conclusions with respect to that group, it was decided that a unilateral Wilcoxon test will be performed in order to determine if the untrained group median was indeed lower than the hypothesized median. As it can be seen in the table, the results show that the median of the untrained group is certainly lower than the hypothesized median of seventy, which corresponds to the median of the trained group. With that in mind, the results of this test favor the use of the methodology.
During these tests (Paired t-tests & Wilcoxon test) a confidence level of 90.0% was used, due to the variability of the data.
4.5. General Linear Model ANOVA of Two Factors
Table 5 shows the information of the factors taken into consideration for the students who were involved in this research. For this reason, a proposal for applying the General Linear Model-ANOVA method of two variables aims to obtain the sums of squares of the averages of each population observed in terms of two different factors:
training and
course.
Factor A is defined as the engineering course that the students were taking and Factor B is defined as the training process on the methodology of solving complex problems. The data is shown as the average of the grades of each of the groups with the characteristic of having been trained or not.
The data observed in each of the populations in the entire experiment were validated in terms of their normal distribution, homoscedasticity and independence. Once this validation was done, we proceeded to obtain
Table 6 of ANOVA.
The results of the ANOVA method for the two factors studied, suggest that there is indeed a significant effect of the methodology in which students were trained for systematic resolution in complex problems in regard to their reflected performance during the evaluations. Contrary to that, the course factor does not have a significant effect on the reflected academic performance.
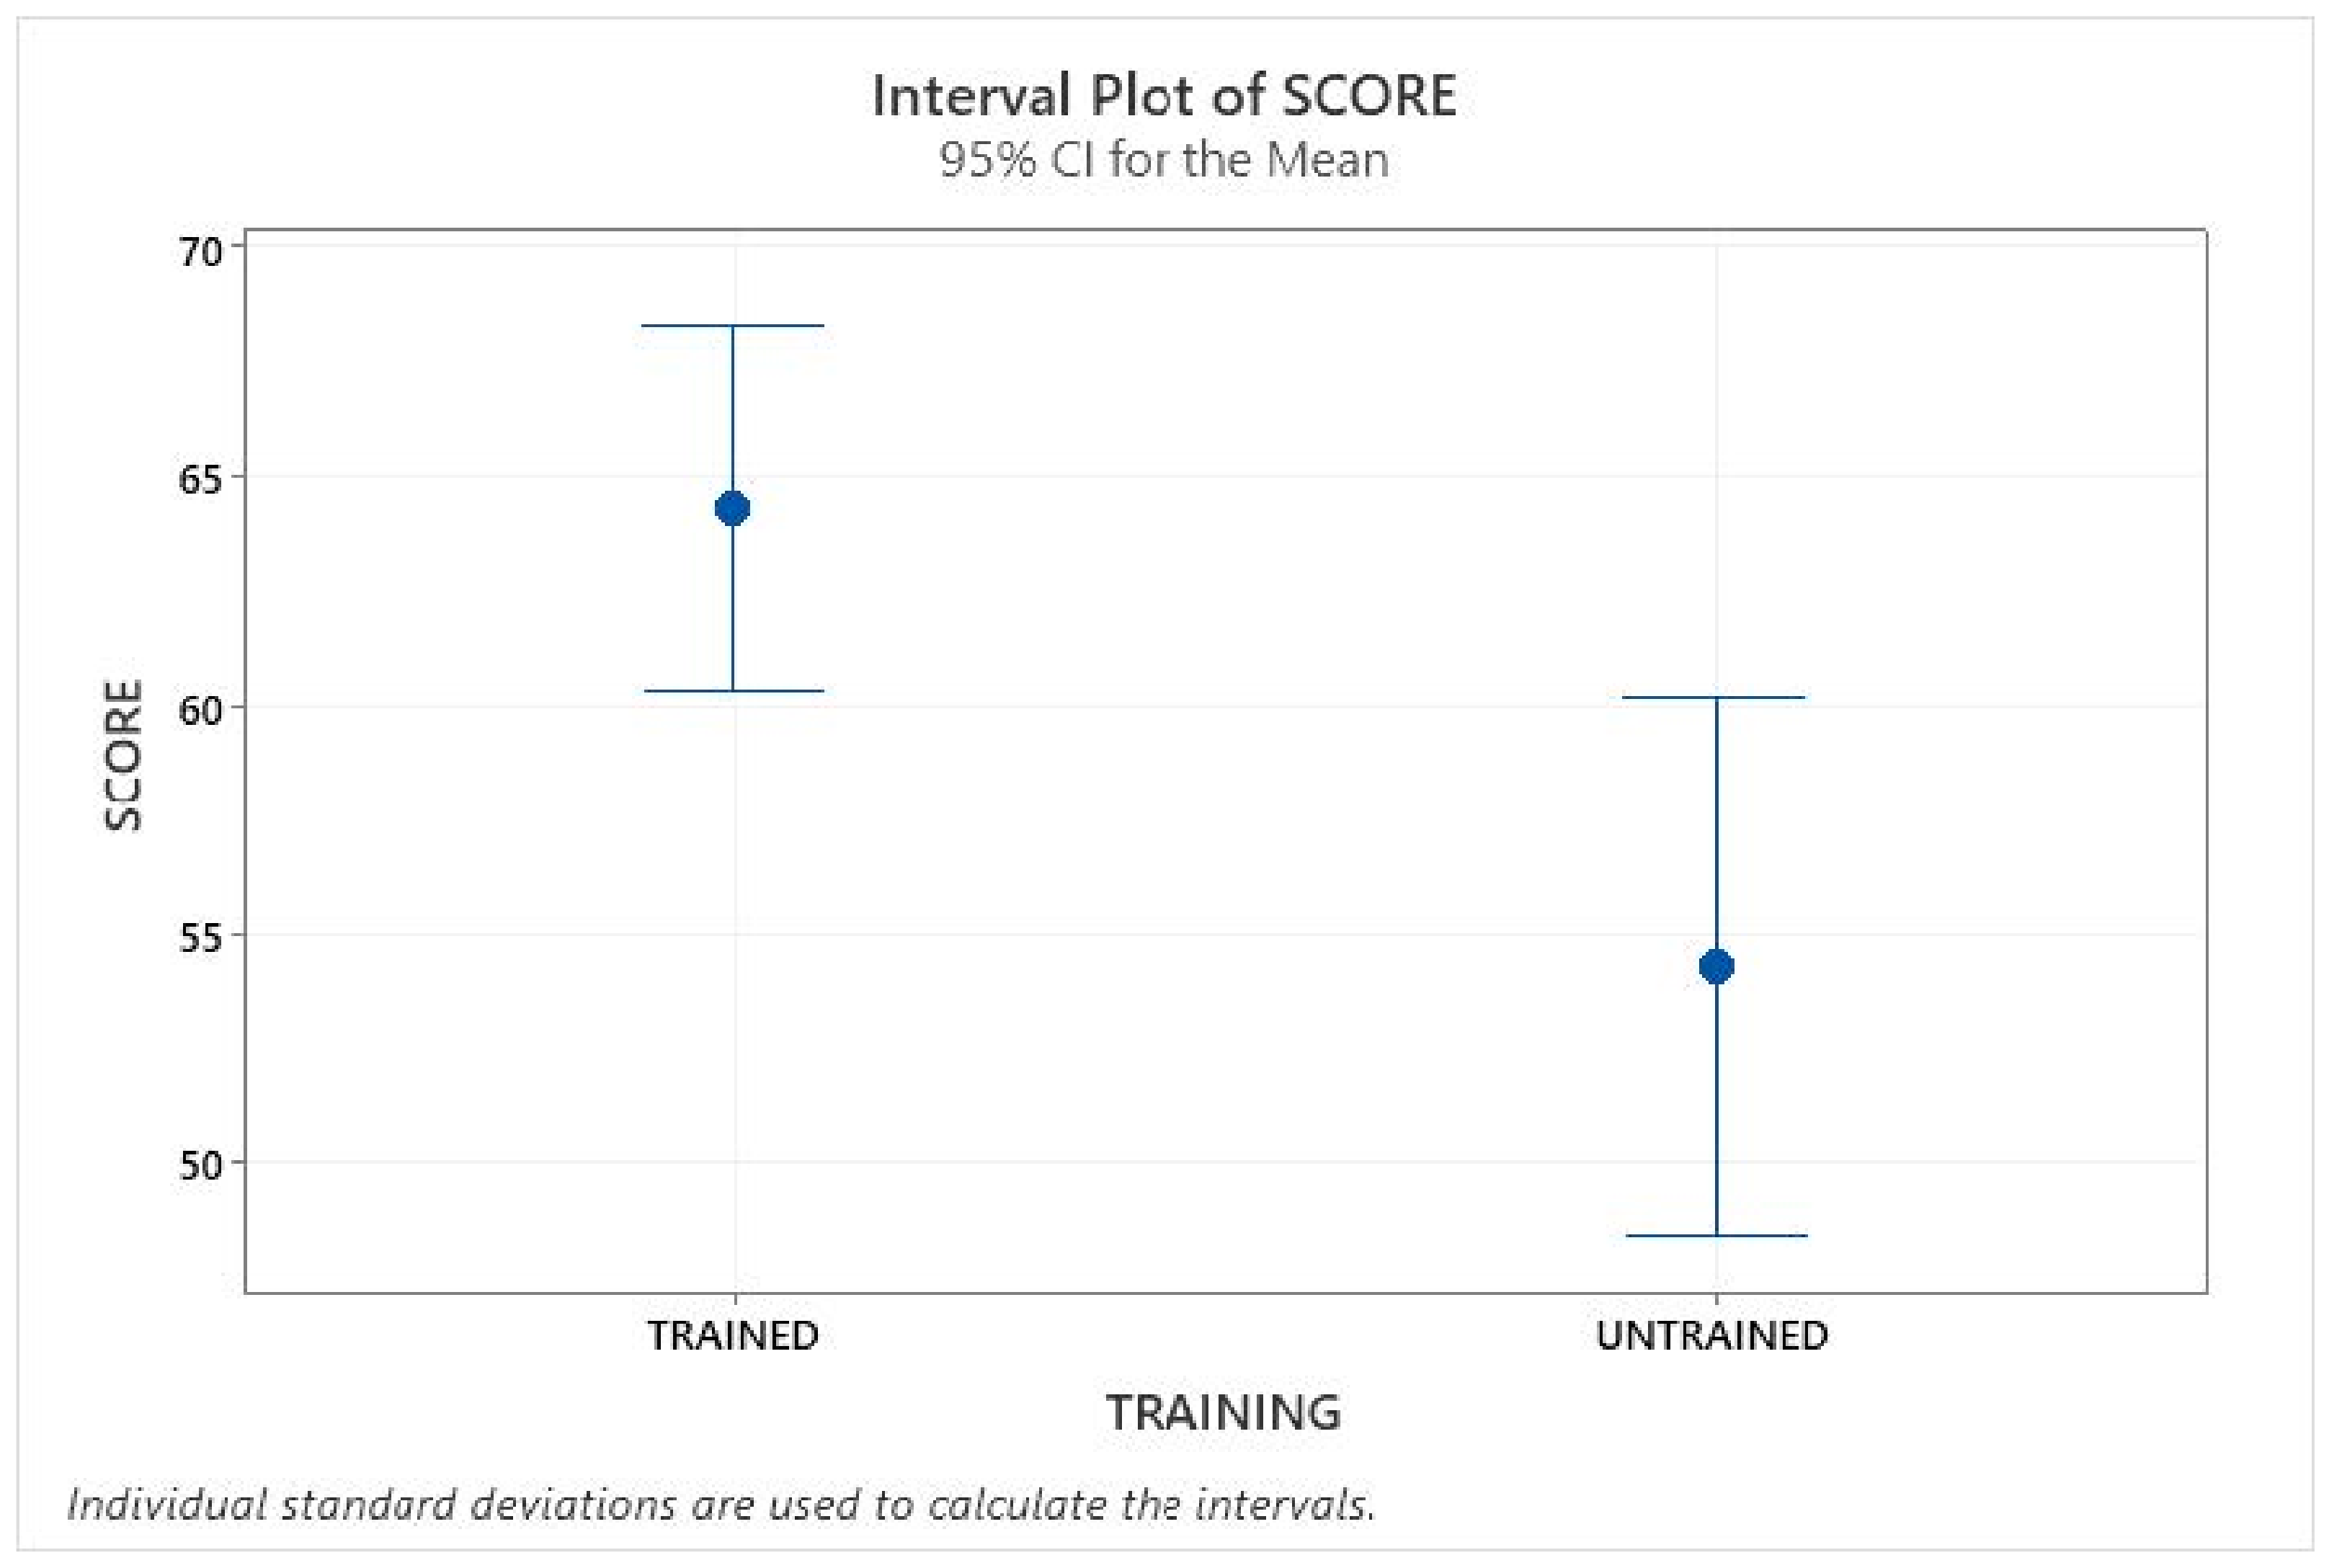
Finally,
Figure 2 presents the Confidence Intervals for the means with a Confidence Level of 95%, this reaffirms what was observed within the ANOVA analysis. It is remarkable the fact that the same student population, after being trained on the use of the methodology for solving complex problems in engineering, presented a significantly higher grade than at that previous evaluation when they were not trained on the use of the previously mentioned methodology.
While all statistical tests have been meticulously developed to ensure the maximum reliability possible in regard to our results’ suggestions, it must be denoted that the sample size for the experiment under a general criticism was notably small. In relation to that, the sample size was of 61 students, who were sorted among four different groups in the engineering department, which ultimately led to a small sample size of 13-19 students in each group. For the parametric statistical analysis applied it should be enlightened that a bigger sample size would be desirable if the objective is to give a broad validation to the methodology, and of course, not only the sample size must increase significantly in order to achieve that objective, but also the population involved in the experiment will have to be part of varied branches of the engineering department, to study the possibility of expansion of the methodology and its applicability to other academic areas.
5. Conclusions
As a general discussion about the statistical outcomes obtained, we can appreciate that in the set of observed data between groups and methodologies, the ANOVA model results strongly suggest that in the set of observed data between groups and methodologies a significant difference was observed on the average grades of students when the methodology was employed.
Additionally, the paired t-tests and Wilcoxon tests show that at least three out of four of the groups involved in the experiment obtained a significant benefit when the methodology was applied. The results obtained for the groups that did not present a significant difference when the methodology was used may indicate that there is a need for focalized control during the evaluations and grading process. As an overall description of the population’s performance, we can conclude a moderate increment of the reflected academic performance during the evaluations in which the methodology was used. However, it is essential to note that while an academic score (0–100 points) increase is widely desirable for many educators, the experience obtained with this exploration suggests that many variables can be significant regarding the methodology’s effectiveness. One of the relevant variables to consider is the training process given to students and educators. To establish better-structured conclusions about the methodology’s effectiveness on the experimental populations, deeper and more detailed analysis must be conducted on future studies.
As an overall discussion of the experiences learned throughout this iteration, the validation of the methodology is quite ambitious, primarily due to the objective of applying the methodology in a vast area of academic branches, and the major difficulty relies on the extensive number of human resources that must be included in the experiment. Considering that the only professors involved belong as well to the experimentation team, no further training process was required to teach the students how to use the methodology properly. The applicability of the methodology for branches of engineering that do not envision an explicit use of mathematics for physical theorems is still unbeknownst. Ultimately, the grading process was, in qualitative terms expressed by the professors involved, eased in a considerable manner, due to the step-by-step nature of the alumni’s solutions to the examinations, so not only the methodology can potentially benefit the students in terms of their reflected performance but also the professor’s work to grade evaluations can also benefit from the proper use of the methodology.
Future Work
The results obtained allow us to explore and propose future studies regarding this matter. Protocolized data gathering procedures and standardized grading processes will be ideal to amplify the potential of these studies, moreover, some variables like behavior, time efficiency and general acceptance of the methodology should be considered when designing more sophisticated experiments to obtain a greater understanding about the plausibility of massive usage of the methodology. (It is expected that the use of technological tools that improve behavioral observation on the students subjected to controlled evaluations will lead the statistical analysis to more innovative and conclusive directions.) Further and deeper analysis will have to be conducted in order to have a broader criterion on the general effectiveness and practicality about the usage of this methodology in engineering courses.
In a similar fashion, a strict model of training the educators into the use of the methodology may significantly increase the control of experimentation and the blocking of uncontrollable variables that may have caused noise in the test results presented in the current research work. The results of the statistical analysis open the possibility of applying the methodology in a massive way through some digital applications incorporating elements of artificial intelligence.
The analysis results suggest a promising future for the methodology, but there are still many areas of improvement in regards to the broad standardization of the design in question, the next steps that must be taken in order to have a wider understanding of the effectiveness and applicability of the methodology are the protocolized control over the data involved, such as a redesigned standardized rubric for the grading process, big data approaches in the scope of future studies, and a validated protocol for training in the sue of the methodology for both teachers and students. The field of action is also expanded to test it in different areas of engineering, so this will undoubtedly be the next step where there is a bank of problems based on the four-step methodology, and a quick and time efficient feedback will be provided by the intelligent tutor tool. By having a bigger set of recollected data from different branches of engineering with the optimum control over the potential bias that an experiment of a wide scale could present, the validation of the methodology will be more reliable and applicable to many areas of undergraduate academies. In addition to this, the alumni would have the possibility to learn from the process to improve the provided feedback. Among the areas of opportunity for improvement, we envision the following: Improve the monitoring process in the face of the pandemic (since one of the groups of the periods evaluated in 2020 were carried out remotely), although we only had one group in this modality, we observed that we need to employ a tool that allows us to monitor the behavior of students in a more detailed way. Improving the monitoring process will allow us to make richer and more varied observations.
Talking specifically about the results obtained during this round of experimentation, the data obtained is barely sufficient to consider the methodology promising and a potential success if some critical factors in its application are taken into consideration, apart from the statistical results previously mentioned in this paper, we have appreciated that the students behavior must be deeply analyzed for future iterations in order to have a more profound comprehension in regards to the influence that the methodology might have on the students’ perception of difficulty and their processes of reasoning while solving a complex engineering problem using the methodology, this will enlighten unbeknownst areas in which the methodology could potentially have a positive influence on the students and their reflected performance on academic evaluations, however, while such an information can be interesting to analyze, it may be complex to perform statistical test on the obtained data due to its qualitative nature, hence the method for collecting qualitative data from the observed behavior of students must be meticulously designed.
In the former experiment, any behavioral observation was excluded from the analysis and scope of the current research, so the data collected must only be interpreted as a partial reflection of each student’s performance; it is known that critical information regarding the behavioral influence of the methodology might have been lost in this round of experimentation. Without behavioral data on the current analysis, the numerical data obtained through examination might not be conclusive to many criteria of expansion in the use of the methodology. Also, as every single evaluation had a very strict time limit, the opportunity to freely study about the total impact that the methodology could have on the reduction of time completion of each evaluation was partially ignored, if the future evaluations are of a considerable extension the time effectiveness of the methodology may possibly be thoroughly examined, it ought to be considered for future iterations of the experiment.
In terms of the training process involved in the leisure of the methodology in different branches of engineering, a protocolized standard of training must be established in order to ensure a common homogeneity among the groups that will be trained to adopt the methodology, without such a protocol inacceptable bias can be presented in the collected data and the validation of the methodology will neither be solid nor correct.


 ,
, 


