
Empirical Study on Temperature Influence on Noise Measurements with the Statistical Pass-By Method


Abstract
:1. Introduction
2. Materials and Methods
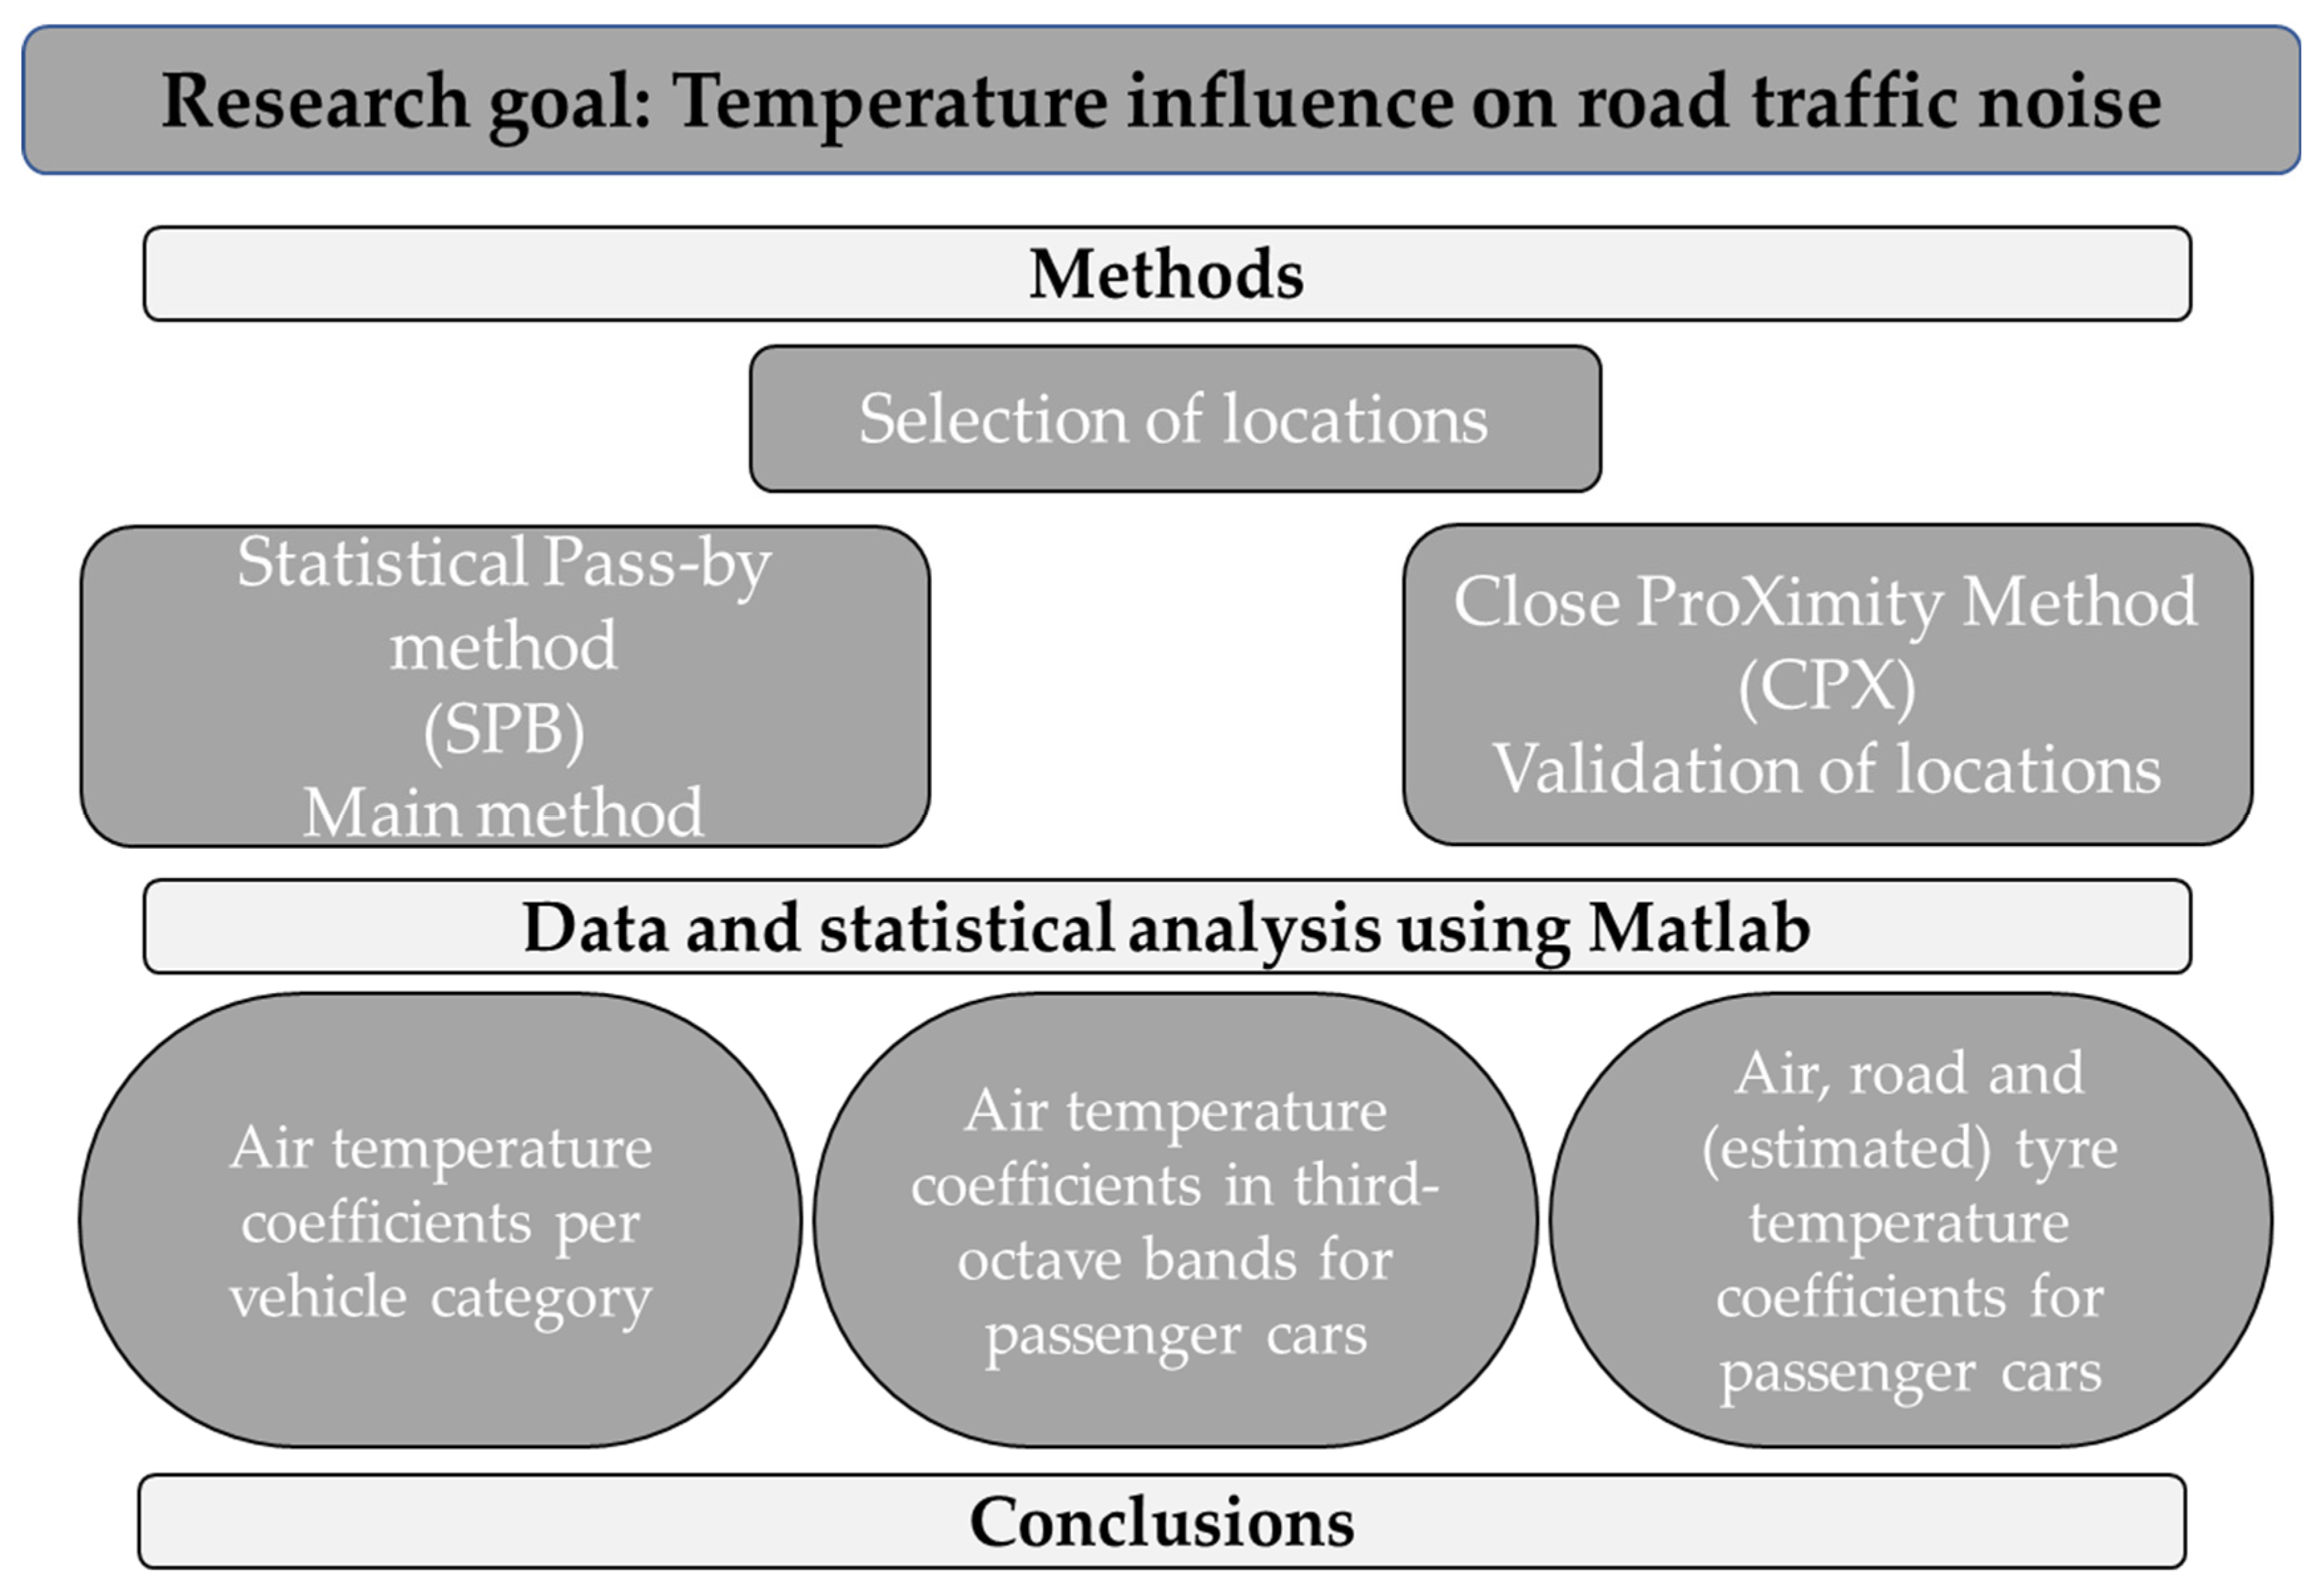
2.1. Research Methodology
2.2. Test Locations
2.3. Measurement Methods
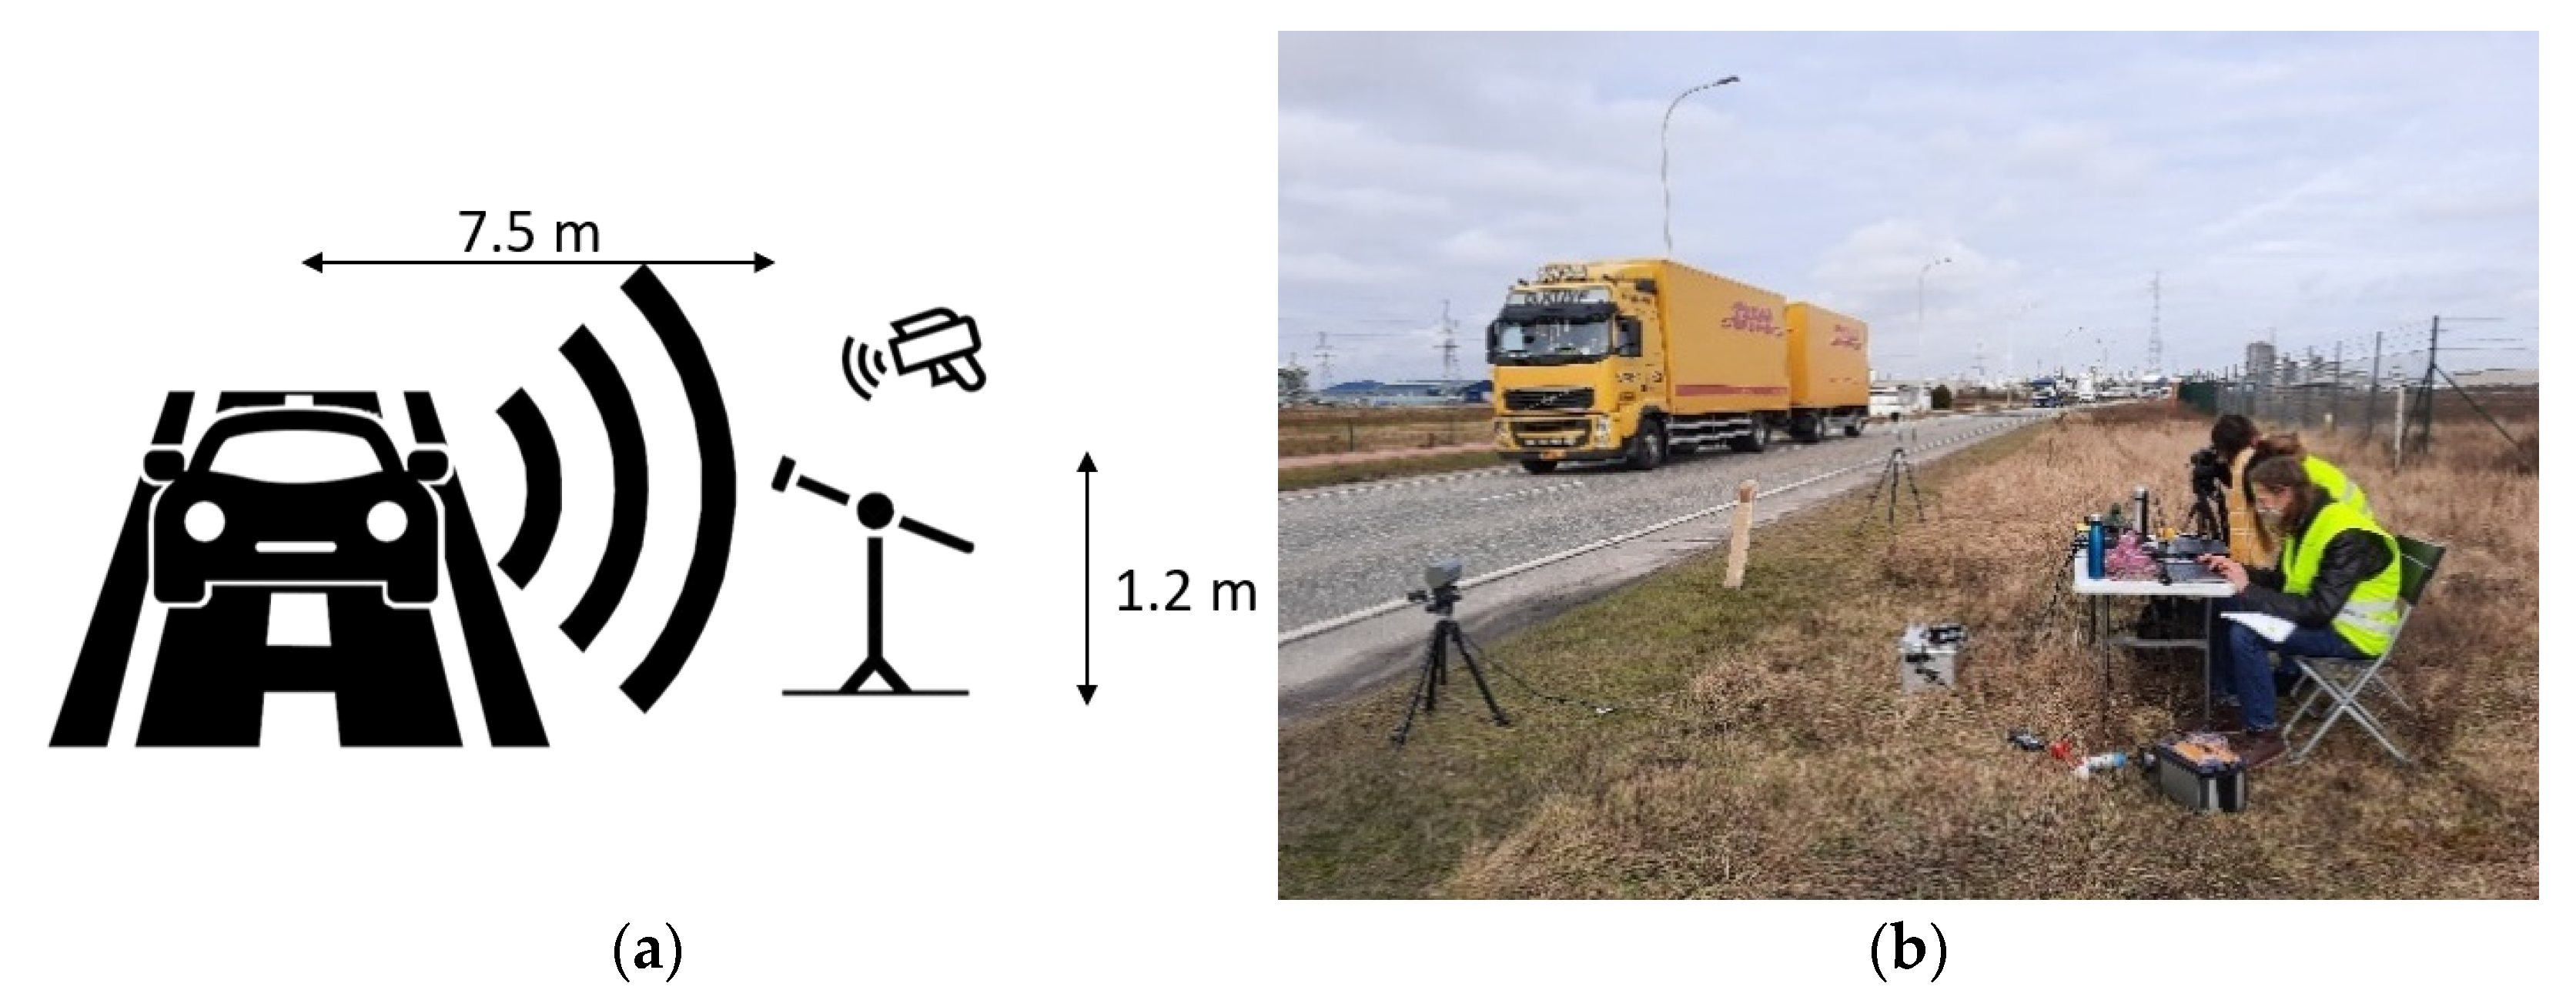
2.3.1. Statistical Pass-By
2.3.2. Close ProXimity Method (CPX)
2.4. Temperature
- For each vehicle category, the pass-bys were grouped based on the temperature during their passage: the temperature range obtained in the measurements for each location was divided into 14 different ways (starting from steps of 1 °C, increasing the step size by 0.5 °C up to 10 °C steps), and the pass-bys were assigned to these temperature groups. The smaller the step, the more consistent the LA,max—temperature relation, but the smaller the group size. Thus, the optimum temperature step was chosen as the smallest as possible that resulted in the maximum number of groups containing 30 or more pass-bys, for statistical relevance;
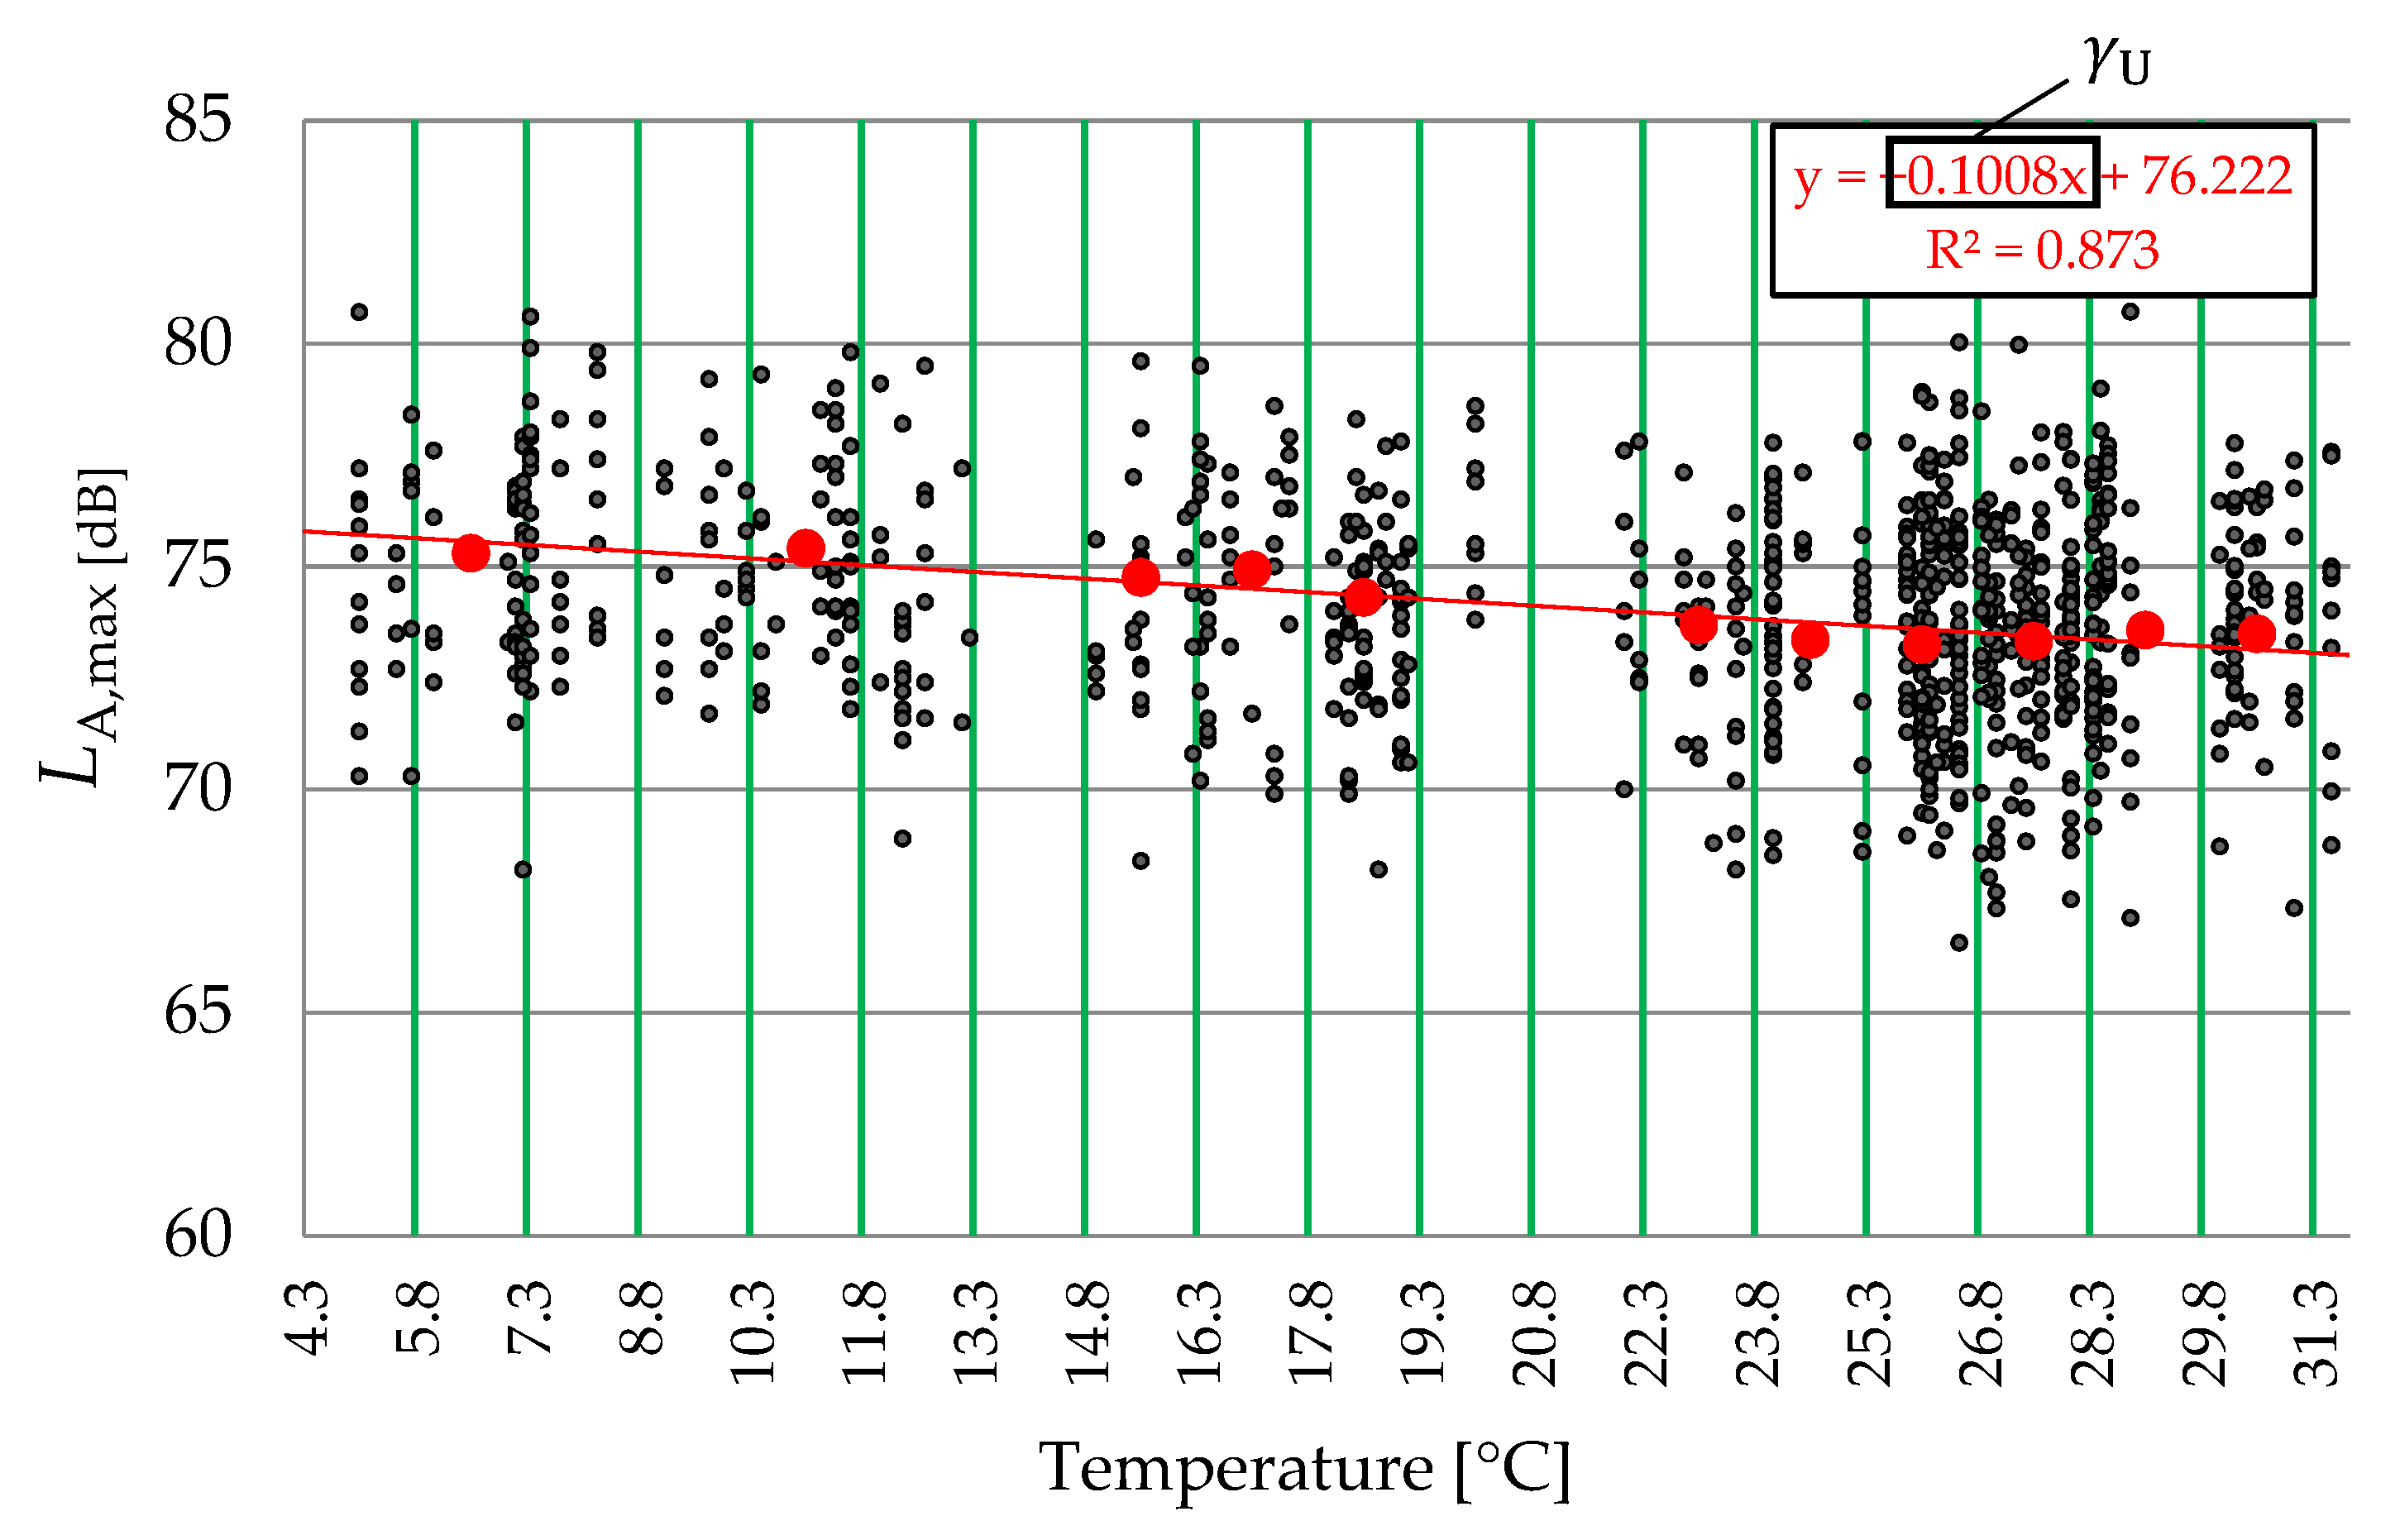
- The LA,max of the pass-bys within the temperature groups was still affected by speed. To normalise for speed, the average LA,max per temperature group was corrected to a reference speed, which was the average speed of all pass-bys of that vehicle category. This correction uses the speed coefficient, which is the slope b of the regression line of LA,max versus the logarithm of speed for all pass-bys of that vehicle category, independent of temperature. See Equation (4);
- 3.
- Lastly, a linear regression was applied to the speed corrected average LA,max of the temperature groups versus the temperature of the groups. The slope of this regression line represents the temperature coefficient, equivalent to the temperature coefficient for overall vehicle noise , in ISO/DTS 13471-2 [21].
3. Results and Discussion
3.1. Temperature Correction Based on SPB Results
3.1.1. Passenger Cars
3.1.2. Heavy Vehicles
3.1.3. Choice of Temperature
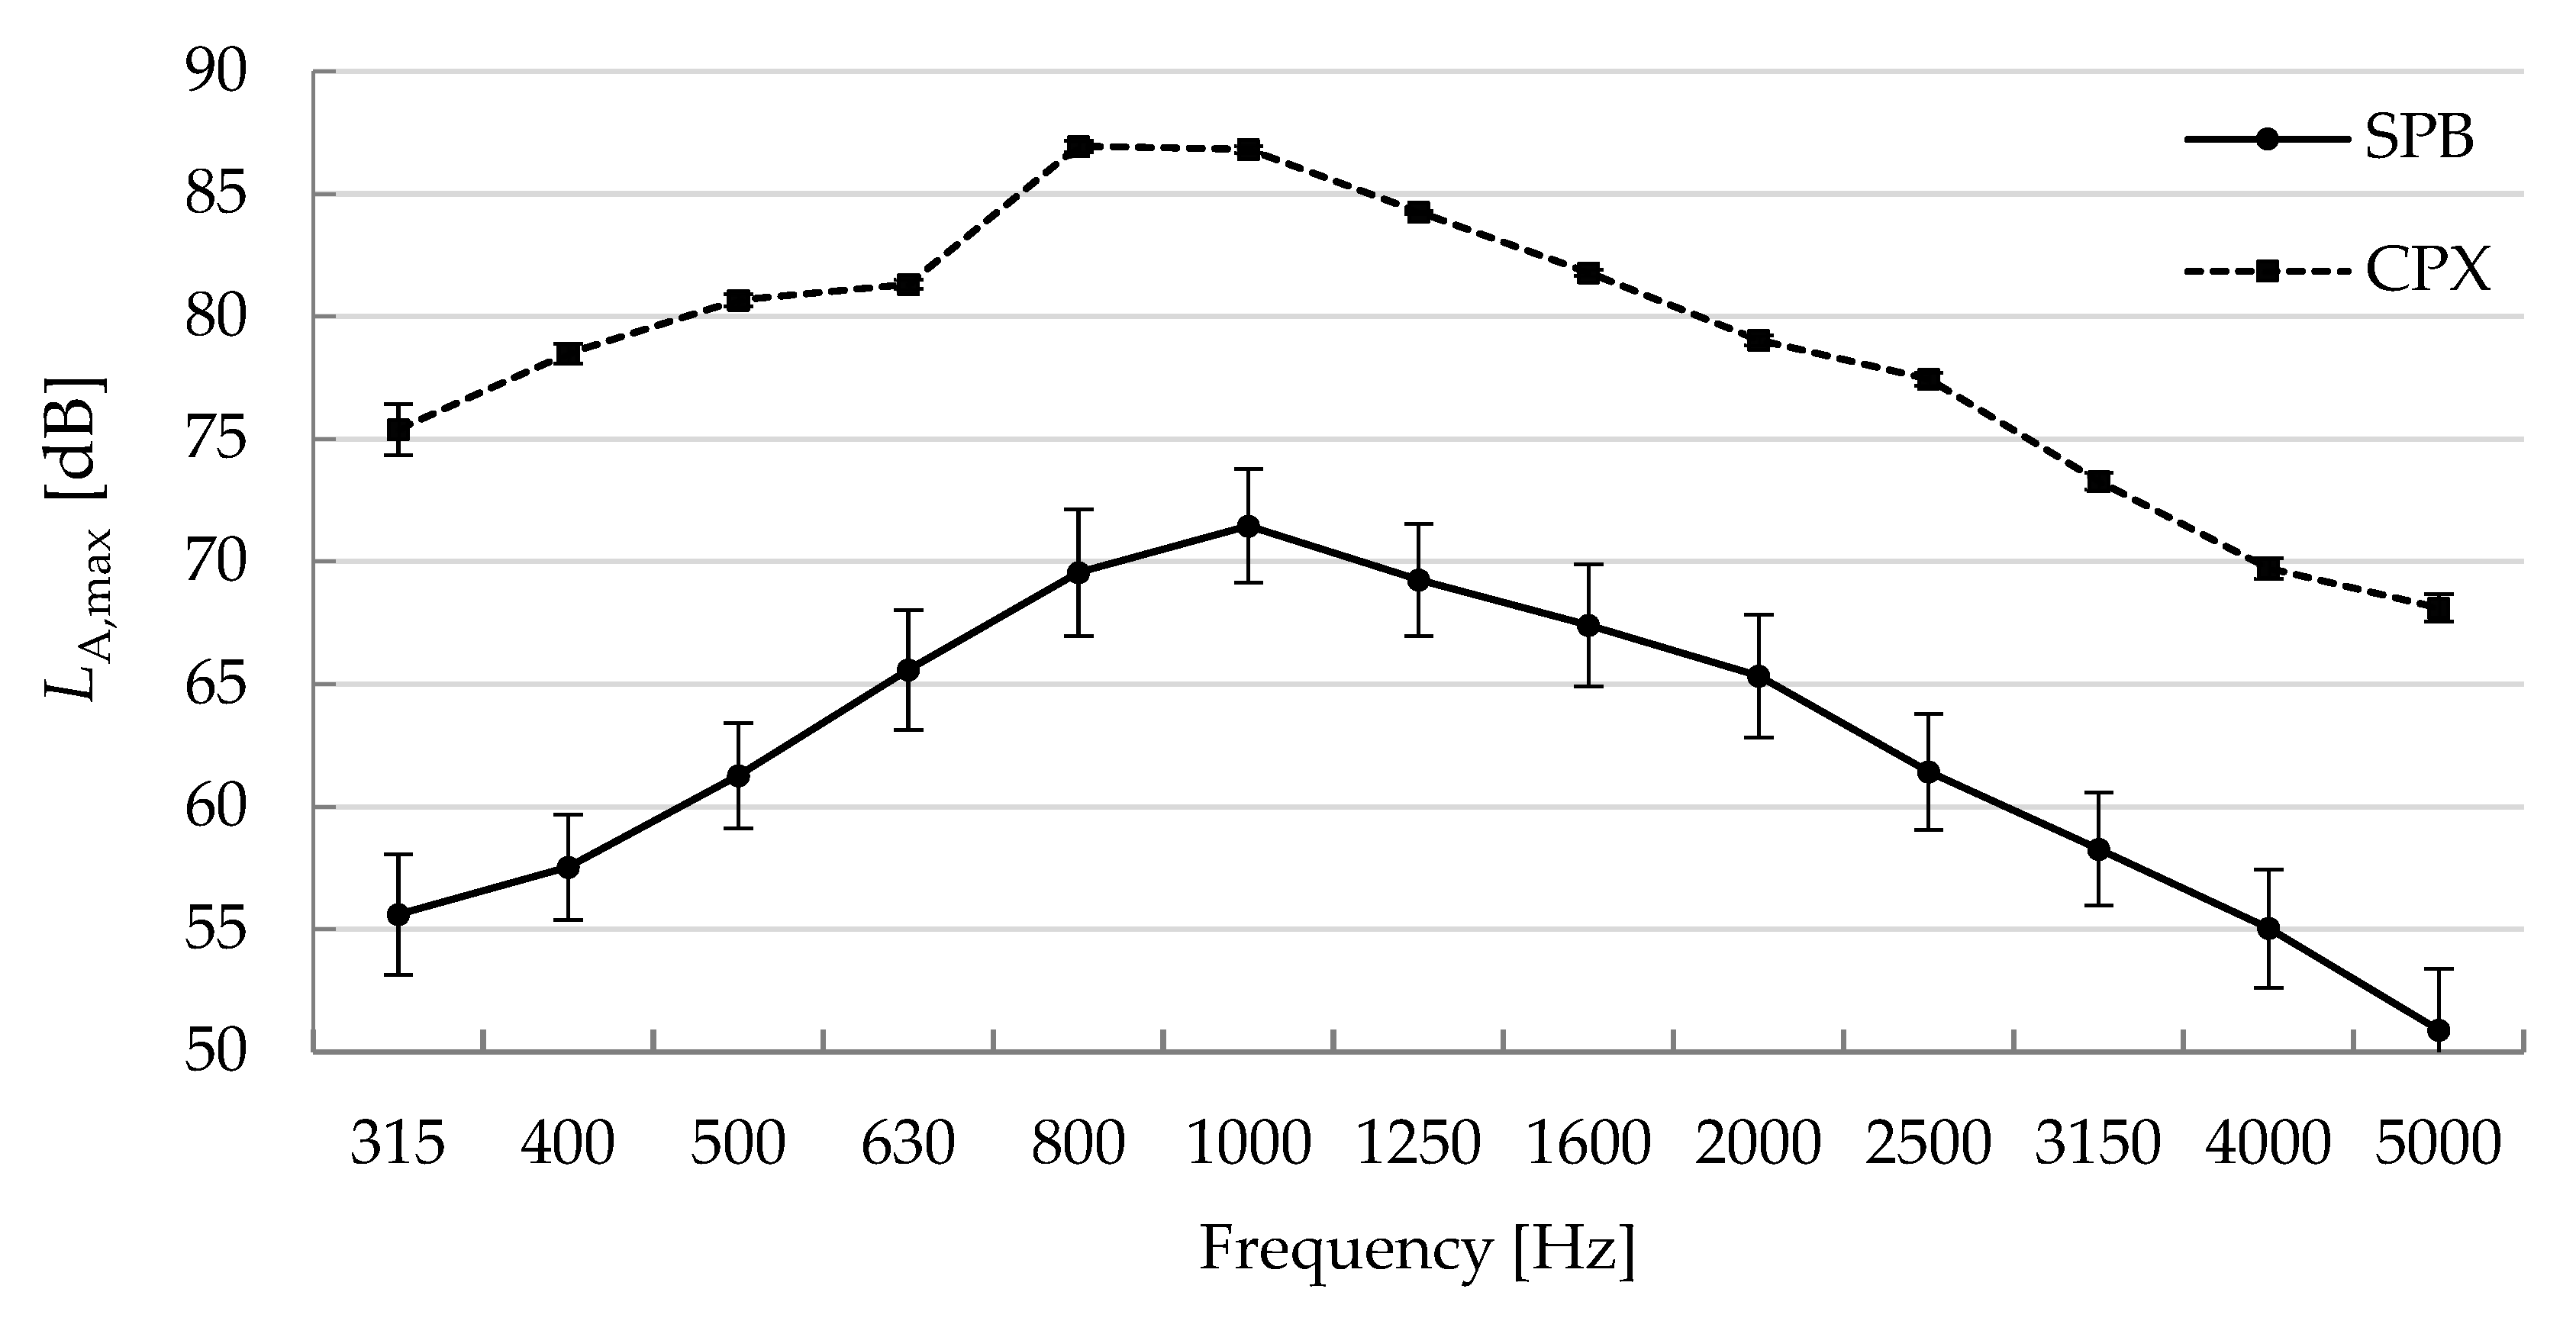
3.1.4. Temperature Coefficient in Third-Octave Bands
3.2. CPX Results
4. Conclusions
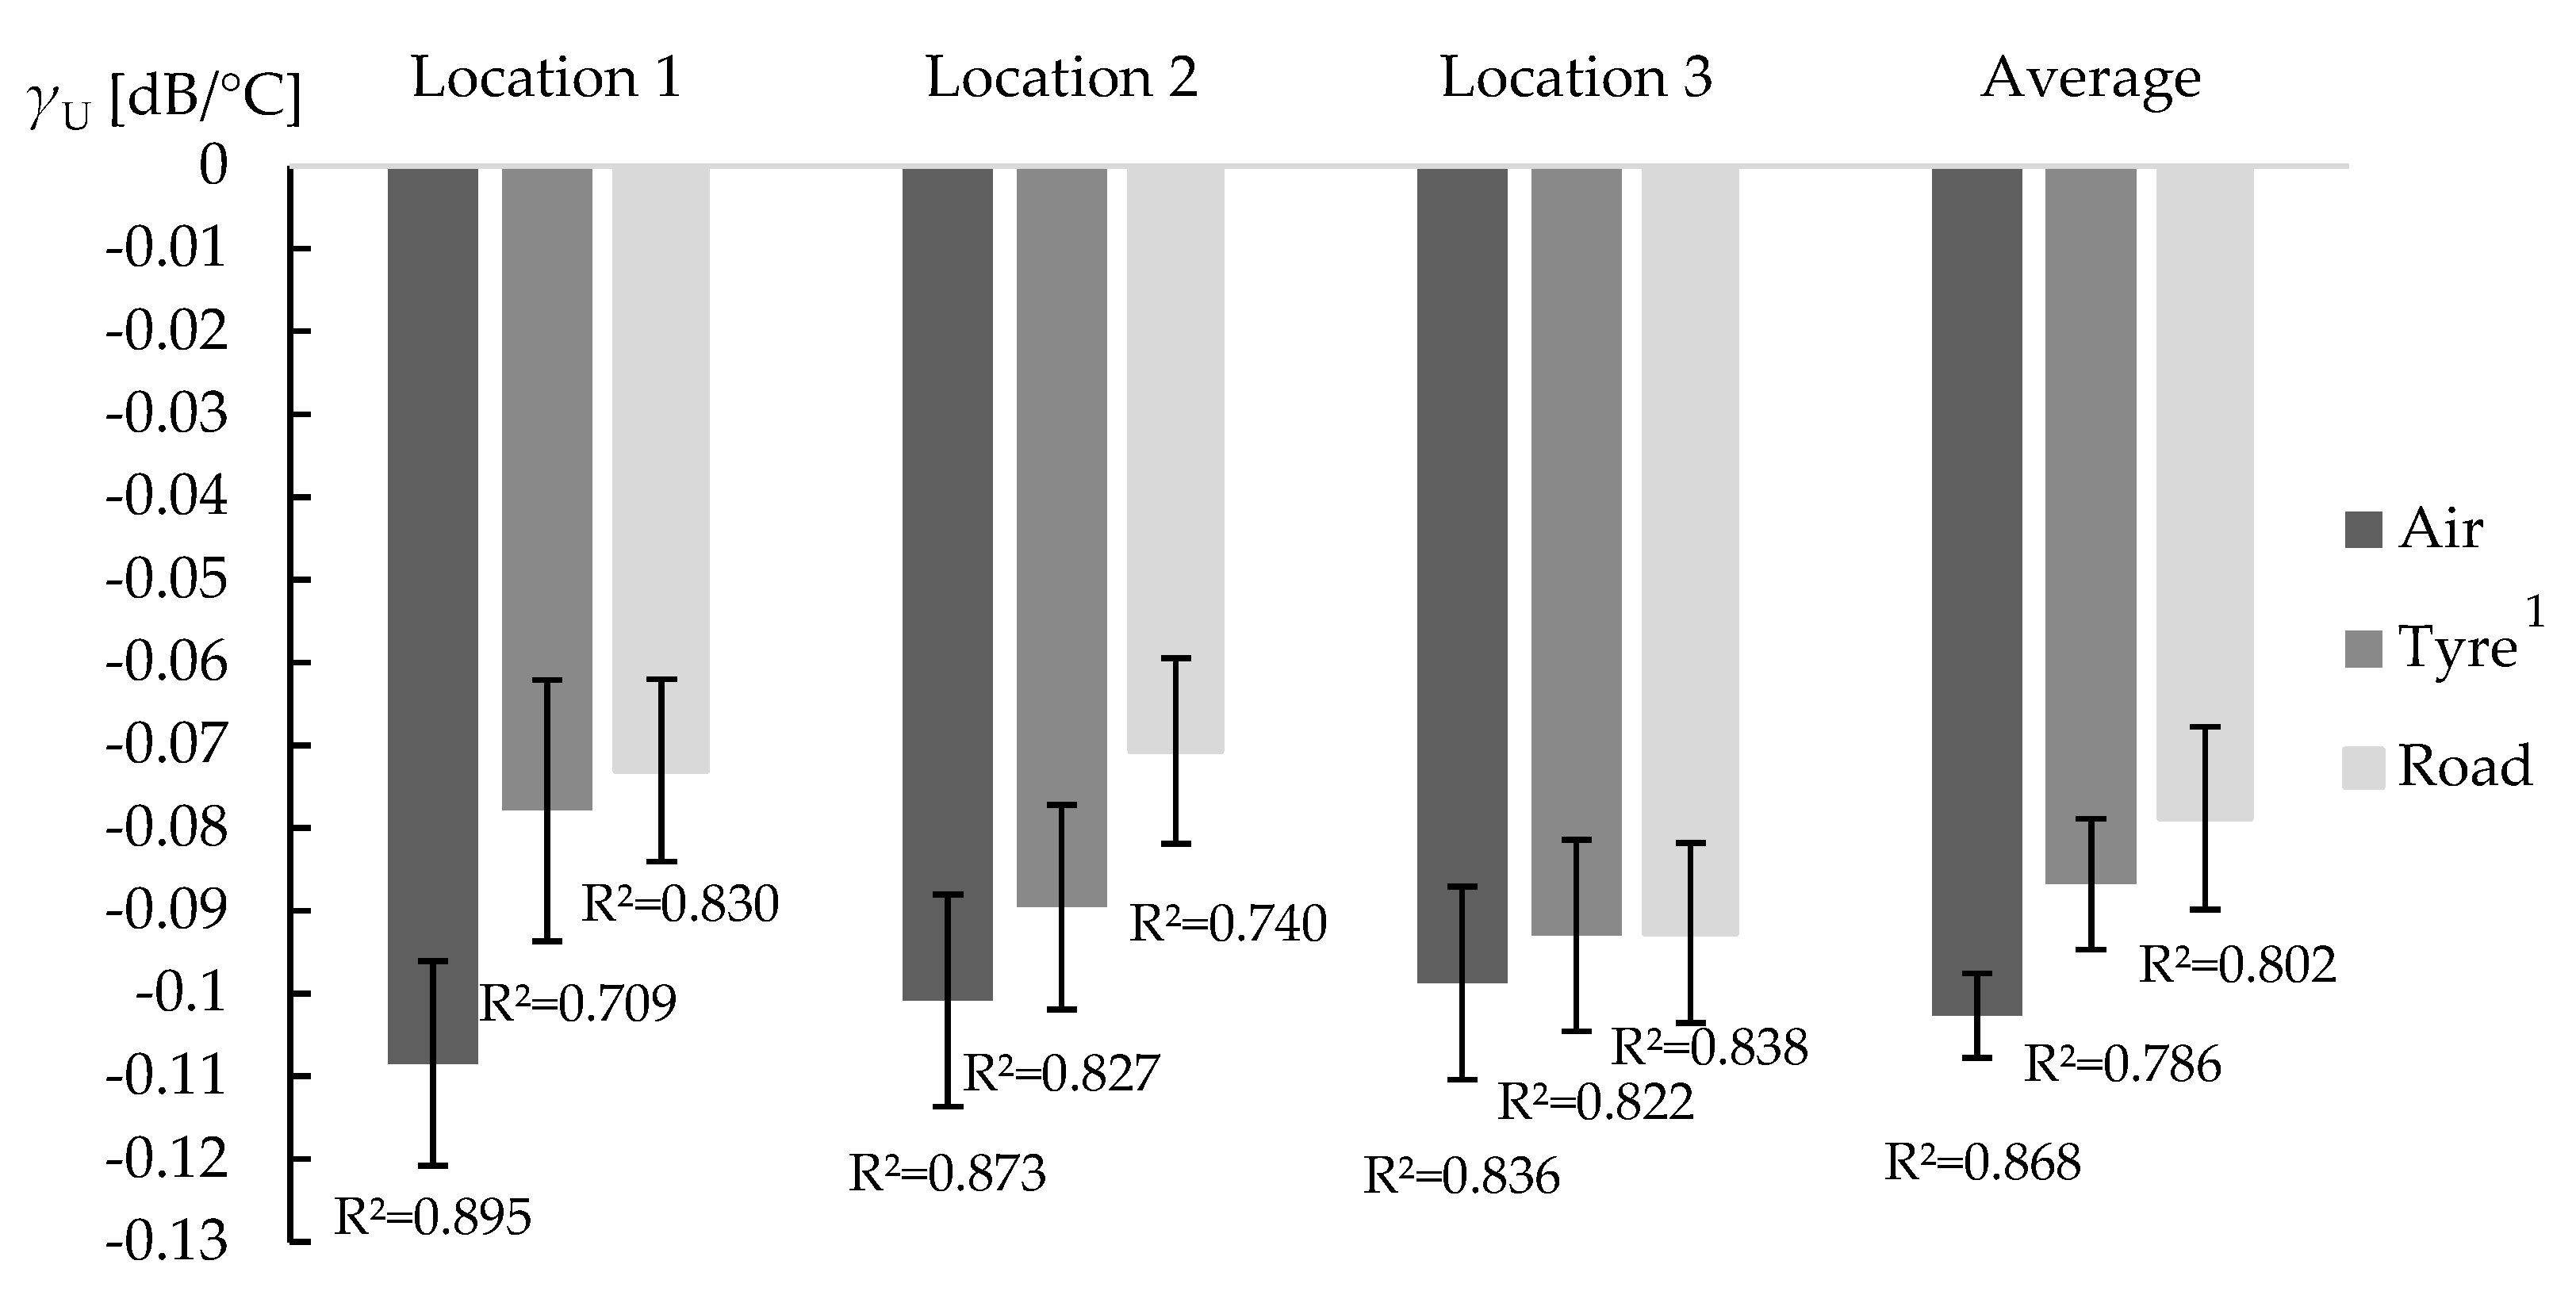
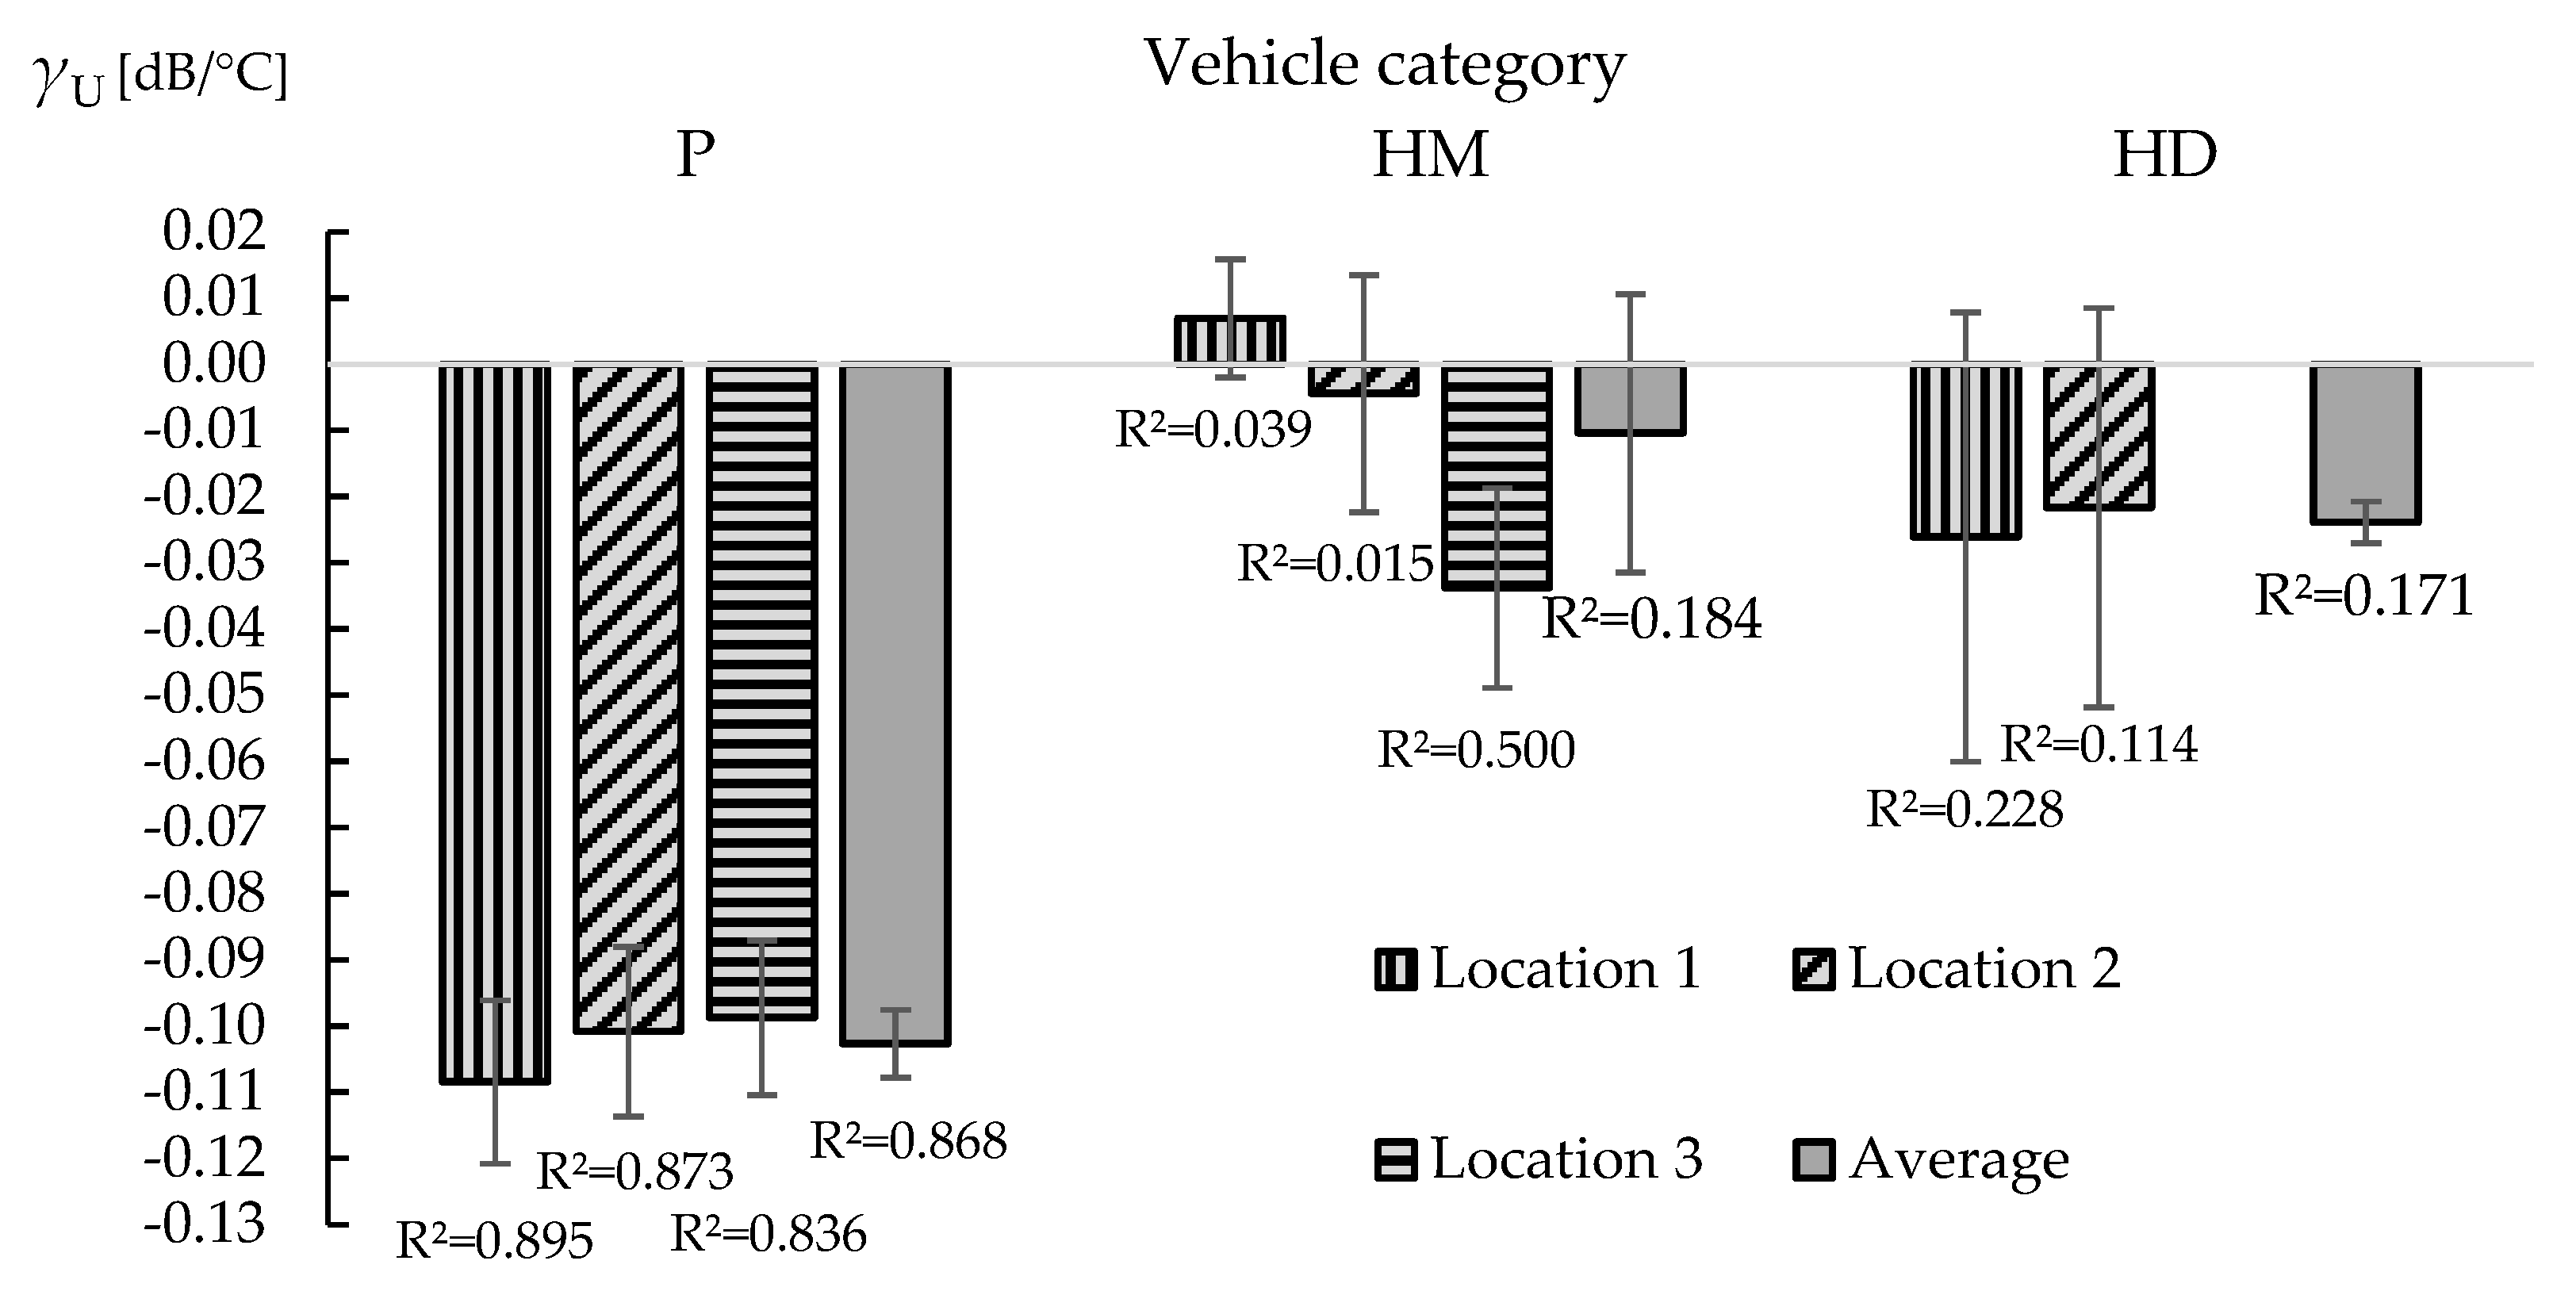
- The air-temperature coefficients for passenger cars on AC and SMA pavements are similar. The result from this study, an average air temperature coefficient of −0.103 dB/°C for passenger cars, supports the procedure in ISO/DTS 13471-2.
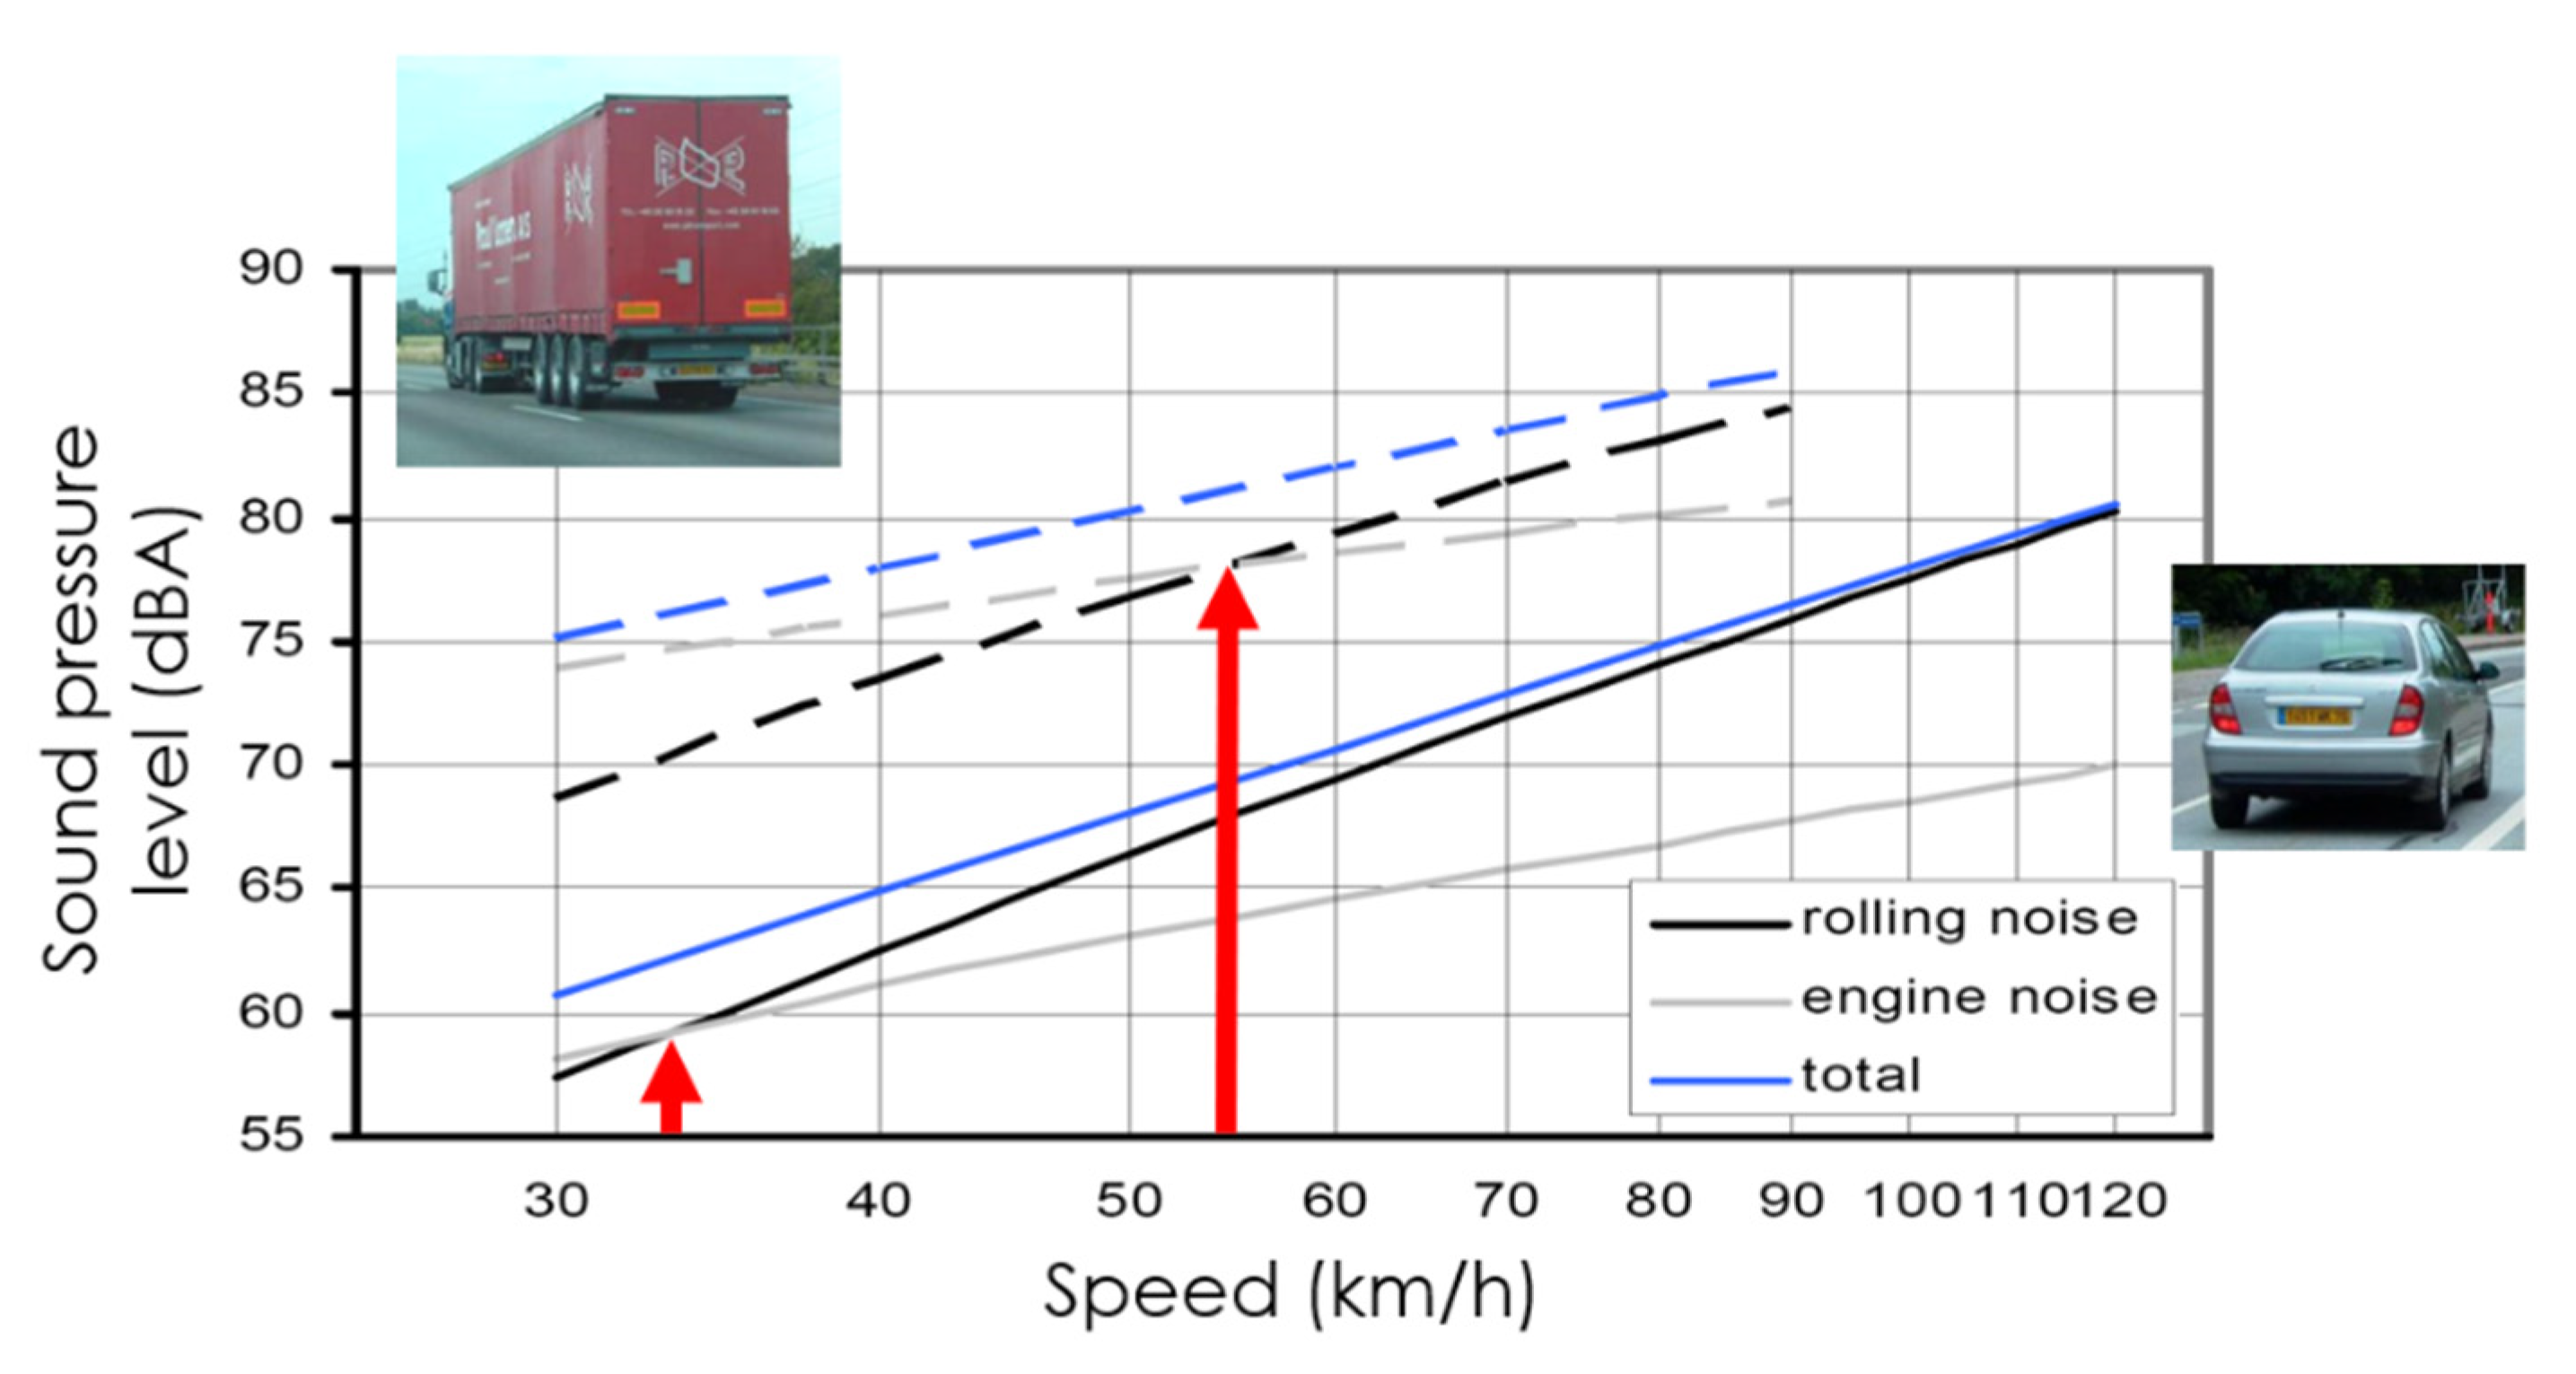
- No statistical evidence was found for temperature influence on road traffic noise concerning heavy vehicles. This is expected because of the low speed (45–53 km/h) during the measurements. At these speeds, the power unit noise dilutes the tyre/road noise. The effect of temperature on power unit noise is very complex and vehicle-dependent; as a result, there is no clear trend for this effect in terms of SPB measurements. Therefore, the temperature influence on the overall noise level is not (statistically) noticeable. While the diluting effect is accounted for in the standard by a reduction in the temperature coefficient of 40% in the speed range of 45–64 km/h, in this study the diluting effect appears to be higher, which may indicate that the diluting effect is underestimated and the reduction should be increased further.
- In this study, both air and road temperatures were considered. The R2 values of the linear regression obtained from the LA,max—temperature correlation were consistently the highest for air temperature, although the differences from the R2 of road temperature were small. This indicates that air temperature holds a marginal benefit over road temperature for correction procedures. Tyre temperature, estimated using a formula by Bühlmann et al. [23], did not show an improvement over the other temperatures.
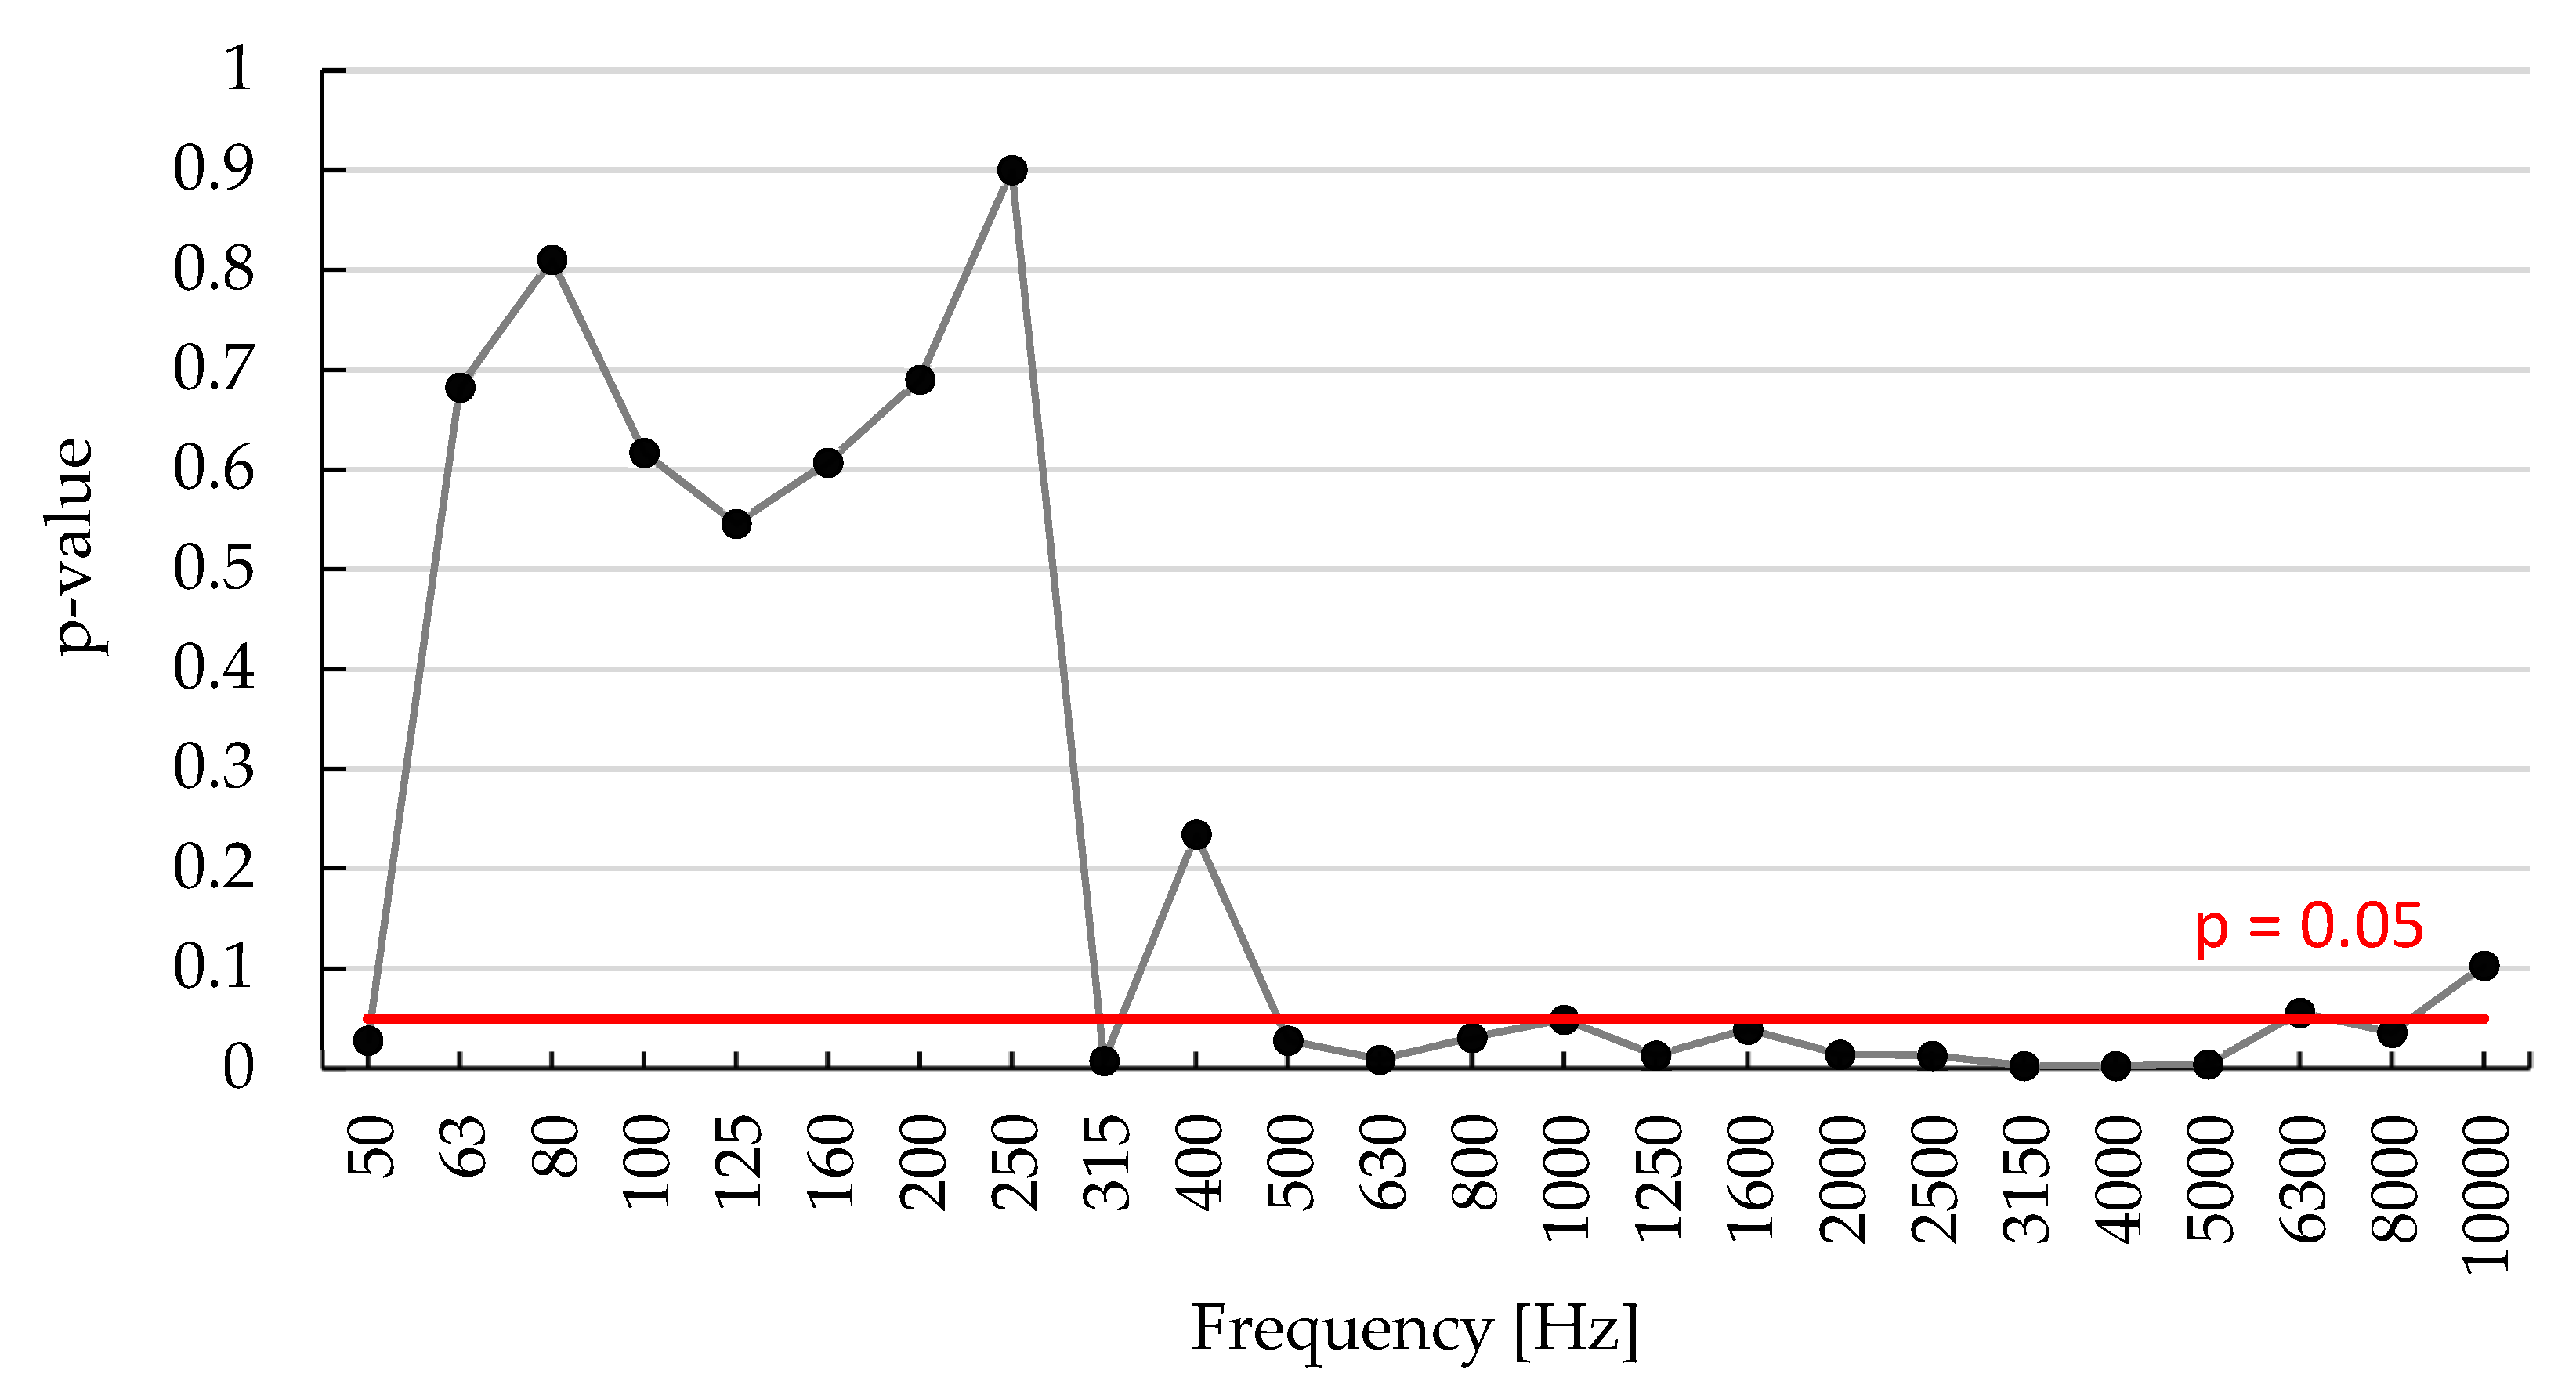
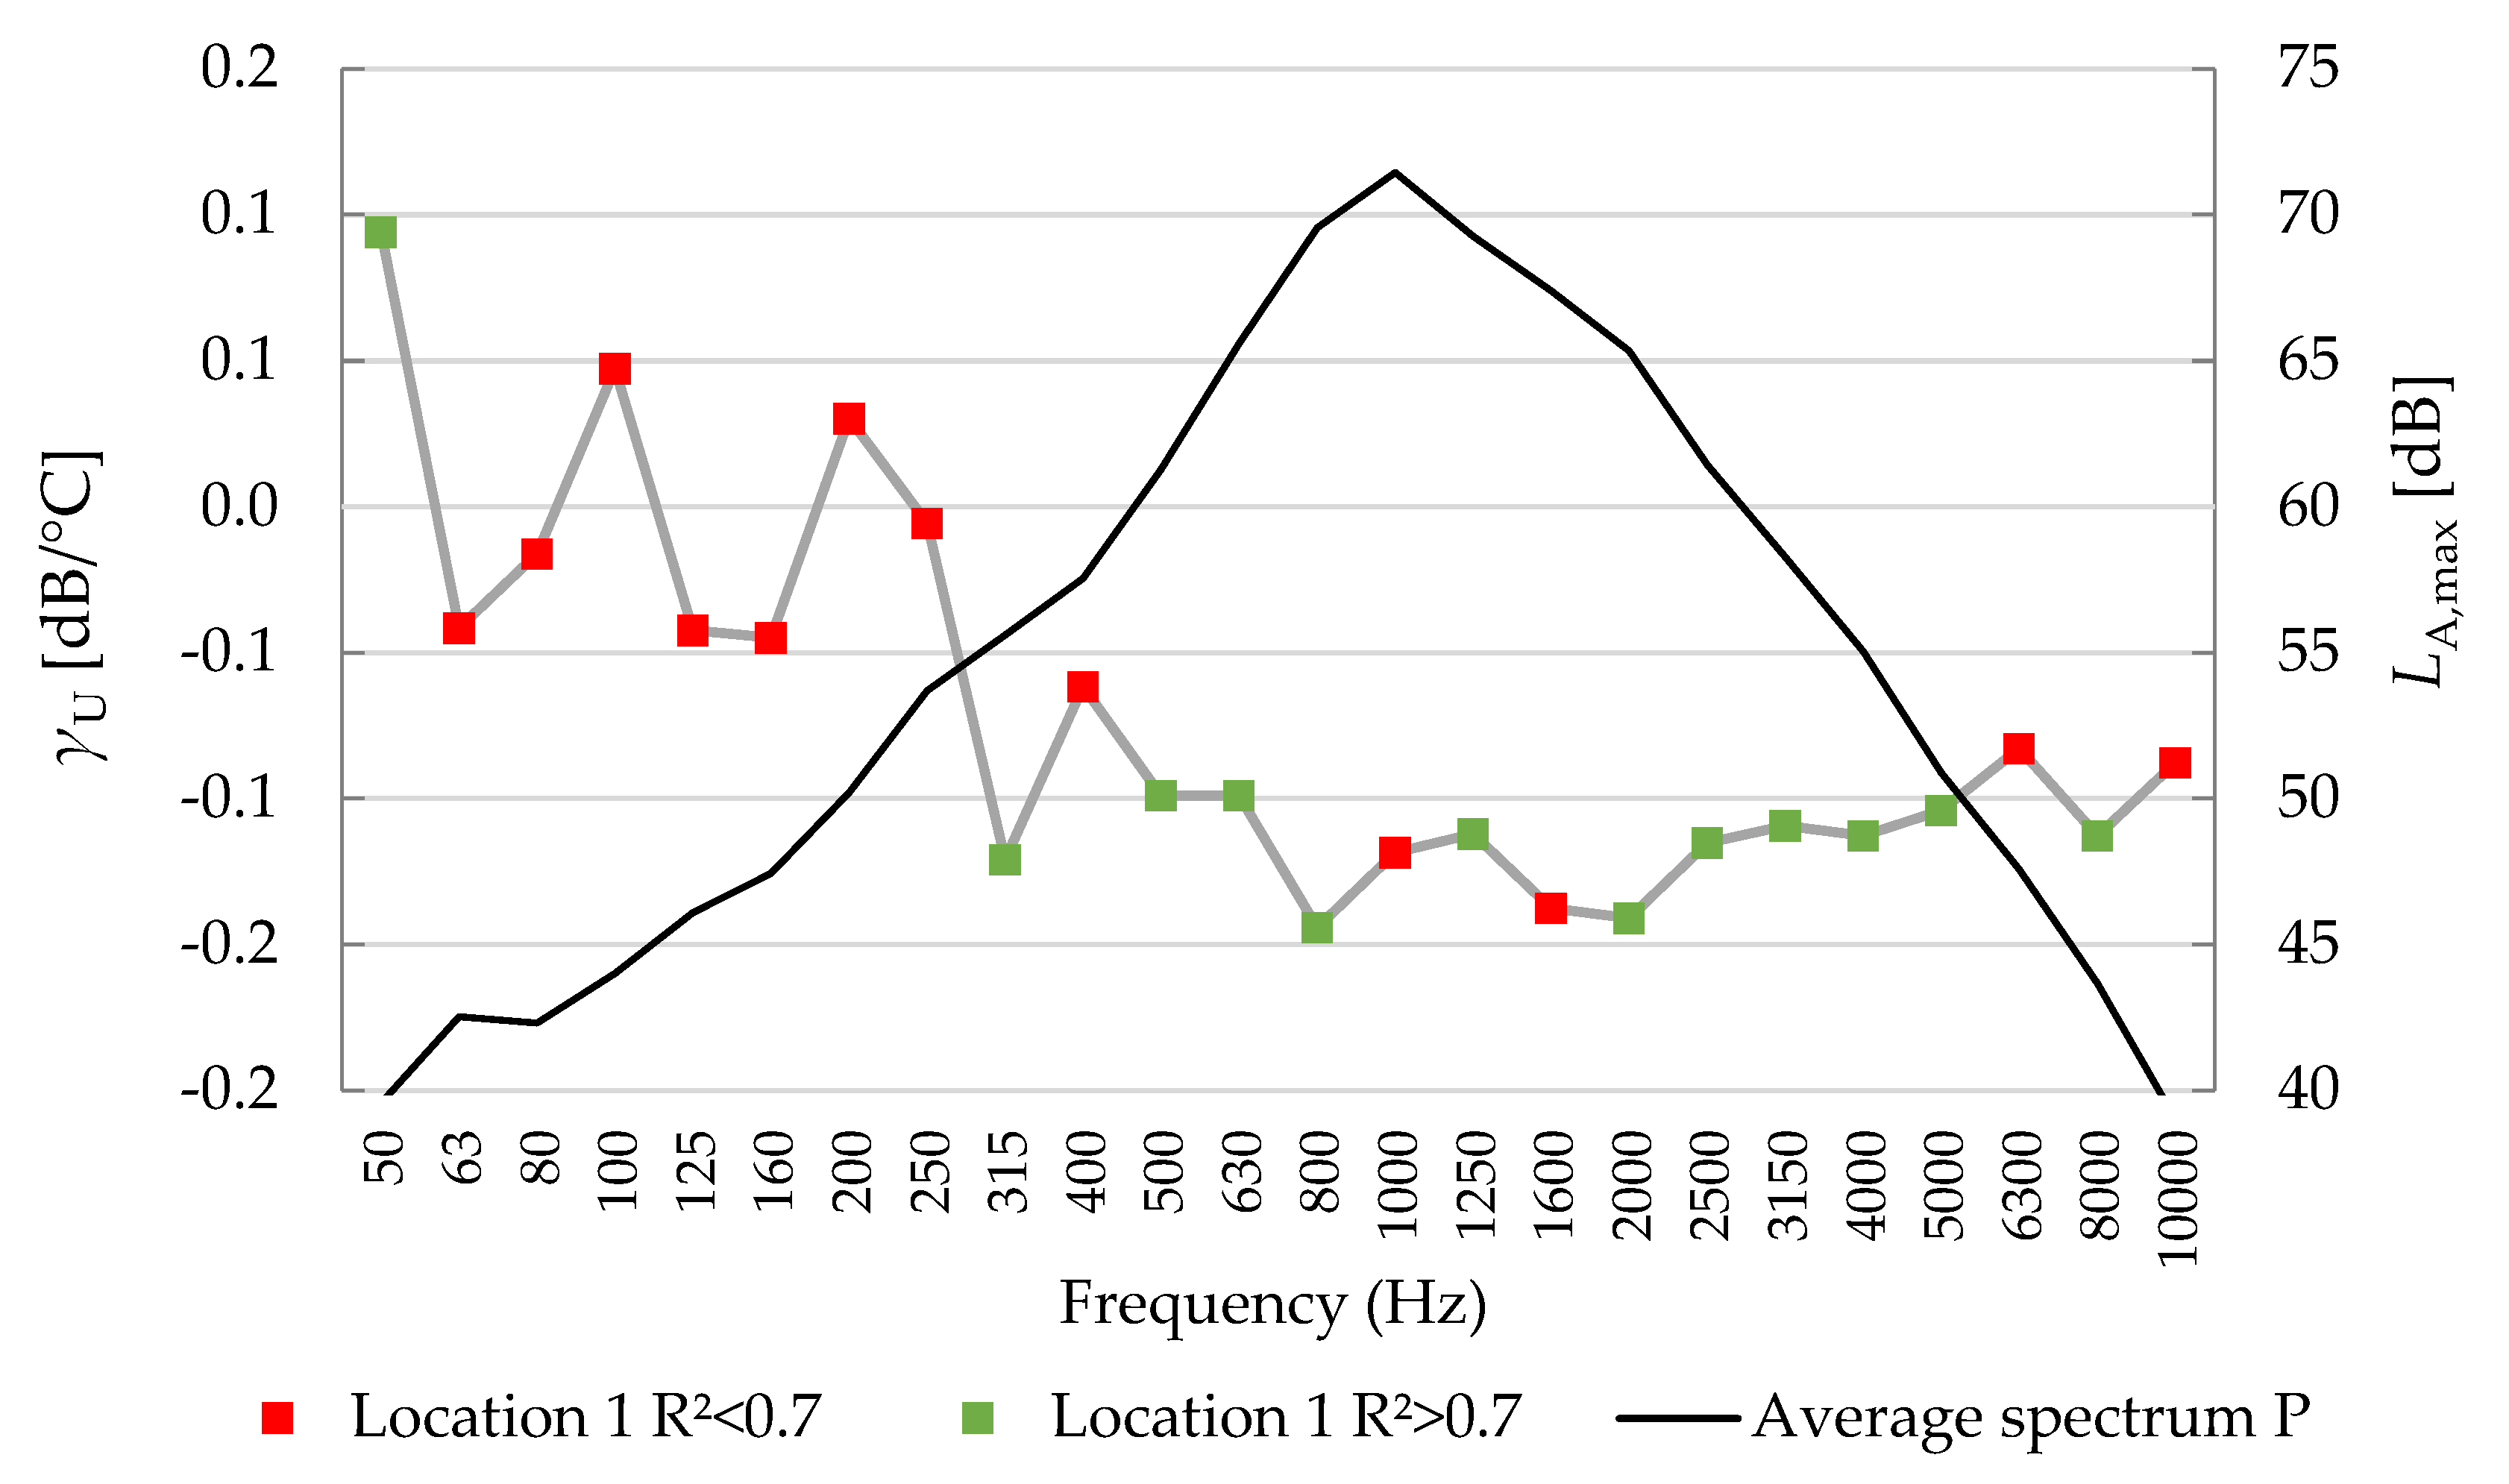
- An analysis of temperature coefficients in one-third-octave bands for passenger cars showed no temperature influence at the low-frequency range (<315 Hz), contradicting previous research. A temperature influence at the middle and high frequencies (315–10,000 Hz) was statistically proven. Unexpectedly, the temperature coefficients in this range are considerably unvarying, and thus are not spectral dependent, ranging between −0.10 and −0.15 dB/°C.
Author Contributions
Funding
Data Availability Statement
Acknowledgments
Conflicts of Interest
References
- Havard, S.; Reich, B.J.; Bean, K.; Chaix, B. Social inequalities in residential exposure to road traffic noise: An environmental justice analysis based on the RECORD Cohort Study. Occup. Environ. Med. 2011, 68, 366–374. [Google Scholar] [CrossRef] [PubMed] [Green Version]
- WHO. Environmental Noise Guideline for the European Region; WHO: Copenhagen, Denmark, 2018. [Google Scholar]
- Kempen, E.; Casas, M.; Pershagen, G.; Foraster, M. WHO Environmental Noise Guidelines for the European Region: A Systematic Review on Environmental Noise and Cardiovascular and Metabolic Effects: A Summary. Int. J. Environ. Res. Public Health 2018, 15, 379. [Google Scholar] [CrossRef] [PubMed] [Green Version]
- Basner, M.; McGuire, S. WHO Environmental Noise Guidelines for the European Region: A Systematic Review on Environmental Noise and Effects on Sleep. Int. J. Environ. Res. Public Health 2018, 15, 519. [Google Scholar] [CrossRef] [PubMed] [Green Version]
- Clark, C.; Paunovic, K. WHO Environmental Noise Guidelines for the European Region: A Systematic Review on Environmental Noise and Quality of Life, Wellbeing and Mental Health. Int. J. Environ. Res. Public Health 2018, 15, 2400. [Google Scholar] [CrossRef] [PubMed] [Green Version]
- Parris, K.M.; Schneider, A. Impacts of Traffic Noise and Traffic Volume on Birds of Roadside Habitats. Ecol. Soc. 2009, 14, 29. [Google Scholar] [CrossRef] [Green Version]
- Capros, P.; De Vita, A.; Tasios, N.; Siskos, P.; Kannavou, M.; Petropoulos, A.; Evangelopoulou, S.; Zampara, M.; Papadopoulos, D.; Nakos, C.; et al. EU Reference Scenario 2016: Energy, Transport and GHG Emissions: Trends to 2050; Publications Office: Luxembourg, 2016. [Google Scholar] [CrossRef]
- Regulation No 117 of the Economic Commission for Europe of the United Nations (UNECE)—Uniform provisions concerning the approval of tyres with regard to rolling sound emissions and/or to adhesion on wet surfaces and/or to rolling resistance [2016/1350]. Off. J. Eur. Union 2016, L 218, 1–106.
- EN ISO 13325:2019; Tyres—Coast-by Methods for Measurement of Tyre-to-Road Sound Emission. The International Organization for Standardization: Geneva, Switzerland, 1997.
- EN ISO 11819-2:2017; Acoustics—Measurement of the Influence of Road Surfaces on Traffic Noise—Part 2: The Close-Proximity Method. The International Organization for Standardization: Geneva, Switzerland, 2017.
- EN ISO 11819-1:1997; Acoustics—Measurement of the Influence of Road Surfaces on Traffic Noise—Part 1: Statistical Pass-By Method. The International Organization for Standardization: Geneva, Switzerland, 1997.
- T 360-16; Standard Method of Test for Measurement of Tire/Pavement Noise Using the On-Board Sound Intensity OBSI Method. AASHTO: Washington, DC, USA, 2020.
- Bühlmann, E.; Ziegler, T. Temperature effects on tyre/road noise measurements. In Proceedings of the InterNoise 2011, Osaka, Japan, 4–7 September 2011. [Google Scholar]
- Sandberg, U.; Ejsmont, J.A. Tyre/Road Noise Reference Book; INFORMEX: Kisa/Harg, Sweden, 2002; ISBN 9789163126109/9163126109. [Google Scholar]
- Rasmussen, R.O.; Bernhard, J.R.; Sandberg, U.; Mun, E.P. The Little Book of Quieter Pavements, 1st ed.; Federal Highway Administration: Washington, DC, USA, 2007.
- Ling, S.; Yu, F.; Sun, D.; Sun, G. A comprehensive review of tire-pavement noise: Generation mechanism, measurement methods, and quiet asphalt pavement. J. Clean. Prod. 2021, 287, 125056. [Google Scholar] [CrossRef]
- Anfosso-Lédée, F.; Pichaud, Y. Temperature effect on tyre–road noise. Appl Acoust. 2007, 68, 1–16. [Google Scholar] [CrossRef]
- Hamet, J.F.; Klein, P. Road Stiffness Influence on Rolling Noise: Parametric Study Using a Rolling Tire Model. SILVIA-INRETS-008-WP2, 2004. Available online: https://hal.archives-ouvertes.fr/hal-00546101/document (accessed on 10 January 2022).
- Bendtsen, H.; Lu, Q.; Kohler, E. Temperature Influence on Road Traffic Noise: Californian OBSI Measurement Study; UCPRC-RP-2010-02; The Danish Road Institute—Road Directorate and University of California Pavement Research Center. 2010. Available online: http://www.ucprc.ucdavis.edu/pdf/UCPRC-RP-2010-02.pdf (accessed on 10 January 2022).
- EN ISO/DIS 11819-1:2021; EN ISO. Acoustics—Measurement of the Influence of Road Surfaces on Traffic Noise—Part 1: Statistical Pass-By Method. The International Organization for Standardization: Geneva, Switzerland, 2021.
- EN ISO/DTS 13471-2; Acoustics—Temperature Influence on Tyre/Road Noise Measurement—Part 2: Correction for Temperature When Testing with the Pass-By Methods. The International Organization for Standardization: Geneva, Switzerland, 2021.
- Bühlmann, E.; Ziegler, T. Temperature effects on tyre/road noise measurements and the main reasons for their variation. In Proceedings of the InterNoise 2013, Innsbruck, Austria, 15–18 September 2013. [Google Scholar]
- Bühlmann, E.; Schlatter, F.; Sandberg, U. Temperature influence on tire/road noise measurements: Recently collected data and discussion of various issues related to standard testing procedures. In Proceedings of the InterNoise 2021, Washington, DC, USA, 1–5 August 2021; pp. 1380–1395. [Google Scholar] [CrossRef]
- Sánchez-Fernández, M.; Barrigón Morillas, J.M.; Montes González, D.; Rey Gozalo, G. Relationship between temperature and road traffic noise under actual conditions of continuous vehicle flow. Transp. Res. D 2021, 100, 103056. [Google Scholar] [CrossRef]
- Bendtsen, H.; Lu, Q.; Kohler, E. Acoustic Aging of Asphalt Pavements: A Californian/Danish Comparison. Report: UCPRC-RP-2010-01. The Danish Road Institute—Road Directorate and University of California Pavement Research Center. 2010. Available online: http://www.ucprc.ucdavis.edu/pdf/UCPRC-RP-2010-01.pdf (accessed on 10 January 2022).
- Vieira, T.; Sandberg, U. Temperature Effects on Tyre/Road Noise Measurements; Project Report R3.1; CEDR Transnational Road Research Programme Call 2018; Noise and Nuisance: London, UK, 2021. [Google Scholar]
- ISO/TS 13471-1:2017; EN ISO. Acoustics—Temperature Influence on Tyre/Road Noise Measurement—Part 1: Correction for Temperature When Testing with the CPX Method. The International Organization for Standardization: Geneva, Switzerland, 2021.
- Bühlmann, E.; Sandberg, U.; Mioduszewski, P. Speed dependency of temperature effects on road traffic noise. In Proceedings of the Internoise 2015, San Francisco, CA, USA, 9–12 August 2015. [Google Scholar]
- Jabben, J.; Potma, C. Temperature Effects on Road Traffic Noise Measurements. J. Appl. Phys. 2013, 2, 43–46. [Google Scholar]
- Landsberger, B.J.; DeMoss, J.; McNerney, M. Effects of Air and Road Surface Temperature on Tire Pavement Noise on an ISO 10844 Surface. In Proceedings of the 2001 Noise and Vibration Conference, Traverse City, MI, USA, 30 April–3 May 2001. [Google Scholar]
- United States Department of Transportation. Investigation of Temperature Correction for Tire/Pavement Noise Measurements; Federal Highway Administration: Washington, DC, USA, 2010. Available online: https://rosap.ntl.bts.gov/view/dot/9338/dot_9338_DS1.pdf (accessed on 10 January 2022).
- Yuan, M.; Ni, D.; Zhang, D.; Wei, X.; Wang, Z.; Wang, C. Effect of temperature on road pass-by noise of light vehicle. IOP Conf. Ser. Earth Environ. Sci. 2019, 310, 022003. [Google Scholar] [CrossRef]
- Jackett, R. Task A: Close Proximity versus Wayside Measurements; 5-27854.00 TASKA; NZTA Road Surface Noise Research Programme: Wellington, New Zealand, 2019. [Google Scholar]
- Sandberg, U.; Mioduszewski, P. Deliverable D2.2: Measurement Methods for the Noise Emission Properties of Road Surfaces; Rosanne Project, 2015. Available online: https://www.rosanne-project.eu/ajax/DownloadHandlerFM.php/downloadFile?id=11820 (accessed on 10 January 2022).
- Mioduszewski, P.; Taryma, S.; Woźniak, R. Temperature influence on tyre/road noise of selected tyres. In Proceedings of the InterNoise 2014, Melbourne, Australia, 16–19 November 2014. [Google Scholar]
- van Keulen, W. The Numerical Effects of Non-Low Noise Roadtypes on Roundabouts Revisited. In Proceedings of the 20th International Congress on Sound and Vibration, Bangkok, Thailand, 7–11 July 2013. [Google Scholar]
- Kragh, J.; Holck Skov, R.S.; Oddershede, J.; Anfosso-Lédée, F.; Bartolomaeus, W.; Zöller, M.; Berge, T.; Bergiers, A.; Muirhead, M.; Werh, R. Deliverable D2.3: Report on the Analysis and Comparison of Existing Noise Measurement Methods for Noise Properties of Road Surfaces; Rosanne Project, 2015. Available online: https://www.rosanne-project.eu/ajax/DownloadHandlerFM.php/downloadFile?id=11821 (accessed on 10 January 2022).


| Location 1 | Location 2 | Location 3 | |||||||
|---|---|---|---|---|---|---|---|---|---|
| Address | Keetberglaan, Zwijndrecht, Belgium | Krijgsbaan, Zwijndrecht, Belgium | Stuivenbergvaart, Mechelen, Belgium | ||||||
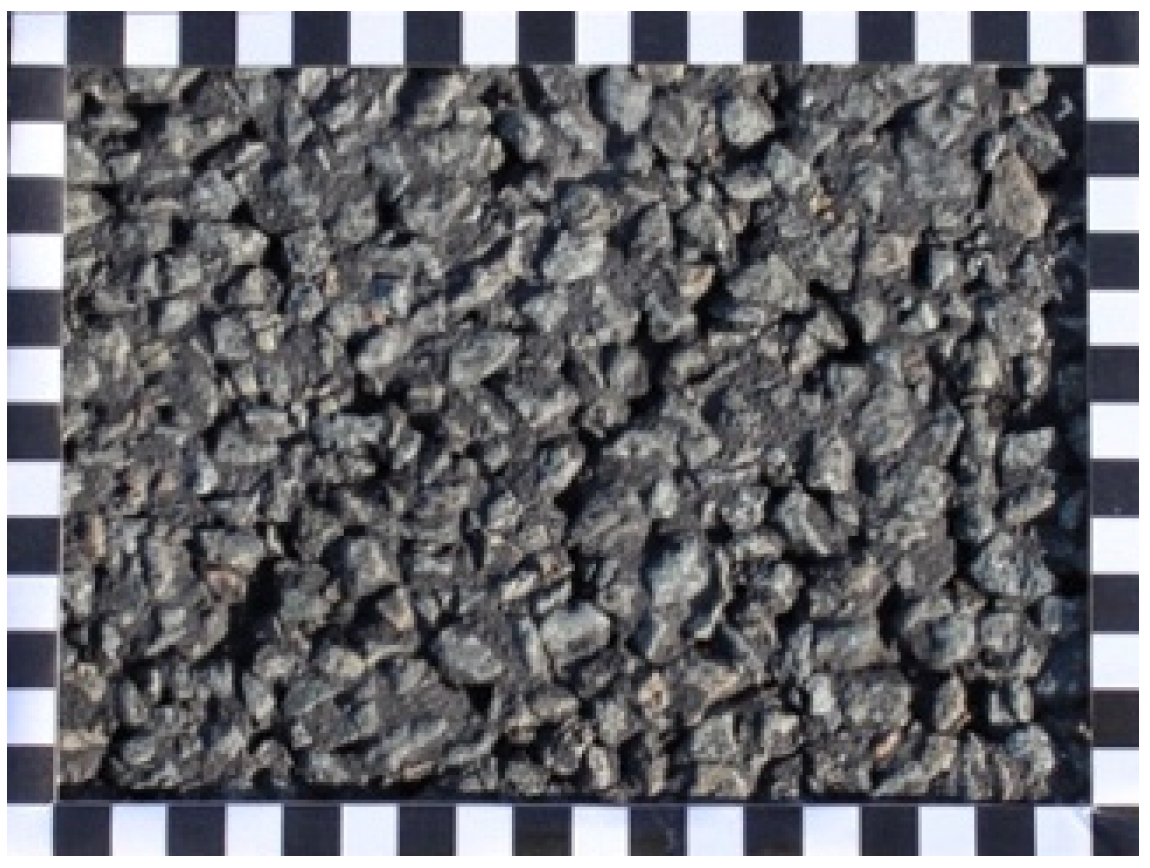 Scale: 1 square = 1 cm |  Scale: 1 square = 1 cm | 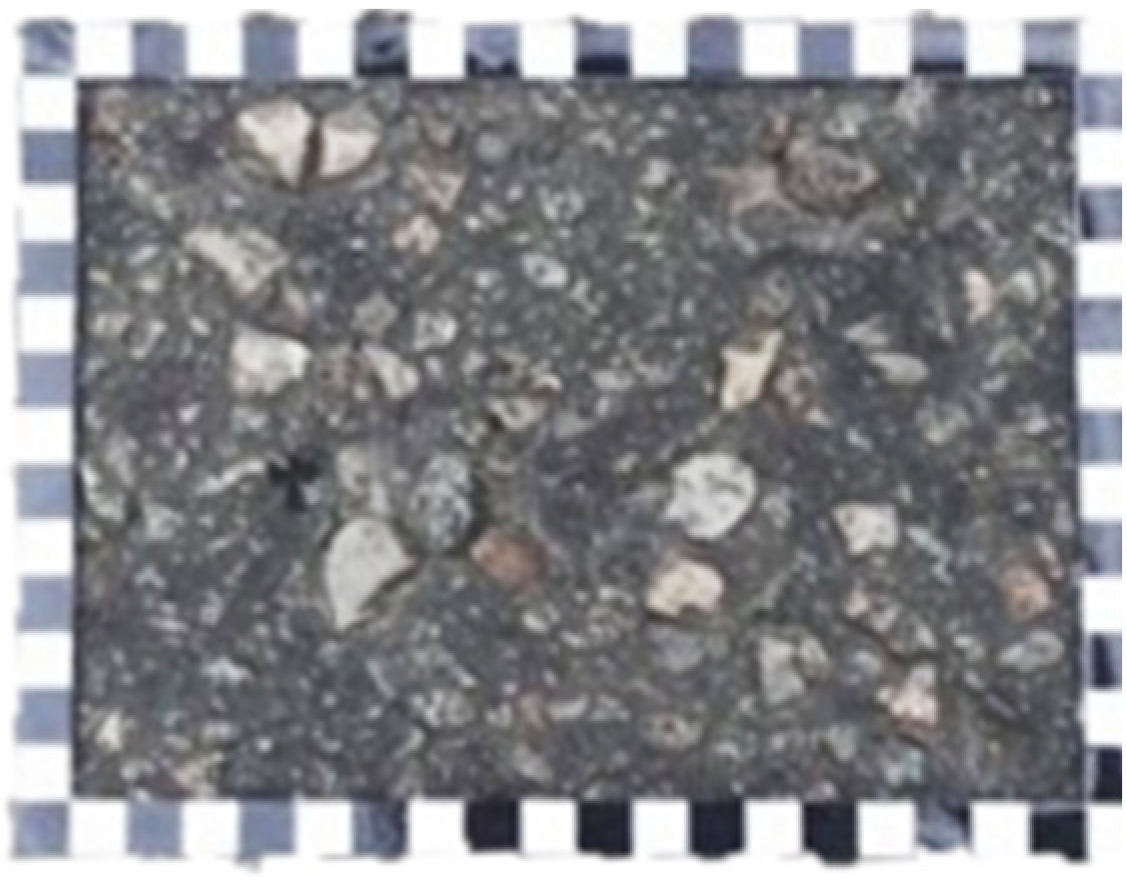 Scale: 1 square = 1 cm | |||||||
| Asphalt type | Stone Mastic Asphalt (SMA-10) | Stone Mastic Asphalt (SMA-10) | Asphalt Concrete (AC) | ||||||
| Max. aggregate size | 10 mm | 10 mm | 40 mm | ||||||
| Mean Profile Depth | 1.2 mm | 1.0 mm | 1.8 mm | ||||||
| Surface between lane and mic. | Asphalt parking lane | Cobblestone parking laneConcrete bike lane | Concrete block pave bike lane and sidewalk | ||||||
| Remarks regarding acoustically free field |
|
|
| ||||||
| Speed limit | 70 km/h | 70 km/h | 70 km/h | ||||||
| Vehicle category | P | HD | HM | P | HD | HM | P | HD | HM |
| Avg. speed | 63 km/h | 55 km/h | 53 km/h | 51 km/h | 46 km/h | 45 km/h | 51 km/h | 47 km/h | 46 km/h |
| N° pass-bys | 773 | 101 | 1855 | 898 | 137 | 384 | 1225 | 57 | 286 |
| Measurement time | 7 days | 5 days | 6 days | ||||||
| R2 | SE | p-Value | R2 | SE | p-Value | R2 | SE | p-Value | ||||
|---|---|---|---|---|---|---|---|---|---|---|---|---|
| P | ||||||||||||
| Location 1 | −0.108 | 0.895 | 0.012 | <0.001 | −0.073 | 0.830 | 0.011 | <0.001 | −0.078 | 0.708 | 0.016 | <0.001 |
| Location 2 | −0.101 | 0.873 | 0.013 | <0.001 | −0.071 | 0.740 | 0.011 | <0.001 | −0.090 | 0.827 | 0.012 | <0.001 |
| Location 3 | −0.099 | 0.836 | 0.012 | <0.001 | −0.093 | 0.838 | 0.011 | <0.001 | −0.093 | 0.822 | 0.012 | <0.001 |
| Average | −0.103 | 0.868 | 0.012 | - | −0.079 | 0.802 | 0.011 | - | −0.087 | 0.786 | 0.013 | - |
| HM | ||||||||||||
| Location 1 | 0.007 1 | 0.039 | 0.009 | n.s. | 0.007 1 | 0.046 | 0.007 | n.s. | 0.005 1 | 0.043 | 0.006 | n.s. |
| Location 2 | −0.004 | 0.015 | 0.018 | n.s. | −0.007 | 0.095 | 0.008 | n.s. | −0.008 | 0.095 | 0.011 | n.s. |
| Location 3 | −0.034 | 0.500 | 0.015 | n.s. | −0.020 | 0.347 | 0.014 | n.s. | −0.013 | 0.121 | 0.018 | n.s. |
| Average | −0.010 | 0.184 | 0.014 | - | −0.006 | 0.163 | 0.010 | - | −0.005 | 0.086 | 0.011 | - |
| HD 2 | ||||||||||||
| Location 1 | −0.026 | 0.228 | 0.034 | n.s. | −0.022 | 0.302 | 0.019 | n.s. | −0.023 | 0.256 | 0.022 | n.s. |
| Location 2 | −0.022 | 0.114 | 0.030 | n.s. | 0.010 1 | 0.031 | 0.028 | n.s. | <0.001 1 | <0.001 | 0.024 | n.s. |
| Average | −0.024 | 0.171 | 0.032 | - | −0.006 | 0.167 | 0.024 | - | −0.011 | 0.128 | 0.023 | - |
| Standard/Regulation | Method | Temp. Used | Tyre/Vehicle | Pavement Type | Temp. Coefficient |
|---|---|---|---|---|---|
| UNECE R. 117 [8] | Coast-by | Road | C1 (=P) | ISO 10844 | 5–20 °C: −0.06 20–50 °C: −0.03 |
| C3 (=HD and HM) | - | ||||
| ISO/TS 13471-1 [27] | CPX | Air | SRTT and AVON AV4 | Dense asphalt | −0.14 + 0.0006v |
| ISO/DTS 13471-2 [21] | SPB and others | Air | C1 (=P) and C2 | Dense asphalt | −0.10 1 |
| C3 (=HD and HM) | −0.06 1 | ||||
| AASHTO T 360-2016 [12] | OBSI | Air | SRTT | All | −0.072 |
| Publication | R2air | Method | Temp. Range Air/Road | Pavement Type | Speed [km/h] | Comment(s) | |
|---|---|---|---|---|---|---|---|
| Sánchez-Fernández et al. [24] | −0.161 | 0.66 | Continuous Flow | 22–32/27–53 | DAC | 100 |
|
| Jabben et al. [29] | −0.05 | / | SPB | −6–19 | DAC | 60 |
|
| Landsberger et al. [30] | −0.027 | poor | Coast-by | 5–35 | ISO 10844 | 53–80 |
|
| Anfosso-Ledée et al. [17] | −0.10 | 0.86 | CPB | 0–30/0–50 | DAC | 90 |
|
| U.S.DoT [31] | −0.05 | / | Continuous flow and SPB, both at 15 m | / | DAC |
| |
| Yuan et al. [32] | −0.079 | / | CPB | 1–33/5–55 | Dense asphalt | 60 |
|
| Publication | R2 | Method | Temp. Range Air/Road | Pavement Type | Speed [km/h] | Comment(s) | |
|---|---|---|---|---|---|---|---|
| Sandberg et al. [34] | −0.070 | / | Test on drums in lab | 6–36/8–40 | DAC | 50 |
|
| Bühlmann et al. [13] | −0.11 | / | CPX: Avon AV4 | 7–35/- | DAC | 50 and 80 | |
| Jabben et al. [29] | 0 | / | SPB | −6–19/- | DAC | 70–100 |
|
| Mioduszewski et al. [35] | −0.093 | 0.93 | CPX: Avon AV4 | 3–28/10–36 | SMA | 50 |
|
| Bentsen et al. [19] | −0.048 | / | CPB | 0–35 | Dense | 70 | |
| U.S.DoT [31] | −0.02 | / | Pass-by at 15 m | DAC | / |
|
| Location | [dB] | [dB] | Predicted [dB] |
|---|---|---|---|
| Location 1 | 92.8 ± 0.1 | 74.3 | 72.6 |
| Location 2 | 92.6 ± 0.1 | 73.8 | 72.4 |
| Location 3 | 92.8 ± 0.3 | 74.4 | 72.6 |
Publisher’s Note: MDPI stays neutral with regard to jurisdictional claims in published maps and institutional affiliations. |
© 2022 by the authors. Licensee MDPI, Basel, Switzerland. This article is an open access article distributed under the terms and conditions of the Creative Commons Attribution (CC BY) license (https://creativecommons.org/licenses/by/4.0/).
Share and Cite
Geluykens, M.; de Barros, A.G.; Goubert, L.; Vuye, C. Empirical Study on Temperature Influence on Noise Measurements with the Statistical Pass-By Method. Sustainability 2022, 14, 2099. https://doi.org/10.3390/su14042099
Geluykens M, de Barros AG, Goubert L, Vuye C. Empirical Study on Temperature Influence on Noise Measurements with the Statistical Pass-By Method. Sustainability. 2022; 14(4):2099. https://doi.org/10.3390/su14042099
Chicago/Turabian StyleGeluykens, Michiel, Ablenya Grangeiro de Barros, Luc Goubert, and Cedric Vuye. 2022. "Empirical Study on Temperature Influence on Noise Measurements with the Statistical Pass-By Method" Sustainability 14, no. 4: 2099. https://doi.org/10.3390/su14042099
APA StyleGeluykens, M., de Barros, A. G., Goubert, L., & Vuye, C. (2022). Empirical Study on Temperature Influence on Noise Measurements with the Statistical Pass-By Method. Sustainability, 14(4), 2099. https://doi.org/10.3390/su14042099