Article

Environmental Accounting of the Yellow-Tail Lambari Aquaculture: Sustainability of Rural Freshwater Pond Systems

by
Tamara Fonseca
1,
Wagner C. Valenti
1,*,
Biagio F. Giannetti
2,
Fernando H. Gonçalves
3 and
Feni Agostinho
2
1
Aquaculture Center, São Paulo State University (UNESP), Jaboticabal 14884-900, Brazil
2
Post-Graduation Program on Production Engineering, Paulista University (UNIP), São Paulo 04043-200, Brazil
3
Virginia Seafood Agricultural and Extension Center (VSAREC), Virginia Tech-Virginia Polytechnic Institute and State University, Hampton, VA 23669, USA
*
Author to whom correspondence should be addressed.
Sustainability 2022, 14(4), 2090; https://doi.org/10.3390/su14042090
Submission received: 7 December 2021 / Revised: 5 February 2022 / Accepted: 9 February 2022 / Published: 12 February 2022
(This article belongs to the Special Issue Advances in Rural and Aquatic Sustainability)

Abstract

:
Freshwater pond aquaculture is the prevailing fish culture system worldwide, especially in developing countries. The sustainability of such systems has not been assessed and it can be improved based on suitable scientific analyses. In the present study, we apply the emergy synthesis to assess the sustainability of lambari aquaculture, used as a model of freshwater pond monoculture in Brazil, to identify the key practices, and to propose changes to improve them towards sustainability. As a study model, nine semi-intensive lambari farms operating at three levels of management were evaluated: low (LC), moderate (MC) and high (HC) control. Results showed that the main inputs for LC were services (27–46%), feed (7–39%) and water (15–21%), while for the MC and HC farms, they were feed (35–49% and 17–48%, respectively) and services (33–39% and 26–36%, respectively). All farms required more than 60% of their emergy from purchased inputs, resulting in low emergy sustainability index (ESI = 0.1–0.5). Increasing juvenile productivity, using superficial water instead of springwater, controlling pond fertilization and replacing animal protein in diet composition by vegetable sources can lead systems to higher efficiency and resilience, increasing sustainability.

1. Introduction

Aquaculture has been important to feed a growing world population in the current millennium. As for all production process, the activity should be improved towards more sustainable systems to match the goals of Agenda 2030. Sustainable development was stated as a fundamental goal in the ecosystem approach to aquaculture (EAA) proposed by FAO in 2008 [1] and it remains a major concern [2,3]. Although innovative systems, such as integrated multi-trophic aquaculture (IMTA), aquaponics and bioflocs have been developed to increase productivity and sustainability [4,5,6,7], most of the aquaculture production comes from inland small-scale pond farms in rural areas [3]. They have received less attention in strategic planning and management within EAA concepts than coastal and marine systems [8,9]. Small-scale freshwater aquaculture is not mentioned in the Guidelines of EAA. The production conditions, access, and use of resources and technologies in such systems remain unaddressed [8]. Thus, the EAA framework lacks a systemic approach for understanding how small-scale freshwater pond aquaculture is connected with the surrounding social, economic and environmental systems.
Small-scale inland pond aquaculture should be improved to achieve the goals established by EAA guidelines and by the 2030 Agenda for Sustainable Development [10]. Strategies towards sustainability include using native species, efficient use of feed and locally available resources (such as water and land), control and monitoring of the production variables, suitable infrastructure, and residue recycling [2]. The transition to this new state is costly and sometimes unattainable by small rural farmers. Moreover, the pandemic, economic crises, and climate change increase the vulnerability of small farms, which demands innovative technologies for adjusting production practices to these challenges and promoting sustainability in the longer term. Therefore, it is essential to know the sustainability features of the currently used systems to promote suitable and necessary modifications.
Brazilian aquaculture achieved economic relevance in the early 1980s and currently holds the eighth position in the ranking of major fish producers, with >600 thousand tonnes harvested in 2018 [3,11]. Lambari (Characidae) is a fish group commercialized as live bait or for human food, whose culture is growing very fast in Brazil. Production attained is ~1000 t [11], and there are more than 23,000 farms, ranking the sector at 5th in the number of properties [12]. Lambari is a group of native low-trophic level freshwater fish species widely distributed in South America, the production of which was initially performed only to add income for small farmers. Nevertheless, lambari production has grown during the past decade because of market expansion. Currently, its production occurs primarily in small aquaculture farms, operating in semi-intensive earthen pond systems [12], but the success of the activity has attracted investors, who implement larger farms (>20 ha) that operate with higher demand for infrastructure and energy. Most farms produce the yellowtail lambari Astyanax lacustris (former A. altiparanae) [11,13].
Several different management practices are used in the farming of lambari [13]. Producers settled their management based on culture protocols for other species or on their own tests. There is a gradient in technological level of lambari culture, ranging from farms with no technical support and low control of stocking, feeding, survival, and water flow, to farms with qualified employees, indoor hatcheries, monitoring equipment, and high control of growth and survival. These diversified production systems may be compared to the systems of small-scale land-based fish monoculture in Brazil. Thus, their technical features may be an archetype of similar fish farms. The strengths and constraints currently faced by lambari aquaculture are recurrent in small pond monoculture systems, making the lambari farming an excellent model to study sustainability in freshwater pond fish monoculture.
The assessment of different aquatic production systems and levels of intensification is essential in developing more sustainable systems, for identifying weaknesses and strengths and evaluating the adjustment effects. Different methods have been used, such as life cycle assessment, sets of sustainability indicators, and emergy (with an ‘m’) synthesis [6]. Emergy synthesis is a useful tool for assessing bio-economic systems such as aquaculture [14,15,16,17]. This method evaluates the investment made by nature on a system by accounting for the total energy used directly and indirectly for making a product or service available. It provides insights on the amount of natural resources demanded and how efficiently they are used, their renewability, and the environmental load they generate [17]. In the present study, we apply emergy synthesis to assess the sustainability of lambari aquaculture (used as a model of freshwater fish pond-monoculture in Brazil), identify the key practices from the sustainability perspective, and propose changes to improve them. We hypothesize that the sustainability of freshwater fish pond-monoculture systems can be improved by increasing production efficiency and decreasing the use of non-renewable resources.

2. Materials and Methods

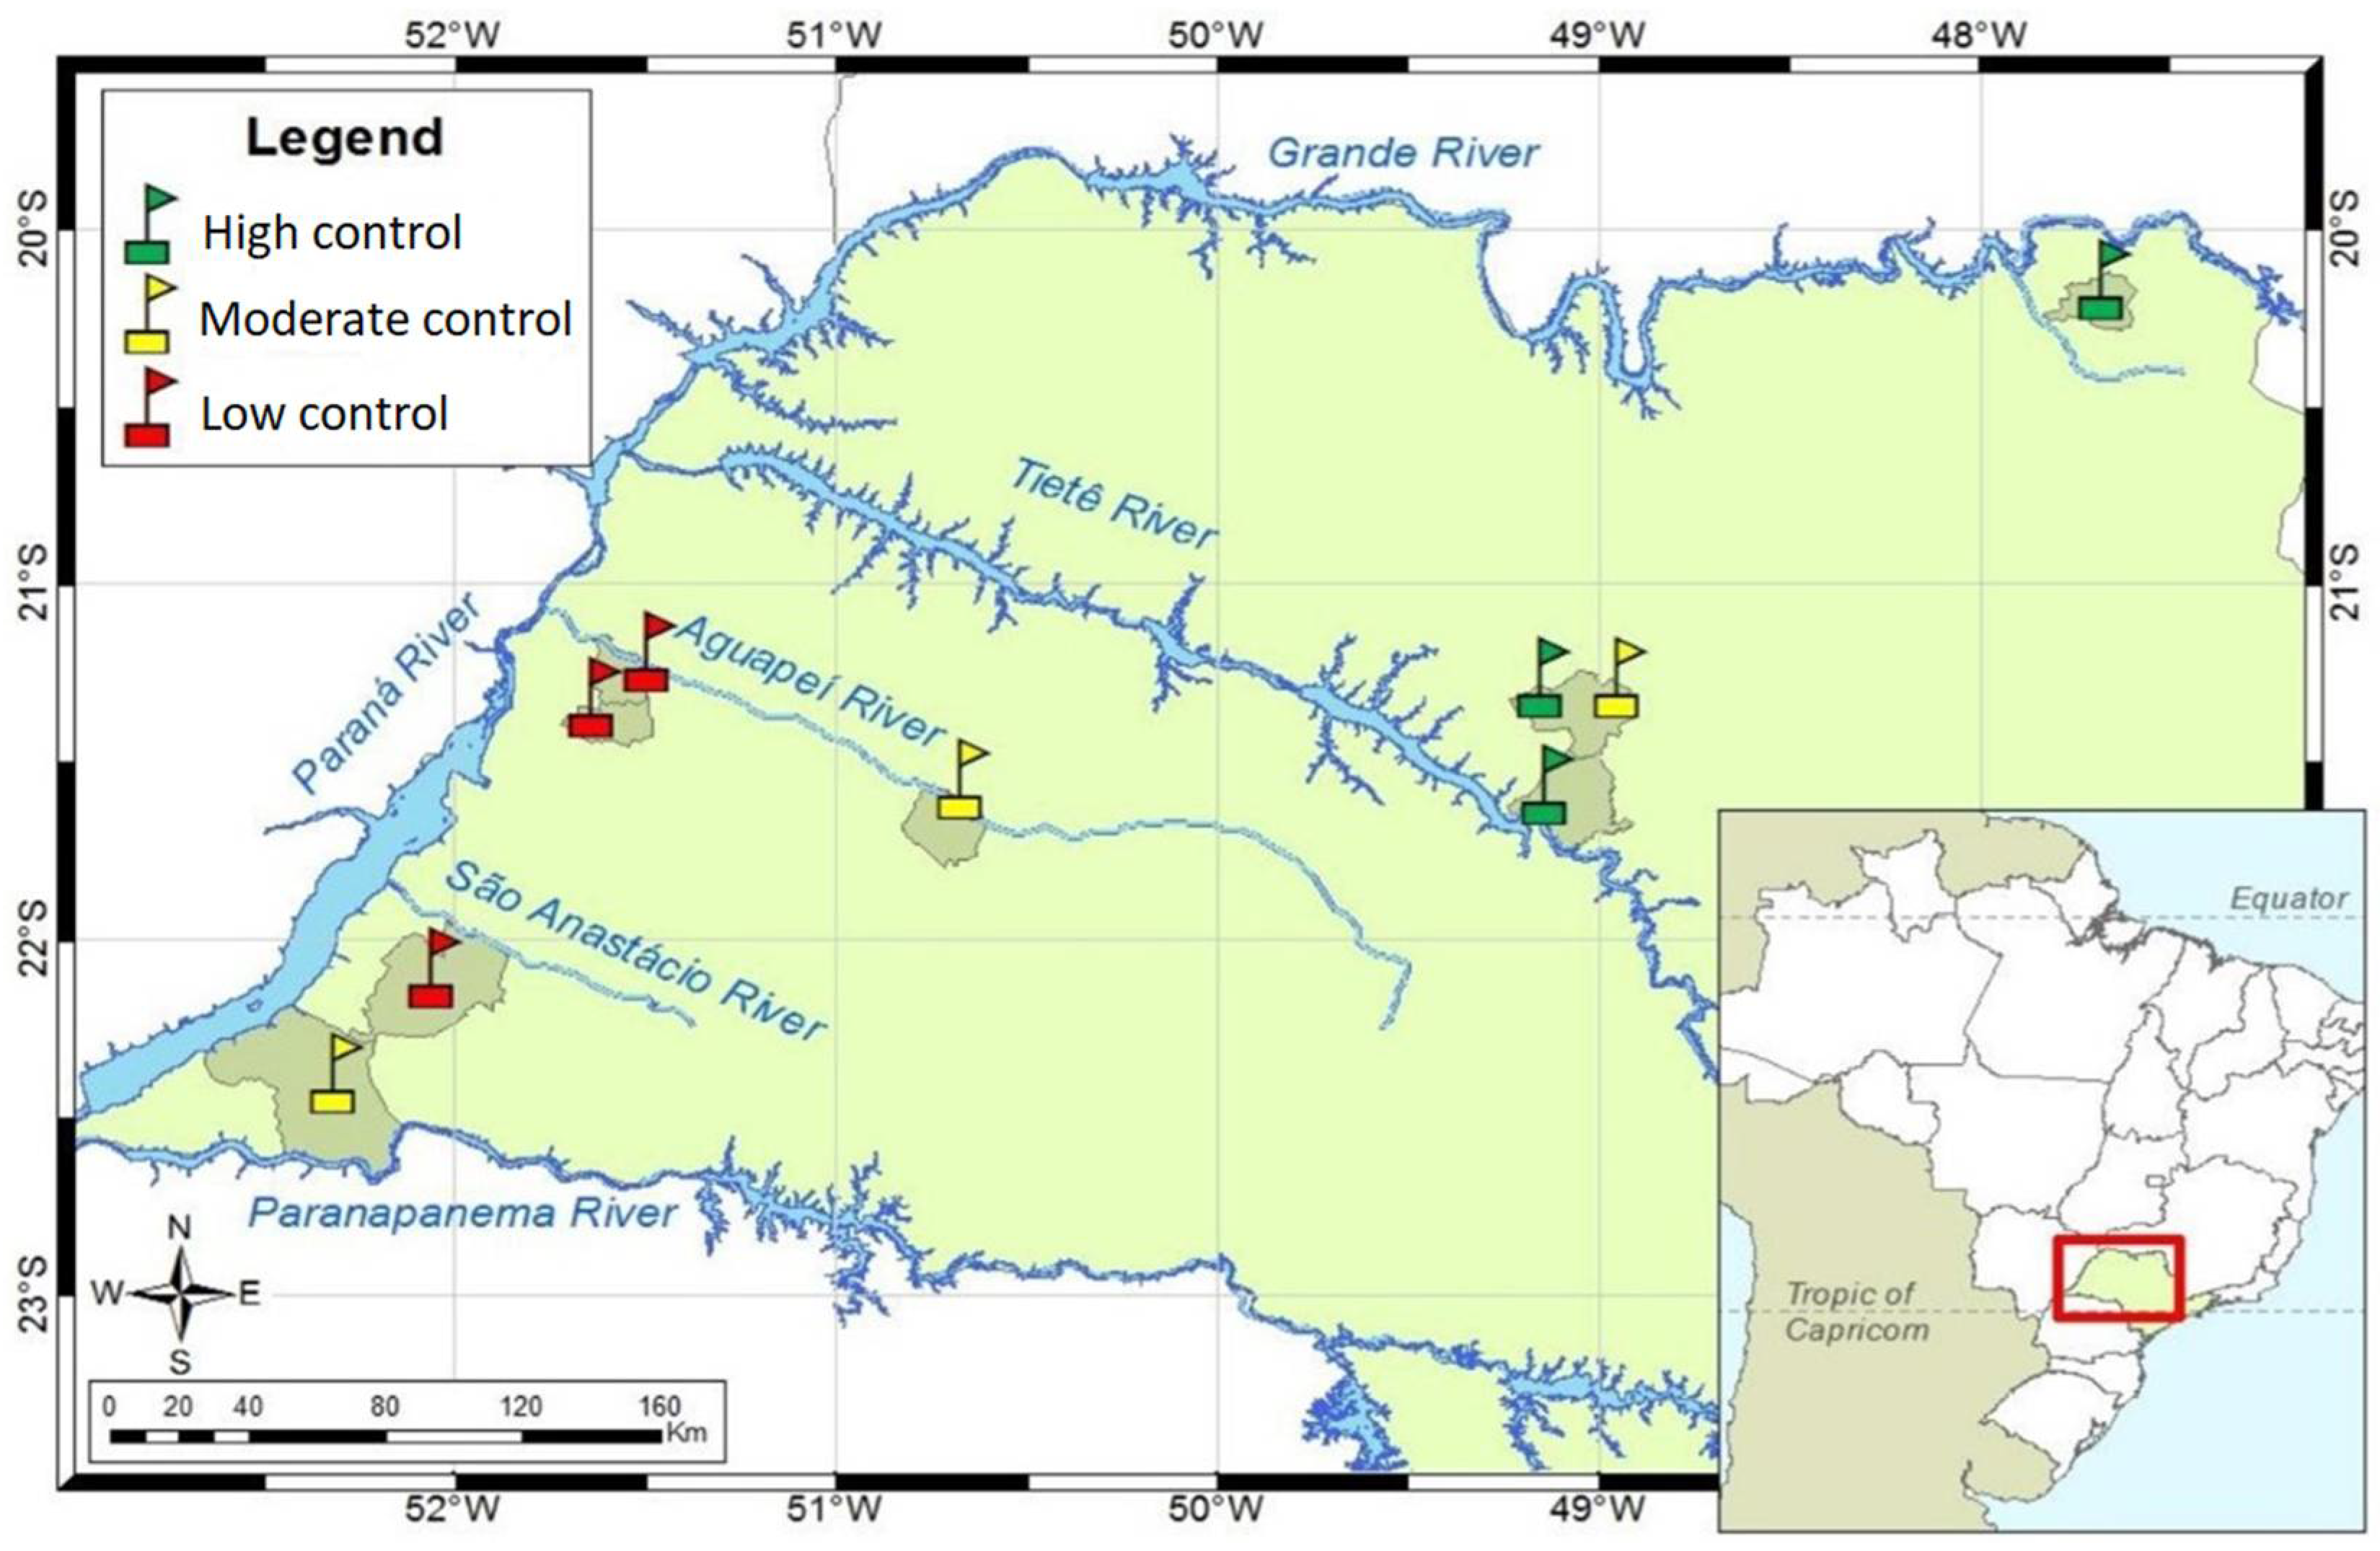
2.1. Data Source and Description of the Studied Farms

Lambari farms differ in land and pond sizes, management strategies, and investments in infrastructure and equipment [13]. Thus, we have analyzed these dissimilarities and grouped the farms into three categories, or levels of control, considering the breeding techniques used (natural, semi-natural, or controlled), infrastructure and equipment available, control and monitoring of water quality and supplied feed, and survival rates. These factors reflect the technification degree. The three farm groups resulting were called: low control (LC), moderate control (MC), and high control (HC) (Table 1). We looked for farms that represented each of the three categories. We consulted with the stakeholders of the lambari value chain for this survey, such as researchers, extensionists, local relevant agents, and the farmers. After that, we visited most of the selected farms and chose three for each category based on the representativity of the culture system and the farmer’s availability to participate in the study voluntarily. Therefore, we assumed that the nine farms studied were representative of the lambari aquaculture in Brazil. They are located in the São Paulo State, Brazil (Figure 1), a subtropical region that concentrates the production of lambari [11]. All farms produce the yellowtail lambari (Astyanax lacustris, former A. altiparanae) in semi-intensive earthen ponds, and intensive feeding with commercial feed.
Data on natural and economic inputs, management practices and landscape features of each farm were obtained on site. Samples of water, sediment, diet, and organisms were collected in two visits occurring at the beginning and end of one production cycle in each of the nine farms. Additional information was obtained through a semi-structured survey, elaborated according to Bryman [18], applied to the nine farmers at the beginning of the production cycle. The questionnaire focused on accounting for the total amount of materials, equipment, and infrastructure purchased, as well as labor, taxes, and depreciation. All inflows of materials, energy and money were accounted in unities/hectare, and they correspond to one year (i.e., 3 production cycles) of the farm operation. Farmers validated the data collected at the end of the survey.

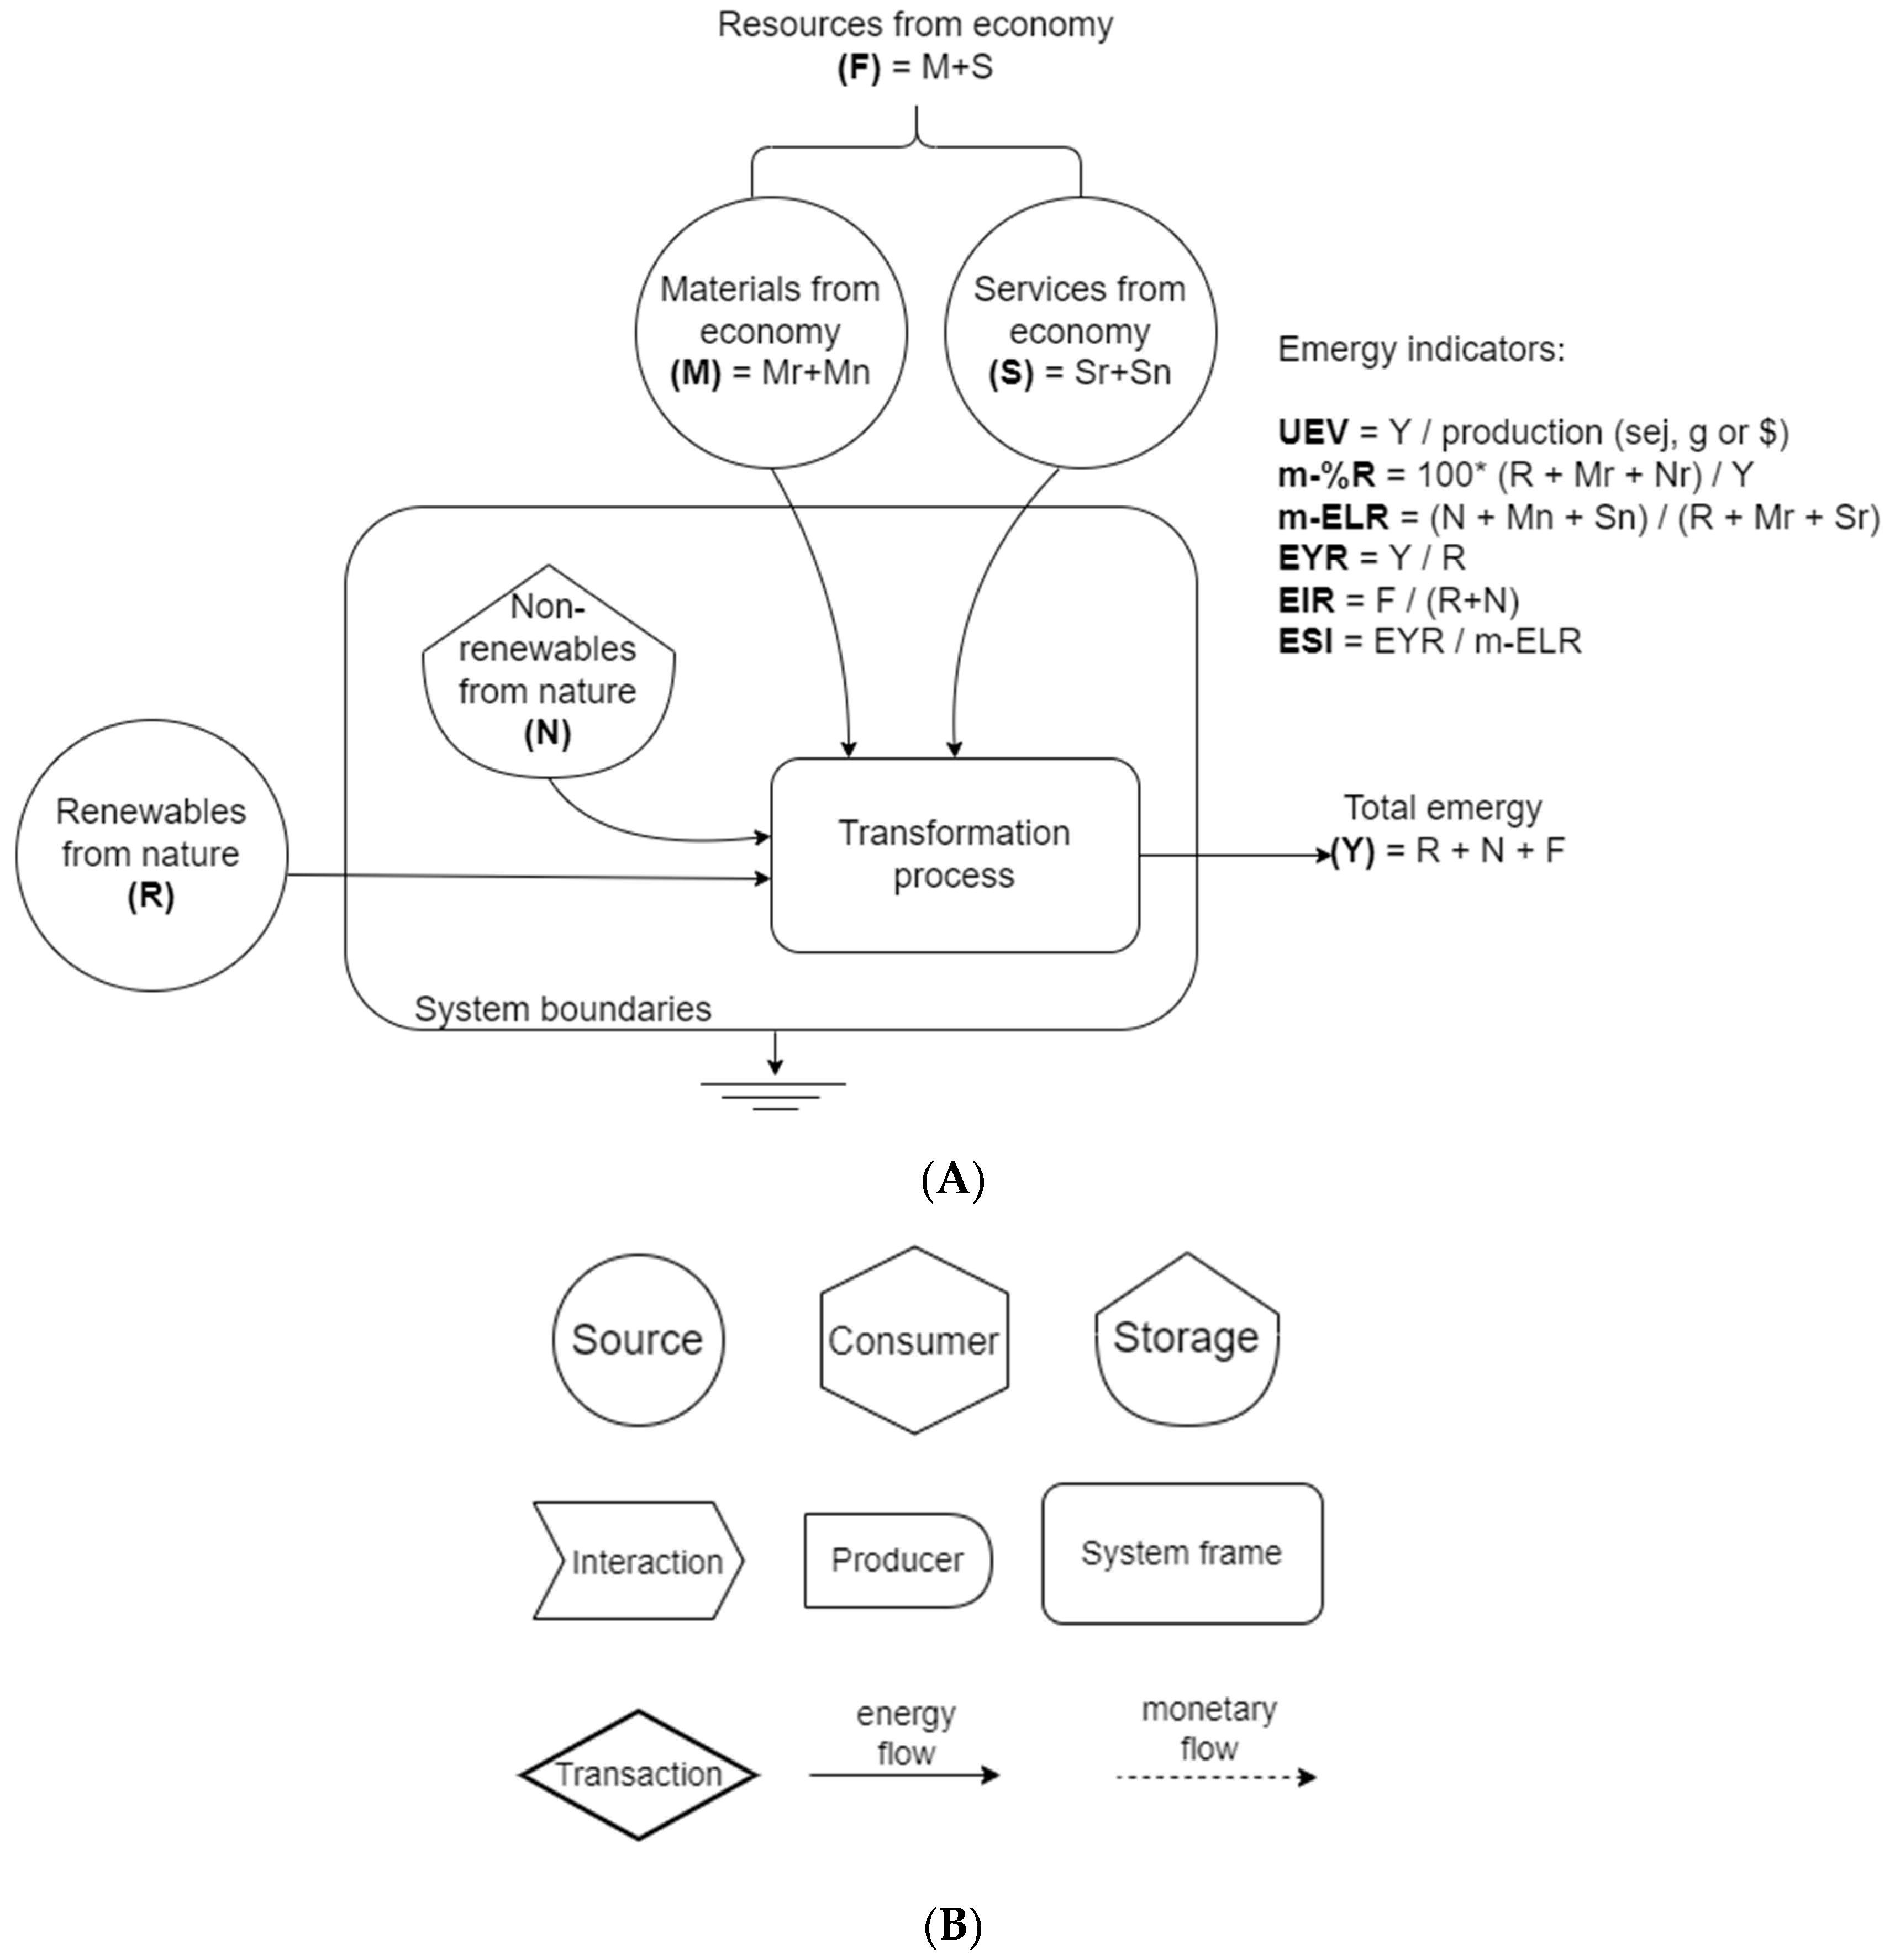
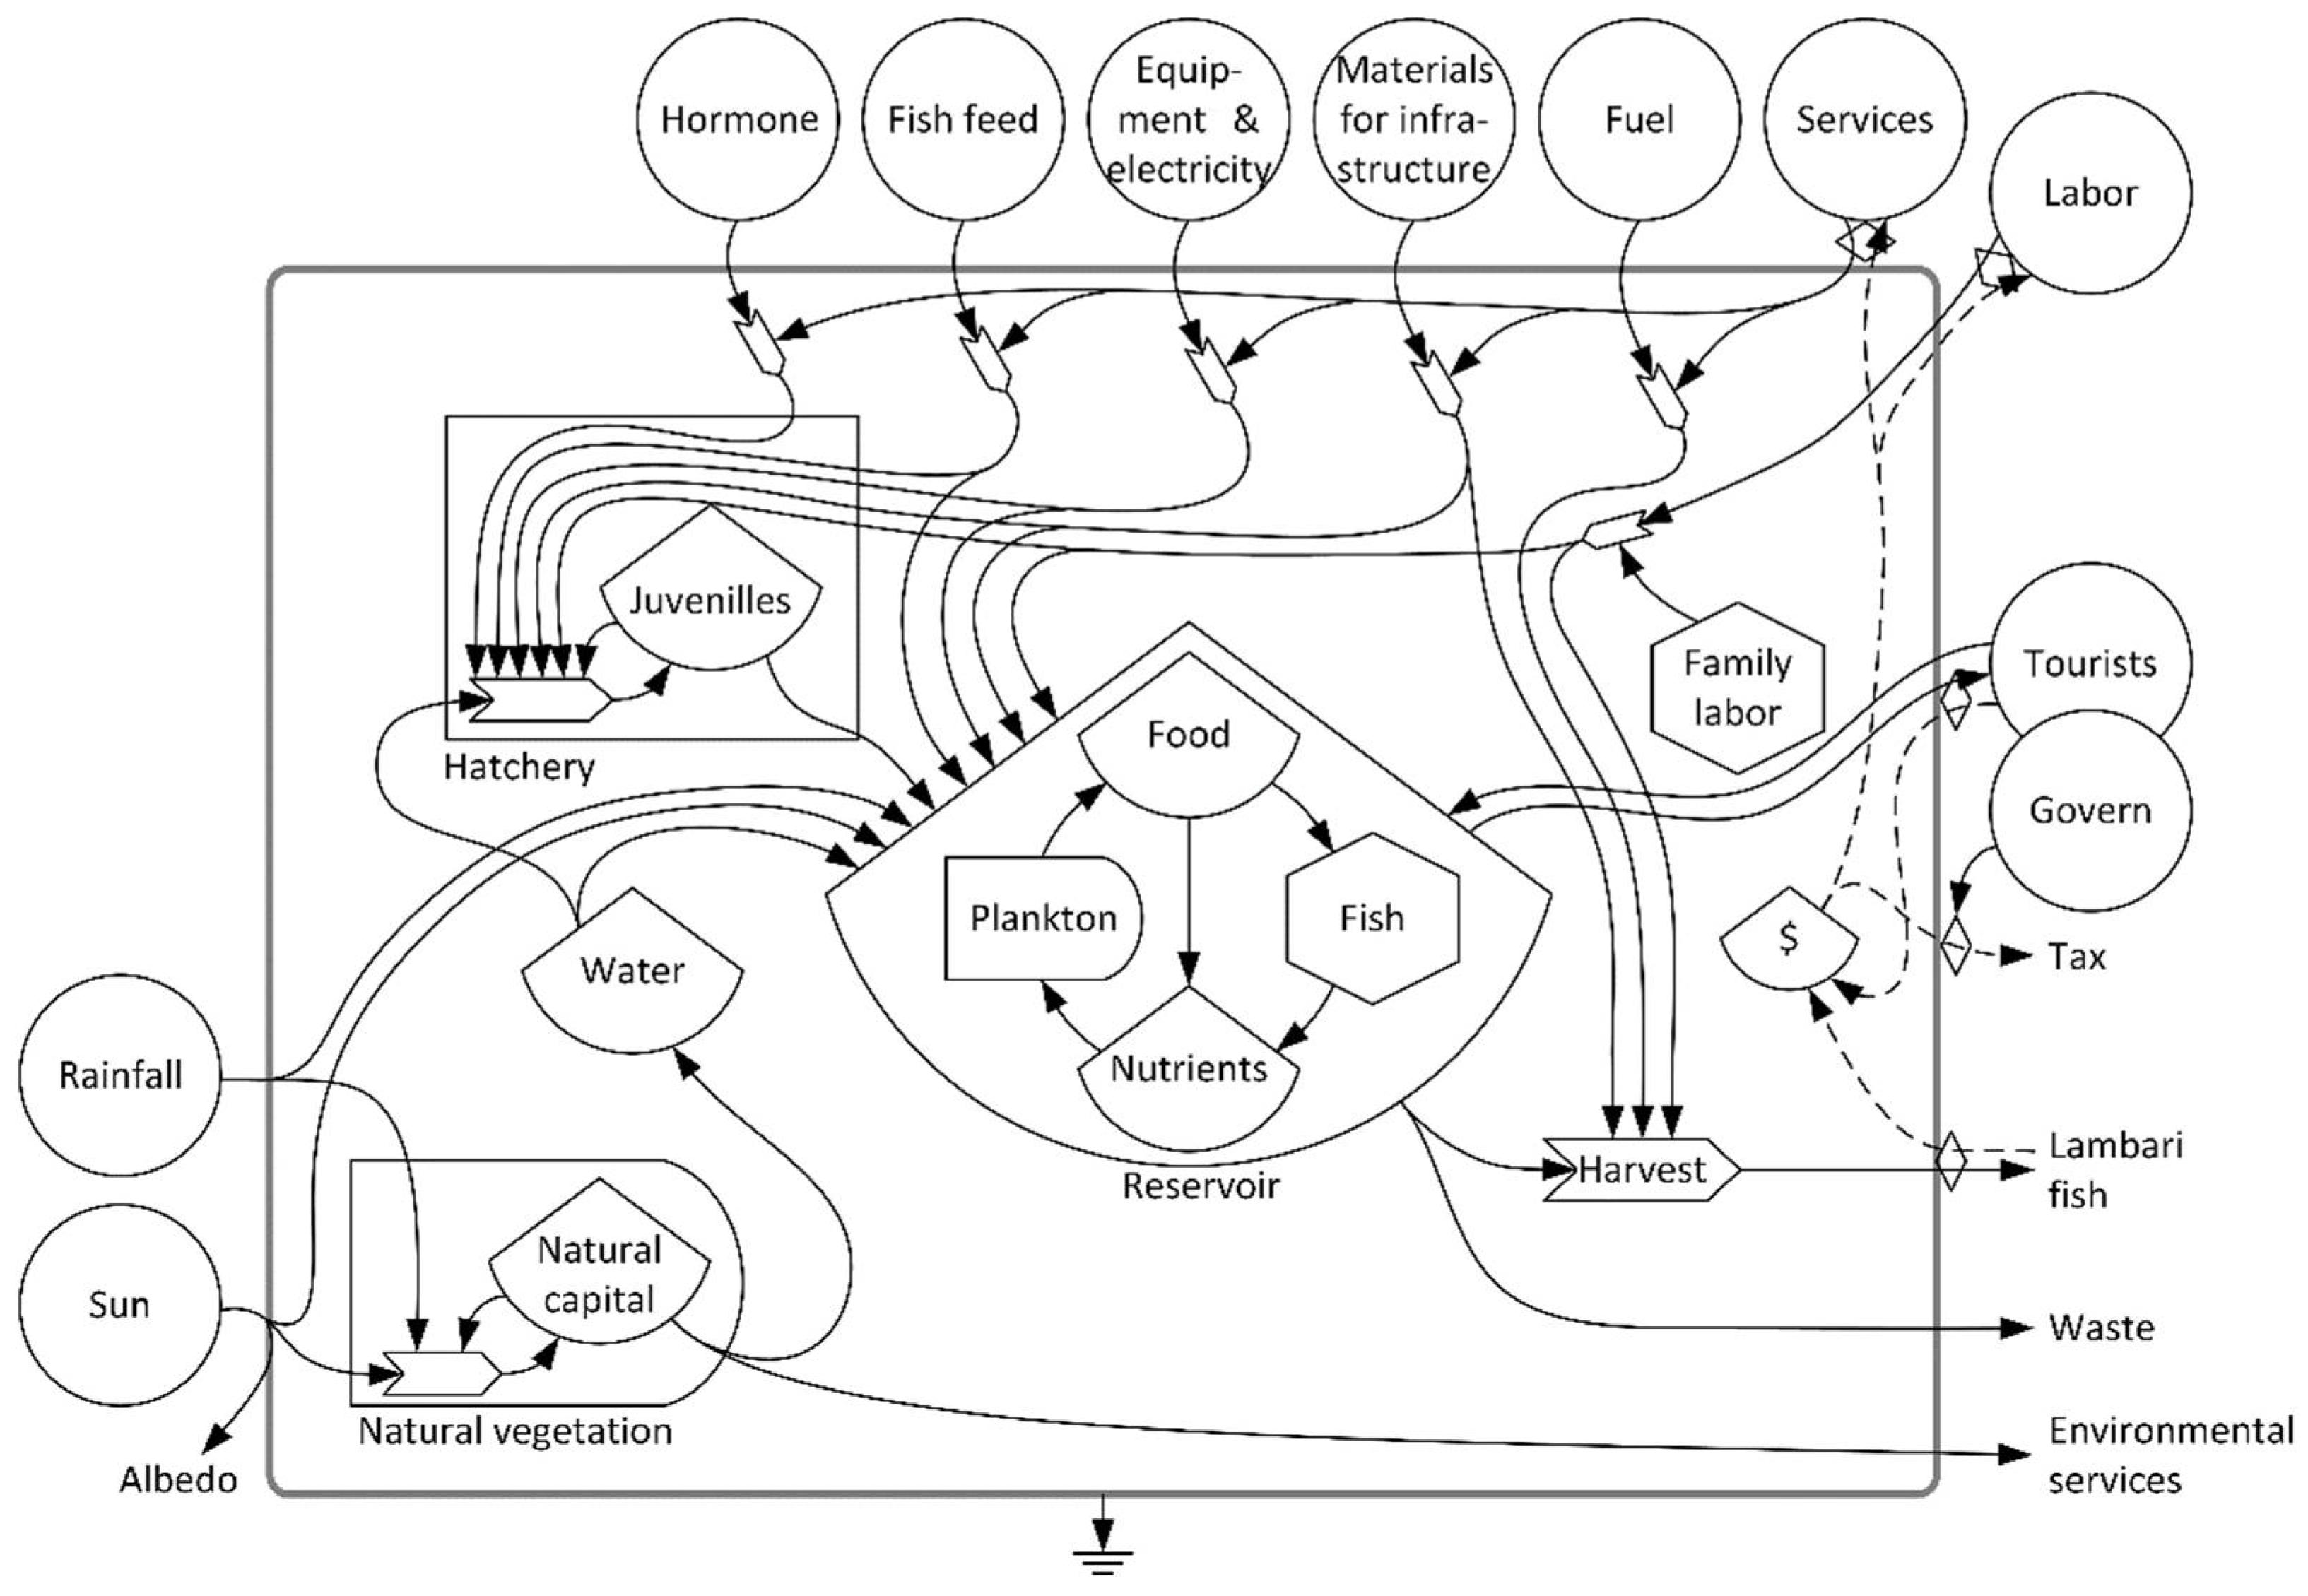
2.2. Emergy Synthesis Procedure

Data obtained from each farm were subjected to an emergy synthesis. Emergy is all the energy directly and indirectly used to generate a product or a service [17]. This method is a biophysical approach based on a donor side perspective in establishing value for natural resources, which recognizes all the effort done by nature in making a resource available. Moreover, as a donor-side approach, emergy synthesis avoids the inherent subjectivities of the receiver-side analysis. The emergy synthesis procedure consists of three main steps: (i) elaborating the energy diagram by defining a system’s boundaries, input and output flows, and their relationship in internal processes (Figure 2); (ii) quantifying the main flows in the emergy accounting table (i.e., inventory), choosing suitable unit emergy values (UEVs), and calculating the emergy flows; (iii) calculating the emergy indicators to support comparisons and discussions. In the present study, the system boundaries were the same as the farm boundaries, which encompass the resources that sustain lambari aquaculture and their interactions within the production system. All input resources were categorized as natural renewable resources (R), natural local non-renewable resources (N), or purchased resources from the economy (F). Input resources were accounted in mass (g), energy (J) or money (US$) units and corresponded to one year of the farm operation, at one-hectare farm basis, allowing for comparisons between farms of different sizes.
After the quantification, the input resource flows were multiplied by their respective unit emergy values (UEVs), resulting in flows of the same unity: solar emjoules (sej). All UEV’s used in this work (see Appendix A. Table A1, Table A2, Table A3 and Table A4) were obtained from the scientific literature and the Emergy Evaluation Folios published by the Center of Environmental Policy from the University of Florida. The UEVs were updated to the global baseline of 1.20 × 1025 sej/yr [20], and do not include labor and services, that were accounted separately, as suggested by Ulgiati and Brown [21]. Labor refers to the direct human work in the system studied, and it is accounted as the monetary amount of the salaries paid (US$) multiplied by the emergy per money ratio (EMR = sej/GDP) for that location where the system is inserted; in our case we use the GDP of Brazil. Services refer to the indirect human work involved in extracting, manufacturing, and transporting the materials and energy used by the system studied. The F resources were accounted for by their respective monetary cost. The emergy of the service was calculated by the monetary value paid (US $) for the supply multiplied by the EMR. Labor and services are accounted for separately in the emergy table because the monetary values are subjective and variable across different locations. The UEV used for labor and services was the EMR (sej/GDP) most recent available value calculated for Brazil (see Appendix A). Additionally, the partial renewability values for each resource input were considered, when available, as proposed by Agostinho et al. [22]. The sum of the emergy flows in solar emjoules (sej) results on the total emergy demanded (Y). Transformity is the UEV measured in sej/J, calculated by dividing the total emergy demanded in sej (input) by the total output measured in joules (output). The emergy indicators calculated in this study are shown in Table 2.
A resource is defined as renewable when its natural replenishment rate is higher than its extraction rate. In this study, the springwater withdrawal rate for LC and MC farms was compared with the natural recharge rate of the regional aquifer, where the farm is located. The natural recharge rate for the regional aquifer is about 25–27% of the yearly rainfall per hectare [23], which is approximately ten times lower than the farms’ withdrawal rate. Therefore, springwater input was assumed as a non-renewable resource demanded by aquaculture, as considered by similar aquaculture assessments [7,24,25,26]. The UEV of fish feed was estimated based on a diet formulated for lambari by Sussel et al. [27] (Appendix B).

2.3. Simulated Changes to Improve Key Practices

Four practices were identified as key factors for decreasing the sustainability performance of the analyzed systems: seed production efficiency, water source, fertilization regime, and the source of protein used in feed formulation. They represented large emergy inputs or resulted in low productivity. Therefore, they were selected to project better scenarios for each lambari farm, wherein their effect on the emergy indicators were assessed. These simulated scenarios include the following improvements in the current practices:
Practice 1. Improved seed productivity in LC and MC farms. This practice considers the introduction of substrates inside the grow-out ponds, which are also used for reproduction in LC and MC farms, to protect newly hatched larvae. This is a low-cost technique that reduces larvae losses [28]. Experiments performed indoors showed a rise in seed productivity from 4 to 100 larvae per 1000 L tanks by using substrates [28]. Since in LC and MC farms larvae hatch in grow-out ponds, this practice could increase seed survival, which may result in higher final productivity. We simulated a 25% increase in final productivity for the LC and MC systems as a likely consequence of adopting this practice. The HC farms perform hormone-induced spawning inside indoor tanks followed by a nursery culture, which allows higher larvae productivity, fish size homogeneity, higher stocking density and survival rate [29]. This efficient and effective practice was maintained in the simulated HC farms. The indoor hatchery infrastructure is expensive and is not affordable for LC and MC farms.
Practice 2. Changing water source in the LC and MC farms. This practice includes the replacement of springwater by superficial water in the LC and MC systems, as currently performed by HC farms. The total water volume used remained the same, and the Unit Emergy Value (UEV) of the water source was replaced in the emergy table, from an UEV of springwater of 5.64 × 10⁴ to an UEV of superficial water of 5.23 × 10⁴ (Appendix A).
Practice 3. Controlling pond fertilization in all farms. Chemical or organic fertilizers are inputs commonly applied in fish farms to increase natural food, but usually under improper techniques that lead to inefficiency and waste generation. The unruly practices currently performed by lambari farmers were replaced by a controlled fertilization protocol. This protocol establishes the use of 900 kg/ha·yr of lime, 560 kg/ha·yr of ruminant manure, 63 kg/ha·yr of urea, and 23 kg/ha·yr of phosphorus, and was suggested as a simple and effective protocol for small farms [30]. The values relevant to the former practice were replaced in the emergy table considering the new resources in their respective material amount (mass), UEV, and services (monetary costs). No increase in fish productivity was considered.
Practice 4. Replace animal protein by vegetable protein sources in the diet. This practice considers the total replacement of animal protein and oil by vegetable sources in commercial feed, using the diet formulated by Sussel et al. [27] for lambari. Currently, commercial feed used in lambari aquaculture relies on high protein contents derived from animal sources. Since lambari is a low-trophic level fish, the use of vegetable protein sources rather than animal ones is a feasible alternative that does not affect productivity [27]. Therefore, we replaced the UEV of feed in the emergy table from an UEV of 7.01 × 10⁹ calculated for a feed formula containing animal protein to an UEV of 5.12 × 10⁹ calculated for a feed formula containing only vegetable sources. The feed formulas were obtained from Sussel et al. [27] and the UEV calculations are in Appendix B.

2.4. Data Analyzes

Data analyses followed three approaches: (i) emergy index-by-index comparison among the assessed nine lambari farms considering the current and the simulated practices; (ii) the use of emergy ternary diagram; (iii) emergy sustainability index and global efficiency graph (ESI-UEV).
The ternary diagram is an equilateral triangle in which the three corners each represent emergy sources (R, N and F). Thus, each system plotted in the diagram is represented by a point, in which R, N and F can be seen by reading from zero along the basal line (axis) at the bottom of the diagram to 100% at the vertex of the triangle [14,15]. The emergy ternary diagram represents the emergy performance of each system, allowing a visual comparison among systems in terms of proportion for R, N, and F emergy flows [31,32]. Lambari real and simulated data of the nine farms were plotted in the ternary diagram. In addition, nine other different aquaculture systems, previously studied by other authors, were compared with the present systems.
Sustainability can be measured as an optimum trade-off between resilience and efficiency [33]. In the ESI-UEV graph, emergy sustainability indicator (ESI) and efficiency (the inverse of UEV) data for each lambari system were plotted on a two-axis graph, in which a larger ESI × 1/UEV area represents higher performance. The ESI accounts for the total environmental pressure of the system over the biosphere capacity (a viewpoint of environmental resilience), and global efficiency (1/UEV) measures how efficient a system is for converting the emergy inflow into a product. Therefore, this graph represents which lambari system has the best balance of both.

3. Results

3.1. Lambari Production under Current Practices

The energy system diagram (Figure 3) shows the lambari production features under the systemic view of emergy synthesis. Most of the energy flows come from outside the farms’ boundaries, such as sun, rain, commercial feed, equipment, materials and labor. All the lambari aquaculture systems evaluated in this study rely on similar external inputs and internal processes, in which the differences are related to the amount and proportions for R, N and F input resources demanded by each farm. Besides, the HC and MC systems rely on external labor, either permanent or temporary, while the LC system relies on local family labor. Energy flows interact within system boundaries with internal stocks of natural capital, hatchery (in the HC farms), and the pond, allowing the production of lambari fish as the main output. Environmental services are co-products and effluents are byproducts produced at different rates among the farms. Overall, farms with lower control and lower productivity demand lower emergy per hectare compared to the farms with higher control (Table 3). The main inputs for the LC systems are services (27–46%), feed (7–39%) and water (15–21%), while the main inputs are feed (35–49% and 17–48% respectively) and services (33–39% and 26–36%, respectively) for the MC and HC farms. Purchased inputs F were more than 60% of the total emergy required in all farms (Table 3).
The emergy indicators showed a similar pattern among the evaluated farms regardless the level of control (Table 4, Table 5 and Table 6). The HC1 farm showed the worst performance for UEV, achieving a value approximately 5 times higher than the farm with the best performance (HC2) (Table 6). The HC2 showed the best overall emergy performance among the studied farms, including the highest renewability (m-%R) and sustainability (ESI) and the lowest environmental loading (ELR) and emergy investment ratios (EIR). As well, EIR was slightly lower in the LC farms (Table 4) compared to MCs and HC1 and HC3. All the lambari farms studied are strongly dependent on F resources, which means a low contribution to the larger economy system (EIR > 1), and showed an emergy sustainability index (ESI) below 1, which is indicative of unsustainable systems.
The ternary diagram (Figure 4A) shows the emergy performance of the nine evaluated lambari farms, compared with nine other aquaculture systems data obtained from literature. All systems are located very close to each other and to the F vertex, indicating a dependence on purchased resources (>63%), which leads to an overall unsustainable performance (ESI < 1).

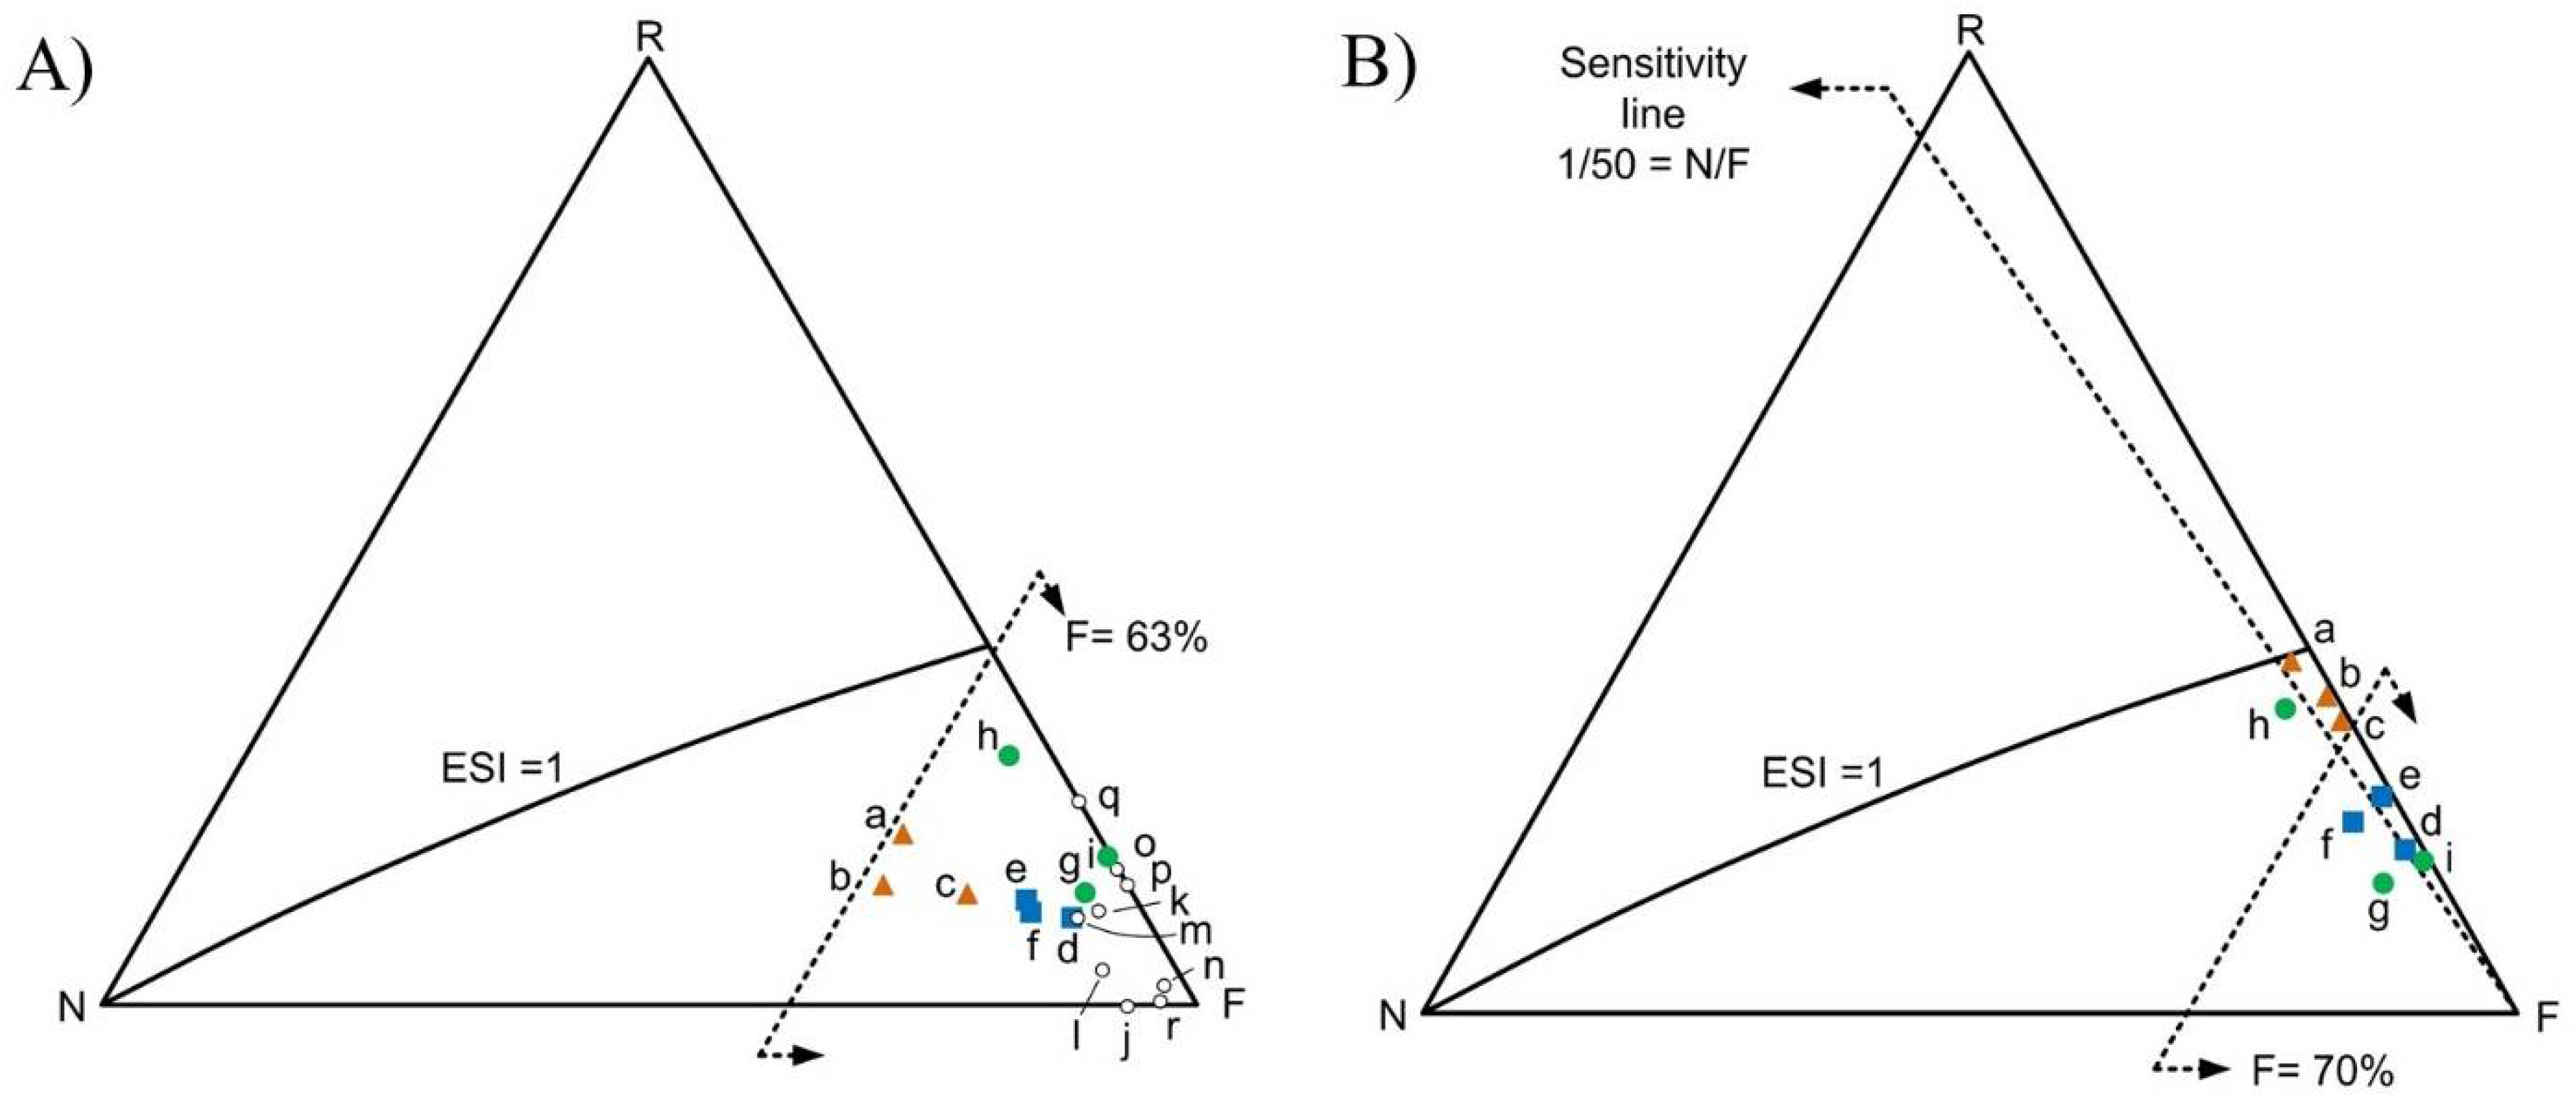
3.2. Simulated the Introduction of Better Practices

The four proposed changes in the management practices improved the systems sustainability (Table 7). Improving seed productivity was the most effective in reducing the UEV for LC and MC farms but did not affect the other indicators. Changing the use of springwater to surface water sources improved all the indicators for LC and MC farms and was the most effective practice in increasing %R and ESI and reducing ELR. Controlling pond fertilization slightly reduced the UEVs for all farms but had no effect on the other indicators. Replacing fish meal protein and fish oil by vegetable protein and oil sources slightly reduced the UEV of all farms, increased %R in HC farms, and had little effect on the other indicators.
The combination of the four improved practices improved the emergy performance for all evaluated lambari farms, including higher renewability and efficiency, while reducing the environmental loading ratio. The LC systems showed the greatest improvements for renewability (between 164% and 255% increase), while reducing the ELRs (between 71% and 80% decrease) and transformities (between 35% and 38% decrease) (Table 4). The MC (Table 5) and HC (Table 6) systems had an increase for renewability (in a range of 81–124% and 6–20% of increase, respectively), and reduced their ELRs (in a range of 50–61% and 7–23% of reduction, respectively) and transformities (in a range of 27–46% of reduction for both systems). Likewise, the ESI of all farms increased. In LC, the ESI increased from 0.2 to 0.7. In MC, the ESI increased from 0.1 to 0.3. In HC, the ESI increased from 0.1 to 0.2 for HC1 and HC3 and from 0.5 to 0.7 for HC2. Although the simulated scenario improved the emergy performance, the ESI values obtained for all farms remain below 1.
Farms LC1′, LC2′, LC3′ and HC2′ moved closer to the ESI = 1 line compared to their relative position before the simulated scenario (Figure 4), as the proportion of renewable resources was increased. Although increasing their renewability ratios (m-%R), the farms MC1′, MC2′, MC3′, HC1′ and HC3′ position remain distant from ESI = 1 and close to F vertex, resulting from the high dependence (>70%) on F resources. The sensitivity line indicated that emergy sustainability for the lambari production systems is improved by going in the direction of R vertex, but the proportion of 1/50 between N and F resources stays approximately the same.
The simulated better scenario resulted in higher performance of the ESIxUEV balance (Figure 5) for all systems. The LC systems achieved the greatest improvement. The system with the higher resilience value, with the larger graphical area for the balance of efficiency and environmental sustainability was the HC2′, followed by LC2′, MC2′, HC2, LC1′, LC3′, MC1′, MC3′, MC2, HC3′, HC3, HC1′, MC1, LC2, LC1, MC3, LC3, HC1 in a hierarchical order.

4. Discussion

The lambari aquaculture systems evaluated in this study were dependent on similar resources. Despite the existing similarities, farms showed different emergy performances for efficiency, renewability, environmental pressure, and nature’s investment within farms of the same level of management control. The HC farms achieved higher productivity. Nevertheless, they are the most dependent on resources from the larger economy (F), making lower use of the local natural resources available. This fact is also demonstrated by the large input of the services. Moreover, even though lower control farms consumed fewer F resources, services represented a large share of their total emergy input. This result indicates that lambari aquaculture is distancing itself from natural systems towards a predominantly human-made system. It also indicates that among all the resources currently needed to produce lambari in small freshwater systems, money is critical.
A large variation exists across the different lambari farms. The HC2 farm had the best performance for all emergy indicators, surpassing HC1 and HC3, although they have the same control level. The HC2 consumed less emergy (sej/ha.yr) from commercial feed than HC1, and more emergy from organic fertilizers than HC1 and HC3 but reached similar productivity to both. Therefore, HC2 represents a system with more effective use of natural food. Conversely, the LC farms had the lowest productivity and consumed higher volumes of springwater per hectare, which is a local non-renewable resource (N), leading to lower emergy performance. These findings indicate that sustainability is not necessarily dependent on the level of control or productivity. Feeding regimes and water sources are critical aspects for the sustainability of lambari production and probably for other inland fish monocultures. None of the farms achieved ESI higher than 1, indicating that all are unsustainable production systems, from the emergy perspective. Even so, lambari aquaculture in its current practices is more sustainable compared to other fish aquaculture systems assessed by the emergy synthesis (Figure 4A). These systems include a high-technology salmon recirculating system, intensive tilapia net-cage culture, integrated multitrophic carp cultures, and other integrated systems. This comparison indicates a high potential of the inland fish monoculture to reach levels of sustainability to match the Sustainable Development Goals of Agenda 2030. An adequate seed production strategy increases the emergy efficiency of the lambari systems. The strategy adopted by the HC farms demands larger emergy inputs from the economy (F), as it requires investments in equipment and infrastructure; moreover, it increases the consumption of electricity and other inputs such as hormones for spawning induction. The high dependence on these F resources decreases systems’ renewability. On the other hand, this strategy enhances system productivity, resulting in a larger lambari output that may compensate for the expenditures needed by reducing the environmental cost per unit (UEV). Comparatively, HC productivity is ~2.5 fold higher than LC and ~0.7 fold higher than MC productivities, considering the currently adopted practices. The simulated scenario of a 25% increase in LC and MC productivity, achieved by introducing substrates for improving larvae survival, enhanced systems efficiency. Substrates can be made from local renewable resources, such as bamboo, which are both environmentally and economically low cost. In this scenario, productivity in LC and MC remains lower than HC. Nevertheless, this practice is an alternative for improving the sustainability of lower controlled systems by increasing their efficiency in the use of natural resources with low cost.
Water management makes LC and MC systems more resilient. Springwater accounts for 15–21% of the emergy input at LC systems and 5–10% in MC systems. This is a high-quality resource that demands ~10% more emergy than surface water [36]. The use of springwater for the grow-out phase of lambari aquaculture is unnecessary, as the aquaculture of lambari can successfully be performed using superficial nutrient-rich water [19]. The replacement of the water source is a simple strategy that reduces the environmental cost of the lower control systems (cf. Table 4, Table 5 and Table 7). The turnover time of the springwater stock is higher compared to the surface sources [36]. This fact implies that overuse makes it a non-renewable resource, which threatens local water security and reduces the resilience of the system. The simulated practice of replacing the water source increased the resilience of LC systems, from an ESI < 0.2 at the current scenario to an ESI ranging from 0.2 to 0.6 in different forms of the simulated scenario. Furthermore, it increased the renewability of LC and MC systems, and reduced the environmental loading ratio by more than 2.5 fold for LC and 1.6 fold for MC (cf. Table 4, Table 5 and Table 7).
All previous papers on the emergy synthesis of aquaculture considered water as a system input [7,24,25,26,34,35,37,38,39,40]. The present study assumed the same approach to compare lambari systems with other aquaculture systems. Nevertheless, although water is essential for aquaculture, it is a resource “temporarily appropriated” rather than “consumed”. This suggests a different interpretation of how to account for water in aquaculture systems. From the total water used, less than 1% is fixed in the fish body, ~10% is lost by evaporation and seepage, and the remainder becomes waste [41]. The amount of water embodied by the fish and evaporated or infiltrated should be accounted by its volume (m3), and considered as R or N, depending on its source. The water that flows through the system and turns into waste should be accounted for by the total emergy needed to recover its original quality, i.e., the emergy of a water treatment system, adequate to the volume and quality of the farm effluent. By this approach, it would be possible to value nature`s investment on recovering a resource that it is damaged by the production system, even though has not been actually depleted. This could model the real environmental cost of water in aquaculture and guide decision-makers on more realistic choices.
A controlled fertilization protocol reduced the environmental cost of fertilizers. The practices currently adopted by lambari producers focus on the use of poultry manure and lime, which comprises a share of 11–20% for LC, 6–9% for MC, and 3–17% for HC, of the total emergy needed. The simulated scenario of a controlled fertilization protocol reduced the emergy of fertilization by ~4 fold, turning it into a share of less than 6% of the total emergy for all farms studied. Organic fertilizers are co-products from the animal production industry, considered partially renewable as they are purchased from other production systems (F). The emergy theory sets that co-products of a process have the total emergy assigned to each pathway [42]. In other words, the UEV of poultry manure is the same of the whole poultry production system, since it derives from the same pathways. On the other hand, the use of manure as fertilizers is an open-loop recycling process, in which only the emergy assigned to the post-production processes, such as treatment and delivery, should be accounted for in the emergy table [43]. Moreover, if producers could use on-site available manure, as in an integrated production system, it would characterize a closed-loop recycling process in which the environmental cost of manure would be zero [43]. These adaptations in the emergy algebra remain under debate within the research community. Nevertheless, the results indicate that although manure is a waste recycled by pond systems, its environmental cost should not be neglected. Therefore, locally available sources should be prioritized, and a controlled fertilization protocol is necessary for reducing costs of natural food production.
Commercial feed is the highest emergy input in lambari farms, as in other fish production systems [7,25,35,44]. This supply also represents a large share of the emergy on the services input because of its high monetary cost. The replacement of fish meal and oil by vegetal protein sources is highlighted as a more sustainable alternative for the culture of omnivorous species like lambari, with no decrease in productivity [27]. According to the simulated scenario, this practice reduced the emergy of feed by 27% and increased its renewability from 5% to 8%. This practice increased the sustainability more evidently at the HC farms, as they are higher dependent on commercial feed compared to LC farms. Even though vegetable protein sources are often environmentally cheaper than animal sources, there are aspects of the commercial feed industry that raise controversies from the emergy perspective. The high industrialization level of the production systems of the crops used in feed composition, including the use of agrochemicals, machinery and long distance transportation, turns them into low or no-renewable sources that demand high emergy to be produced. For example, the UEV of rice bran, soybean and cottonseed meal can be higher than the UEV of fish meal derived from the marine fishery (Appendix B). Furthermore, the use of co-products (or wastes) from the animal production industry, such as bones and viscera, should be adequately accounted for as described in the case of organic fertilizers. Therefore, from a donor-side perspective, besides prioritizing vegetal protein sources, the use of locally available resources and the recycling of wastes would further increase the sustainability of commercial feed and consequently improve the sustainability of aquaculture systems.
The need for more sustainable production systems is a well-established concern globally. The best method for quantifying such a complex concept in aquaculture has been discussed by many research groups [6,45,46]. The challenge is how to fit the societies’ aim of constantly increasing productive systems’ efficiency within the physical limits of our planet. The idea of sustainability as a contingent balance of these antagonistic and complementary terms, rather than a linear advance towards a static state of sustainability, seems more effective [33]. The combination of the emergy sustainability index (ESI) and the inverse unit emergy value (1/UEV) provides an image of the self-organization processes of the lambari systems towards sustainability. The systems that are highly productive are unable to respond to environmental changes and, thus, are low in terms of resilience. Conversely, extensive systems do not take full advantage of the available free energy, and fail in competition with more developed systems. HC2 is the most successful farm in balancing resilience and efficiency (Figure 5). Nevertheless, the simulated improved practices, as proposed in the present study, improved the performance of HC2 and all other studied farms. This fact demonstrates how systems’ evolutionary process is continuous taking account of the environmental features, indicating that sustainability is context-dependent and requires constant adaptation. Thus, aquaculture technologies designed in an ecosystem-based approach are likely to succeed in long-term adaptation processes, building more sustainable aquaculture systems to meet the sustainable development goals proposed in Agenda 2030.

5. Conclusions

Current lambari farming, and probably other monocultures of freshwater fish pond farming, rely primarily on non-renewable resources, mainly on commercial feed and services, regardless of the technology level (low, moderate, or high control) used. The emergy performance of all farms was similar, with a slight advantage for the high control systems. The low renewability (m-%R < 15%), high environmental load (ELR > 5.6), and low emergy yield ratio (EYR < 1.3) indicate that the lambari culture is unsustainable (generally ESI < 0.2). Nevertheless, sustainability can be increased by simple changes in the current practices: the increase of productivity by improving larval management, the use of superficial water rather than springwater, the control of pond fertilization, and the replacement of animal protein sources by vegetal ones in the diet. The emergy sustainability and renewability of the proposed optimized scenario may then increase, and the environmental loading ratio decrease, which confirms our hypotheses that low efficiency and high consumption of non-renewable resources are the main bottlenecks for the sustainability of small-scale inland fish monoculture. Nevertheless, the demand for purchased resources is still high (EYR < 1.4) in the proposed scenario. Therefore, efforts to increase efficiency and reduce resources purchased from the economy can also increase sustainability.

Author Contributions

Conceptualization, T.F. and W.C.V.; methodology, F.A. and B.F.G.; validation, F.H.G.; formal analysis, T.F. and F.A.; investigation, T.F., W.C.V. and F.A.; resources, F.H.G., T.F., F.A., W.C.V.; data curation, T.F., W.C.V. and F.A.; writing—original draft preparation, T.F.; writing—review and editing, W.C.V. and T.F.; supervision, F.A.; project administration, B.F.G. and W.C.V.; funding acquisition, F.H.G., T.F., F.A. and W.C.V. All authors have read and agreed to the published version of the manuscript.

Funding

This research was funded by Conselho Nacional de Pesquisa–CNPq Brazil [140486/2014-3; 306361/2014-0; 140365/2017-6; 452378/2019-2; 302592/2019-9], and by Coordenação de Aperfeiçoamento de Pessoal de Nível Superior–CAPES Brazil [Finance Code 001].

Informed Consent Statement

Informed consent was obtained from all subjects involved in the study.

Acknowledgments

The authors are grateful to the farmers, who assist us during on-farm data collecting and joint us in the present research. The authors are also grateful to the editors and reviewers for the careful analyses of our MS and the important suggestions to improve it.

Conflicts of Interest

The authors declare no conflict of interest.

Appendix A

Table A1. Inventory and unit emergy values (UEV) for the nine evaluated lambari production systems 1.
Item and Its ClassificationUnitUEV 2
(sej/Unit)
References for UEV%RAmount in Unit/ha/yr
LC1LC2LC3MC1MC2MC3HC1HC2HC3
  • Sun (R)
J1.00 × 100Odum [17]1004.67 × 10134.67 × 10134.67 × 10134.67 × 10134.67 × 10134.67 × 10134.67 × 10134.67 × 10134.67 × 1013
2.
Rainfall (R)
J2.31 × 104Odum [17]1009.16 × 10109.16 × 10109.16 × 10109.16 × 10109.16 × 10109.16 × 10109.16 × 10109.16 × 10109.16 × 1010
3.
Superficial water (R)
J5.23 × 104Comar [47]1000.00 × 1000.00 × 1000.00 × 1000.00 × 1000.00 × 1000.00 × 1000.00 × 1000.00 × 1000.00 × 100
4.
Soil occupation (N)
J9.42 × 104Brandt-Williams [48]01.30 × 10108.50 × 1098.50 × 1098.50 × 1091.52 × 10101.52 × 10101.52 × 10101.52 × 10101.52 × 1010
5.
Springwater (N)
J5.63 × 104Buenfil [36]02.51 × 10114.34 × 10114.34 × 10114.34 × 10112.63 × 10112.63 × 10112.63 × 10112.63 × 10112.63 × 1011
6.
Feed (F)
g7.01 × 109Appendix B56.80 × 1057.06 × 1067.06 × 1067.06 × 1067.74 × 1067.74 × 1067.74 × 1067.74 × 1067.74 × 106
7.
Equipment (F)
7.1 Irong7.63 × 1010Buranakarn [49]03.40 × 10005.88 × 1003.33 × 1002.00 × 1011.61 × 1004.96 × 1018.33 × 1003.75 × 10−12.00 × 101
7.2 Plasticg3.90 × 109Buranakarn [49]03.82 × 1001.36 × 1016.69 × 1002.21 × 1014.69 × 1005.39 × 1011.73 × 1011.25 × 1001.93 × 101
7.3 Steelg5.92 × 109Brown and Ulgiati [50]01.79 × 1024.95 × 1023.02 × 1021.08 × 1015.81 × 10−12.67 × 1011.08 × 1011.33 × 1001.08 × 101
7.4 Aluminumg1.62 × 1010Buranakarn [49]06.80 × 10−31.00 × 10−26.67 × 10−33.30 × 10−11.61 × 10−38.18 × 10−13.30 × 10−13.95 × 10−33.30 × 10⁻¹
7.5 Glass fiberg1.00 × 1010Buranakarn [49]00.00 × 1000.00 × 1000.00 × 1007.00 × 10−10.00 × 1001.74 × 1012.33 × 1003.85 × 10−27.00 × 100
8.
Electricity (F)
J1.11 × 105Giannetti et al. [51]688.82 × 1076.50 × 1091.72 × 1081.08 × 10101.24 × 1094.67 × 1092.41 × 1091.62 × 1085.28 × 1010
9.
Infrastructure (F)
9.1 Copperg7.43 × 1010Cohen et al. [52]03.13 × 10−15.41 × 10−13.07 × 10−10.00 × 1001.47 × 10−12.72 × 10−11.01 × 1007.77 × 10−21.06 × 100
9.2 Bricksg2.79 × 109Buranakarn [49]01.31 × 1031.87 × 1031.46 × 1032.18 × 1038.41 × 1023.05 × 1033.05 × 1035.37 × 1023.10 × 103
10.
Lime (F)
g1.24 × 109Odum [17]03.75 × 1063.75 × 1063.75 × 1063.75 × 1063.75 × 1063.75 × 1063.75 × 1063.75 × 1063.75 × 106
11.
Organic fertilizer (F)
g3.07 × 109Castellini et al. [53]163.00 × 1063.00 × 1063.00 × 1063.00 × 1063.00 × 1063.00 × 1063.00 × 1063.00 × 1063.00 × 106
12.
Fuel (diesel) (F)
J1.37 × 105Brown et al. [54]03.63 × 1096.28 × 1096.28 × 1096.28 × 1091.72 × 10101.72 × 10101.72 × 10101.72 × 10101.72 × 1010
13.
Labor (F)
$3.23 × 10¹²Giannetti et al. [55]150.00 × 1001.48 × 1021.48 × 1021.48 × 1021.62 × 1031.62 × 1031.62 × 1031.62 × 1031.62 × 103
14.
Services (F)
$3.23 × 10¹²Giannetti et al. [55]153.40 × 1031.24 × 1031.24 × 1031.24 × 1039.79 × 1039.79 × 1039.79 × 1039.79 × 1039.79 × 103
1 Legend: Low control (LC), moderate control (MC) and high control (HC) management levels. Numbers (1, 2 and 3) represent different farms within the same control level. R, renewable resources from nature; N, non-renewable resources from nature; F, resources from the larger economy; %R, renewability fraction in %. 2 UEVs updated to the 1.20E25 sej/yr emergy baseline without accounting for labor and services.

Appendix B

Table A2. Unit emergy value (UEV) estimation for lambari commercial feed 1.
ItemUnitUEV 2
sej/Unit
Amount
(Unit)
%RRenewable
Emergy Flow
(sej)
Non-Renewable
Emergy Flow
(sej)
Total Emergy
(sej)
References for UEV
Rice brang9.70 × 1080.0900.00 × 1008.73 × 1078.73 × 107Brown and McClanahan [56]
Corn brang1.45 × 10100.2600.00 × 1003.77 × 1093.77 × 109Brandt-Williams [48]
Soybean mealg3.35 × 1090.2301.99 × 1084.71 × 1086.70 × 108Takahashi and Ortega [57]
Cottonseed mealg4.01 × 1090.09176.12 × 1073.00 × 1083.61 × 108Takahashi and Ortega [57]
Wheat brang1.09 × 1090.2224.88 × 1071.69 × 1082.18 × 108Dong et al. [58]
Poultry viscera mealg4.05 × 1090.0325162.11 × 1071.11 × 1081.32 × 108Castellini et al. [53]
Meat and bone mealg4.64 × 10100.02700.00 × 1001.25 × 1091.25 × 109Brandt-Williams [48]
Fishmealg3.13 × 1090.017550 32.73 × 1072.73 × 1075.47 × 107Brandt-Williams [59]
Blood mealg4.64 × 10100.0100.00 × 1004.64 × 1084.64 × 108Brandt-Williams [48]
Total 3.57 × 1086.65 × 1097.01 × 109
1 The amount of ingredients relates to 1 g of commercial feed and based on Sussel et al. [27]. %R = renewability fraction in %. 2 UEVs updated to the 1.20 × 1025 sej/yr emergy baseline without accounting for labor and services. 3 The Brazilian sardinella (Sardinella brasiliensis) is one of the sardine species used as a protein source ingredient in animal feed composition. FAO suggests that excessive fishing pressure could exacerbate biomass declines and delay or compromise potential natural recoveries (available at: http://firms.fao.org/firms/resource/13329/en; accessed on 28 April 2019). Therefore, we assumed a 50% renewability for the fishmeal flow due to its current overexploitation.
Table A3. Unit emergy value (UEV) estimation for lambari commercial feed considering the replacement of animal protein sources by vegetal sources 1.
ItemUnitUEV 2
sej/Unit
Amount
(Unit)
%RRenewable
Emergy Flow
(sej)
Non-Renewable
Emergy Flow
(sej)
Total Emergy
(sej)
References for UEV
Rice brang9.70 × 1080.0800.00 × 1007.76 × 1077.76 × 107Brown and McClanahan [56]
Corn brang1.45 × 10100.2400.00 × 1003.46 × 1093.46 × 109Brandt-Williams [48]
Soybean mealg3.35 × 1090.26302.61 × 1086.20 × 1088.81 × 108Takahashi and Ortega [57]
Cottonseed mealg4.01 × 1090.12178.16 × 1074.00 × 1084.81 × 108Takahashi and Ortega [27]
Wheat brang1.09 × 1090.20224.88 × 1071.69 × 1082.18 × 108Dong et al. [58]
Total 3.92 × 1084.73 × 1095.12 × 109
1 The amount of ingredients relates to 1 g of commercial feed and is based on Sussel et al. [27]. %R = renewability fraction in %. 2 UEVs updated to the 1.20 × 1025 sej/yr emergy baseline without accounting for labor and services.

Appendix C

Table A4. Emergy accounting of the services of lambari aquaculture farms 1.
LC1LC2LC3MC1MC2MC3HC1HC2HC3
Item$/ha·yrEmergy$/ha·yrEmergy$/ha·yrEmergy$/ha·yrEmergy$/ha·yrEmergy$/ha·yrEmergy$/ha·yrEmergy$/ha·yrEmergy$/ha·yrEmergy
Feed (F)4.30 × 1021.39 × 10153.34 × 1031.08 × 10161.32 × 1034.26 × 10156.63 × 1032.14 × 10163.54 × 1031.14 × 10163.59 × 1031.16 × 10161.91 × 1046.16 × 10161.86 × 1035.99 × 10153.51 × 1031.13 × 1016
Equipment (F)2.23 × 1027.20 × 10149.08 × 1022.93 × 10152.30 × 1027.43 × 10141.18 × 1033.82 × 10154.56 × 1021.47 × 10152.97 × 1039.60 × 10151.09 × 1033.53 × 10157.36 × 1022.38 × 10151.64 × 1035.28 × 1015
Electricity (Hydropower) (F)2.10 × 1016.79 × 10131.68 × 1025.43 × 10144.21 × 1011.36 × 10146.66 × 1022.15 × 10152.10 × 1026.79 × 10141.01 × 1033.26 × 10151.84 × 1025.94 × 10141.01 × 1033.27 × 10151.72 × 1035.55 × 1015
Infrastructure (F)5.97 × 1021.93 × 10151.14 × 1033.69 × 10156.49 × 1022.10 × 10151.02 × 1033.29 × 10153.20 × 1021.03 × 10155.45 × 1021.76 × 10151.45 × 1034.68 × 10152.67 × 1028.63 × 10141.55 × 1035.01 × 1015
Fertilizers (F)1.11 × 1023.57 × 10141.11 × 1023.57 × 10141.11 × 1023.57 × 10141.11 × 1023.57 × 10141.11 × 1023.57 × 10141.11 × 1023.57 × 10141.11 × 1023.57 × 10141.11 × 1023.57 × 10141.11 × 1023.57 × 1014
Fuel (Diesel) (F)3.17 × 1031.03 × 10163.36 × 1021.09 × 10153.17 × 1031.03 × 10168.40 × 1032.71 × 10169.33 × 1033.01 × 10163.76 × 1031.22 × 10161.94 × 1046.28 × 10163.21 × 1021.04 × 10158.40 × 1032.71 × 1016
Hormones (F) 20.00 × 1000.00 × 1000.00 × 1000.00 × 1000.00 × 1000.00 × 10001.42 × 1024.59 × 10141.42 × 1024.59 × 10141.42 × 1024.59 × 10141.42 × 1024.59 × 10141.42 × 1024.59 × 10141.42 × 1024.59 × 1014
Depreciation (F)3.58 × 1031.16 × 10162.12 × 1036.84 × 10151.12 × 1033.63 × 10152.39 × 1037.71 × 10151.76 × 1035.69 × 10157.41 × 1022.39 × 10152.79 × 1039.02 × 10152.77 × 1028.96 × 10143.29 × 1031.06 × 1016
Taxes (F)1.64 × 1035.30 × 10152.40 × 1037.75 × 10158.80 × 1022.84 × 10155.51 × 1031.78 × 10163.00 × 1039.69 × 10153.12 × 1031.01 × 10167.20 × 1032.33 × 10161.92 × 1036.20 × 10154.82 × 1031.56 × 1016
1 Legend: Low control (LC), moderate control (MC), and high control (HC) management levels. Numbers (1, 2 and 3) represent different farms within the same control level. F represents resources from the larger economy. All flows were accounted in US$ per hectare at one year of the farm operation. The UEV for services is 3.23 × 10¹² which is the emergy per money ratio (EMR = US$/GDP) for Brazil (Giannetti et al. [55]). The renewability fraction (%R) for services is 15%. 2 Pituitary extract from carp for hormone-induced spawning practice used in MC and HC systems.

References

  1. Soto, D.; Aguilar-Manjarrez, J.; Hishamunda, N. Building an ecosystem approach to aquaculture. In Proceedings of the FAO Fisheries and Aquaculture Proceedings, Palma de Mallorca, Spain, 7–11 May 2007; Soto, D., Aguilar-Manjarrez, J., Hishamunda, N., Eds.; FAO: Rome, Italy, 2008; 221p. [Google Scholar]
  2. Boyd, C.E.; D’Abramo, L.R.; Glencross, B.D.; Huyben, D.C.; Juarez, L.M.; Lockwood, G.S.; McNevin, A.A.; Tacon, A.G.J.; Teletchea, F.; Tomasso, J.R.; et al. Achieving sustainable aquaculture: Historical and current perspectives and future needs and challenges. J. World Aquac. Soc. 2020, 51, 578–633. [Google Scholar] [CrossRef]
  3. FAO. The State of World Fisheries and Aquaculture; Sustainability in Action; FAO: Rome, Italy, 2020; Volume 35. [Google Scholar]
  4. Henares, M.N.P.; Medeiros, M.V.; Camargo, A.F.M. Overview of strategies that contribute to the environmental sustainability of pond aquaculture: Rearing systems, residue treatment, and environmental assessment tools. Rev. Aquac. 2019, 12, 1–18. [Google Scholar] [CrossRef]
  5. Mungkung, R.; Aubin, J.; Prihadi, T.H.; Slembrouck, J.; van der Werf, H.M.G.; Legendre, M. Life cycle assessment for environmentally sustainable aquaculture management: A case study of combined aquaculture systems for carp and tilapia. J. Clean. Prod. 2013, 57, 249–256. [Google Scholar] [CrossRef]
  6. Valenti, W.C.; Kimpara, J.M.; de Lima Preto, B.; Moraes-Valenti, P. Indicators of sustainability to assess aquaculture systems. Ecol. Indic. 2018, 88, 402–413. [Google Scholar] [CrossRef] [Green Version]
  7. Wilfart, A.; Prudhomme, J.; Blancheton, J.P.; Aubin, J. LCA and emergy accounting of aquaculture systems: Towards ecological intensification. J. Environ. Manag. 2013, 121, 96–109. [Google Scholar] [CrossRef]
  8. Brugère, C.; Aguilar-Manjarrez, J.; Beveridge, M.C.M.; Soto, D. The ecosystem approach to aquaculture 10 years on—A critical review and consideration of its future role in blue growth. Rev. Aquac. 2019, 11, 493–514. [Google Scholar] [CrossRef] [Green Version]
  9. Naylor, R.L.; Hardy, R.W.; Buschmann, A.H.; Bush, S.R.; Cao, L.; Klinger, D.H.; Little, D.C.; Lubchenco, J.; Shumway, S.E.; Troell, M. A 20-year retrospective review of global aquaculture. Nature 2021, 591, 551–563. [Google Scholar] [CrossRef]
  10. United Nations. Transforming our World: The 2030 Agenda for Sustainable Development; United Nations, Department of Economic and Social Affairs: Ney York, NY, USA, 2015; p. 41. [Google Scholar]
  11. Valenti, W.C.; Barros, H.P.; Moraes-Valenti, P.; Bueno, G.W.; Cavalli, R.O. Aquaculture in Brazil: Past, present and future. Aquac. Rep. 2021, 19, 100611. [Google Scholar] [CrossRef]
  12. IBGE—Instituto Brasileiro de Geogragia e Estatística. Censo Agropecuário. 2022. Available online: https://sidra.ibge.gov.br/tabela/6938#resultado (accessed on 3 February 2022).
  13. Fonseca, T.; Costa-Pierce, B.A.; Valenti, W.C. Lambari aquaculture as a means for the sustainable development of rural communities in Brazil. Rev. Fish. Sci. Aquac. 2017, 25, 316–330. [Google Scholar] [CrossRef]
  14. Agostinho, F.; Oliveira, M.W.; Pulselli, F.M.; Almeida, C.M.V.B.; Giannetti, B.F. Emergy accounting as a support for a strategic planning towards a regional sustainable milk production. Agric. Syst. 2019, 176, 102647. [Google Scholar] [CrossRef]
  15. Bonilla, S.H.; Guarnetti, R.L.; Almeida, C.M.V.B.; Giannetti, B.F. Sustainability assessment of a giant bamboo plantation in Brazil: Exploring the influence of labour, time and space. J. Clean. Prod. 2010, 18, 83–91. [Google Scholar] [CrossRef]
  16. Giannetti, B.F.; Ogura, Y.; Bonilla, S.H.; Almeida, C.M.V.B. Accounting emergy flows to determine the best production model of a coffee plantation. Energy Policy 2011, 39, 7399–7407. [Google Scholar] [CrossRef]
  17. Odum, H.T. (Ed.) Environmental Accounting: Emergy and Environmental Decision Making, 1st ed.; John Wiley & Sons: New York, NY, USA, 1996; ISBN 0471114421. [Google Scholar]
  18. Bryman, A. Social Research Methods, 4th ed.; Oxford University Press: Oxford, UK, 2012. [Google Scholar]
  19. Marques, A.M.; Boaratti, A.Z.; Belmudes, D.; Ferreira, J.R.C.; Mantoan, P.V.L.; Moraes-Valenti, P.; Valenti, W.C. Improving the efficiency of lambari production and diet assimilation using integrated aquaculture with benthic species. Sustainability 2021, 13, 10196. [Google Scholar] [CrossRef]
  20. Brown, M.T.; Ulgiati, S. Assessing the global environmental sources driving the geobiosphere: A revised emergy baseline. Ecol. Model. 2016, 339, 126–132. [Google Scholar] [CrossRef] [Green Version]
  21. Ulgiati, S.; Brown, M.T. Labor and services as information carriers in emergy—LCA accounting. J. Environ. Account. Manag. 2014, 2, 163–170. [Google Scholar] [CrossRef]
  22. Agostinho, F.; Sevegnani, F.; Almeida, C.M.V.B.; Giannetti, B.F. Exploring the potentialities of emergy accounting in studying the limits to growth of urban systems. Ecol. Indic. 2018, 94, 4–12. [Google Scholar] [CrossRef]
  23. CPRM. Sistema Aquífero Bauru-Caiuá Nos Estados de São Paulo, Mato Grosso do Sul E Paraná; 2012; Vol. 14. Available online: http://rimasweb.cprm.gov.br/layout/pdf/PDF_RIMAS/VOLUME14_Sistema_Aquifero_Bauru_Caiua_SP_PR_MS.pdf (accessed on 10 April 2019).
  24. Cavalett, O.; De Queiroz, J.F.; Ortega, E. Emergy assessment of integrated production systems of grains, pig and fish in small farms in the South Brazil. Ecol. Model. 2006, 193, 205–224. [Google Scholar] [CrossRef] [Green Version]
  25. Zhang, L.X.; Song, B.; Chen, B. Emergy-based analysis of four farming systems: Insight into agricultural diversification in rural China. J. Clean. Prod. 2012, 28, 33–44. [Google Scholar] [CrossRef]
  26. Zhang, L.X.; Ulgiati, S.; Yang, Z.F.; Chen, B. Emergy evaluation and economic analysis of three wetland fish farming systems in Nansi Lake area, China. J. Environ. Manag. 2011, 92, 683–694. [Google Scholar] [CrossRef]
  27. Sussel, F.R.; Viegas, E.M.M.; Evangelista, M.M.; Gonçalves, G.S.; Salles, F.A.; Gonçalves, L.U. Substituição de proteína animal por proteína vegetal em dietas para lambari-do-rabo-amarelo astyanax altiparanae. Acta Sci.-Anim. Sci. 2014, 36, 343–348. [Google Scholar] [CrossRef] [Green Version]
  28. Rezende, F.P.; Filho, O.P.R.; Pereira, M.M.; Takabatake, É.Y.; Navarro, R.D.; Santos, L.C.; Silva, R.F.; Filho, C.B.C. Eficiência de diferentes substratos na desova de lambari tambiú (astyanax bimaculatus LINNAEUS, 1758). Rev. Ceres 2005, 52, 527–533. [Google Scholar]
  29. Felizardo, V.O.; Murgas, L.D.S.; Andrade, E.S.; López, P.A.; Freitas, R.T.F.; Ferreira, M.R. Effect of timing of hormonal induction on reproductive activity in lambari (Astyanax bimaculatus). Theriogenology 2012, 77, 1570–1574. [Google Scholar] [CrossRef] [PubMed] [Green Version]
  30. Pucher, J.; Mayrhofer, R.; El-Matbouli, M.; Focken, U. Pond management strategies for small-scale aquaculture in northern Vietnam: Fish production and economic performance. Aquac. Int. 2014, 23, 297–314. [Google Scholar] [CrossRef]
  31. Giannetti, B.F.; Barrella, F.A.; Almeida, C.M.V.B. A combined tool for environmental scientists and decision makers: Ternary diagrams and emergy accounting. J. Clean. Prod. 2006, 14, 201–210. [Google Scholar] [CrossRef]
  32. Almeida, C.M.V.B.; Barrella, F.A.; Giannetti, B.F. Emergetic ternary diagrams: Five examples for application in environmental accounting for decision-making. J. Clean. Prod. 2007, 15, 63–74. [Google Scholar] [CrossRef]
  33. Byrne, E. Transdisciplinary Perspectives on Transitions to Sustainability, 1st ed.; Byrne, E., Mullally, G., Sage, C., Eds.; Routledge: Farnham, UK; Ashgate: Burlington, VT, USA, 2016; ISBN 9781315550206. [Google Scholar]
  34. Cheng, H.; Chen, C.; Wu, S.; Mirza, Z.A.; Liu, Z. Emergy evaluation of cropping, poultry rearing, and fish raising systems in the drawdown zone of three gorges reservoir of China. J. Clean. Prod. 2017, 144, 559–571. [Google Scholar] [CrossRef]
  35. David, L.H.C.; Pinho, S.M.; Garcia, F. Improving the sustainability of tilapia cage farming in Brazil: An emergy approach. J. Clean. Prod. 2018, 201, 1012–1018. [Google Scholar] [CrossRef] [Green Version]
  36. Buenfil, A.A. Emergy Evaluation of Water; University of Florida: Gainesville, FL, USA, 2001. [Google Scholar]
  37. Shi, H.; Zheng, W.; Zhang, X.; Zhu, M.; Ding, D. Ecological-economic assessment of monoculture and integrated multi-trophic aquaculture in Sanggou Bay of China. Aquaculture 2013, 410–411, 172–178. [Google Scholar] [CrossRef]
  38. Gonçalves Lima, J.S.; Rivera, E.C.; Focken, U. Emergy evaluation of organic and conventional marine shrimp farms in Guaraíra Lagoon, Brazil. J. Clean. Prod. 2012, 35, 194–202. [Google Scholar] [CrossRef]
  39. Vassallo, P.; Bastianoni, S.; Beiso, I.; Ridolfi, R.; Fabiano, M. Emergy analysis for the environmental sustainability of an inshore fish farming system. Ecol. Indic. 2007, 7, 290–298. [Google Scholar] [CrossRef]
  40. Zhao, S.; Song, K.; Gui, F.; Cai, H.; Jin, W.; Wu, C. The emergy ecological footprint for small fish farm in China. Ecol. Indic. 2013, 29, 62–67. [Google Scholar] [CrossRef]
  41. Verdegem, M.C.J.; Bosma, R.H. Water withdrawal for brackish and inland aquaculture, and options to produce more fish in ponds with present water use. Water Policy 2009, 11, 52–68. [Google Scholar] [CrossRef]
  42. Brown, M.; Herendeen, R. Embodied energy analysis and EMERGY analysis: A comparative view. Ecol. Econ. 1996, 19, 219–235. [Google Scholar] [CrossRef]
  43. Gala, A.B.; Raugei, M.; Ripa, M.; Ulgiati, S. Dealing with waste products and flows in life cycle assessment and emergy accounting: Methodological overview and synergies. Ecol. Model. 2015, 315, 69–76. [Google Scholar] [CrossRef] [Green Version]
  44. Garcia, F.; Kimpara, J.M.; Valenti, W.C.; Ambrosio, L.A. Emergy assessment of tilapia cage farming in a hydroelectric reservoir. Ecol. Eng. 2014, 68, 72–79. [Google Scholar] [CrossRef] [Green Version]
  45. Boyd, C.E.; Tucker, C.; Mcnevin, A.; Bostick, K.; Clay, J. Indicators of resource use efficiency and environmental performance in fish and crustacean aquaculture. Rev. Fish. Sci. 2007, 15, 327–360. [Google Scholar] [CrossRef]
  46. Lazard, J.; Rey-Valette, H.; Aubin, J.; Mathé, S.; Chia, E.; Caruso, D.; Mikolasek, O.; Blancheton, J.P.; Legendre, M.; René, F.; et al. Assessing aquaculture sustainability: A comparative methodology. Int. J. Sustain. Dev. World Ecol. 2014, 21, 503–511. [Google Scholar] [CrossRef] [Green Version]
  47. Comar, V. Emergy evaluation of organic and conventional horticultural production in Botucatu, Sao Paulo State, Brazil. In Proceedings of the Emergy Synthesis 1: Theory and Applications of the Emergy Methodology, 1st Biennial Emergy Conference, Gainesville, FL, USA, 25–27 January 2018; Brown, M.T., Ed.; Center for Environmental Policy, University of Florida: Gainesville, FL, USA, 2001; pp. 181–195. [Google Scholar]
  48. Brandt-Williams, S. Handbook of Emergy Evaluation Folio 4: Emergy of Florida Agriculture; Center for Environmental Policy, University of Florida: Gainesville, FL, USA, 2002. [Google Scholar]
  49. Buranakarn, V. Evaluation of Recycling and Reuse of Building Materials Using the Emergy Analysis Method; University of Florida: Gainesville, FL, USA, 1998. [Google Scholar]
  50. Brown, M.T.; Ulgiati, S. Emergy analysis and environmental accounting. In Encyclopedia of Energy; Cleveland, C.J., Ed.; Elsevier: Boston, MA, USA, 2004; pp. 329–354. [Google Scholar]
  51. Giannetti, B.F.; Agostinho, F.; Moraes, L.C.; Almeida, C.M.V.B.; Ulgiati, S. Multicriteria cost-benefit assessment of tannery production: The need for breakthrough process alternatives beyond conventional technology optimization. Environ. Impact Assess. Rev. 2015, 54, 22–38. [Google Scholar] [CrossRef]
  52. Cohen, M.J.; Sweeney, S.; Brown, M.T. Computing the unit emergy value of crustal elements. In Proceedings of the Emergy Synthesis 4: Theory and Applications of the Emergy Methodology, 4th Biennial Emergy Conference, Gainesville, FL, USA, 1 January 2006; Brown, M., Bardi, E., Campbell, D.E., Comar, V., Huang, S., Rydberg, T., Tilley, D., Ulgiat, S., Eds.; Center for Environmental Policy, University of Florida: Gainesville, FL, USA, 2007; p. 483. [Google Scholar]
  53. Castellini, C.; Bastianoni, S.; Granai, C.; Bosco, A.D.; Brunetti, M. Sustainability of poultry production using the emergy approach: Comparison of conventional and organic rearing systems. Agric. Ecosyst. Environ. 2006, 114, 343–350. [Google Scholar] [CrossRef] [Green Version]
  54. Brown, M.T.; Protano, G.; Ulgiati, S. Assessing geobiosphere work of generating global reserves of coal, crude oil, and natural gas. Ecol. Model. 2011, 222, 879–887. [Google Scholar] [CrossRef]
  55. Giannetti, B.F.; Faria, L.; Almeida, C.M.V.B.; Agostinho, F.; Coscieme, L.; Liu, G. Human-nature nexuses in Brazil: Monitoring production of economic and ecosystem services in historical series. Ecosyst. Serv. 2018, 30, 248–256. [Google Scholar] [CrossRef]
  56. Brown, M.T.; McClanahan, T.R. EMergy analysis perspectives of Thailand and Mekong River dam proposals. Ecol. Model. 1996, 91, 105–130. [Google Scholar] [CrossRef]
  57. Takahashi, F.; Ortega, E. Assessing the sustainability of Brazilian oleaginous crops—Possible raw material to produce biodiesel. Energy Policy 2010, 38, 2446–2454. [Google Scholar] [CrossRef]
  58. Dong, X.; Ulgiati, S.; Yan, M.; Zhang, X.; Gao, W. Energy and eMergy evaluation of bioethanol production from wheat in Henan Province, China. Energy Policy 2008, 36, 3882–3892. [Google Scholar] [CrossRef]
  59. Brandt-Williams, S.L. Handbook of Emergy Evaluation a Compendium of Data for Emergy Computation Issued in a Series of Folios Folio # 3 Emergy of Ecosystems; Brown, M.T., Bardi, E., Eds.; Environmental Engineering Sciences Center for Environmental Policy University of Florida Gainesville: Gainesville, FL, USA, 2001. [Google Scholar]
Figure 1. Location of the lambari aquaculture farms studied in the present work. High, moderate, and low control means a decreasing classification in the level of technification. The shadowed areas around the farms are the municipality areas.
Sustainability 14 02090 g001
Figure 2. (A) Generic energy diagram with symbols, acronyms and indicators used in emergy synthesis as presented in Table 2. Modified from Agostinho et al. [14]. R = renewable resources from nature; r = renewable fraction of a source; N = non-renewable resources from nature; n = non-renewable fraction of a source; I = Inputs from nature; F = resources from the larger economy; M = Materials from economy; S = Services from economy; Y = Yield or total emergy demanded; UEV = Unit emergy value; m-%R = renewable fraction; m-ELR = Environmental loading ratio; EYR = Emergy yield ratio; EIR = Emergy investment ratio; ESI = Emergy sustainability index. (B) Most commonly used Energy Systems Language Symbols (Odum [17]).
Sustainability 14 02090 g002
Figure 3. Energy diagram of lambari aquaculture production systems. Hatchery “box” is present only in high control farms (HC). Arrows represent energy flows, circles represent the outside sources, storage units are represented by tanks, and energy transformation processes are represented by the interaction symbol; dashed arrows represent monetary flows; outputs are the harvested lambari, water effluent and environmental services. Symbol details in Figure 2B.
Sustainability 14 02090 g003
Figure 4. (A) Ternary emergy diagram representing the proportions of renewable resources (R), non-renewable resources (N) and resources from the economy (F). Evaluated lambari aquaculture systems in the present study were represented by ▲ (Low Control—LC), ● (Moderate Control—MC), and ■ (High Control—HC); data from literature were represented by ○. The numbers 1, 2, and 3 represent the three farms of the same control level. ESI = emergy sustainability index. a = LC1; b = LC2; c = LC2; d = MC1; e = MC2; f = MC3; g = HC1; h = HC2; i = HC3; j = recirculating system of Atlantic salmon (Samos alar) aquaculture; k = extensive pond system composed of common carp (Cyprinus carpio), tench (Tinca tinca), roach (Rutilus rutilus), perch (Perca fluviatis), sander (Stizostedion lucioperca) and pike (Esox lucius); l = semi-extensive system of common carp, tench, roach, perch and pike from Wilfart et al. [7]; m = integrated pig-grains-fish (species information unavailable) culture; n = semi-intensive fish (species information unavailable) pond system from Cavalett et al. [24]; o = semi-intensive fish (species information unavailable) pond from Cheng et al. [34]; p = net-cage intensive system of tilapia (Oreochromis niloticus) aquaculture and q = net-cage intensive system of tilapia (Oreochromis niloticus) + bamboo substrate, both from David et al. [35]; r = intensive pond system of carp (grass, silver and spotted silver carp) from Zhang et al. [25]. (B) Ternary diagram representing the proportions of renewable resources (R), non-renewable resources (N) and resources from economy (F) for lambari aquaculture systems after the simulated scenarios for better management practices. Legend: LC systems (▲); MC systems (■); HC systems (●); ESI = emergy sustainability index. a = LC1′; b = LC2′; c = LC3′; d = MC1′; e = MC2′; f = MC3′; g = HC1′; h = HC2′; i = HC3′.
Sustainability 14 02090 g004
Figure 5. Emergy sustainability index (ESI) and global efficiency (inverse of unit emergy value, 1/UEV) for the current management and proposed better practices combined for the lambari production farms evaluated. Different colors represent different farms within the same management level: orange = low control (LC); blue = moderate control (MC); green = high control (HC). LC′, MC′ and HC′ mean the simulated better scenario for each farm. The numbers 1, 2, and 3 represent the different farms of the same level of control. Higher area means higher performance. The dashed line represents the area of the system with higher performance. LC = ▲; LC′ = Δ; MC = ■; MC′ = □; HC = ●; HC′ = ○.
Sustainability 14 02090 g005
Table 1. Characteristics of the three evaluated lambari aquaculture systems 1.
Production FactorsLCMCHC
Breeding/spawningNatural without control; spawning inside the grow-out pondsHormone-induced; spawning inside the grow-out pondsHormone-induced; spawning in hatchery tanks
Production cycle (months)444
Crops/year333
Total area of ponds (ha)<1.51.5–6.2>6.0
Fertilization regimePoultry manurePoultry manurePoultry manure and/or chemical fertilizer
Stocking seedlarvaelarvaejuvenile
Stocking density in nursery phase (units/m2)N/AN/A250
Stocking density in grow-out phase (units/m2)8–10 217–25 230–50
Pond water exchange (%/day)3.7 ± 1.1 37.0 ± 4.8 35.8 ± 1.6 3
Water sourceSpringwaterSpringwaterSuperficial water
Diet protein content (%)2832–5632–56
Survival (%)N/AN/A56 ± 1.6 3
Final fish length (mm)80.0 493.3 496.6 4
Final fish mean weight (g)10.0 ± 0.0 316.0 ± 0.0 318.0 ± 0.0 3
Productivity (t/ha)1.8 ± 1.1 36.1 ± 2.6 36.9 ± 4.4 3
1 Low control (LC), moderate control (MC) and high control (HC) management levels. Data were obtained from the literature [13,19] and in interviews with major stakeholders of the lambari production chain, including the farmers. N/A = not available. Springwater means subterranean water that emerges from the soil reservoirs (aquifers) and is obtained naturally or by pumping. 2 Values for the stocking density of the grow-out phase were estimated considering final productivity and survival for LC and MC, as in these farms, larvae hatch inside the grow-out ponds. 3 Means and deviations from the three studied farms within the same control level. 4 Final fish length varies according to market demand in each region.
Table 2. Emergy indicators used in the present study 1.
Emergy IndicatorAlgebraDescriptionInterpretation
Unit emergy valueUEV = Y/ERatio of the total emergy demanded by the unit output. Example of units are sej/J, sej/kg and sej/$.It is a measure of the environmental cost of a product. Indicates the efficiency of a system, when compared to others of the same hierarchical level.
Renewability 2m-%R = 100 (R + Mr + Sr)/YRatio of the nature and economy’s renewable fraction by the total emergy demanded to produce lambari.Indicates the renewability fraction of the total emergy demanded for delivering a product or a service.
Environmental loading ratio 2m-ELR = (N + Mn + Sn)/(R + Mr + Sr)Ratio of the total non-renewable resources by the total renewable resources.Indicates the pressure exerted by a production system over the natural ecosystems. ELR values < 2 indicate low pressure, values ranging from 2 to 10 indicate moderate pressure and values > 10 indicate high pressure.
Emergy yield ratioEYR = Y/FRatio of the total emergy demanded to produce lambari by the resources from economy.Indicates the net contribution of a system to the economy beyond its own operation. EYR values < 2 indicates a high dependence on purchased resources and a low contribution to the larger economy.
Emergy investment ratioEIR = F/(R + N)Ratio of the resources from economy by the nature’s renewable and non-renewable resources.It evaluates if a process is a good user of the emergy that is invested, in comparison with alternatives. Ratios higher than those of the surrounding area or similar systems do not compete economically.
Emergy sustainability indexESI = EYR/m-ELRRatio between the emergy yield ratio by the environmental loading ratio.Incates the contribution of a system to the economy by the pressure caused in the environment. ESI values < 1 indicate unsustainability, values ranging from 1 to 5 indicate short-term sustainability, values > 5 indicate long-term sustainability.
1 UEV = Unit emergy value; Y = total emergy demanded; E = system output (J, kg or $); sej = solar emjoules; m-%R = renewable fraction; R = renewable resources from nature; r = renewable fraction of a source; N = non-renewable resources from nature; n = non-renewable fraction of a source; F = resources from the larger economy; M = Materials from economy; S = Labor and Services from economy; m-ELR = Environmental loading ratio; EYR = Emergy yield ratio; EIR = Emergy investment ratio; ESI = Emergy sustainability index. Source: Odum [17]. 2 Indicator modified according to Agostinho et al. [22].
Table 3. Emergy accounting results in sej/ha.yr for the nine evaluated lambari aquaculture systems 1.
ItemLC1LC2LC3MC1MC2MC3HC1HC2HC3
Emergy%Emergy%Emergy%Emergy%Emergy%Emergy%Emergy%Emergy%Emergy%
Sun (R)4.67 × 10¹³<14.67 × 10¹³<14.67 × 10¹³<14.67 × 10¹³<14.67 × 10¹³<14.67 × 10¹³<14.67 × 10¹³<14.67 × 10¹³<14.67 × 10¹³<1
Rainfall (R)2.12 × 101532.12 × 101522.12 × 101532.12 × 101512.12 × 101512.12 × 101511.36 × 1015<11.99 × 101521.36 × 10151
Superficial water (R)0.00 × 10000.00 × 10000.00 × 10000.00 × 10000.00 × 10000.00 × 10001.17 × 101631.42 × 1016171.08 × 10164
Soil occupation (N)1.22 × 101528.01 × 101413.87 × 101413.33 × 101511.43 × 101512.10 × 101512.10 × 101653.30 × 101541.18 × 1015<1
Springwater (N)1.41 × 1016212.44 × 1016191.03 × 1016151.41 × 101651.48 × 1016101.46 × 101690.00 × 10000.00 × 10000.00 × 1000
Feed (F)4.77 × 101574.95 × 1016391.87 × 1016271.26 × 1017495.43 × 1016355.89 × 1016372.19 × 1017482.63 × 1016314.02 × 101617
Equipment (F)1.12 × 10¹³<17.27 × 101412.13 × 1013<11.20 × 10¹⁵<11.38 × 10¹⁴<15.25 × 10¹⁴<12.69 × 10¹⁴<11.80 × 10¹³<15.89 × 10152
Electricity (F)9.82 × 10¹²<17.24 × 101411.92 × 1013<11.20 × 10¹⁵<11.38 × 10¹⁴<15.21 × 10¹⁴<12.69 × 10¹⁴<11.80 × 10¹³<15.89 × 10152
Infra-structure (F)3.67 × 10¹²<15.25 × 10¹²<14.09 × 10¹²<16.08 × 10¹²<12.36 × 10¹²<18.52 × 10¹²<18.57 × 10¹²<11.50 × 10¹²<18.73 × 10¹²<1
Lime (F)4.66 × 101574.66 × 101544.66 × 101574.66 × 101524.66 × 101534.66 × 101534.66 × 101514.66 × 101564.66 × 10152
Organic fertilizer (F)9.21 × 1015139.21 × 101579.21 × 1015139.21 × 101549.21 × 101569.21 × 101569.21 × 101529.21 × 1015119.21 × 10154
Fuel (diesel) (F)4.98 × 101418.62 × 101414.88 × 101417.32 × 101532.36 × 101528.79 × 101566.10 × 101511.46 × 101525.58 × 101623
Labor (F)0.00 × 10004.76 × 1014<10.00 × 10006.48 × 101535.22 × 101536.27 × 101541.70 × 101641.16 × 101512.93 × 101612
Services (F) 23.16 × 1016463.40 × 1016272.43 × 1016358.41 × 1016336.09 × 1016395.16 × 1016331.66 × 1017362.15 × 1016268.13 × 101634
Total emergy (Y)6.83 × 10161001.27 × 10171007.02 × 10161002.59 × 10171001.55 × 10171001.59 × 10171004.57 × 10171008.38 × 10161002.40 × 1017100
Total (R) 38.25 × 1015131.18 × 101698.23 × 1015122.44 × 10169164 × 1016111.56 × 1016105.32 × 1016122.24 × 1016273.62 × 101615
Total (N)1.54 × 1016232.52 × 1016201.07 × 1016151.74 × 101671.63 × 1016101.63 × 1016112.10 × 101653.30 × 101541.18 × 1015<1
Total (F)4.43 × 1016648.98 × 1016711.07 × 1016732.17 × 1017841.23 × 1017791.627 × 1017803.82 × 1017845.81 × 1016692.02 × 101784
1 Low control (LC), moderate control (MC) and high control (HC) management levels. Numbers (1, 2 and 3) are the identification of different farms within the same control level. R, renewable resources from nature. N, non-renewable resources from nature. F, resources from the larger economy. Emergy columns present the emergy flow from each item for each farm. Percentage columns (%) show the emergy fraction of an item relative to the total emergy (Y) for each farm. 2 Includes Equipment, Fuel, Infrastructure, Electricity, Feed, Organic Fertilizer, Hormone, Depreciation, and Taxes. See Appendix C for details. 3 Includes the flows of Sun, Rainfall, Superficial Water and the renewable fraction from N and F flows.
Table 4. Emergy indicators for the current management (LC) and the simulated better scenario (LC’) of lambari aquaculture low control farms 1.
IndicatorLC1LC1′LC2LC2′LC3LC3′
UEV (E6 sej/J) 22.841.861.891.213.071.90
UEV (E10 sej/g) 24.883.194.232.727.024.34
UEV (E6 sej/J) 31.530.791.380.802.011.04
UEV (E10 sej/g) 32.621.373.091.794.592.37
m-%R (%)13379331231
m-ELR6.91.79.82.07.52.2
EYR1.31.41.31.31.21.3
EIR3.93.44.64.05.54.5
ESI0.20.80.10.70.20.6
1 Numbers (1, 2 and 3) are the identification of each different farm within a same control level. UEV = Unit emergy value; m-%R = Renewable fraction; m-ELR = Environmental loading ratio; EYR = Emergy yield ratio; EIR = Emergy investment ratio; ESI = Emergy sustainability ratio. 2 including labor and services. 3 without labor and services.
Table 5. Emergy indicators for the current management (MC) and the simulated better scenario (MC’) of lambari aquaculture moderate control farms 1.
IndicatorMC1MC1′MC2MC2′MC3MC3′
UEV (E6 sej/J) 21.551.020.910.612.171.44
UEV (E10 sej/g) 23.382.232.071.385.093.38
UEV (E6 sej/J) 31.050.620.550.321.460.32
UEV (E10 sej/g) 32.281.351.260.183.440.18
m-%R (%)91711231022
m-ELR9.64.88.53.49.23.6
EYR1.11.11.11.21.11.2
EIR13.211.58.47.48.47.4
ESI0.10.20.10.30.10.3
1 Numbers (1, 2 and 3) are the identification of each different farm within the same control level. UEV = Unit emergy value; m-%R = Renewable fraction; m-ELR = Environmental loading ratio; EYR = Emergy yield ratio; EIR = Emergy investment ratio; ESI = Emergy sustainability ratio. 2 including labor and services. 3 without labor and services.
Table 6. Emergy indicators for the current management (HC) and the simulated better scenario (HC’) of lambari aquaculture high control farms 1.
IndicatorHC1HC1′HC2HC2′HC3HC3′
UEV (E6 sej/J) 24.682.540.860.552.471.81
UEV (E10 sej/g) 210.35.622.091.334.973.63
UEV (E6 sej/J) 32.971.450.640.371.631.13
UEV (E10 sej/g) 36.583.201.560.893.282.27
m-%R (%)121427321516
m-ELR7.66.32.72.15.65.2
EYR1.11.11.31.41.11.1
EIR13.411.44.33.418.016.4
ESI0.10.20.50.70.20.2
1 Numbers (1, 2 and 3) are the identification of each different farm within a same control level. UEV = Unit emergy value; m-%R = Renewable fraction; m-ELR = Environmental loading ratio; EYR = Emergy yield ratio; EIR = Emergy investment ratio; ESI = Emergy sustainability ratio. 2 including labor and services. 3 without labor and services.
Table 7. Emergy indicators for each practice of the simulated scenarios of lambari aquaculture farms 1.
IndicatorLC1′LC2′LC3′MC1′MC2′MC3′HC1′HC2′HC3′
Practice 1. Improved seed productivity in LC and MC farms
UEV (E6 sej/J)1.821.211.970.990.581.39---
UEV (E10 sej/g)3.903.385.622.711.664.07---
m-%R (%)1391291110---
m-ELR6.99.87.59.68.59.2---
EYR1.31.31.21.11.11.1---
EIR3.94.65.513.28.48.4---
ESI0.20.10.20.10.10.1---
Practice 2. Changing water sources in the LC and MC farms
UEV (E6 sej/J)2.241.492.431.230.721.72---
UEV (E10 sej/g)4.814.176.953.372.065.06---
m-%R (%)322826152019---
m-ELR2.12.62.95.94.14.4---
EYR1.31.31.21.11.11.1---
EIR4.14.95.713.98.98.8---
ESI0.60.50.40.20.30.3---
Practice 3. Controlling pond fertilization in all farms
UEV (E6 sej/J)2.421.742.631.490.852.034.570.762.37
UEV (E10 sej/g)4.153.906.003.251.934.7710.121.844.76
m-%R (%)1391291010122915
m-ELR6.89.87.59.78.59.37.62.55.5
EYR1.41.31.31.11.11.11.11.41.1
EIR3.34.34.712.77.97.913.13.817.2
ESI0.20.10.20.10.10.10.10.60.2
Practice 4. Replace animal protein by vegetable protein sources in all farms
UEV (E6 sej/J)2.791.692.851.350.821.954.070.792.36
UEV (E10 sej/g)4.783.786.522.941.874.589.011.924.75
m-%R (%)131012101110132916
m-ELR6.89.27.28.98.08.66.92.55.4
EYR1.41.31.21.11.21.21.11.31.1
EIR3.84.15.111.57.67.611.73.917.1
ESI0.20.10.20.10.10.10.20.50.2
1 Low control (LC’), moderate control (MC’) and high control (HC’) management levels. Numbers (1, 2 and 3) are the identification of each different farm within a same control level. UEV = Unit emergy value; m-%R = renewable fraction; m-ELR = Environmental loading ratio; EYR = Emergy yield ratio; EIR = Emergy investment ratio; ESI = Emergy sustainability ratio.
Publisher’s Note: MDPI stays neutral with regard to jurisdictional claims in published maps and institutional affiliations.

