Article

Improving the Contribution of Forests to Carbon Neutrality under Different Policies—A Case Study from the Hamburg Metropolitan Area

Institute for Wood Science-World Foresty, Center for Earth System Research and Sustainability (CEN), Universiät Hamburg, 21031 Hamburg, Germany
*
Author to whom correspondence should be addressed.
Current address: Leuschner Straße 91e, 21031 Hamburg, Germany.
Sustainability 2022, 14(4), 2088; https://doi.org/10.3390/su14042088
Submission received: 22 December 2021 / Revised: 2 February 2022 / Accepted: 8 February 2022 / Published: 12 February 2022
(This article belongs to the Section Sustainable Forestry)

Abstract

:
As various political initiatives have set goals to reach net-zero emissions by the mid-21st century, forests will play an important role as a carbon sink for sequestering unavoidable emissions. Forest management can take two approaches by either decreasing harvest and enlarging the forest carbon stock or increasing harvest to increase carbon uptake and create harvested wood products (HWPs). Currently, these two management options seem at odds with seemingly conflicting policy directives being written. We used the BEKLIFUH model to assess six management scenarios based on carbon offset potential taking into consideration forest carbon, HWPs and the material and energetic substitution effects. The results show that while conservation leads to a higher above-ground carbon pool, including HWPs, material and energetic substitution leads to more overall carbon offsets for management scenarios with more timber harvesting. With compromise being possible by selectively conserving old growth forests with a high biodiversity value. In conclusion, if the forest sector decouples GHG reporting from forest management and includes all the secondary effects of timber harvest, this new approach can lead to a different cost–benefit analysis for the choice between harvest vs. conservation. This could result in a paradigm shift to a future where biodiversity and carbon neutrality can coexist.

1. Introduction

One of the greatest challenges of the current century is reducing carbon emissions to limit the rise of global temperature to below 2 or even 1.5 degrees Celsius compared to pre-industrial levels. Various political initiatives have set emission reduction goals for the near future. For the European Union, the “fit for 55” climate package sets the 2030 climate target to 55% of greenhouse gas (GHG) emissions compared to 1990 levels. After that, the final target is to achieve net-zero emissions by 2050 [1]. Net-zero emission means that the Earth’s anthropogenic net GHG emissions are reduced to zero; all anthropogenic GHG emissions would need to be compensated by removing them from the atmosphere and storing them in natural and artificial sinks [2]. Thus, emission reductions alone are not sufficient to reach net-zero targets as some emissions are unavoidable [3]. Therefore, carbon sequestration and storage by forests is an important aspect of achieving net-zero emission goals.
Forests play an important role in regulating atmospheric carbon by sequestering carbon dioxide. Global forests are the largest terrestrial carbon sink [4] and have absorbed approximately 2 Pg C annually from the atmosphere in the last few decades [5], while it is estimated that non-tropical forests sequester approximately 0.09–0.12 Pg carbon per year [6]. In Europe, where the managed semi-natural temperate forest makes up a majority of forest area [7,8], forest management can be used to optimize carbon sequestration while at the same time providing timber for use in various harvested wood products (HWPs). As the urgency to tackle anthropogenic climate change increases, both governmental and non-governmental organizations are looking for supplementary ways to meet emission reduction targets. The 2006 IPCC guidelines [9] were the first to provide guidance on the estimation and reporting of the contribution of HWPs to national CO 2 emissions and removals. Furthermore, the 2015 Paris Agreement allows the accounting of carbon stored long term in Forests and HWPs by its signing members [10]. Most recently, the 2030 Climate Target Plan of the European Union puts a greater emphasis on forestry and attempts to support forestry through greater visibility for the climate benefits of wood products [1].
There are two main ways forest management can contribute to climate change mitigation. The first is through enlarging the forest carbon stock. This approach entails conserving forests and largely dispenses timber harvesting, allowing the forest to achieve its peak carbon storage potential. The second approach is to increase carbon uptake. As the rate of carbon sequestration in forests is at its maximum when forests are still young [11,12,13,14], forest harvesting leads to a younger overall forest structure, and harvested timber is then processed to become harvested wood products. These HWPs contribute to carbon sequestration by storing carbon for their entire life cycle. The size of this anthropogenic carbon pool is thus determined by the harvest (inflow) and the product lifetime (outflow) [15].
In addition to considering, the change in C-pools in forests and in HWPs, the mitigation of CO 2 emissions that can be achieved through timber production can also be taken into account [16]. This mitigation involves the avoidance of industrial process carbon emissions from alternative materials such as steel or concrete, and it is quantified using displacement factors. A displacement factor is an index of the efficiency with which the use of biomass reduces net GHG emissions [17,18,19]. For instance, one study determined that apartment buildings using conventional construction methods produces up to 5.6 times as many CO 2 emissions as apartment buildings using mainly wood-based construction materials [16].
In Germany, this aspect found expression in the Charter for Wood, which was adopted with the aim that “sustainable forest management and wood use, as well as the consistent substitution of energy-intensive materials with a detrimental CO 2 balance by wood, can contribute significantly to the reduction of greenhouse gas emissions and to climate protection as a whole, and are thus indispensable for achieving the targets of the Paris Climate Agreement” [20]. The implementation of the Charter for Wood requires a sustainable supply of wood. Germany is also the largest producers of bio-energy in the EU [21], with bio-energy also being actively encouraged by the EU energy directive [22].
In order to make well-balanced decisions on forest management with regards to carbon sequestration, forest managers and policy makers need more information on the trade-offs between climate change mitigation, forest protection and timber production. To treat these trade-offs equally, one needs to look at the entire forest–timber chain, including forests, their HWPs and the resulting energetic and material substitution effects must be considered [23]. Several previous studies have included parts of this chain, with some studies not including carbon stored in HWPs [24,25,26,27], or others included HWPs but not their associated substitution effects [28,29,30]. In other studies, the inclusion of these of additional carbon offsets is limited in scope [31,32]. We hypothesize that including these additional carbon offsets will change which management scenarios achieve the most carbon offsets.
This study aims to provide a comprehensive analysis of the carbon offsets of different management scenarios. We compare different forest management strategies for the Hamburg metropolitan area with a focus on national and EU forest protection goals. We calculate the carbon offset of each management scenario, with carbon offsets being defined as the sum of carbon sequestration in forests, carbon storage in HWPs and their associated material and energetic substitution effects. This is performed using an integrated forest model and timber model, using various scenarios that represent a range of conservation vs. utilization allocations. The results of the scenario analysis demonstrate differences in management alternatives in terms of forest carbon sequestration, carbon stored in HWPs and the substitution effects. The consideration not only of the forest ecosystem as carbon sinks—as stipulated by recent climate legislation—but of the entire forest-timber chain can decisively influence the choice of the management method for maximizing carbon offsets.

2. Materials and Methods

The modelling of the carbon sequestration, storage, and emissions of the forest and HWP system was performed using the BEKLIFUH program. This is a carbon-centric forest management tool developed by Knauf et al. [33] and funded by the German federal forest climate fund (Waldklimafonds). The model links the evolution of forest C-pools to the energetic and material substitution effects of wood use and changes in the C-pool of HWPs. A local forest growth model is at the core of the forest development modeling. In the local forest growth model, the respective developments of the forest C-pool are determined for different scenarios of forest management; for this purpose, the model also provides the annual timber harvest volumes. The basis for this calculation is a forest growth model based on yield tables. The model adapts the yield table values using two successive forest inventories, for a more realistic representation of the local conditions. The initial data on tree age, volume and stand density are obtained from the third German national forest inventory (NFI) conducted in 2012 [34], and stock increment is calculated from the 2002 and 2012 inventories.
Forest management is modelled by four base scenarios that cover a wide range of future forest development:
1.
Mass optimization: strategy with highest possible timber production; stands are harvested at the time of the at the time of maximum average total increment harvested;
2.
Value optimization: long-term focus on strong wood strategy aimed at harvesting strong timber with a corresponding strategy, characterized by longer rotation periods and increase in growth of the individual tree;
3.
Storage optimization: (limited) utilization of wood with simultaneous high forest storage; extremely extended rotation periods in in connection with reduced wood utilization in favor of deadwood storage;
4.
Non-utilization: no wood-economical utilization of the forest stands (no logging); accumulating wood (e.g., through simulated windthrow) remains completely in the deadwood store.
The base scenarios are then later combined in to a variety of combination scenarios. In this study, six different combination scenarios were selected. Various HWPs uses are to be specified for the raw wood removed from the forest. This is performed by a percentage distribution of wood use by tree species groups and diameter classes for the first use level (sawmill industry, wood-based panel industry, pulp/paper, energy and other sectors) based on a national wood utilization key for Germany [35]. These calculations are all in line with the IPCC (IPCC-GPG) Guidelines [33]. These calculations are run from the last inventory year of 2012 until 2100.

2.1. Forest Data

This study focused on the Hamburg metropolitan area. The Hamburg area is one of the few areas in Germany where the predicted impact of extreme weather events such as droughts and heat waves in even the most extreme IPCC scenarios is tempered compared to more southern and inland regions in Germany [36]. This gives us the opportunity to look at forest growth relatively unentangled from future climate scenarios. This area is defined as the accumulated area of the 19 districts shown in Table 1. The corresponding forest area was also noted per district as well as the amount of NFI sample points. The area weight for each district and the number of sample points per 100 ha of forest area were calculated to be used as a correction factor in the model.
Timber species in the NFI where grouped in to 6 tree species classes as used in the BEKLIFUH model. These classes were:
  • BE (Beech) — Fagus spp. and all deciduous species with a long lifespan (Acer spp., Fraxinus excelsior, Castanea sativa, Tilia spp., Robinia pseudoacacia).
  • OA (Oak) — With all Quercus species.
  • PO (Poplar) — Populus spp., Salix spp., Betula spp., Ulmus spp. and all other deciduous species with a shorter lifespan.
  • SP (Spruce) — Consisting of Picea abies, Abies grandis and all other Abies spp.
  • PI (Pine) — consisting of all Pinus and Larix species.
  • DG (Douglas) — Consisting P. menziesii, Abies grandis, and Thuja spp.
Using the NFI information, the mean, minimum and maximum increments were calculated for the six tree species classes as shown in Table 2. These three values for each tree species class were used as input for the growth functions in the BEKLIFUH model.

2.2. Management Scenarios

Management scenarios based on the aforementioned base scenarios were selected based the proportion of the non-utilization scenario that they included. These can be divided into six main scenarios:
1.
The Full conservation scenario, where no harvest takes place on any part of the forest;
2.
The National biodiversity scenario, which follows the national recommendation where 5% of the forest area is excluded from harvesting activities;
3.
The EU biodiversity scenario, where 10% of the forest is excluded from harvesting activities;
4.
The Maximum biodiversity scenario, which assumes that a disproportionate amount conservation needs to take place in forests in order to achieve carbon sequestration goals;
5.
The Old growth forest scenario, where only old growth stands (age > 120 years, age class 7 and 8) are excluded from harvesting activities;
6.
The Full production scenario, where all forest area is open to harvesting activities.
Scenario set-up is shown in Table 3. For the purpose of consistency, the proportion of the three harvest-related basic scenarios remains equal through all of the six scenarios. Only the relative proportion of the non-utilization base scenario changes, and as climate factors are largely ignored in this study, stand growth rates do not change over time in the different scenarios. Tree species distribution within a stand also remain the same.

2.3. Wood Product Allocation

Wood products are allocated into 16 main wood-use categories, each with corresponding non-timber products as seen in Table 4. Harvested wood is allocated to these 16 groups and converted to sequestered carbon via a substitution factor (SF). This substitution factor is expressed as a ratio [18] (tC/tC) and represents the amount of carbon a unit of substitute emits in comparison to its corresponding HWP. The remaining wood is then finally allocated to a fuel group, and its energetic substitution is calculated. Here, substitution is based on the energetic value of the wood being burned in comparison to that of the average energy mix of Germany for 2015.

3. Results

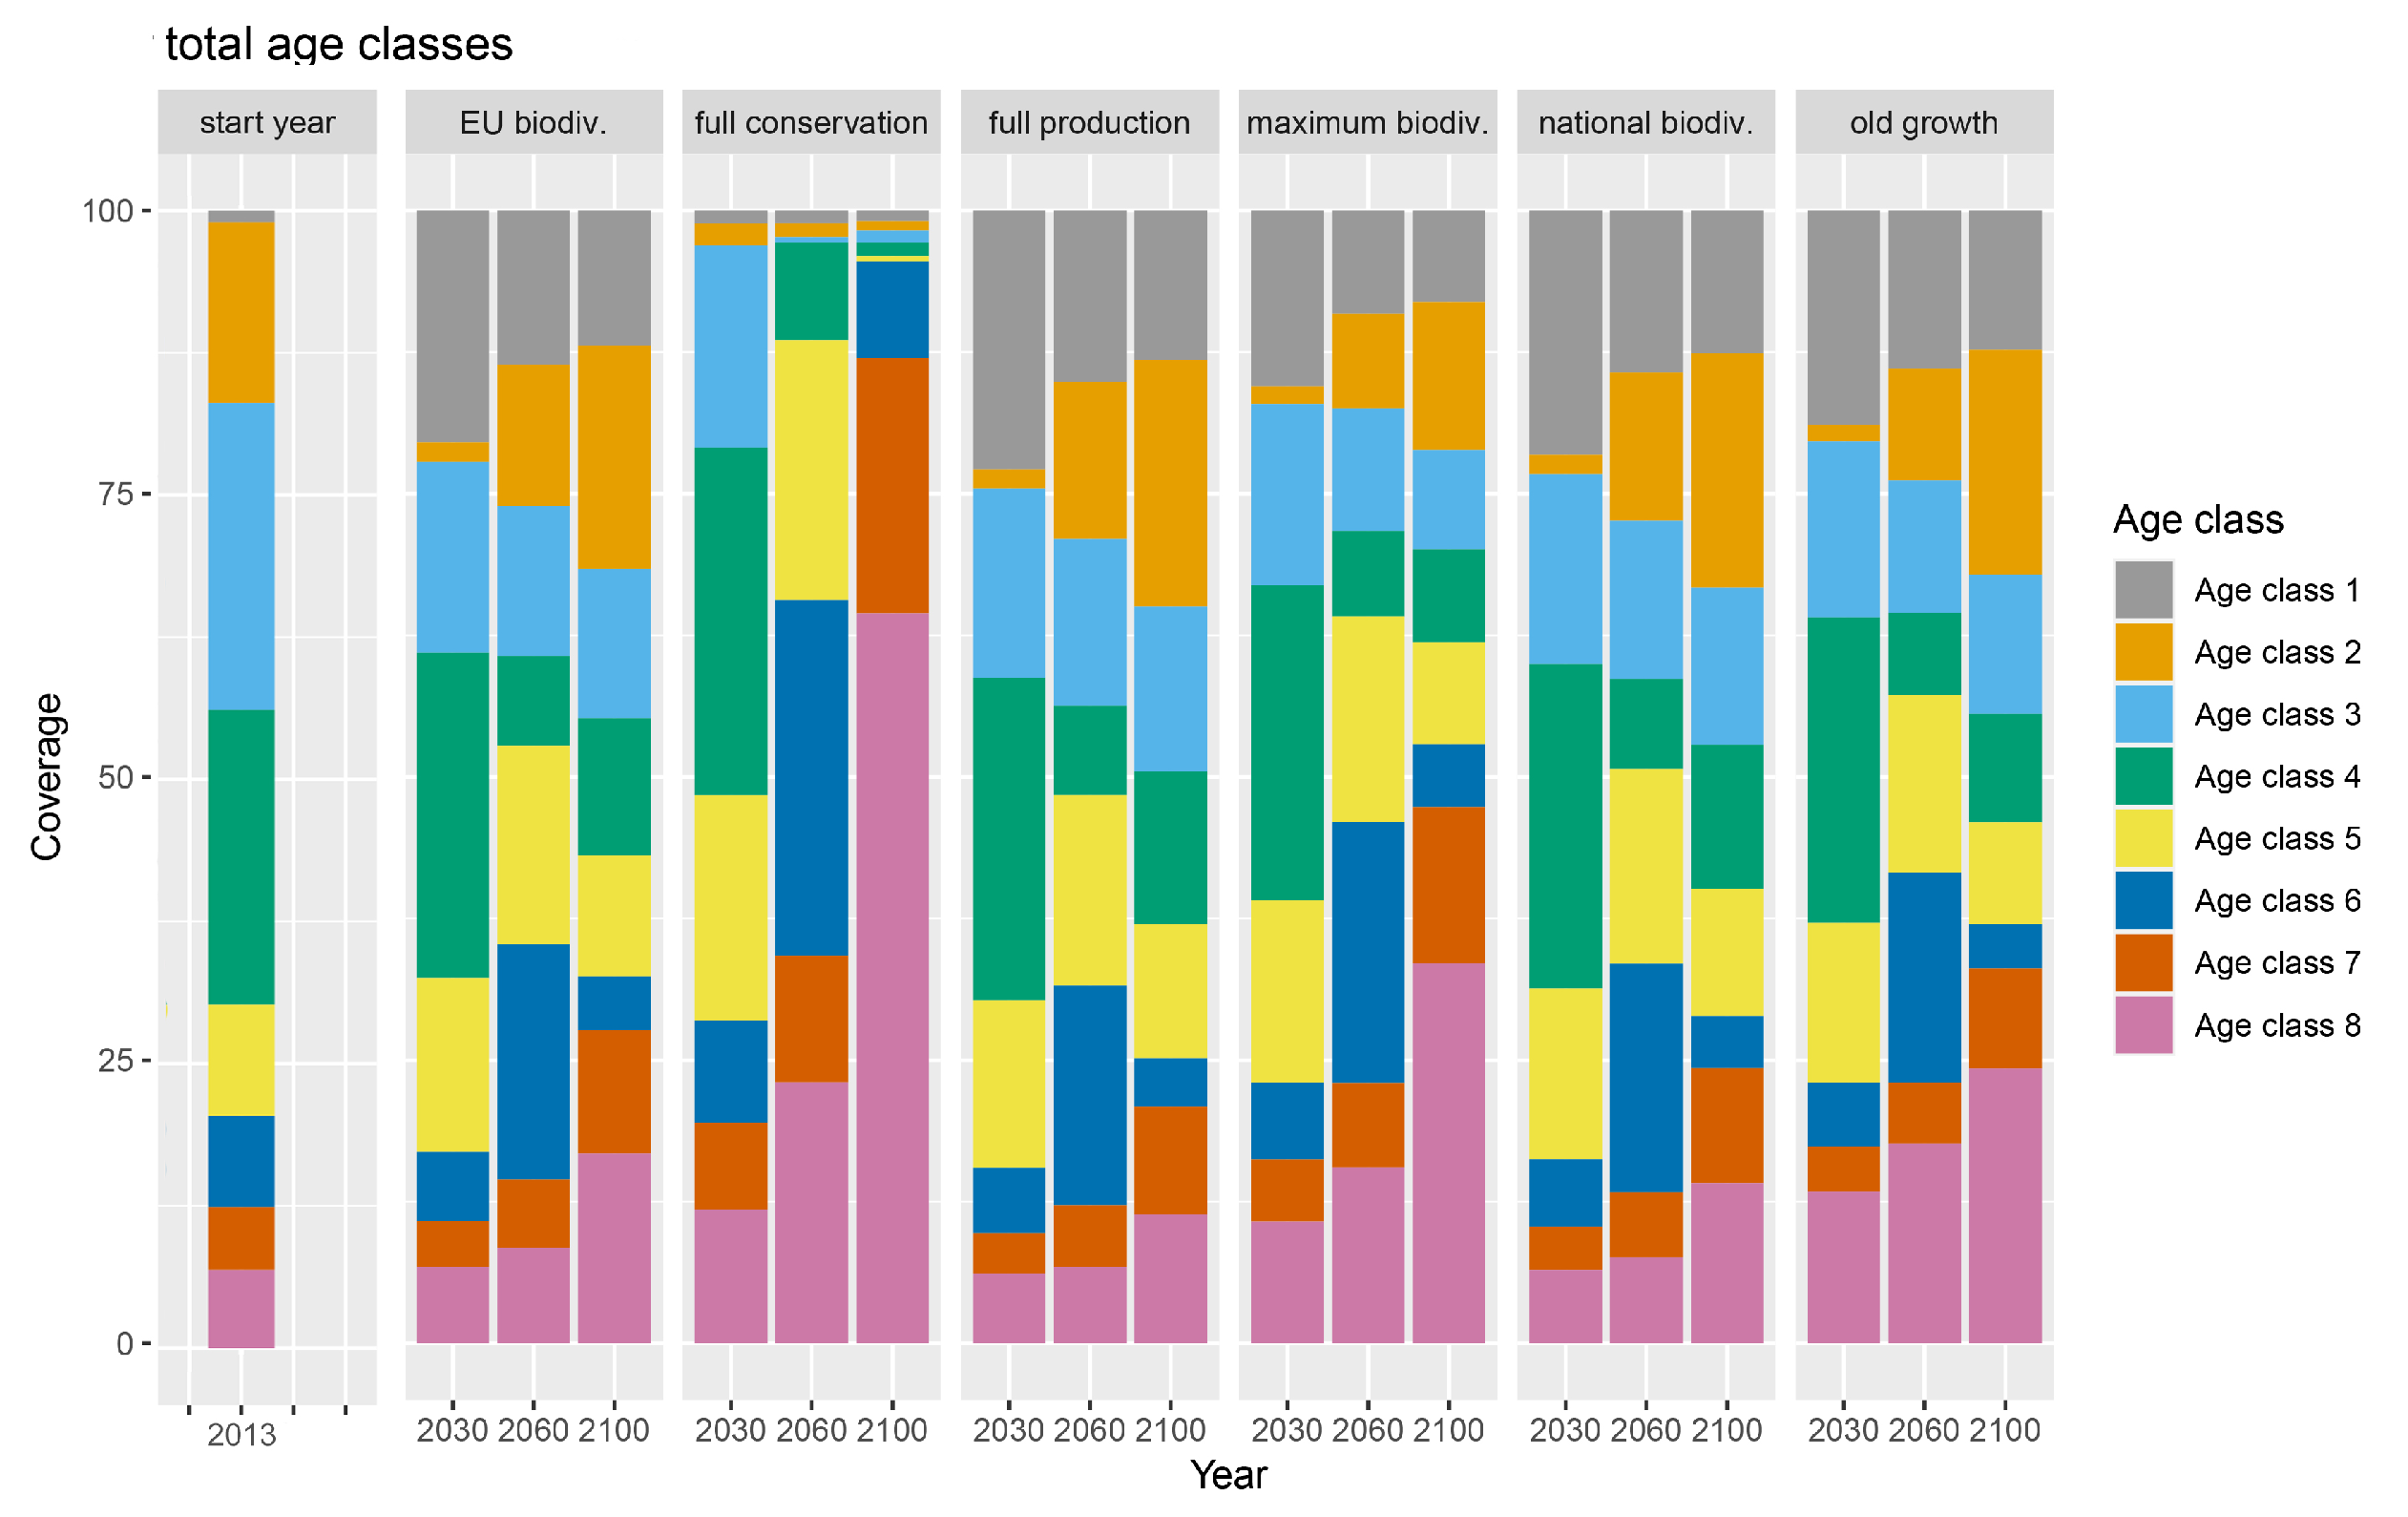
3.1. Age Class Distribution

Figure 1 shows the predicted age class distribution of the six selected management scenarios in the time period from 2013 to 2100. The Full production and EU biodiversity scenarios result in relatively young forests, with more than 50% of forest area being younger than 60 years in 2100. The Full production scenario results in only around 11% of all forests being 140 years or older in 2100, and for the National biodiversity and EU biodiversity scenarios, these are 14.1% and 16.7%, respectively. The Maximum biodiversity and Old growth forest scenarios result in a more even distribution of age classes with around 30% of forests being younger than 60 years for the Maximum biodiversity scenario and 40% for the Old growth forest scenario in 2100. The Full conservation scenario results in an abundance of old growth forest coverage with 80% of forests being 120 years or older by 2100.

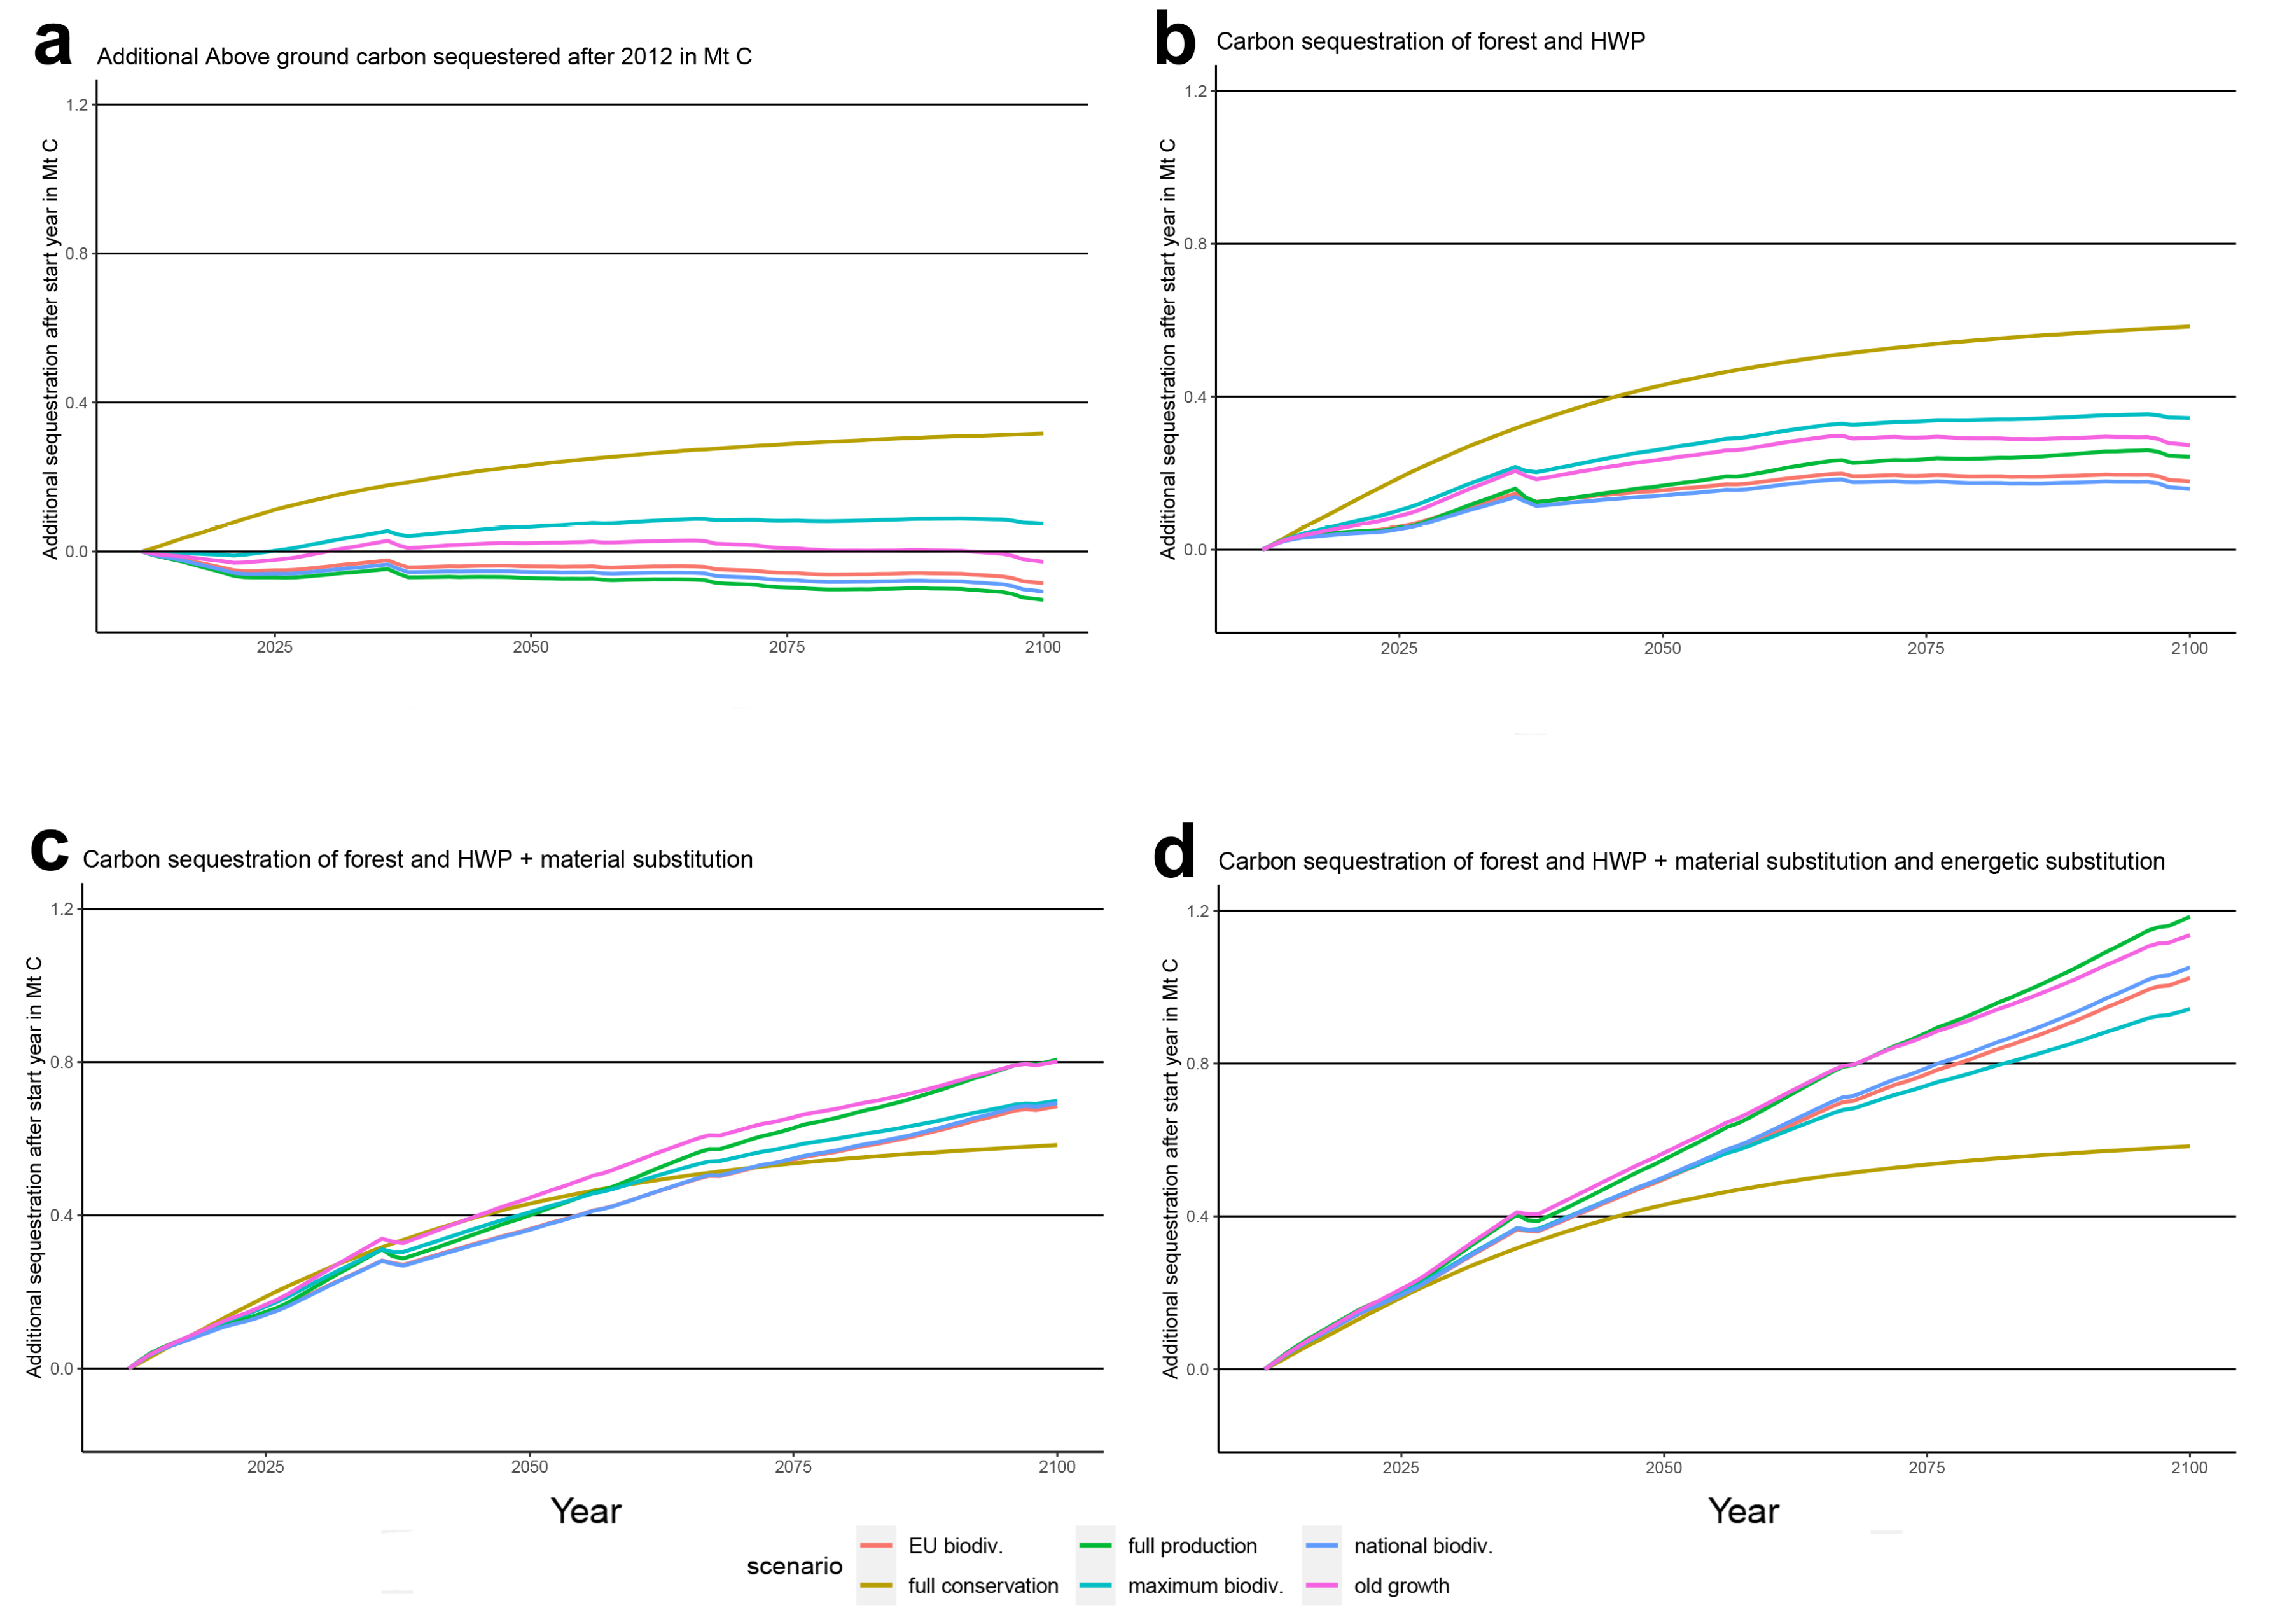
3.2. Above-Ground Forest Carbon

Figure 2a shows the net cumulative amount of carbon sequestered (positive) or emitted (negative) by the above-ground forest biomass for the six different scenarios from 2012 until to 2100. Here, the Full production scenario results in the forest being a net carbon source for the entirety of the extent of the simulation, averaging at −76.000 tC with a minimum of −130.000 tC. The same holds for the National biodiversity and EU biodiversity (average −61.000, minimum −100.700 tC and average −47.000, minimum −85.000 tC, respectively). The Old growth forest scenario results in a net-positive carbon sequestration effect until almost the end of the scenario with an average of 6.400, a maximum of 29.000 and a minimum of −30.000 tC throughout the simulation. This effect is even more pronounced in the Maximum biodiversity scenario. In the Full conservation scenario, the forest is a net carbon sink for the entire duration of the simulation with an additional 316.000 tC sequestered in 2100.

3.3. HWPs and Substitution

Figure 2b shows the amount of carbon in megatons sequestered in forest, including all forest carbon, plus the amount sequestered in HWPs by the six different scenarios until the year 2100. The Full conservation scenario involves no timber harvesting, and thus, no carbon sequestration effect from HWPs is present; only the effects of dead wood are then included. All six scenarios now show a positive trend, with the Full conservation scenario still being the best scenario in terms of carbon offsets with a maximum of 583.000 tC sequestered in the year 2100, followed by the Maximum biodiversity scenario (343.000 tC), Old growth forest scenario (273.000 tC), Full production scenario (173.000 tC), and, at the bottom, the National biodiversity and EU biodiversity scenarios with 160.000 and 158.000 tC, respectively.
Figure 2c shows the added effect of material substitution. With its addition to the total sum of carbon offsets, all five scenarios that include timber harvesting surpassed the Full conservation scenario. The Old growth forest scenario and Full production scenario approximately show an equal amount of carbon offsets in 2100, with both reaching around 800,000 tC. The Maximum biodiversity scenario together with the National biodiversity and EU biodiversity scenarios also reach approximately the same values at around 700,000 tC sequestered in 2100.
Finally, Figure 2d shows the total carbon offsets for both forest carbon, HWPs, material and energetic substitution. The Full production scenario is now the scenario with the highest total offset amount of 1.184.000 tC in 2100. This is then followed by the Old growth forest scenario with 1,136,000 tC in offsets, the National biodiversity and EU biodiversity (1,051,000 and 1,024,000 tC in offsets, respectively) and the Maximum biodiversity scenario (942,000 tC).

4. Discussion

The results of the scenario analyses are of particular importance for achieving net-zero emissions, which can only be met if unavoidable residual emissions are compensated by sinks. Sinks can be technical or natural solutions [2]. As technical solutions are often considered to be too cost intensive [37], nature-based solutions such as carbon sequestration in peatlands and forests are of vital relevance to meet net-zero emissions. Therefore, there is high pressure to maximize carbon stocks and carbon sequestration of forests to increase their sink effect. However, this would, in turn, result in a significant reduction of timber harvesting and drastically limit the emission reduction potential of timber use.
The results shown in the previous section indicate only the Full conservation scenario, and the Maximum biodiversity leads to an increasing amount of carbon sequestration in the above-ground forest carbon pool. However, when we add the carbon stored in HWPs and the carbon offsets by material and energetic substitution, all other scenarios surpass the Full conservation scenario in terms of carbon accumulation. This is significantly different from the previous study by Knauf et al. [33], using the BEKLIFUH model for the German federal state of North-Rhine Westphalia, as there all studied scenarios showed positive carbon sequestration potential. This could be caused by a difference in age class distributions between the Hamburg metropolitan area and the federal state of North-Rhine Westphalia.
In the current method of carbon accounting, the IPCC guidelines for national GHG inventories for timber utilization, [9] sequestration is only accounted for when in long-lived products. Emission savings are not at all recognized as a separate category by the IPCC, and current EU strategies attribute the substitution effect of timber to the process but not their original source, e.g., the forest sector [38]. This does not mean that energetic and material substitution effect of wood products is not present national carbon accounting, but only that it is not attributed to the forest sector. The process of energetic and material substitution is accounted for during use in the energy, manufacturing and industrial process sectors as emission reductions. For national GHG, reporting this approach is helpful as it prevents double counting. However, if, within forest management, these substitution effects where instead attributed or at least included in the total carbon sequestration potential of forests, this could have a big impact on the way forest management is conducted. While policy makers and forest managers are now directing management toward increasing carbon stocks, forests could instead be managed to increase the substitution effect. With regards to net-zero, it has been shown that carbon extraction by harvesting is more than compensated for by the offsets of timber use; therefore, forest utilization is a net-zero solutions in and of itself.
Nonetheless, introducing a Full production scenario is a very radical shift from the forest management policy developed throughout the 20th century, as forests should not only be assessed purely in terms carbon sequestration potential. Forests provide a whole range of ecosystem services, many of which can be disturbed by harvest even under ideal harvesting practices [39,40]. When we look at the Old growth forest scenario compared to the Full production scenario, the carbon offset values are relatively close together and do not lead to a decrease in total above-ground forest biomass. This means that the protection of old growth forests has a low impact on overall total carbon offsets. Forest conservation must also be maintained due to regulation, e.g., Natura 2000. The areas protected under Natura 2000 already contain a substantial amount of forest area, although Natura 2000 primarily focuses on: “Non-intervention management on primary forests and forests with a high degree of naturalness” [41]. This is a much stricter definition than the one held to in this study. However, for the study area, these results show that protecting all forests older than 120 years only has a small effect on carbon offsets as compared to the most optimal Full production scenario, even though these cover 13.8% of the total forest area.
Moving forward, policy makers and forest managers could pre-define forest stands for protection that focuses on areas with low potential for timber production but high biodiversity value to balance the needs for carbon sequestration and other ecosystem services of forests. This would protect biodiversity while keeping the impact on total timber production low. Protecting old growth forests is already a measure requested by conservationists due to their high biodiversity value [42,43], thus making this scenario a win/win situation. For this approach to work, not only does it require smart area selection methods but also the aforementioned shift in forest management, focusing on maximizing substitution effects through the smart utilization of wood.
In the short term, taking into account the different trade-offs of forest carbon storage vs. timber utilization would help to find the management options with the highest overall carbon effects. Nevertheless, more mid- and long-term policy is required to fully implement lasting changes to forest management strategies. Firstly, standards and/or guidelines need to be created to help managers to decide if a forest should be managed for carbon sequestration or timber production. Secondly, policy must reflect that forests provide multiple other functions besides carbon offsets. This includes the socio-economic functions provided by timber production in forest and value adding in timber industries, which is a significant contribution to local economies, especially in rural areas.

Limitations

This study limited variations between scenarios to be able to better distinguish between the effects of the different forest conservation scenarios on carbon offsets. This resulted in the omission of certain variables that are known to have an effect on forest carbon sequestration. Firstly, all scenarios had no change forest area, or tree species composition remains the same. One would expect that in, for instance, a Full production scenario the forest composition would also be changed to better suit production goals. The same is true for the different approaches where conservation is at the forefront, with the replacement of many (non-native) commercial species. Finally, the model could also be improved by adding the impacts of changes in temperature and water availability due to continued climate change. Even though these effects are predicted to have a smaller impact on the study area compared to other areas of Germany, they are still expected to occur. Currently, forest growth is calculated by yield tables, and a correction factor is only applied considering growth over the past 10 years. This makes it then unable to account for changes in climate that will influence the growth rate in the future.

5. Conclusions

In conclusion, the forest sector can decouple forest management from GHG reporting and include all the resulting effects of timber harvest in its various consumer sectors. This new approach can therefore lead to a different cost–benefit analysis for the choice between harvest vs. conservation. This can provide the opportunity to optimize forest management for maximizing total carbon offsets. Not taking these hidden effects into account would be misleading for the total carbon benefits of forests. If applied correctly, this could result in a paradigm shift in forest management to a scenario where biodiversity and carbon neutrality go hand-in-hand.

Author Contributions

Conceptualization, L.M. and M.K.; methodology, L.M. and M.K; software, L.M.; validation, L.M.; formal analysis, L.M.; investigation, L.M.; data curation, L.M.; writing—original draft preparation, L.M.; writing—review and editing, L.M. and M.K.; visualization, L.M.; supervision, M.K.; funding acquisition, M.K. All authors have read and agreed to the published version of the manuscript.

Funding

This research was funded by the Deutsche Forschungsgemeinschaft (DFG, German Research Foundation) under Germany’s Excellence Strategy—EXC 2037 ’CLICCS—Climate, Climatic Change, and Society’—Project Number: 390683824, contribution to the Center for Earth System Research and Sustainability (CEN) of Universität Hamburg.

Institutional Review Board Statement

Not applicable.

Informed Consent Statement

Not applicable.

Data Availability Statement

Model input and output data available at https://doi.org/10.25592/uhhfdm.9769 (accessed on 20 December 2021).

Acknowledgments

We would like to thank Volker Mues for providing and giving an explanation on the operation of the BEKLIFUH model. We would also like to thank Anna-Sophie Romahn for her contribution to the initial data gathering, translation work and formatting model output for statistical analysis.

Conflicts of Interest

The authors declare no conflict of interest. The funders had no role in the design of the study; in the collection, analyses, or interpretation of data; in the writing of the manuscript, or in the decision to publish the results.

Abbreviations

The following abbreviations are used in this manuscript:
HWPHarvested Wood Product
GHGGreen House Gas
NFINational Forest Inventory

References

  1. The European Comission. Communication from the Commission to the European Parliament, the Council, the European Economic and Social Committee and the Committee of the Regions: Stepping up Europe’s 2030 Climate Ambition Investing in a Climate-Neutral Future for the Benefit of Our People. 2020. Available online: https://eur-lex.europa.eu/legal-content/EN/TXT/PDF/?uri=CELEX:52020DC0562&from=EN (accessed on 30 July 2021).
  2. Geden, O.; Schenuit, F. Unconventional Mitigation: Carbon Dioxide Removal as a New Approach in EU Climate Policy. 2020. Available online: https://www.swp-berlin.org/publications/products/research_papers/2020RP08_ClimateMitigation.pdf (accessed on 11 December 2021).
  3. IPCC. Global Warming of 1.5 ° C: An IPCC Special Report on the Impacts of Global Warming of 1.5 ° C above Pre-Industrial Levels and Related Global Greenhouse Gas Emission Pathways, in the Context of Strengthening the Global Response to the Threat of Climate Change, Sustainable Development, and Efforts to Eradicate Poverty; Intergovernmental Panel on Climate Change: Geneva, Switzerland, 2018. [Google Scholar]
  4. Goodale, C.L.; Apps, M.J.; Birdsey, R.A.; Field, C.B.; Heath, L.S.; Houghton, R.A.; Jenkins, J.C.; Kohlmaier, G.H.; Kurz, W.; Liu, S.; et al. Forest carbon sinks in the Northern Hemisphere. Ecol. Appl. 2002, 12, 891–899. [Google Scholar] [CrossRef]
  5. Bellassen, V.; Luyssaert, S. Carbon sequestration: Managing forests in uncertain times. Nat. News 2014, 506, 153. [Google Scholar] [CrossRef] [PubMed] [Green Version]
  6. Dixon, R.K.; Solomon, A.; Brown, S.; Houghton, R.; Trexier, M.; Wisniewski, J. Carbon pools and flux of global forest ecosystems. Science 1994, 263, 185–190. [Google Scholar] [CrossRef] [PubMed]
  7. Barbati, A.; Corona, P.; Marchetti, M. State of Europe’s Forests 2011. Status and trends in Sustainable Forest Management in Europe. In Forest Europe, ENECE, FAO, Annex 1: Pilot Application of the European Forest Types; Ministerial Conference on the Protection of Forests in Europe: Oslo, Norway, 2011; pp. 259–273. [Google Scholar]
  8. Forest Europe. State of Europe’s Forests 2020; Technical Report; Ministerial Conference on the Protection of Forests in Europe: Brussels, Belgium, 2020. [Google Scholar]
  9. IPCC. 2006 IPCC Guidelines for National Greenhouse Gas Inventories; Institute for Global Environmental Strategies: Hayama, Japan, 2006. [Google Scholar]
  10. UNFCCC. The Paris Agreement. 2015. Available online: https://unfccc.int/files/meetings/paris_nov_2015/application/pdf/paris_agreement_english_.pdf (accessed on 15 October 2021).
  11. Alexandrov, G.A. Carbon stock growth in a forest stand: The power of age. Carbon Balance Manag. 2007, 2, 1–5. [Google Scholar] [CrossRef] [Green Version]
  12. Pretzsch, H. Forest dynamics, growth, and yield. In Forest Dynamics, Growth and Yield; Springer: Berlin/Heidelberg, Germany, 2009; pp. 1–39. [Google Scholar]
  13. Besnard, S.; Carvalhais, N.; Arain, M.A.; Black, A.; De Bruin, S.; Buchmann, N.; Cescatti, A.; Chen, J.; Clevers, J.G.; Desai, A.R.; et al. Quantifying the effect of forest age in annual net forest carbon balance. Environ. Res. Lett. 2018, 13, 124018. [Google Scholar] [CrossRef] [Green Version]
  14. Gundersen, P.; Thybring, E.E.; Nord-Larsen, T.; Vesterdal, L.; Nadelhoffer, K.J.; Johannsen, V.K. Old-growth forest carbon sinks overestimated. Nature 2021, 591, E21–E23. [Google Scholar] [CrossRef]
  15. Johnston, C.M.; Radeloff, V.C. Global mitigation potential of carbon stored in harvested wood products. Proc. Natl. Acad. Sci. USA 2019, 116, 14526–14531. [Google Scholar] [CrossRef] [Green Version]
  16. Gustavsson, L.; Sathre, R. Variability in energy and carbon dioxide balances of wood and concrete building materials. Build. Environ. 2006, 41, 940–951. [Google Scholar] [CrossRef]
  17. Scharai-Rad, M.; Welling, J. Environmental and energy balances of wood products and substitutes. In Environmental and Energy Balances of Wood Products and Substitutes; FAO: Rome, Italy, 2002. [Google Scholar]
  18. Sathre, R.; O’Connor, J. Meta-analysis of greenhouse gas displacement factors of wood product substitution. Environ. Sci. Policy 2010, 13, 104–114. [Google Scholar] [CrossRef]
  19. Wolf, C.; Klein, D.; Richter, K.; Weber-Blaschke, G. Mitigating environmental impacts through the energetic use of wood: Regional displacement factors generated by means of substituting non-wood heating systems. Sci. Total. Environ. 2016, 569, 395–403. [Google Scholar] [CrossRef]
  20. Bundesministerium für Ernährung und Landwirtschaft. In Klima Schützen. Werte Schaffen. Ressourcen Effizient Nutzen; Technical Report; Bundesministerium für Ernährung und Landwirtschaft: Berlin, Germany, 2021.
  21. Scarlat, N.; Dallemand, J.; Taylor, N.; Banja, M.; Sanchez Lopez, J.; Avraamides, M. Brief on Biomass for Energy in the European Union; Publications Office of the European Union: Luxembourg, 2019. [Google Scholar]
  22. European Commission, A. Clean Planet for all: A European strategic long-term vision for a prosperous, modern, competitive and climate neutral economy. In COM (2018) 773-Communication from the Commission to the European Parliament, the European Council, the Council, the European Economic and Social Committee, the Committee of the Regions and the European Investment Bank; The European Commission: Brussels, Belgium, 2018. [Google Scholar]
  23. Köhl, M.; Ehrhart, H.P.; Knauf, M.; Neupane, P.R. A viable indicator approach for assessing sustainable forest management in terms of carbon emissions and removals. Ecol. Indic. 2020, 111, 106057. [Google Scholar] [CrossRef]
  24. Ontl, T.A.; Janowiak, M.K.; Swanston, C.W.; Daley, J.; Handler, S.; Cornett, M.; Hagenbuch, S.; Handrick, C.; McCarthy, L.; Patch, N. Forest management for carbon sequestration and climate adaptation. J. For. 2020, 118, 86–101. [Google Scholar] [CrossRef] [Green Version]
  25. Bottalico, F.; Pesola, L.; Vizzarri, M.; Antonello, L.; Barbati, A.; Chirici, G.; Corona, P.; Cullotta, S.; Garfì, V.; Giannico, V.; et al. Modeling the influence of alternative forest management scenarios on wood production and carbon storage: A case study in the Mediterranean region. Environ. Res. 2016, 144, 72–87. [Google Scholar] [CrossRef] [PubMed] [Green Version]
  26. Keleş, S.; Başkent, E. Modelling and analyzing timber production and carbon sequestration values of forest ecosystems: A case study. Pol. J. Environ. Stud. 2007, 16, 473–479. [Google Scholar]
  27. Neilson, E.; MacLean, D.; Arp, P.; Meng, F.R.; Bourque, C.P.; Bhatti, J. Modeling carbon sequestration with CO2Fix and a timber supply model for use in forest management planning. Can. J. Soil Sci. 2006, 86, 219–233. [Google Scholar] [CrossRef]
  28. Bösch, M.; Elsasser, P.; Rock, J.; Rüter, S.; Weimar, H.; Dieter, M. Costs and carbon sequestration potential of alternative forest management measures in Germany. For. Policy Econ. 2017, 78, 88–97. [Google Scholar] [CrossRef]
  29. Profft, I.; Mund, M.; Weber, G.E.; Weller, E.; Schulze, E.D. Forest management and carbon sequestration in wood products. Eur. J. For. Res. 2009, 128, 399–413. [Google Scholar] [CrossRef] [Green Version]
  30. Masera, O.R.; Garza-Caligaris, J.; Kanninen, M.; Karjalainen, T.; Liski, J.; Nabuurs, G.; Pussinen, A.; de Jong, B.H.; Mohren, G. Modeling carbon sequestration in afforestation, agroforestry and forest management projects: The CO2FIX V. 2 approach. Ecol. Model. 2003, 164, 177–199. [Google Scholar] [CrossRef]
  31. Cintas, O.; Berndes, G.; Hansson, J.; Poudel, B.C.; Bergh, J.; Börjesson, P.; Egnell, G.; Lundmark, T.; Nordin, A. The potential role of forest management in Swedish scenarios towards climate neutrality by mid century. For. Ecol. Manag. 2017, 383, 73–84. [Google Scholar] [CrossRef]
  32. Eriksson, E.; Gillespie, A.R.; Gustavsson, L.; Langvall, O.; Olsson, M.; Sathre, R.; Stendahl, J. Integrated carbon analysis of forest management practices and wood substitution. Can. J. For. Res. 2007, 37, 671–681. [Google Scholar] [CrossRef]
  33. Knauf, M.; Köhl, M.; Mues, V.; Olschofsky, K.; Frühwald, A. Modeling the CO 2-effects of forest management and wood usage on a regional basis. Carbon Balance Manag. 2015, 10, 1–12. [Google Scholar] [CrossRef] [PubMed] [Green Version]
  34. Riedel, T.; Hennig, P.; Kroiher, F.; Polley, H.; Schmitz, F.; Schwitzgebel, F. Die Dritte Bundeswaldinventur (BWI 2012). Inventur- und Auswertemethoden; Bundesministerium für Ernährung und Landwirtschaft: Berlin, Germany, Ed.; Johann Heinrich von Thünen Institute: Eberswalde, Germany, 2017; p. 124. [Google Scholar]
  35. Friedrich, S.; Knauf, M. Holzbilanzen als Informationsquelle zur Holzverwendung auf Bundeslandebene am Beispiel der bayerischen Holzmarktbilanz. Forstarchiv 2016, 87, 79–85. [Google Scholar]
  36. Stammer, D.; Engels, A.; Marotzke, J.; Gresse, E.; Hedemann, C.; Petzold, J. Hamburg Climate Futures Outlook 2021: Assessing the Plausibility of Deep Decarbonization by 2050; University of Hamburg: Hamburg, Germany, 2021. [Google Scholar]
  37. IEA. Is Carbon Capture Too Expensive?—Analysis. 2021. Available online: https://www.iea.org/commentaries/is-carbon-capture-too-expensive (accessed on 28 January 2022).
  38. Köhl, M.; Linser, S.; Prins, K.; Talarczyk, A. The EU climate package “Fit for 55”—A double-edged sword for Europeans and their forests and timber industry. For. Policy Econ. 2021, 132, 102596. [Google Scholar] [CrossRef]
  39. Thiffault, E.; Hannam, K.D.; Paré, D.; Titus, B.D.; Hazlett, P.W.; Maynard, D.G.; Brais, S. Effects of forest biomass harvesting on soil productivity in boreal and temperate forests—A review. Environ. Rev. 2011, 19, 278–309. [Google Scholar] [CrossRef]
  40. de Jong, J.; Akselsson, C.; Egnell, G.; Löfgren, S.; Olsson, B.A. Realizing the energy potential of forest biomass in Sweden–How much is environmentally sustainable? For. Ecol. Manag. 2017, 383, 3–16. [Google Scholar] [CrossRef] [Green Version]
  41. Kremer, F.; Vand der Stegen, J.; Gomez-Zamalloa, M.; Szedlak, T. Natura 2000 and Forests. Part I-II; Technical Report, European Commission; Publications Office of the European Union: Luxembourg, 2015. [Google Scholar]
  42. Humphrey, J. Benefits to biodiversity from developing old-growth conditions in British upland spruce plantations: A review and recommendations. Forestry 2005, 78, 33–53. [Google Scholar] [CrossRef]
  43. Nagel, T.A.; Zenner, E.K.; Brang, P. Research in old-growth forests and forest reserves: Implications for integrated forest management. In Integrative Approaches as an Opportunity for the Conservation of Forest Biodiversity; European Forest Institute: Freiburg, Germany, 2013; pp. 44–50. [Google Scholar]
Figure 1. The age class distribution of all combined tree species at the start of the model run (2013) and in intervals for each of the six management scenarios. Age classes are divided in periods of 20 years. (Age class 1 = 0–20 years, Age class 2 = 2–40 years etc.).
Sustainability 14 02088 g001
Figure 2. Cumulative carbon offsets of the six management scenarios in Mt C from 2013 until 2100 when looking at (a) above-ground forest carbon, (b) total forest carbon and HWPs, (c) total forest carbon, HWPs and material substitution, and (d) total forest carbon, HWPs, material and energetic substitution.
Sustainability 14 02088 g002
Table 1. German districts belonging to the Hamburg metropolitan area, with their corresponding forest area and number of sample points.
DistrictsForest Area (ha)Sample Point AmountArea Weight
Ludwigslust133,8917361.819
Nordwestmecklenburg28,4582321.227
Uelzen48,6981303.746
Stade9078442.063
Heidekreis60,4952562.363
Roteburg (Wümme)34,3841911.800
Lüneburg42,887944.562
Lüchow-Danennberg45,2611373.304
Harburg480759.614
Stormarn10,4951080.972
Steinburg9880801.235
Segeberg23,3232021.155
Pinneberg5855481.220
Ostholstein14,1581311.081
Hertzogtum Lauenburg32,4063211.081
Dithmarschen5306401.327
Lübeck3092251.237
Table 2. Mean, minimum and maximum stock increment in m3 per ha for the six species classes Beech (Be), Oak (OA), Poplar (PO), Spruce (SP), Pine (PI) and Douglas (DG).
ValueBEOAPOSPPIDG
Mean10.78.86.715.79.917.2
Min10.25.56.415.28.515.8
Max10.29.47.116.911.019.6
Table 3. Proportion of each basic scenario in the six combination scenarios. * Due to model input limitations or the old growth forest scenario, the data set had to be separated by age class. For forests older than 120 years, 100% conservation was selected; for the rest of the forest area, there was a three-way equal division between the three other basic scenarios.
ScenarioMass OptimizationValue MaximizationMaximum StorageNon-Utilization
Full production33.3%33.3%33.3%0%
National biodiversity31.6%31.6%31.6%5%
EU biodiversity30%30%30%10%
Maximum biodiversity protection20%20%20%40%
Full conservation0%0%0%100%
Old growth forest conservation28.7% *28.7% *28.7% *13.8% *
Table 4. View of the 16 wood-use products classes vs. the products they substitute with corresponding substitution factor in ton C per ton C.
Wood Use vs. Substitute ProductsSF (tC/tC)
Roudwood (poles, fences, buildings)
vs. steel, concrete aluminum
2.40
Softwood lumber, sawn, wet for packaging concrete shuttering
vs. plastics
1.80
Softwood lumber, planned and dried for building Purposes
vs. concrete, steel, bricks
1.40
Softwood-based glued timber products (glue-lam, CLT)
vs. steel, concrete, bricks
1.30
Plywood, also overlaid
vs. aluminum profiles, glass fiber plastic
1.62
Wood based panels such as particleboard, MDF, OSB (for walls, ceilings, roofs)
vs. gypsum board, plaster, concrete, brick-type walls
1.10
DIY products such as lumber, panels, profile boards
vs. mineral based products, plastic based panels, aluminum sheets
1.35
Wooden flooring (one layer, multi-layers), laminate flooring
vs. ceramic tiles, plastic flooring, wall-to-wall carpet
1.62
Doors (interior, exterior)—only framing/construction
vs. steel, aluminum, PVC
1.62
Wooden window frames
vs. PVC, aluminum
1.62
Wooden furniture (solid wood)
vs. glass, plastic, metal
1.62
Wooden furniture (panel based)
vs. glass, plastic, metal
1.42
Wooden kitchen furniture
vs. glass plastic, metal
1.62
Other wooden furniture (example: upholstery)
vs. glass, plastics, metal
1.62
Wooden based packaging
vs. plastic, metal
1.32
Wooden transportation products
vs. plastic, metal
1.62
Note: Adapted from Knauf et al. [33]. Copyright 2015 by Knauf et al. Reprinted with permission.
Publisher’s Note: MDPI stays neutral with regard to jurisdictional claims in published maps and institutional affiliations.

