Article

Determinants of Customer Intentions to Use Electric Vehicle in Indonesia: An Integrated Model Analysis

by
Indra Gunawan
1,
Anak Agung Ngurah Perwira Redi
1,
Ahmad Arif Santosa
1,
Meilinda Fitriani Nur Maghfiroh
2,*,
Andante Hadi Pandyaswargo
3 and
Adji Candra Kurniawan
4
1
Industrial Engineering Department, BINUS Graduate Program-Master of Industrial Engineering, Bina Nusantara University, Jakarta 11480, Indonesia
2
Industrial Engineering Department, Universitas Islam Indonesia, Yogyakarta 55584, Indonesia
3
Environmental Research Institute, Waseda University, Shinjuku-ku, Tokyo 162-0042, Japan
4
Logistics Engineering Major, Universitas Pertamina, Jakarta 12220, Indonesia
*
Author to whom correspondence should be addressed.
Sustainability 2022, 14(4), 1972; https://doi.org/10.3390/su14041972
Submission received: 12 January 2022 / Revised: 26 January 2022 / Accepted: 5 February 2022 / Published: 9 February 2022
(This article belongs to the Special Issue Sustainability and Consumer Behaviour)

Abstract

:
Electric vehicles can be a solution to certain social problems in Indonesia, such as pollution and an increase in consumption of energy from fossil fuels, which cannot be met by domestic production. The discussion of the TPB theoretical model, UTAUT2, and risk perception, using the structural equation modeling (SEM) method, in this study aims to provide an overview of the factors that drive interest in adopting electric vehicles in Indonesia. Data were collected from 526 respondents in various cities located in Indonesia. The results showed that the model can estimate the study variables adequately. The constructs of TPB such as attitude toward use (ATU), subjective norm (SBN), and perceived behavior control (PBC) positively affect interest in using electric vehicles. Meanwhile, ATU is influenced by performance and effort expectancies, hedonic motivation, price value, as well as functional, financial, and social risks. Another factor, known as PBC, is influenced by certain facilitating conditions. The ATU factor is the most influential on the use of electric vehicles, therefore factors such as performance expectancy, effort expectancy, hedonic motivation, price value, functional risk, financial risk, and social risk need to be properly analyzed.

1. Introduction

The aim of technological development, such as that of electric vehicles, is to solve emerging social and transportation problems [1], as well as reduce pollution levels [2]. As the country with the fourth highest population density in the world [3], Indonesia has experienced a rise in population of 1.25% [4] with a 6.13% increase in number of vehicles per year [5]. The transportation sector, particularly motor vehicles, is the second-largest contributor to air pollution in Indonesia [6], so attention needs to be paid to this significant rise in usage. In large cities such as Medan, Surabaya, and Jakarta, vehicles contribute more than 50% of air pollution [7]. This makes the level of air quality poor because it cannot meet the threshold standards set by the WHO and is capable of reducing the average life expectancy of Indonesians by 1.2 years [8]. Air pollution due to an increase in the number of vehicles can also cause various disorders in the human respiratory system [9].
Over the last decade, there has been an 8.6% annual increase in the consumption of fossil fuels by the transportation sector [10]. According to PWC [11], more than 17,000 L of fuel is consumed by vehicles every minute, whose pollution is emitted into the environment [11]. Before 2004, Indonesia was able to meet domestic fuel needs by oil and gas exploration and production activities. However, in subsequent years, the amount of domestic consumption increased compared to total production, which led to the importation of fuel products [11]. This process will increase the burden of state finances when carried out over time. According to Bank Indonesia data collected from 2008–2019, the government’s average burden of fuel subsidies was 9.67% [12], unhealthy for state finances [13].
An alternative method to overcome these problems is that of educating users of oil-fueled vehicles to switch to electric motorized ones [6], which are economical, consume lower energy [14], and create a pollution-free environment [15]. The availability of nickel ore processing plants in Indonesia makes the government optimistic about becoming a producer of electric motorized vehicles [16]. In addition, the government issued Presidential Regulation 55 in 2019, which contains a legal umbrella over the electric vehicle program [17]. The regulation stated that buyers of electric motorized vehicles, such as cars and motorcycles, are subject to Tax incentives on Transfer of Names for Motorized Vehicles (BBN-KB). The Indonesian government gives approximately 75% discount to electric motorcycle owners in order to stimulate peoples’ willingness to switch, buy and use electric vehicles [18].
Some e-hailing services, such as Grab Indonesia and Gojek, also participate in the green road map by adopting electric motorized vehicles to be rented by their drivers [6]. This move paved the way for electric motorized vehicles to gain wider public recognition and an entry point for commercialization [19]. Grab Indonesia also worked with KYMCO to provide a fleet of electric-based vehicles and battery exchange support facilities supported by PLN (Indonesia’s State Electricity Company, Jakarta Selatan, Indonesia) [20]. Besides Jakarta, Bali is one of the few provinces with a progressive provincial policy to accelerate the use of electric motorized vehicles due to the need for a sustainable green transportation system. Toyota Indonesia has joined the EV ecotourism project proposed by the government by providing 30 environmentally friendly cars, including 20 Toyota COMSs (BEV), five Toyota C+pods (BEV), and five Toyota Prius PHEVs [21].
The use of electric vehicles in Indonesia has become important after the emergence of various environmental issues due to a high number of motorized two-wheeled vehicle users, thereby causing pollution that is harmful to health, climate change, global warming, and scarcity regarding Indonesia’s oil resources. The various initiatives carried out by the current government are expected to stimulate vehicle users to switch to, buy and use electric vehicles. However, it is important to know people’s preferences or expectations regarding electric vehicles, considering that these products are new in Indonesia. Consumers consider at least four factors in assessing electric vehicles, namely price, maintenance, durability, and supporting infrastructure [18]. Skepticism toward the Indonesian electric vehicle program still occurs due to perceptions of the limited mileage factor for batteries [2], the unavailability of public electric charging stations (SPLU), production costs, and prolonged charging time compared to using conventional oil-fueled vehicles [22]. Nevertheless, Indonesia’s high number of users is a parameter showing that demand for vehicles is still high. Therefore, the government is optimistic that the Indonesian market will gradually accept electric vehicles.
Behavior related to interest in using a product can be predicted through attitudes, subjective norms (SBN), and perceived behavioral control (PBC), as stated in the Theory of Planned Behavior (TPB) [23,24]. Another factor capable of influencing individual interest in adopting new technology is the ease of use or positive consequences, and the perceived usefulness/benefit of the technology [25]. This approach is referred to as TAM (Theory of Acceptance Model), which was employed by Venkatesh et al. [26] with UTAUT (Unified Theory of Acceptance and Use of Technology). The UTAUT model raises performance expectancy and social influence factors as variables capable of influencing behavioral interest in adopting new technology and associated facilitating conditions. Furthermore, the UTAUT model was developed into UTAUT2 by adding hedonic motivation, price value, and habit variables considered capable of influencing interest in adopting technology, and finally, the decision to adopt/use new technology [27]. In the UTAUT2, TAM, and TPB models, the risk perception factor is capable of influencing decision-making behavior in adopting or using a technology [28,29], in which the perception of risk of physical harm/injury, financial loss, adverse effect on the social environment, and the loss of time are individual considerations in adopting or using a technology [30,31].
UTAUT2 and TPB integration study models designed to predict technology adoption behavior were developed by Yuen et al. [32]. These show that the TPB model consisting of variables in attitude, perceived norm and behavioral control plays an important role in stimulating technology adoption behavior. Meanwhile, the UTAUT2 model comprises variables in performance and effort expectancies, habit, price value, individual hedonic behavior, and conditions capable of influencing perceived behavioral control. Lee [33] integrated the TAM and TPB models, with perceived risk variables consisting of security, performance, financial, social, and time risk dimensions capable of influencing individual behavior in adopting technology.
UTAUT2, perceived risk, and TPB are important variables in predicting technology adoption behavior; unfortunately, few studies have integrated these three variables to predict interest in technology adoption. Therefore, based on Yuen et al. [27] and Lee [28], this study integrates these three variables to predict technology adoption behavior and discuss the factors capable of influencing the interest of Indonesian people in using electric vehicles, use the UTAUT2 approach, perceived risk, and TPB. This study aims to contribute to the following knowledge areas:
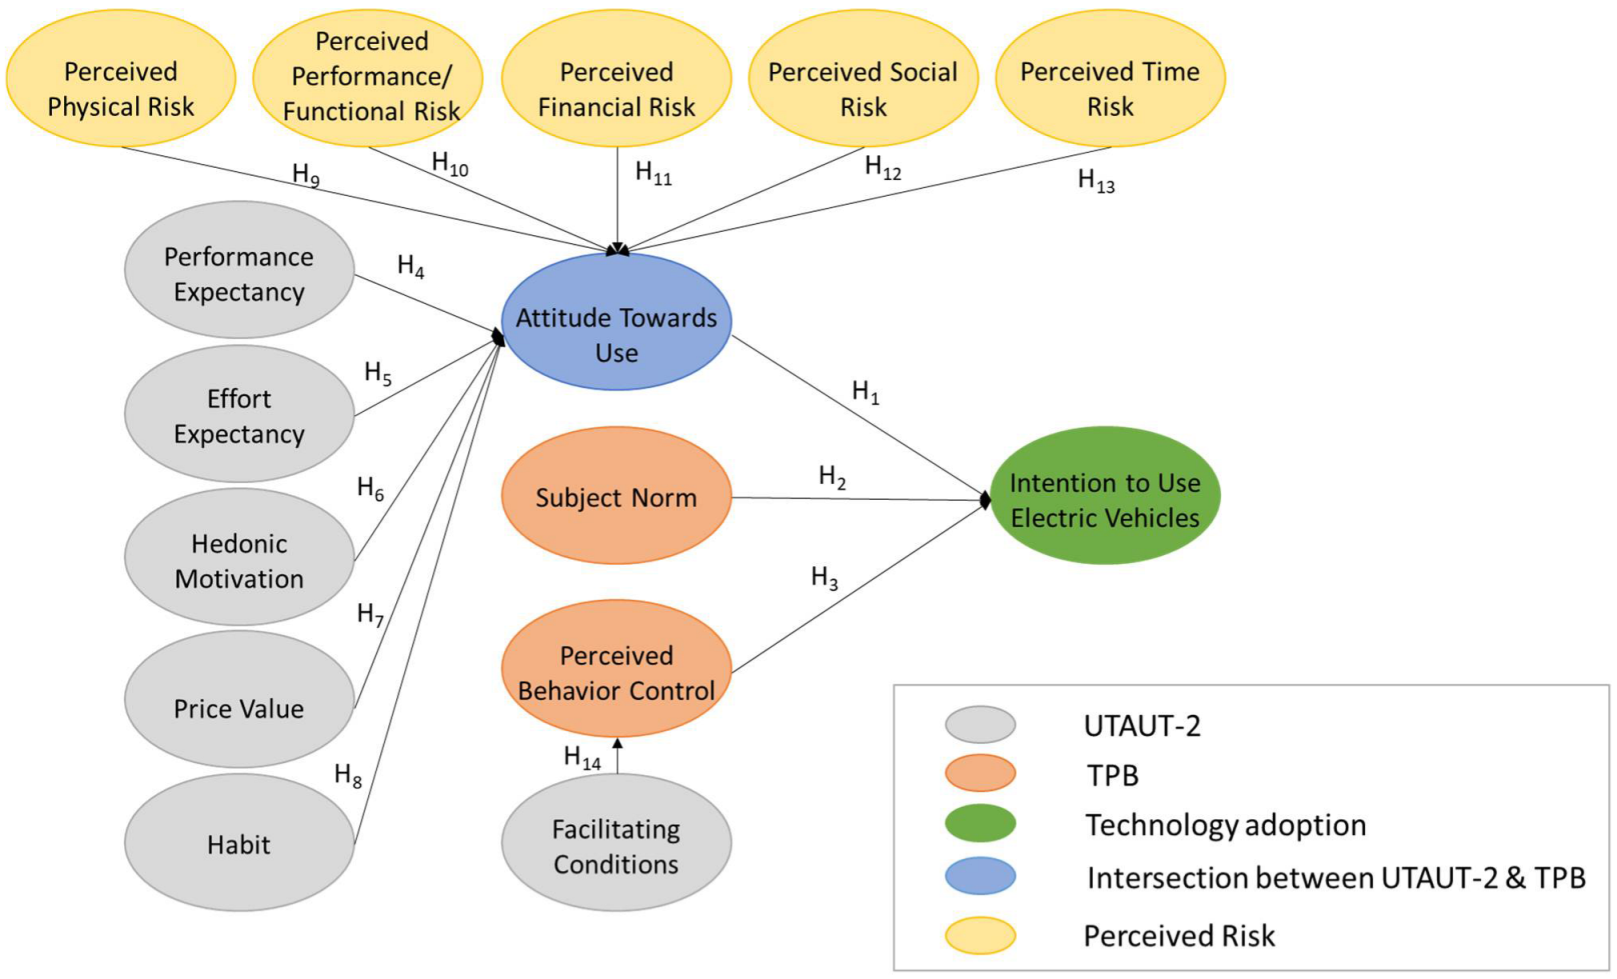
  • Development of an integration model for UTAUT2, perceived risk, and TPB in predicting interest in adopting electric vehicles in Indonesia.
  • The role of TPB in influencing individual interest in using electric vehicles and Attitude Toward Use (ATU) and Perceived Behavior Control (PBC), which function as mediator variables.
  • The role of UTAUT2 and perceived risk in influencing the TPB model.
Furthermore, the study is arranged as follows. Section 2 analyzes the theoretical approach, the model framework, and the hypotheses. Section 3 describes the method used, such as the process of preparing the instrument for questioning the UTAUT2, perceived risk, and TPB variables. Section 4 describes the results regarding data processing and hypothesis testing. Section 5 concludes the study by confirming the theory used.

2. Conceptual Framework

2.1. Literature Review on Electric Vehicle Purchase Intention

The use of electric vehicles has significantly increased in the last decade [34]. Several studies on customers’ intentions to purchase electric vehicles have been conducted to achieve varying results depending on the location. Tu and Yang’s [35] study in China shows that consumers control the resources required to purchase electric vehicles. Other factors, such as environmental awareness, technological benefit, and availability of the products, affect peoples’ purchasing intention. Another study conducted in China revealed that price negatively impacts purchase intention, which is positively affected by social influence, environmental concern, self-esteem, and openness [36]. In India, the predictor variables of attitude, perceived usefulness, ease of use, and risk influence purchase intention for electric vehicles, with the moderation of financial incentives policy [37].
According to the study by Asadi et al. [38], in Malaysia perceived value, attitude, the ascription of responsibility, SBN, personal norms, perceived consumer effectiveness, and awareness of consequences affected consumers’ purchase intention positively. This is in line with Afroz et al. [39], in which consumers with high environmental awareness are likely to purchase electric vehicles. A comparative study of China, Russia, and Brazil shows different purchase intention factors [40]. For instance, in Russia and China, personal factors drive purchase intentions. In Brazil, charging infrastructure and purchasing price are bigger than socio-demographic factors. However, these three countries show that environmental awareness positivity affects the customers’ purchase intention. A study in Portugal revealed that age, knowledge, and perceived symbolic value of the electric car positively affect consumers’ purchase intention. On the other hand, social and financial risk avoidance, perceived symbolic value of the electric car, and the number of cars per family show a negative affect [41].
Consumers’ intentions towards the electric vehicle purchase are a mixture of demographic, situational, contextual, and psychological factors. According to [42,43,44,45,46,47,48], psychological factors and demographic profiles have a positive impact on EV purchase intention. Situational and contextual factors are more dependent on consumers’ willingness to change, utility, and public acceptance [49,50,51,52], along with attitude, PBC, and perceived risk [36,37].

2.2. Theories, Models, and Hypotheses

There are several types of electric vehicle, namely hybrid electric vehicles (HEVs), plug-in hybrid electric vehicles (PHEVs), battery electric vehicles (BEVs), and fuel cell electric vehicles (FCEVs). The theoretical approach in this study uses the integration of UTAUT2 theory, risk perception, and TPB to predict interest in adopting electric vehicles in Indonesia. The process of evaluating consumers based on benefits obtained, environmental influences [53], experiences, knowledge, and previous historical learning [54] has a close relationship with the conception of interest that leads to the behavior of technology adoption [24,26].
In the conceptual model formed, TPB, consisting of ATU, SBN, and PBC, is used to directly predict interest in adoption behavior [24], thereby making the variables good mediators in increasing interest in technology adoption. The UTAUT2 model comprising performance and effort expectancies, habit, price value, and hedonic motivation affects attitudes, while facilitating conditions affect PBC [32]. According to [30,31], the perceived risk model consists of physical, performance/functional, financial, social, and time risk, which play a significant role in influencing changes in individual behavior in adopting technology [30,31]. Figure 1 shows the conceptual study model.

2.2.1. Determinants of Interest in Using Electric Vehicles

The TPB approach discusses individual behavior based on logical judgments and information analysis results to reduce negative consequences due to poor decisions [55]. The discussion in the first model explains the relevance of TPB, consisting of three variable constructs, namely attitude toward behavior, SBN, and PBC [24], which are used to predict interest in using electric vehicles. This theoretical construct can predict interest in adopting technology [56].
The first factor determining interest in using electric vehicles is the attitude toward behavior. The theoretical concept of this factor speaks of an individual’s evaluation of the behavior, which does not have a negative impact [23]. This means that the higher the positive assessment of a product or service, the stronger the urge to take certain actions that lead to the adoption of the product or service [55]. The feeling of liking, comfort, and happiness while reflecting on a product or service leads to adoption behavior [26]. Urgency, perception of the best choice, and support for useful actions are attributes of attitude toward behavior considered capable of influencing individual interest in adopting technology [44]. Therefore, the hypothesis formed is as follows:
Hypothesis 1
(H1). Attitude Toward Use (ATU) positively affects an interest in using electric vehicles in Indonesia.
The second factor considered to affect interest in using electric vehicles in Indonesia is SBN. This factor is associated with the emergence of social pressure while performing a certain behavior [23]. This means that the greater the social pressure that arises in formal or non-formal legal consequences from the government and the surrounding environment, such as close and influential people, the higher the possibility of a person performing certain behaviors [57]. Support and encouragement from family, close friends, coworkers, and media propaganda as attributes of SBN [44] contributed positively to the adoption of a technology [32]. Based on this, the hypothesis is formed as follows:
Hypothesis 2
(H2). Subjective Norm (SBN) has a positive effect on interest in using electric vehicles in Indonesia.
The third factor of the TPB model is PBC, which has an effect on interest in the adoption of electric vehicles in Indonesia. The theoretical concept of this factor evaluates the perception of the level of difficulty or convenience felt by individuals as a reflection of their past experiences while adopting or using a technology, product or service [23]. This indicates that the higher the individual’s confidence in controlling certain situations supported by the availability of resources and opportunities, the higher the perceived ability to control these behaviors [23,55]. Individual interest in using a technology is influenced by beliefs, resource capabilities, and opportunities [32]. Based on this, the following hypothesis was formed:
Hypothesis 3
(H3). Perceived Behavior Control (PBC) positively affects interest in using electric vehicles in Indonesia.

2.2.2. ATU Determinants of Electric Vehicles

This section discusses two models that influence ATU of electric vehicles. The first are the 5 UTAUT2 variables, namely performance expectancy model, effort expectancy, hedonic motivation, price value, and habit, in influencing ATU, divided into hypotheses 4–8 (H4–H8). The second model is the role of perceived risk, which consists of components of physical, performance/functional, financial, social, and time risk in influencing ATU of electric vehicles in Indonesia, divided into hypotheses 10–14 (H10–H14). The UTAUT2 model developed by Venkatesh et al. [27] was formed to measure the interest that directs behavior towards the use of technology, based on 6 variables, namely performance and effort expectancies, hedonic motivation, price value, habit, and facilitating conditions. Yuen et al. [32] integrated the UTAUT2 and TPB models to predict interest in adopting technology. Meanwhile, Lee [33] integrated the model of perceived risk, TAM (Theory Acceptance Model), and TPB to predict interest in adopting technology. However, this study aims to combine the two concepts in the perceived risk model, UTAUT2 and TPB, to predict interest in adopting electric vehicles.
In the first model, the measurement considered to affect the attitude toward the use of electric vehicles is the perception of performance. The attitudes that underlie individuals’ like or dislike of something are based on performance appraisals of an object. This means that the better the performance of an object, the higher the individual’s positive preference [23,55,58]. Individuals with the belief that technological performance provides benefits for their lives provide positive attitudes which encourage others to use the product [32]. Based on this, the following hypothesis was formed:
Hypothesis 4
(H4). Performance Expectancy (PE) positively affects attitudes toward the use of electric vehicles in Indonesia.
The second measurement is the contribution of effort expectancy to attitude toward the use of electric vehicles. The definition of the concept of effort expectancy theory talks about the effort needed to master or become skilled while using a technology [26]. This approach is similar to the theory of perceived ease of use developed by Davis in 1989 regarding the extent to which individuals believe that using technology does not require high effort [25]. However, the concept of UTAUT2 theory was developed from TAM. The ease of using technology leads to a positive attitude [58], low complexity, and feelings of comfort and pleasure [32]. Based on this, the following hypothesis was formed:
Hypothesis 5
(H5). Effort Expectancy (EE) positively affects attitudes toward use (ATU) of electric vehicles in Indonesia.
The third measurement is the contribution of hedonic motivation to ATU of electric vehicles. Hedonic motivation concerns the pleasure or happiness felt while using a technology [27]. Individuals who have the perception that using technology will make them feel happy will be more attached to it and tend to ignore rationality factors [27]. Psychological drives such as satisfaction, pride, emotions, and other subjective feelings are factors that give rise to this motivation [59]. This indicates that the higher the individual’s hedonic motivation, the higher the positive assessment of the use of technology [32,60]. This led to the following hypothesis:
Hypothesis 6
(H6). Hedonic Motivation (HM) positively affects attitudes toward use (ATU) of electric vehicles in Indonesia.
The fourth measurement concerns the price value of ATU of electric vehicles from the consumer’s perspective [61]. The costs incurred and the perceived benefits are evaluated while adopting technology. Supposing the benefit/value obtained from technology is high. If it exceeds the individual expectation, then the value of the appropriate product is likely to be higher, thereby achieving various satisfaction rates [27]. Negative perceptions of the price of a product leads to individual distrust and low interest in usage [62]. Meanwhile, a positive attitude is portrayed by individuals that feel the product has an advantage in terms of price [32]. Based on this, the following hypothesis was formed:
Hypothesis 7
(H7). Price Value (PV) has a positive effect on attitudes toward use (ATU) of electric vehicles in Indonesia.
The fifth measurement concerns the influence of habits on ATU of electric vehicles. Habit is defined as previous behavior naturally repeated due to previous experiences learned by individuals regarding various factors, which become preferences because they are considered useful [27]. However, previous behavior, often carried out, is not directly able to control the performance of future habits, because these are formed from the evaluation process and considered important and useful [63], capable of predicting future behavior [64]. The study conducted by Yuen et al. [32] shows that habits formed due to the developed technology positively affect attitudes. The concept of habit based on Venkatesh et al. [27] is aimed at respondents with experience using the internet. The concept of habit tested in this study is related to habits in the past that impact future decisions. Certain technologies, such as conventional oil-fueled vehicles, lead to a positive and inverse assessment. Therefore, the indicator will be formed with negative questions, and then a reverse score assessment process will be carried out in processing the data to test the consistency of the respondents’ answers. Based on this, the following hypothesis was formed:
Hypothesis 8
(H8). Habit (HB) has a positive effect on attitudes toward the use of electric vehicles in Indonesia.
The second model concerns perceived risk, which is considered to affect ATU. The perception of risk is related to choices and decision-making in which there are uncertain conditions on the final outcome and consequences [65]. Risk is also related to matters relating to potential losses, costs, and benefits in uncertain and unknown situations [66]. At the beginning of its development, perceived risk consists of two dimensions, namely uncertainty and negative potential (losses) [30]. Over time, this develops dimensions including performance, social, physical, financial, psychological, psychosocial, and time risk [67]. However, this study analyzes the dimensions of physical, performance/functional, financial, social, and time risk influential ATU of electric vehicles [30,31].
The first measurement concerns the perceived physical risk attitude toward the use of electric vehicles, which can be physically harmful when individuals adopt the technology [30]. This danger is not only to individual adopters but also to families that simultaneously adopt the technology [31]. Perceptions of physical harm from innovation lead to negative attitudes toward the product, which results in individuals being resistant and even reluctant towards its adaptation [68]. The safety factor influences consumer attitudes [69,70]. This means that the higher the perception of physical and health hazards that arises from adoption behavior, the lower the individual’s positive assessment [31,71]. Based on this, the following hypothesis was formed:
Hypothesis 9
(H9). Perceived Physical Risk (PPR) has a negative effect on attitudes toward use (ATU) of electric vehicles in Indonesia.
The second measurement concerns perceived performance/functional risk in ATU of electric vehicles. Performance uncertainty raises the functional risk, which deals with the perception that product innovations may not fully function properly after passing through the trial stage [68]. This indicates a risk of failure of the product and service that allows for consumer dissatisfaction [30]. The belief that the product has passed various tests leads to a positive attitude toward it [72], while the reverse is negative [31]. Consumers are sometimes reluctant to adapt to a technology, specifically those with a high potential risk of performance failure [73]. Based on this, the following hypothesis was formed:
Hypothesis 10
(H10). Perceived Performance/Functional Risk (PFR) has a negative effect on attitudes toward use (ATU) of electric vehicles in Indonesia.
The third measurement is of perceived financial risk in ATU of electric vehicles. Financial risk is defined as the possibility that consumers will experience losses because they pay higher than the actual price needed to obtain the product [74]. In other words, consumers are at risk of not obtaining maximum financial benefits while buying products/services [30]. This occurs because there is uncertainty related to an innovative product, which is considered new; therefore, consumers do not have sufficient knowledge on its current or future price, investment feasibility, or operational costs [73]. Clarity on the financial burden that individuals sometimes incur while adopting technologies such as electric vehicles raises consumers’ positive perspectives [75]. Sensitivity to price changes and fears about future cost increases lead to negative attitudes regarding adopting technologies such as electric vehicles [31]. Based on this, the following hypothesis was formed:
Hypothesis 11
(H11). Perceived Financial Risk (PFIN) has a negative effect on attitudes toward use (ATU) of electric vehicles in Indonesia.
The fourth measurement concerns the effect of perceived social risk on ATU of electric vehicles. Social risk refers to the possibility of a person obtaining negative judgments [30], loss of social relationships, and social discomfort [74] due to the behavior/choices they make [65]. In this context, the environment significantly contributes to the behavior and choices of individuals. Social values obtained from the views and opinions of other people are considered important because leaders and experts increase individual confidence in making choices [76]. In certain products such as electric vehicles, the perceived level of social risk pressure is higher [72] because they are products with a fairly high price qualification. However, individuals are likely to reject and show negative attitudes toward product innovations due to the risk of experiencing social exclusion or negative responses from the surrounding environment, such as family, friends, and coworkers [68]. Negative response from the environment to an innovative product such as an electric vehicle leads potential consumers to react negatively to the product. Based on this, the following hypothesis was formed:
Hypothesis 12
(H12). Perceived Social Risk (PSR) has a negative effect on attitudes toward use (ATU) of electric vehicles in Indonesia.
The fifth measurement is of perceived time risk and its effect on ATU of electric vehicles by individuals, to determine lost time [48]. This is in addition to futile efforts to make them uncomfortable while making decisions about buying or adopting products and services [30]. Individuals concerned with adopting innovative technology, such as electric vehicles, need long investment and high costs to affect attitudes to the product and to delay adoption [73] negatively. The risk perception of wasting time, effort, and the emergence of discomfort while using the product makes individuals have a negative attitude toward the product [77]. Furthermore, new products, such as consumer electric vehicles, may require more time and cost sacrifices than conventional ones [31]. Based on this, the following hypothesis was formed:
Hypothesis 13
(H13). Perceived Time Risk (PTR) has a negative effect on attitudes toward the use of electric vehicles in Indonesia.

2.2.3. PBC Determinants of Electric Vehicles

This study discusses the role of facilitating conditions on PBC using objective factors, such as the external environment and the availability of resources that allow an action to be carried out more easily [78,79]. Venkatesh et al. [26] stated that facilitating conditions affect the extent to which individuals believe that infrastructure, technical support, and other facilities are available when they adopt or use technology, products, and services. Individuals with a feeling of control over the environment because of conditions and the availability of supporting facilities foster positive attitudes and perceptions towards the adoption of a technology [80]. The availability of facilities increases PBC by shaping preferences for ability and willingness to adopt technology [32]. Based on this, the following hypothesis was formed:
Hypothesis 14
(H14). Facilitating Conditions (FCs) positively affect the perceived behavior control (PBC) of electric vehicles in Indonesia.

3. Methodology

The model constructs shown in Figure 1 were conducted using an integrated approach to UTAUT2 (performance and effort expectancies, habit, price value, hedonic motivation), perceived risk (physical risk, performance/functional risk, financial risk, social risk, and time) and TPB (ATU, SBN, and PBC). The next subchapter explains the sample, variable concept and measurement and prepares the study instruments and methods.

3.1. Sample and Sampling Technique

The minimum number of samples in this study was determined by multiplying the number of questions by five [81] to obtain 360 respondents (72 question indicators x 5). The purposive sampling judgment technique was used, which requires the respondent to be at least 17 years old and above before using a vehicle and obtaining a license in Indonesia. A total of 526 data samples were collected from 15 major cities in Indonesia, namely Jakarta, Surabaya, Medan, Bekasi, Bandung, Makassar, Depok, Tangerang, Palembang, Bandar Lampung, Batam, Bogor, Padang, Pekanbaru, and Malang, from July 2021 to December 2021 using Google forms in the Indonesian language.

3.2. Measurement and Variable Concept

This study consists of 15 latent variables, which can only be measured directly using two or more study instruments. The endogenous or dependent latent variables used act as mediators towards use and PBC. Meanwhile, exogenous or independent variables are subjective norms consisting of the UTAUT2 model, performance and effort expectancies, hedonic motivation, price value, habit, and facilitating conditions. Others include perceived risk models, namely physical, performance/functional, financial, social, and time risk.

3.3. Questionnaire Design

The questionnaire model is divided into three parts. The first analyzed the aims and objectives of the study for the respondents, and the second gathered their demographic data. The third is the question instrument regarding the study variable intention to use five question indicators. These include ATU (five question indicators), PBC (five question indicators), SBN (five question indicators), performance expectancy (four question indicators), and effort expectancy (fur question indicators). Others are hedonic motivation (six question indicators), price value (four question indicators), habit (four question indicators), facilitating condition (six question indicators), physical risk (five question indicators), performance/functional risk (five question indicators), financial risk (six question indicators), social risk (fur question indicators), and time risk (fur question indicators), thereby culminating in 72 items. A Likert scale of 1–5 was used in this study, where a score of 1 and 5 denotes the opinion of “strongly disagree” and “strongly agree.”
The questionnaire operability can be found in Table 1 below. Numerous questions on construct indicators were reconstructed from the original sources in order that Indonesian respondents could understand them easily. Furthermore, four indicators were used to eliminate the model testing process. The reverse score during data processing was applied to variables with negative questions (-), as shown in Appendix A.

3.4. Demographic Data

Table 2 shows the characteristics of 526 respondents used. The frequency distribution based on gender was relatively balanced, with 51% males and 49% females. The highest age range was 26–34 years (36.5%), followed by 17–25 years (35.2%), 35–43 years (24%), and over 44 years (4.4%). Married respondents were 63.9%, unmarried is 35.9%, while the remaining 0.2% are divorced. The highest education levels were Bachelor’s Degree (66.5%), Senior High School (23.4%), other D1–D3 39 (7.4%), Master’s Degree (2.3%), Doctoral Degree (0.2%), and Junior High School (0.2%).
Approximately 59.9% earned between IDR 5–15 million (59.9%), 31.6% below IDR 5 million (31.6%), and the remaining 8.5% above IDR 15 million. The domicile of the respondents varied, with 33.1% living in Jakarta, and the rest scattered in other cities. Conventional vehicle users accounted for 93.7%, while 6.3% did not use this type of car. Meanwhile, based on knowledge, 81.6% of respondents knew about electric vehicles, as opposed to the remaining 18.4%.

3.5. Analysis Technique

Path analysis in this study uses the Structural Equation Model (SEM) approach consisting of two basic components. The first is a structural model that connects the path of influence between independent and dependent variables, while the second is a measurement model that allows the use of several indicators to measure independent, dependent, and SEM variables simultaneously. Therefore, estimation of a separate regression model can be considered accurate [82].
This model must meet various assumptions, including validity testing with the recommended loading factor (λ) at a value of ≥0.7 (within range 0.4 to 0.95) for each study instrument [82]. The reliability testing has recommended minimum and maximum CR (composite reliability) values of 0.6 and 0.95 (0.6 ≤ CR ≤ 0.95). This is in addition to the minimum and maximum AVE (average variance extracted) value of 0.5 [83] and 0.90 (0.5 ≤ AVE ≤ 0.90). In addition, the model fit assumptions that need to be met using the SEM approach include the values of GFI, AGFI ≥ 0.80 [84,85,86,87,88,89], RMSEA ≤ 0.07, CFI ≥ 0.90 [82], TLI ≥ 0.90 [86], and CMIN/DF ≥ 3 [87,90].

4. Results

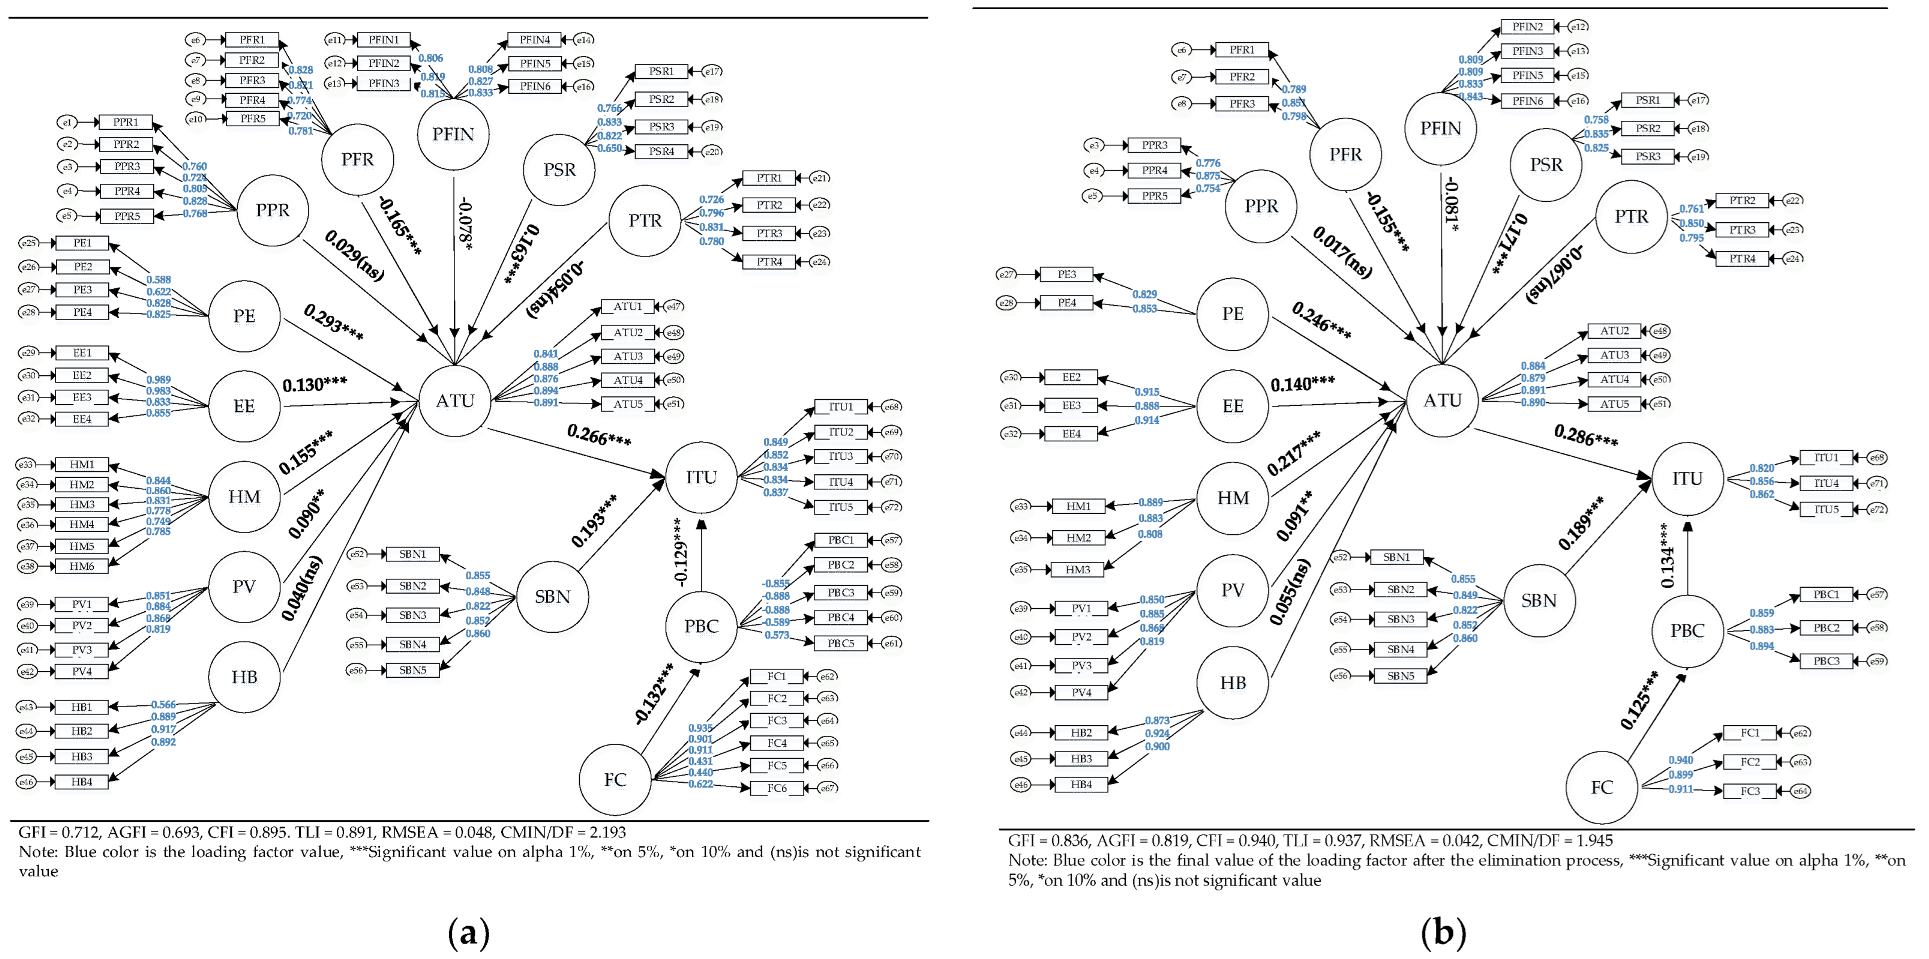
4.1. Measurement Model Results

In SEM testing, the measurement model must be able to meet the minimum standards set theoretically. The measurement model was used to test the study’s validation instrument using a loading factor (λ) assessment ranging from 0.4–0.7 [82], while still considering the adequacy of the question instrument. The next step is to analyze the suitability of CR and AVE standards to determine the reliability of the study data. The process is shown in Table 3.
As shown in Table 2, the data elimination process was carried out with 23 stages on 23 study instruments considered to have a loading factor (λ) lower and higher than the predetermined value. Meanwhile, data elimination was in the range of values that met the standards as in ATU1, HM4, HM5, HM6, ITU2, ITU3, PFIN1, PFIN4, PFR4, PFR5, PPR1, PPR2, and PTR4, conducted to obtain a good model fit value by eliminating the lowest loading factor (λ) for each variable on changes in the CR and AVE values. The data elimination process is quite accurate because it was conducted using the direct loading factor (λ), CR, and AVE values to meet the recommended validity and reliability standards. These increased the value of the model fit test (GFI = 0.712 → 0.836; AGFI = 0.693 → 0.819; CFI = 0.895 → 0.940; TLI = 0.891 → 0.937; RMSEA = 0.048 → 0.042, CMIN/DF = 2.193 → 1.945) to meet the standard set value as shown in Figure 2.
Therefore, the total study instrument used in this study is 49 indicators. All of these instruments are declared suitable for use and capable of being parameters for the variables they represent. Therefore, the model is considered quite good in estimating changes in the dependent variable with the intention to use electric vehicles because it has fulfilled the assumption value in the model fit.

4.2. Structural Model Results

The structural model explains the ability of the independent variable to estimate the dependent based on the hypothesis formed. This analysis was performed to fulfill the measurement model assumptions, namely validity, reliability, and model fit, to ensure the variables are properly estimated. An independent variable is considered capable of estimating the dependent assuming that the statistical significance value (p-value) is lower than the study error tolerance (alpha 10%, 5%, or 1%) [82]. Figure 2 shows that most of the independent variables are able to predict/affect changes in the dependent as opposed to others.

4.2.1. Hypothesis Test Results’ Predictors of Interest in Using Electric Vehicles

The results showed that ATU positively affected interest in using electric vehicles in Indonesia (β = 0.286, p = 0.000). This supports the studies conducted by Yuen et al. [32], Huang and Ge [44], Sanayei and Bahmani [69], and Lee [33], stating that electric vehicles provide many positive benefits, such as a decrease in air pollution levels. This means that the higher the public awareness of the positive benefits obtained using electric vehicles, the higher the incentive to use electric vehicles in the future. These variables have the highest influence compared to the subjective norm and facilitating condition variables, therefore their role makes a very important contribution to stimulus for the use of electric vehicles in Indonesia.
The use of electric vehicles is also influenced by SBNs (β = 0.189, p = 0.000), which are the second-largest explanatory variable considered to have a positive effect on peoples’ interest its usage. These results are in accordance with the studies by Yuen et al. [32], Huang and Ge [44], Safeena et al. [91], Sanaeyi and Bahmani [69], and Lee [33]. According to these, the higher the social pressure from the individual’s environment to use electric vehicles, the greater their interest in usage in the future. Social pressure in this respect does not refer to coercive pressure, but rather to the psychological influence caused by the environment on the adoption of electric vehicles, such as family, friends, workplace, and invitations through advertisements or gratuities. Furthermore, incentives are provided to create social pressure on individuals to try and adopt electric vehicles.
PBC positively affects the interest in adopting electric vehicles (β = 0.134, p = 0.005). These results support the studies by Yuen et al. [32], Huang and Ge [44], Safeena et al. [91], Sanaeyi and Bahmani [69], and Lee [33]. According to them, the higher the individuals’ beliefs in an electric vehicle, the higher their interest in adopting and using it appropriately. Individuals with high control over their financial circumstances may have a positive attitude to buying and using electric vehicles in the future.

4.2.2. The Results of Hypothesis Testing Predictors of ATU of Electric Vehicles

Performance expectancy (PE) has a positive effect on ATU of electric vehicles (β = 0.246, p = 0.000). These results are in accordance with the studies by Yuen et al. [32], Thomas et al. [58], and Venkatesh et al. [26,27]. They stated that the better the individual’s assessment of the performance of electric vehicles, the greater the benefits. Individuals perceive that the use of electric vehicles tends to save costs and increase work productivity, thereby increasing positive perceptions of the product.
Effort expectancy (EE) positively affects attitudes toward the use of electric vehicles (β = 0.140, p = 0.002). These results support the studies by Yuen et al. [32], Thomas et al. [58], Venkatesh et al. [26,27], and Lee [33]. According to them, those who feel that electric vehicles are easy to understand, learn about and benefit from, thereby adopt positive perceptions to their adaptation in Indonesia.
Hedonic motivation (HM) positively affects ATU of electric vehicles (β = 0.217, p = 0.000). These results are consistent with the studies by Yuen et al. [32] and Le Roux and Maree [60]. The higher the perception of happiness and pleasure obtained while using electric vehicles, the greater the positive assessment. Individuals with a perception of obtaining pleasure and comfort while using these products tend to have a positive attitude, which promotes future use.
Price value (PV) positively affects ATU of electric vehicles (β = 0.091, p = 0.042, sig. at 5%). These results are consistent with the study by Yuen et al. [32], stating that an increase in positive perception of the value of electric vehicles leads to a higher assessment of usage. Furthermore, individuals with a belief that the price of electric vehicles is directly proportional to the quality of the product tend to behave positively and support the electric vehicle acceleration program, thereby generating interest in use in the future.
Habit (HB) positively affects attitudes toward the use of electric vehicles at an insignificant level (β = 0.055, p = 0.217). These results are not consistent with the study by Yuen et al. [32] but support the theory of Ajzen [63], which explains why past behavior does not directly control future behavior.
Perceived physical risk (PPR) has no negative effect on ATU of electric vehicles (β = 0.017, p = 0.725). The results of this study contradict the studies by Choi et al. [71] and Sanayei and Bahmani [69] but are consistent with Majali’s [31]. Perceptions of physical hazards while using electric vehicles do not lead individuals to perceive electric vehicles negatively.
Perceived performance/functional risk (PFR) has a negative effect on ATU of electric vehicles (β = −0.155, p = 0.002). These results are consistent with the studies by Majali [31] and Sanayei and Bahmani [69], stating that the higher the possibility of functional risk arising in electric vehicles, the lower the individual’s positive perception of electric vehicles. Therefore, those who feel electric vehicles are likely to have problems with the battery, maintenance, and other constraints tend to have a negative attitude and are reluctant in adapting to usage.
Perceived financial risk (PFN) has a negative effect on ATU of electric vehicles (β = −0.081, p = −0.080, sig. at 10%). These results are consistent with the studies by Majali [31] and Sanayei and Bahmani [69], stating that the higher the potential for financial loss, the more negative an individual’s assessment of electric vehicles. For instance, those who think that purchase will cause an increase in financial burdens, such as electricity, maintenance costs, and purchase of spare batteries, tend to have a negative attitude towards purchasing and using electric vehicles.
Perceived social risk (PSR) positively affects ATU of electric vehicles (β = 0.171, p = 0.000). This contradicts the study by Majali [31] and Sanayei and Bahmani [69], which stated that the higher the social pressure to use electric vehicles, the greater the positive evaluation of electric vehicles. Therefore, individuals resistant to the pressures of the social environment, such as family and work environment, tend to be confident and possess a more positive attitude toward electric vehicles.
Perceived time risk (PTR) has a negative effect on ATU of electric vehicles at an insignificant level (β = −0.067, p = 0.156). These results are inconsistent with the studies by Majali [31] and Sanayei and Bahmani [69], stating that perceptions of the possibility of individuals losing time while buying and using electric vehicles do not lead to negative evaluations of electric vehicles.

4.2.3. Hypothesis Test Results Predictors of PBC of Electric Vehicles

Facilitating condition (FC) positively affects PBC of electric vehicles (β = 0.125, p = 0.008). These results are in accordance with the studies conducted by Yuen et al. [32], Kumi et al. [80], and Teo [79], stating that the higher the availability of adequate facilities for electric vehicles, the greater the confidence. Individuals who feel that the government is working hard to prepare infrastructure and various incentives while buying and using electric vehicles are more confident adapting to usage.

5. Discussion

The theoretical integration approach of TPB, UTAUT-2, and risk perception in this study aims to determine the effect of theoretical constructs on interest in using electric vehicles. Figure 2 shows that the TPB model can adequately predict interest in using electric vehicles in Indonesia. Interest in using electric vehicles can be estimated by ATU, influenced by the UTAUT2 and perceived risk models. This illustrates that individual positive assessments influence interest in using electric vehicles and ratings of the products influenced by perceptions of performance and effort expectancies, hedonic motivation, price value, functional risk, financial risk, and social risk. Therefore, changes in the assessment of this factor directly or indirectly impact individual interest. Another factor of the TPB model considered to influence users’ interest in using electric vehicles is the SBN and PBC, which are influenced by the facilitating condition. The TPB, UTAUT2, and perceived risk constructs can be well integrated into predicting interest in using electric vehicles. However, the habit factors, perceived physical, and time risk in the UTAUT2 are not able to estimate this factor on the ATU of electric vehicles.
This study contributes to Indonesia’s policyholders and business actors within the electric vehicle automotive industry. The sensitivity of the positive assessment of the Indonesian people toward this product is influenced by perceptions and judgments on risk, therefore education, publication, and proper introduction must be increased by policymakers and automotive industry players. An understanding of the benefits of adopting and using electric vehicles and the consequences and losses that potential consumers can avoid must be communicated properly through the media. Education and provision of information need to be continuously carried out in public areas. The government must also be able to provide supporting facilities such as independent and public electric charging stations.
This study provides new insights into the development model of Yuen et al. (2020) integrated with the theoretical construct of risk perception. It is also beneficial in providing benefits for knowledge development, but with some weaknesses in its theoretical construction. Therefore, the model validation needs to be retested with a wider area and larger sample to ensure it is more valid and can be generalized. The respondents used in this study are not focused on users of electric vehicles, due to the small population of owners. Further study needs to be conducted using a wider sample of electric vehicle users to determine habit constructs, perceived time and physical risk accurately. The financial risk factors and price value have similar constructs, therefore further study is recommended to combine them.

6. Conclusions

The highly urgent shift from conventional vehicles to electric vehicles must be carried out in Indonesia as part of its green roadmap. This study was conducted to understand the factors that encourage consumers to purchase and use electric vehicles in Indonesia. Quantitative causality methods using the Structural Equation Modeling approach are expected to provide a complete picture of the factors affecting consumers use of electric vehicles. This study also provides a new approach that merges the use of TPB, UTAUT-2, and Perceived Risk models.
The result indicates that predictors for intention to use electric vehicles, including Attitude Toward Use (ATU), Subjective Norm (SN), and Perceived Behavioral Control (PBC), can assist prediction of interest in using electric vehicles in Indonesia. The model constructed in this research examines the effect of the risk perception variable on attitudes toward use of electric vehicles. The results of this study indicate that only perceived functional risk and financial risk factors have a negative effect on the attitude toward the use of electric vehicles, while the perceived physical risk, time risk, and social risk factors contradict the results of previous studies.
However, some inconsistency with the results of previous studies calls for further research to find discrepancies in the results of this study. The use of control variables such as demographic data in the modeling of future research is likely to provide a better representation in order to deal with the inconsistency of the results of this study.

Author Contributions

Conceptualization, I.G., A.A.N.P.R., A.A.S., M.F.N.M.; software, I.G., A.A.N.P.R., A.A.S.; validation, I.G., A.A.N.P.R., A.A.S., M.F.N.M., A.H.P., A.C.K.; formal analysis, I.G., A.A.N.P.R., A.A.S.; investigation,; I.G., A.A.N.P.R., A.A.S.; resources, I.G., A.A.N.P.R., A.A.S.; data curation, I.G., A.A.N.P.R., A.A.S.; writing—original draft preparation, I.G., A.A.N.P.R., A.A.S., M.F.N.M.; writing—review and editing, M.F.N.M., A.H.P., A.C.K.; visualization, I.G., A.A.N.P.R., A.A.S., M.F.N.M.; supervision, A.A.N.P.R., M.F.N.M., A.H.P.; project administration, A.A.N.P.R., M.F.N.M.; funding acquisition, M.F.N.M., A.H.P. All authors have read and agreed to the published version of the manuscript.

Funding

This research was funded by the Japan Society for the Promotion of Science (JSPS) Grants-in-Aid for Scientific Research (Kakenhi), Grant Number 21K17930.

Institutional Review Board Statement

Not applicable.

Informed Consent Statement

Informed consent was obtained from all subjects involved in the study.

Acknowledgments

The authors are grateful to the respondents that answered the online questionnaire.

Conflicts of Interest

The authors declare no conflict of interest.

Appendix A

Table A1. Questionnaire Construct, Measurement, and Sources.
ConstructItemMeasurementSources
Attitude Toward Use
(ATU)
ATU1Using electric vehicles is an important thing.[44]

[33]

[32]
ATU2Using an electric vehicle might be a good idea.
ATU3By buying and using an electric vehicle, I can play an active role in supporting the government’s electric vehicle acceleration program.
ATU4I think the program to accelerate the procurement of electric vehicles is a positive/beneficial thing.
ATU5I’m happy if in the end, the electric vehicle I buy can reduce pollution.
Subjective Norm
(SBN)
SBN1If my family and relatives had bought and used an electric vehicle, maybe I would too.[44]
SBN2Maybe I will be interested in using an electric vehicle if my close friends recommend it.
SBN3Advertisements about electric vehicles in various media can promote me to buy and use electric vehicles.
SBN4The tax incentives offered by the government (free transfer fees for electric vehicles) made me interested in using electric vehicles.
SBN5If the environment I work in uses electric vehicles, I might as well use them.
Perceived Behavioral Control
(PBC)
PBC1I have the freedom to decide, whether to electric vehicle or not.

[44]

[32]
PBC2I have the financial ability to buy an electric vehicle in the future.
PBC3If I want it, I can definitely buy and use an electric vehicle for my next vehicle purchase.
PBC4I have knowledge of how to use electric vehicles.
PBC5In the future, I am pessimistic about being able to buy an electric vehicle. (-)
Intention To Use
(ITU)
ITU1I would consider buying and using an electric vehicle.[27]
[44]
[33]
ITU2I have plans to try buying and using an electric vehicle.
ITU3I will buy and recommend electric vehicles to colleagues, friends and family.
ITU4I look forward to the introduction of various electric vehicle brands on the market.
ITU5I imagine that in the future I will buy and use electric vehicles.
Performance Expectancy
(PE)
PE1Using an electric vehicle for daily activities may be helpful in my work.[27]
PE2Using electric vehicles for daily activities may be more friendly to the environment.
PE3Using electric vehicles for daily activities may save expenses/costs.
PE4Using electric vehicles for daily activities may increase my work productivity.
Effort Expectancy
(EE)
EE1It was easy for me to learn how to use an electric vehicle.
[27]

EE2I understand and can use electric vehicles.
EE3I think it is easy to use electric vehicles.
EE4Becoming skilled and proficient in using electric vehicles is not difficult for me.
Facilitating Condition
(FC)
FC1The Indonesian government is actively setting up facilities for selling electric vehicles.
[27]


[32]
FC2The Indonesian government is actively setting up public electric refueling facilities.
FC3The Indonesian government is actively offering incentives to increase electric power for electric vehicle owners.
FC4Advances in technology, make me feel safe using electric vehicles.
FC5How to use electric vehicles, not much different from other conventional vehicles.
FC6There is a help center that can be contacted in case of problems with electric vehicles.
Hedonic Motivation
(HM)
HM1Using an electric vehicle appears to be it would be fun.[27]
HM2Using an electric vehicle seems to make me more comfortable.
HM3Using an electric vehicle seems to make me even more proud.
HM4As long as an electric vehicle can make me comfortable when used, maybe I will buy it even though it is expensive.
HM5Using electric vehicles seems to improve my social status.
HM6I would be proud if I was one of the first people to buy and use an electric vehicle.
Price Value
(PV)
PV1The price of electric vehicles today is quite affordable and reasonable.[27]
PV2The price paid may be in accordance with the electric vehicle that I will get.
PV3The current price of electric vehicles is the price with the best offer.
PV4With the current quality of electric vehicles, it is quite natural that they are relatively expensive.
Habit
(H)
HB1Using conventional oil-fueled vehicles has become a habit for me. (-)

[27]


HB2It seems it is difficult for me to switch to using electric vehicles. (-)
HB3My habit of using conventional oil-fueled vehicles makes it impossible for me to switch to using electric vehicles. (-)
HB4It is impossible for me to use an electric vehicle because it is tied to a conventional oil-fueled vehicle. (-)
Perceived Physical Risk
(PPR)
PPR1The inaudible sound of an electric vehicle’s engine can increase the risk of an accident. (-)[31]


[73]
PPR2I might have a hard time finding a charging station for an electric vehicle. (-)
PPR3Electric vehicle batteries have the potential to explode while charging. (-)
PPR4I’m afraid it will explode when the electric vehicle battery reaches too high a temperature. (-)
PPR5Electric vehicles may experience a power failure (turn off) during a flood. (-)
Perceived Functional Risk
(PFR)
PFR1Electric vehicle batteries will experience a decrease in performance (mileage). (-)[31]
PFR2I may find it difficult to maintain an electric vehicle. (-)
PFR3I may have problems driving an electric vehicle. (-)
PFR4The power indicator sensor on the mains battery may not show the actual capacity. (-)
PFR5Currently, there may not be many repair shops that can help when problems occur with electric vehicles. (-)
Perceived Financial Risk
(PFIN)
PFIN1At the moment I am not interested in buying an electric vehicle, because in the future the price of electric vehicles may be cheaper. (-)[31]
PFIN2I hesitate to buy an electric vehicle, because it might cause an increase in the electrical load at home. (-)
PFIN3Currently, electric vehicle technology may be difficult for the Indonesian market to accept. (-)
PFIN4I’m hesitant to buy an electric vehicle, because maybe the selling price will drop drastically in the future. (-)
PFIN5While buying an electric vehicle, the maintenance costs may be very expensive. (-)
PFIN6I’m hesitant to buy an electric vehicle, as I might have to buy a spare battery. (-)
Perceived Social Risk
(PSR)
PSR1If I buy an electric vehicle, maybe people around me will judge me as arrogant and showing off. (-)[31]
PSR2My family does not recommend buying an electric vehicle. (-)
PSR3People do not like electric vehicles, and I believe in their opinion. (-)
PSR4If the expert reviews about electric vehicles are negative, I will not buy and use electric vehicles. (-)
Perceived Time Risk
(PTR)
PTR1Recharging process of electric vehicles for a long time, will interfere with my daily activities. (-)[31]
PTR2The process of ordering an electric vehicle may take a long time. (-)
PTR3The process of learning electric vehicles may take quite a long time. (-)
PTR4It takes more effort to understand how electric vehicles work. (-)
Note: the sign (-) is a negative question, while others are positive questions.

References

  1. Oelschlaeger, M.A.X. The Myth of the Technological Fix. Southwest. J. Philos. 2019, 10, 43–53. [Google Scholar] [CrossRef]
  2. Ajanovic, A.; Haas, R. Electric vehicles: Solution or new problem? Environ. Dev. Sustain. 2018, 20, 7–22. [Google Scholar] [CrossRef]
  3. Cilluffo, A.; Ruiz, N.G. World’s population is projected to nearly stop growing by the end of the century. Pew Res. Cent. 2019, 10. Available online: http://www.pewresearch.org/fact-tank/2018/10/19/5-charts-on-global-views-of-china/ (accessed on 30 September 2021).
  4. Indonesian Central Bureau of Statistics. Hasil Sensus Penduduk 2020. Badan Pusat Stat. 2021. Available online: https://www.bps.go.id/pressrelease/2021/01/21/1854/hasil-sensus-penduduk-2020.html (accessed on 10 November 2021).
  5. Indonesian Central Bureau of Statistics. Development of Motor Vehicles by Type 1949–2018. 2018. Available online: https://www.bps.go.id/linkTableDinamis/view/id/1133 (accessed on 30 September 2021).
  6. Maghfiroh, M.F.; Pandyaswargo, A.H.; Onoda, H. Current Readiness Status of Electric Vehicles in Indonesia: Multistakeholder Perceptions. Sustainability 2021, 13, 3177. [Google Scholar] [CrossRef]
  7. Santoso, M.; Lestiani, D.D.; Kurniawati, S.; Damastuti, E.; Kusmartini, I.; Atmodjo, D.P.D.; Sari, D.K.; Hopke, P.K.; Mukhtar, R.; Muhtarom, T.; et al. Assessment of Urban Air Quality in Indonesia. Aerosol Air Qual. Res. 2020, 20, 2142–2158. [Google Scholar] [CrossRef]
  8. Greenstone, M.; Fan, Q. Kualitas Udara Indonesia Yang Memburuk Dan Dampaknya Terhadap Harapan Hidup. 2019. Available online: https://aqli.epic.uchicago.edu/wp-content/uploads/2019/03/Indonesia.Indonesian.pdf (accessed on 30 September 2021).
  9. Zhong, S.; Yu, Z.; Zhu, W. Study of the effects of air pollutants on human health based on baidu indices of disease symptoms and air quality monitoring data in Beijing, China. Int. J. Environ. Res. Public Health 2019, 16, 1014. [Google Scholar] [CrossRef] [Green Version]
  10. Akhmad, A.; Amir, A. Study of fuel oil supply and consumption in indonesia. Int. J. Energy Econ. Policy 2018, 8, 13. [Google Scholar]
  11. PwC. Oil and Gas in Indonesia. Taxation Guide. Jakarta. 2016. Available online: https://www.pwc.com/id/en/energy-utilities-mining/assets/oil-and-gas/oil-gas-guide-2019.pdf (accessed on 10 November 2021).
  12. OECD. Indonesia’s Effort to Phase out and Rationalise Its Fossil-Fuel Subsidies. 2019. Available online: https://www.oecd.org/fossil-fuels/publicationsandfurtherreading/IndonesiaG20Self-ReportIFFS.pdf (accessed on 10 July 2021).
  13. Bank of Indonesia. Statistik Ekonomi dan Keuangan Pemerintah Bank Indonesia. Jakarta. 2020. Available online: https://www.bi.go.id/id/statistik/ekonomi-keuangan/seki/Pages/SEKI-DESEMBER-2021.aspx (accessed on 10 November 2021).
  14. Figenbaum, E.; Kolbenstvedt, M.; Elvebakk, B. Electric Vehicles-Environmental, Economic and Practical Aspects-as Seen by Current and Potential Users TØI Report 1329/2014; Institute of Transport Economics: Oslo, Norway, 2014. [Google Scholar]
  15. Narasipuram, R.P.; Mopidevi, S. A technological overview & design considerations for developing electric vehicle charging stations. J. Energy Storage 2021, 43, 103225. [Google Scholar] [CrossRef]
  16. CNN Indonesia. Indonesia Kaya Nikel, Siap Produksi Baterai Mobil Listrik. CNN Indonesia. 2021. Available online: https://www.cnnindonesia.com/teknologi/20210715150801-384-668217/Indonesia-kaya-nikel-siap-produksi-baterai-mobil-listrik (accessed on 10 August 2021).
  17. President of Republic of Indonesia. Peraturan Presiden Nomor 55 Tahun 2019 tentang Percepatan Program Kendaraan Bermotor Listrik Berbasis Baterai (Battery Electric Vehicle) untuk Transportasi Jalan; Indonesia. 2019. Available online: https://peraturan.bpk.go.id/Home/Details/116973/perpres-no-55-tahun-2019 (accessed on 10 November 2021).
  18. Wirabrata, A. Percepatan Program Kendaraan Bermotor Listrik di Indonesia. Jakarta. 2019. Available online: https://berkas.dpr.go.id/puslit/files/info_singkat/Info%20Singkat-XI-17-I-P3DI-September-2019-226.pdf (accessed on 10 November 2021).
  19. Pandyaswargo, A.H.; Wibowo, A.D.; Maghfiroh, M.F.; Rezqita, A.; Onoda, H. The Emerging Electric Vehicle and Battery Industry in Indonesia: Actions around the Nickel Ore Export Ban and a SWOT Analysis. Batteries 2021, 7, 80. [Google Scholar] [CrossRef]
  20. Grab Indonesia. ESDM, Grab Indonesia dan Kymco Luncurkan SPBKLU untuk Sukseskan Perpres Nomor 55/2019. Grab.com. 2020. Available online: https://www.grab.com/id/press/tech-product/esdm-grab-indonesia-dan-kymco-luncurkan-spbklu-untuk-sukseskan-perpres-nomor-55-2019/ (accessed on 10 July 2021).
  21. Rayhand, P. Dorong Mobil Listrik, Toyota Bikin Ekosistem di Bali. CNN Indonesia. 2020. Available online: https://www.cnnindonesia.com/teknologi/20210331172446-384-624541/dorong-mobil-listrik-toyota-bikin-ekosistem-di-bali (accessed on 10 November 2021).
  22. Subekti, R.A.; Sudibyo, H.; Susanti, V.; Saputra, H.M.; Hartanto, A. Peluang dan Tantangan Pengembangan Mobil Listrik Nasional. LIPI Press, Jakarta. 2014. Available online: http://www.penerbit.lipi.go.id/data/naskah1424760996.pdf (accessed on 10 July 2021).
  23. Ajzen, I. The theory of planned behavior. Organ. Behav. Hum. Decis. Process. 1991, 50, 179–211. [Google Scholar] [CrossRef]
  24. Ajzen, I. Attitude theory and the attitude-behavior relation. In New Directions in Attitude Measurement; Krebs, D., Schmidt, P., Eds.; Walter de Gruyter: Berlin, Germany, 1993; pp. 41–57. [Google Scholar]
  25. Davis, F.D. Perceived Usefulness, Perceived Ease of Use, and User Acceptance of Information Technology. MIS Q. 1989, 13, 319–340. [Google Scholar] [CrossRef] [Green Version]
  26. Venkatesh, V.; Morris, M.G.; Davis, G.B.; Davis, F.D. User Acceptance of Information Technology: Toward a Unified View. MIS Q. 2003, 27, 425–478. [Google Scholar] [CrossRef] [Green Version]
  27. Venkatesh, V.; Thong, J.Y.L.; Xu, X. Consumer Acceptance and Use of Information Technology: Extending the Unified Theory of Acceptance and Use of Technology. MIS Q. 2012, 36, 157–178. [Google Scholar] [CrossRef] [Green Version]
  28. Im, I.; Kim, Y.; Han, H.J. The effects of perceived risk and technology type on users’ acceptance of technologies. Inf. Manag. 2008, 45, 1–9. [Google Scholar] [CrossRef]
  29. Jiang, Q.; Wei, W.; Guan, X.; Yang, D. What Increases Consumers’ Purchase Intention of Battery Electric Vehicles from Chinese Electric Vehicle Start-Ups? Taking NIO as an Example. World Electr. Veh. J. 2021, 12, 71. [Google Scholar] [CrossRef]
  30. Mitchell, V.W. Understanding Consumers’ Behaviour: Can Perceived Risk Theory Help? Manag. Decis. 1992, 30, 26–31. [Google Scholar] [CrossRef]
  31. Al-Majali, M.M. Influence of perceived risk dimensions on consumers’ attitudes towards buying electric vehicles (EVs) in Jordan. Jordan J. Bus. Adm. 2020, 16, 445–472. [Google Scholar] [CrossRef]
  32. Yuen, K.F.; Huyen, D.T.K.; Wang, X.; Qi, G. Factors Influencing the Adoption of Shared Autonomous Vehicles. Int. J. Environ. Res. Public Health 2020, 17, 4868. [Google Scholar] [CrossRef]
  33. Lee, M.C. Factors influencing the adoption of internet banking: An integration of TAM and TPB with perceived risk and perceived benefit. Electron. Commer. Res. Appl. 2009, 8, 130–141. [Google Scholar] [CrossRef]
  34. IEA. Global EV Outlook 2021-Accelerating ambitions despite the pandemic. Glob. EV Outlook 2021, 2021, 16–26. [Google Scholar]
  35. Tu, J.-C.; Yang, C. Key Factors Influencing Consumers’ Purchase of Electric Vehicles. Sustainability 2019, 11, 3963. [Google Scholar] [CrossRef] [Green Version]
  36. Cui, L.; Wang, Y.; Chen, W.; Wen, W.; Han, M.S. Predicting determinants of consumers’ purchase motivation for electric vehicles: An application of Maslow’s hierarchy of needs model. Energy Policy 2021, 151, 112167. [Google Scholar] [CrossRef]
  37. Jaiswal, D.; Kaushal, V.; Kant, R.; Singh, P.K. Consumer adoption intention for electric vehicles: Insights and evidence from Indian sustainable transportation. Technol. Forecast. Soc. Chang. 2021, 173, 121089. [Google Scholar] [CrossRef]
  38. Asadi, S.; Nilashi, M.; Samad, S.; Abdullah, R.; Mahmoud, M.; Alkinani, M.H.; Yadegaridehkordi, E. Factors impacting consumers’ intention toward adoption of electric vehicles in Malaysia. J. Clean. Prod. 2021, 282, 124474. [Google Scholar] [CrossRef]
  39. Afroz, R.; Masud, M.M.; Akhtar, R.; Islam, M.A.; Duasa, J.B. Consumer purchase intention towards environmentally friendly vehicles: An empirical investigation in Kuala Lumpur, Malaysia. Environ. Sci. Pollut. Res. 2015, 22, 16153–16163. [Google Scholar] [CrossRef]
  40. Habich-Sobiegalla, S.; Kostka, G.; Anzinger, N. Electric vehicle purchase intentions of Chinese, Russian and Brazilian citizens: An international comparative study. J. Clean. Prod. 2018, 205, 188–200. [Google Scholar] [CrossRef]
  41. Miranda, J.L.; Delgado, C.J.M. Determinants of Electric Car Purchase Intention in Portugal. In Governance and Sustainability; Crowther, D., Seifi, S., Eds.; Emerald Publishing Limited: Bingley, UK, 2020; Volume 15, pp. 161–172. [Google Scholar]
  42. Kim, J.; Rasouli, S.; Timmermans, H. Expanding scope of hybrid choice models allowing for mixture of social influences and latent attitudes: Application to intended purchase of electric cars. Transp. Res. Part A Policy Pract. 2014, 69, 71–85. [Google Scholar] [CrossRef]
  43. Kim, J.H.; Lee, G.; Park, J.Y.; Hong, J.; Park, J. Consumer intentions to purchase battery electric vehicles in Korea. Energy Policy 2019, 132, 736–743. [Google Scholar] [CrossRef]
  44. Huang, X.; Ge, J. Electric vehicle development in Beijing: An analysis of consumer purchase intention. J. Clean. Prod. 2019, 216, 361–372. [Google Scholar] [CrossRef]
  45. Priessner, A.; Sposato, R.; Hampl, N. Predictors of electric vehicle adoption: An analysis of potential electric vehicle drivers in Austria. Energy Policy 2018, 122, 701–714. [Google Scholar] [CrossRef]
  46. Nayum, A.; Klöckner, C.A.; Mehmetoglu, M. Comparison of socio-psychological characteristics of conventional and battery electric car buyers. Travel Behav. Soc. 2016, 3, 8–20. [Google Scholar] [CrossRef]
  47. Axsen, J.; Goldberg, S.; Bailey, J. How might potential future plug-in electric vehicle buyers differ from current ‘Pioneer’ owners? Transp. Res. Part D Transp. Environ. 2016, 47, 357–370. [Google Scholar] [CrossRef]
  48. Wolf, A.; Seebauer, S. Technology adoption of electric bicycles: A survey among early adopters. Transp. Res. Part A Policy Pract. 2014, 69, 196–211. [Google Scholar] [CrossRef]
  49. Ramos-Real, F.J.; Ramírez-Díaz, A.; Marrero, G.A.; Perez, Y. Willingness to pay for electric vehicles in island regions: The case of Tenerife (Canary Islands). Renew. Sustain. Energy Rev. 2018, 98, 140–149. [Google Scholar] [CrossRef]
  50. Moons, I.; de Pelsmacker, P. Emotions as determinants of electric car usage intention. J. Mark. Manag. 2012, 28, 195–237. [Google Scholar] [CrossRef]
  51. Higgins, C.D.; Mohamed, M.; Ferguson, M.R. Size matters: How vehicle body type affects consumer preferences for electric vehicles. Transp. Res. Part A Policy Pract. 2017, 100, 182–201. [Google Scholar] [CrossRef]
  52. She, Z.-Y.; Sun, Q.; Ma, J.-J.; Xie, B.-C. What are the barriers to widespread adoption of battery electric vehicles? A survey of public perception in Tianjin, China. Transp. Policy 2017, 56, 29–40. [Google Scholar] [CrossRef]
  53. Solomon, M.R. Consumer Behavior: Buying, Having, and Being, 12th ed.; Pearson: Essex, UK, 2017. [Google Scholar]
  54. Foxall, G.R. Consumer behavior analysis. SAGE Handb. Mark. Theory 2009, 1, 299–315. [Google Scholar] [CrossRef]
  55. Ajzen, I. Attitudes, Personality and Behavior, 2nd ed.; Open University Press-MacGraw-Hill Education: Berkshire, UK, 2005. [Google Scholar]
  56. Mathieson, K. Predicting User Intentions: Comparing the TAM with the theory of planned behavior. Inf. Syst. Res. 1991, 2, 91–173. [Google Scholar] [CrossRef]
  57. Fishbein, M.; Ajzen, I. Predicting and Changing Behavior: The Reasoned Action Approach, 1st ed.; Psychology Press: New York, NY, USA, 2009. [Google Scholar]
  58. Troy, T.D.; Lenandlar, S.; Kemual, G. The utility of the UTAUT model in explaining mobile learning adoption in higher education in Guyana. Int. J. Educ. Dev. Using Inf. Commun. Technol. 2013, 9, 71–85. [Google Scholar]
  59. Lestari, D.A.; Tiarawati, M. The Effect of Hedonic Motivation and Consumer Attitudes Towards Purchase Decision on K-Pop CD Albums (Study on KPOPSURABAYA Community). Spirit Soc. J. 2020, 3, 1–7. [Google Scholar] [CrossRef]
  60. Le Roux, I.; Maree, T. Motivation, engagement, attitudes and buying intent of female Facebook users. Acta Commer. 2016, 16, 1–11. [Google Scholar] [CrossRef] [Green Version]
  61. Zeithaml, V.A. Consumer Perceptions of Price, Quality, and Value: A Means-End Model and Synthesis of Evidence. J. Mark. 1988, 52, 2–22. [Google Scholar] [CrossRef]
  62. Jaafar, S.N. Consumers’ Perception s, Attitudes and Purchase Intention towards Private Label Food Products in Malaysia. Asian J. Bus. Manag. Sci. 2012, 2, 73–90. [Google Scholar]
  63. Ajzen, I. Residual Effects of Past on Later Behavior: Habituation and Reasoned Action Perspectives. Personal. Soc. Psychol. Rev. 2002, 6, 107–122. [Google Scholar] [CrossRef]
  64. Verplanken, B.; Aarts, H. Habit, Attitude, and Planned Behaviour: Is Habit an Empty Construct or an Interesting Case of Goal-directed Automaticity? Eur. Rev. Soc. Psychol. 1999, 10, 101–134. [Google Scholar] [CrossRef]
  65. Taylor, J.W. The Role of Risk in Consumer Behavior. J. Mark. 1974, 38, 54–60. [Google Scholar] [CrossRef]
  66. Trimpop, R.M. The Psychology of Risk Taking Behavior, 1st ed.; North Holland: Amsterdam, The Netherlands, 1994. [Google Scholar]
  67. Dowling, G.R. Perceived Risk: The Concept and Its Measurement. Psychol. Mark. 1986, 3, 193–210. Available online: https://doi.org/10.1002/mar.4220030307 (accessed on 10 July 2021). [CrossRef]
  68. Ram, S.; Sheth, J.N. Consumer resistance to innovations: The marketing problem and its solutions. J. Consum. Mark. 1989, 6, 5. [Google Scholar] [CrossRef]
  69. Sanayei, A.; Bahmani, E. Integrating TAM and TPB with perceived risk to measure customers’ acceptance of internet bankinga. Int. J. Inf. Sci. Manag. 2012, 10, 25–37. [Google Scholar]
  70. Piarna, R.; Fathurohman, F.; Purnawan, N.N. Understanding online shopping adoption: The unified theory of acceptance and the use of technology with perceived risk in millennial consumers context. JEMA J. Ilm. Bid. Akunt. Dan Manaj. 2020, 17, 51. [Google Scholar] [CrossRef] [Green Version]
  71. Choi, J.; Lee, A.; Ok, C. The Effects of Consumers’ Perceived Risk and Benefit on Attitude and Behavioral Intention: A Study of Street Food. J. Travel Tour. Mark. 2013, 30, 222–237. [Google Scholar] [CrossRef]
  72. Havlena, W.J.; DeSarbo, W.S. On the Measurement of Perceived Consumer Risk. Decis. Sci. 1991, 22, 927–939. [Google Scholar] [CrossRef] [Green Version]
  73. Bessenbach, N.; Wallrap, S. Why Do Consumers resist buying Electric Vehicles? 2013, p. 137. Available online: http://studenttheses.cbs.dk/bitstream/handle/10417/4329/nadine_bessenbach_og_sebastian_wallrapp.pdf (accessed on 10 November 2021).
  74. Murphy, P.E.; Enis, B.M. Classifying strategically. J. Mark. 1986, 50, 24–42. Available online: http://citeseerx.ist.psu.edu/viewdoc/download?doi=10.1.1.460.1320&rep=rep1&type=pdf (accessed on 30 September 2021). [CrossRef]
  75. Sierzchula, W.; Bakker, S.; Maat, K.; van Wee, B. The influence of financial incentives and other socio-economic factors on electric vehicle adoption. Energy Policy 2014, 68, 183–194. [Google Scholar] [CrossRef]
  76. Moussaïd, M.; Kämmer, J.E.; Analytis, P.P.; Neth, H. Social influence and the collective dynamics of opinion formation. PLoS ONE 2013, 8, e78433. [Google Scholar] [CrossRef] [Green Version]
  77. Ariff, M.S.M.; Sylvester, M.; Zakuan, N.; Ismail, K.; Ali, M.K. Consumer perceived risk, attitude and online shopping behaviour; Empirical evidence from Malaysia. IOP Conf. Ser. Mater. Sci. Eng. 2014, 58, 012007. [Google Scholar] [CrossRef]
  78. Thompson, R.L.; Higgins, C.A.; Howell, J.M. Influence of experience on personal computer utilization: Testing a conceptual model. J. Manag. Inf. Syst. 1994, 11, 167–187. [Google Scholar] [CrossRef]
  79. Teo, T. The impact of subjective norm and facilitating conditions on pre-service teachers’ attitude toward computer use: A structural equation modeling of an extended technology acceptance model. J. Educ. Comput. Res. 2009, 40, 89–109. [Google Scholar] [CrossRef]
  80. Kumi, R.; Reychav, I.; Sabherwal, R. The impact of facilitating conditions on anxiety, attitude, self-efficacy, and performance: Insights from an empirical study of iPad adoption. In Proceedings of the AIS SIGED IAIM 2012 Conference, Orlando, FL, USA, 14–16 December 2012. [Google Scholar]
  81. Hair, J.F.; Celsi, M.; Ortinau, D.J.; Bush, R.P. Essentials of Marketing Research, 4th ed.; McGraw-Hill/Irwin: New York, NY, USA, 2017. [Google Scholar]
  82. Hair, J.F.; Black, W.C.; Babin, B.J.; Anderson, R.E. Multivariate Data Analysis, 7th ed.; Pearson Education: Essex, UK, 2010. [Google Scholar]
  83. Hair, J.E.; Hult, G.T.M.; Ringle, C.M.; Sarstedt, M. A Primer on Partial Least Squares Structural Equation Modeling (PLS-SEM); SAGE: Southend Oaks, CA, USA, 2014. [Google Scholar]
  84. Doll, W.J.; Xia, W.; Torkzadeh, G. A Confirmatory Factor Analysis of the End-User Computing Satisfaction Instrument. MIS Q. 1994, 18, 453–461. [Google Scholar] [CrossRef]
  85. Baumgartner, H.; Homburg, C. Applications of structural equation modeling in marketing and consumer research: A review. Int. J. Res. Mark. 1996, 13, 139–161. [Google Scholar] [CrossRef] [Green Version]
  86. Cheng, S.-I. Comparisons of Competing Models between Attitudinal Loyalty and Behavioral Loyalty Assistant Professor Department of Business Administration. Int. J. Bus. Soc. Sci. 2011, 2, 149–166. [Google Scholar]
  87. Nikkhah, M.; Heravi-Karimooi, M.; Montazeri, A.; Rejeh, N.; Nia, H.S. Psychometric properties the Iranian version of Older People’s Quality Of Life questionnaire (OPQOL). Health Qual. Life Outcomes 2018, 16, 1–10. [Google Scholar] [CrossRef] [PubMed] [Green Version]
  88. Putra, D.; Yasri, Y.; Masdupi, E. The Effect of Marketing Mix to Increase the Satisfaction of Magister Management Students in Universitas Negeri Padang. In Proceedings of the 2nd Padang International Conference on Education, Economics, Business and Accounting (PICEEBA-2), 2019, Padang, Indonesia, 24–25 November 2018; Volume 64, pp. 979–984. [Google Scholar] [CrossRef]
  89. Cho, G.; Hwang, H.; Sarstedt, M.; Ringle, C.M. Cutoff criteria for overall model fit indexes in generalized structured component analysis. J. Mark. Anal. 2020, 8, 189–202. [Google Scholar] [CrossRef]
  90. Lee, T.Y.; Hsing, S.C.; Li, C.C. An improved stress-scale specifically designed to measure stress of women with newly diagnosed breast cancer. Int. J. Environ. Res. Public Health 2021, 18, 2346. [Google Scholar] [CrossRef]
  91. Safeena, R.; Date, H.; Hundewale, N.; Kammani, A. Combination of TAM and TPB in Internet Banking Adoption. Int. J. Comput. Theory Eng. 2013, 5, 146. [Google Scholar] [CrossRef] [Green Version]
Figure 1. Study Conceptual Model.
Sustainability 14 01972 g001
Figure 2. Process of Structural Equation Modeling (SEM) Test. (a) Initial Std. Estimates SEM Before Data Elimination. (b) Final Std. Estimates SEM After Data Elimination.
Sustainability 14 01972 g002
Table 1. Operability Indicator.
Attribute TheoryResearch VariableOperability IndicatorReference
TPBIntention To Useconsiderations for using, plan to use, willingness to use, impulse of desire, imagining using[27,33,44]
Subjective Normencouragement family, friends, advertising, incentives, and work environment[44]
Perceived Behavioral Controlfreedom of choice, financial ability, belief in personal abilities, knowledge capability, pessimism[32,44]
Attitude Toward Useurgency to use, right ideas, supportive role, positive ideas, value benefits[32,33,34,35,36,37,38,39,40,41,42,43,44]
UTAUT-2Performance Expectancysupport work activities, friendly to environment, save expenses/costs, increase my work productivity[27]
Effort Expectancyease of learning, understanding, using and being skilled[27]
Facilitating Conditionavailability of sales facilities, refueling electricity, incentives to increase electricity power, safe technology, help center, compatible with conventional vehicles[27,32]
Hedonic Motivationthe perception of getting pleasure, comfort, pride, social status, convenience over price, pride in being a pioneer[27]
Price Valuereasonable price, value obtained, best price, quality and price[27]
Habithabit of use, attachment, possibility to use, reluctant to try[27]
Perceived RiskPerceived Physical Riskrisk of accident, seeking charging, risk from charging, risk from battery temperature, risk when exposed to flood[31,73]
Functional Riskdecrease in battery quality, maintenance difficulties, problems when using, incompatibility of battery sensors, lack of technical support[31]
Perceived Financial Riskperceived price reductions, increased expenses, difficult to accept by the market, decreased selling points, high maintenance costs, required additional costs[31]
Perceived Social Riskpresumption of arrogant and ostentatious, family pressure, environmental pressure, negative influence from experts[31]
Perceived Time Risklost a lot of time charging, studying, understanding and waiting time for orders[31]
Table 2. Respondent Demographics Data.
CharacteristicsCategoryFrequency (n = 526)Proportion
GenderFemale25849.0%
Male26851.0%
Age17–2518535.2%
26–3419236.5%
35–4312624.0%
>44234.4%
Marital StatusMarried33663.9%
Unmarried18935.9%
Other/divorced10.2%
EducationJunior High School10.2%
Senior High School12323.4%
Bachelor’s Degree35066.5%
Master’s Degree122.3%
Doctoral Degree10.2%
Other397.4%
Income<5 million IDR16631.6%
5–15 million IDR31559.9%
15–25 million IDR305.7%
25–35 million IDR81.5%
>35 million IDR71.3%
DomicileJakarta17433.1%
Surabaya397.4%
Medan61.1%
Bekasi244.6%
Bandung8416.0%
Makassar40.8%
Depok122.3%
Tangeran336.3%
Palembang40.8%
Bandar Lampung30.6%
Batam326.1%
Bogor468.7%
Padang10.2%
Pekanbaru61.1%
Malang5610.6%
Other Cities20.4%
User Conventional
Vehicle
Yes49393.7%
No336.3%
Have Knowledge
About E.V
Yes42981.6%
No9718.4%
Table 3. Process of Validity and Reliability Construct.
ConstructIndicatorInitial ModelFinal Model
Loading
Factor (λ)
CRAVELoading Factor (λ)
& Elimination Stage
CRAVE
Attitude Toward UseATU10.8410.9440.771Elimination 230.9360.785
ATU20.8880.884
ATU30.8760.879
ATU40.8940.891
ATU50.8910.890
Effort ExpectancyEE10.9890.9550.842Elimination 220.9320.820
EE20.9830.915
EE30.8330.888
EE40.8550.914
Facilitating
Condition
FC10.9350.8690.5470.9400.9410.841
FC20.9010.899
FC30.9110.911
FC40.431Elimination 1
FC50.440Elimination 2
FC60.622Elimination 6
HabitHB10.5660.8950.687Elimination 30.9270.809
HB20.8890.873
HB30.9170.924
HB40.8920.900
Hedonic
Motivation
HM10.8440.9190.6540.8890.8950.741
HM20.8600.883
HM30.8310.808
HM40.778Elimination 15
HM50.749Elimination 13
HM60.785Elimination 14
Intention to UseITU10.8490.9240.7080.8200.8830.716
ITU20.852Elimination 21
ITU30.834Elimination 20
ITU40.8340.856
ITU50.8370.862
Perceived
Behavior Control
PBC1−0.8550.7770.5970.8590.9100.772
PBC2−0.8880.883
PBC3−0.8880.894
PBC4−0.589Elimination 5
PBC50.573Elimination 4
Performance
Expectancy
PE10.5880.8120.525Elimination 70.8290.707
PE20.622Elimination 8
PE30.8280.829
PE40.8250.853
Perceived Financial RiskPFIN10.8060.9240.669Elimination 180.8940.678
PFIN20.8190.809
PFIN30.8150.809
PFIN40.808Elimination 19
PFIN50.8270.833
PFIN60.8330.843
Perceived
Performance/
Functional Risk
PFR10.8280.8890.6170.7890.8540.661
PFR20.8210.851
PFR30.7740.798
PFR40.720Elimination 11
PFR50.781Elimination 17
Perceived Physical RiskPPR10.7600.8840.605Elimination 160.8450.645
PPR20.724Elimination 9
PPR30.8050.776
PPR40.8280.875
PPR50.7680.754
Perceived Social RiskPSR10.7660.8530.5950.7580.8480.651
PSR20.8330.835
PSR30.8220.825
PSR40.650Elimination 10
Perceived Time RiskPTR10.7260.8640.615Elimination 120.8440.645
PTR20.7960.761
PTR30.8310.850
PTR40.7800.795
Price ValuePV10.8510.9160.7320.8500.9160.732
PV20.8840.885
PV30.8680.868
PV40.8190.819
Subjective NormSBN10.8550.9270.7180.8550.9270.718
SBN20.8480.848
SBN30.8220.822
SBN40.8520.852
SBN50.8600.860
Publisher’s Note: MDPI stays neutral with regard to jurisdictional claims in published maps and institutional affiliations.

