Article

The Stance, Factors, and Composition of Competitiveness of SMEs in Poland

by
Jarosław Kaczmarek
Department of Economics and Organization of Enterprises, Cracow University of Economics, Rakowicka St. 27, 31-510 Kraków, Poland
Sustainability 2022, 14(3), 1788; https://doi.org/10.3390/su14031788
Submission received: 9 January 2022 / Revised: 22 January 2022 / Accepted: 24 January 2022 / Published: 4 February 2022
(This article belongs to the Special Issue Entrepreneurship, Competitiveness and Innovation: A Trilogy Research)

Abstract

:
The research aims to present a comparative and cause–effect assessment of the competitiveness of small and medium production enterprises. The author’s research comprises 13,943 enterprises in 2007–2019—the entire population of enterprises included in public statistics in Poland as macro-, meso- and micro-structures. The research study presents the extent, trends, and intensity of changes in competitiveness and its factors. The author analyses the characteristics of structures—the stability of positions and changes in the ranking of objects, and presents the classification and comparative analysis of structure profiles. In the methodological approach, the study makes use of a specially designed multivariate competitiveness measure (statistical procedure), its partial measures (productivity of labour cost and cost productivity in regard to export), and determinants. The research on object relocation is based on the ranking method. The research of the relocation of objects is based on the ranking method. The average rank position and its variability are determined. The assessment of the density of objects is based on the specially designed density measure. Analysis of profile similarities are based on the taxonomic similarity measure. As research results have proven: first, small and medium enterprises represent different levels of competitiveness, and the intensity of changes varies in the course of time; second, increased competitiveness in both groups of companies results from export activities rather than an increase in labour productivity; third, in the context of great similarities between small and medium enterprise profiles in terms of their normative competitiveness patterns, the results of the analysis of the existing differences are in favour of medium entities. The value of the research lies in the usage of a unique set of enterprises and the constructed multivariate model for assessing competitiveness, structure variability, and its profiling.

1. Introduction

In terms of GDP, Poland is the EU’s sixth largest economy but 12th in their competitiveness (GCI, DB, and IEF). Nearly half of GDP is generated by the sector of non-financial enterprises. From the perspective of PKD (Polish Classification of Activities), production activities have the largest share, accounting for nearly ¼ of value added by the sector, which represents micro (up to nine employees), small (10–49), medium (50–249), and large enterprises (more than 250). The first category represents more than 2.1 m entities, representing approx. 18.5% of the sector’s value added. Unfortunately, specific figures are not available due to the use for this purpose of the research sample in public statistics.
Apart from micro and large companies (3773), more than 47.0 thousand small and medium entities generate more than 34.8% of value added. In this category, the most uniform group is represented by production companies (13,943 entities, 903.6 thousand employees, and PLN 448.5bn revenues from sales), who constitute the major target of the in-depth analysis, the results and assessments of which are presented in this article.
The presented literature review points to considerable research gaps—the lack of knowledge, especially in the area of empirical studies simultaneously referring to competitiveness analyses at macro, meso, and micro levels. A number of limitations resulting from difficult access to figures, as well as the volume of elements to be analysed and their structural relationships, are the main reason for the gaps in available knowledge, and, consequently, constitute a solid argument for further research.
In general, the research gaps were identified as: theoretical gap—the shortage of knowledge in the analysis of competitiveness simultaneously at the macro, meso, and micro levels to ensure comparability of assessments; methodological gap—the lack of an integrated model for measuring competitiveness in terms of its factors (unit cost and efficiency of labour, export activity, and cost productivity); and empirical gap—the lack of research on complete national sets of enterprises (so far only statistical samples).
The added value of the research, apart from the removal of the above-mentioned gaps, is the greater simplicity and promptness of obtaining the results. Thus, it is possible to apply the designed model both in economic policies and by individual enterprises. In this case, they can quickly, and in conditions of comparability, assess their competitive position.
In addition to the article, a broader literature review and the analysis of research gaps are presented in [1] (pp. 81–91, 103–126).
This article focuses on the results of empirical research, presenting the author’s analysis of competitiveness—one of the four key development processes (structural changes, competitiveness, restructuring, and effectiveness—value creation).
The subject of the research study is a comparative and cause–effect analysis of the competitiveness of small and medium production companies. The author’s research comprises 13,943 small and medium production enterprises in 2007–2019—a comprehensive study covering the entire population of enterprises included in Polish public statistics (2007—the new classification of activities, and 2019—the last year before the pandemic). The analysis covers the following entities: macro- (four PKD sections), meso-, (34 PKD divisions), and micro-structures (262 PKD classes).
The study makes use of the specially designed multivariate competitiveness measure (CM). The measure of competitiveness refers to a multivariate measure, its two partial measures, and their determinants.
The research of the competitiveness of small and medium production enterprises in Poland aims to present a comparative and cause–effect analysis of these entities in 2007–2019, including the following aspects:
  • Measurement of the impact, directions, and intensity of competitiveness changes and their factors;
  • Identification of the characteristics of the analysed group of companies, an analysis of the relocation of objects and their classification;
  • Comparative analysis of the profiles of the analysed structures.
These objectives lead to formulating research questions, and the proved hypotheses are as follows:
Main hypothesis:
  • In the context of great similarities between small and medium enterprise profiles in terms of their normative competitiveness patterns, the results of the analysis of the existing differences are in favour of medium entities.
Partial hypotheses:
  • Despite belonging to the same sector (SME), small and medium enterprises represent different levels of competitiveness, and the intensity of changes varies in the course of time;
  • Increased competitiveness in both groups of companies results from export activities rather than an increase in labour productivity;
  • Changes in meso- and micro-structures are characterised by a greater density of objects and their increasing stability in ranking positions.
The value of the conducted research is based on its unique character (the entire population of enterprises), being the first study of this type conducted (so far using only statistical samples). Significant value added is created by the constructed model of competitiveness factor analysis, structure variability, and structure profiling from the perspective of company size classification. This is the first model applied (not only in Poland, but worldwide) for assessing the competitiveness of the entire population of small and medium entities simultaneously for macro, meso and micro levels.
The applied approach to measuring competitiveness from the financial perspective is an attempt to recognise one of the many dimensions of the concept of financial energy. This energy, through the fact that it builds opportunities for business development, can be measured in a universal way with the use of money.
This approach to measuring competitiveness from the financial perspective is one of the possible options. However, it has an advantage due to its universal valuation method and simplicity of application. This reduces the asymmetry of information that exists in individual enterprises.

2. Literature Review

SMEs attracted general attention relatively early; its characteristics were first appreciated in the United States, and then, in the 1970s, in Japan and Europe. The SME sector in Poland was identified in the 1990s, at the beginning of the economic transformation. Following the introductory stage of its development, the sector went through a phase of “explosion” by 1994, and then entered a stage of market self-regulation.
Small and medium enterprises possess a number of unique attributes (e.g., the concentration of capital, responsiveness, or simple structures) [2,3], but their development is hindered by a number of barriers [4]. However, the achievements of SMEs and their position in the economy demonstrate their great ability to overcome various obstacles [5,6] (pp. 1–40).
Enterprises need to anticipate and properly evaluate their situation, i.e., their ability to operate and develop effectively [7]. They achieve these because of changes [8] (pp. 67–69). Competitiveness is closely related to changes, the adaptation towards evolving conditions, and especially their anticipation [9] (pp. 20–35). These conditions have been transformed over time and are currently significantly advanced. Hence, there are also evolving ideas about the determinants of competitiveness, its nature, effects, and assessment [10] (pp. 67–95).
The literature review aims to highlight specific characteristics of competitiveness, which are important from the point of view of empirical research, which forms the core of the article. The main theses (competitiveness features) verified in the area of theoretical considerations are as follows:
  • Competitiveness is characterized by a multiplicity of definitions and multidimensionality, and the most infrequent research is undertaken at the meso-economic level;
  • Various changes and processes have changed the conditions of competition, so that the new centre and measure of competitive advantage are now not the value chain but its module;
  • The theoretical measures of competitiveness are much broader than the possibilities of their application in practice;
  • Measuring competitiveness in financial terms facilitates the broadening of analysis, their comparability, and universal application.
Competitiveness is a complex idea, and it is difficult to analyse due to the necessity of referring it to the external environment. Moreover, it receives much criticism as a concept, as it is often overestimated and poorly defined, which complicates it in terms of assessments and the choice of criteria. Some analysts even raise doubts about its usefulness as a factor of change in the era of globalization and integration [11]. This problem is given much attention in the descriptions of the still on-going systemic changes in Poland [12] (pp. 122–150), [13].
The term competitiveness is derived from competition, being its materialization, and it results in changes in a company’s competitive position [14]. They show a company’s ability to effectively achieve its objectives [15]. In a broad sense, a competitive position is one of the links of the competitiveness chain—it is supplemented by competition instruments, competitive advantage, and competitiveness potential [16].
There are different approaches to the analysis of competitiveness [17,18] (p. 58). Research in this area relates to competition among entities as well as their ability to maintain or increase their market share [19] (pp. 1–2). Competitiveness is more frequently analysed in the context of management sciences (ways of gaining competitive advantage) than in the discipline of economics (reference to entities’ increased effectiveness and economic growth).
Generally, research on competitiveness is concentrated within several economic theories, mainly including economic growth theory (international competitive ability: factor based competitiveness) [20,21]; international trade theory (international competitive position; outcome based competitiveness) [22,23] (p. 1); distortion theory (level and structure of competitive position in terms of value added) [24]; and competition theory (idea of competitive advantages) [25,26].
Undoubtedly, the theory of competitiveness based on efficiency has been widely applied. The reason for this was due to the significant contribution of M.E. Porter [27] (pp. 32–47). This theory brings together two categories, which are competitiveness and specialization [28]. However, this approximation does not mean understanding them as synonyms [29] (pp. 37–69). The reason for this is the impact of efficiency on changes in competitiveness and specialization. Competitiveness is a singularly comparative category, because the comparison is between a particular product market and all its manufacturers. Specialization, on the other hand, is a doubly comparative category, according to comparative cost theory [30]. In this case, the comparison is between different products, which are made by different manufacturers [31] (pp. 120–131). Therefore, this means that it is conceptualized as international specialization [32]. In addition, specialization is not a rival to competitiveness [33] (p. 138). Specialization demonstrates differences in export structure, while competitiveness reflects market shares [34] (pp. 200–231), [35] (pp. 176–186).
Considering the composition “efficiency-competitiveness-specialization”, two conclusions can be made. First, the scope of competitiveness analysis does not coincide with the scope of research on international specialization due to the different number of entities involved in these processes. Second, the differences in competitiveness do not always determine the differences in international specialization, so this last does not always reflect the differences in efficiency.
In the analysis of competitiveness and specialization, the impact of not only efficiency factors, but also non-efficiency factors [36], including state policy [37] (pp. 362–369), are discernible. These factors can be noticed in export promotion, domestic market protection, and liberalization [38]. Liberalization is particularly important because it causes a more accurate measurement of the international competitiveness of domestic products, a reduction in support and protection for domestic manufacturers, and an equalization of competition conditions in the domestic market [39].
Competitiveness is the ability to achieve and sustain competitive advantage [40]. The background is the theory of a static view of competitiveness (balanced competition). It is based on M.E. Porter’s concept of competitive advantages [41] (pp. 44–62). It proposes that by improving efficiency it is possible to obtain factors that contribute to the expansion of the enterprise and obtain competitive advantage [42].
Competitive advantage can be understood both as static and dynamic, i.e., as its ownership of and ability to gain possessions [43]. Competitive advantage is distinguished from market advantage; the latter does not guarantee the obtaining of the former [44]. The origins of competitive advantage are currently mainly intensive factors, which are caused by increasing the volatility, turbulence, and complexity of the business environment [45]. Such a factor can be a permanent restructuring, innovation, knowledge, and information [46].
The large number of the definitions of competitiveness indicates that it is a multidimensional concept from the perspective of the range of entities it covers. The following scales can be identified: mega (a group of countries), macro (a country), meso (a sector or industry), micro (an enterprise), and micro-micro (a product) [47]. Moreover, microeconomic competitiveness (the most common area of research) is also multidimensional in character [48] (pp. 35–40, 44), being divided into competitiveness sensu largo and sensu stricto [49] (p. 20), while the meso-economic level is the least frequently undertaken area of studies.
Moreover, attention should be given to those who claim that competitiveness is an exclusively micro-economic category—a country may not be eliminated from the market, which could be regarded as a goal of competition [50]. In addition, the competitiveness of countries is affected by other factors than those related to production effectiveness, which contradicts Porter’s concept of competitive advantage (the concept is subject to criticism) [51] (pp. 1–30), [52] (pp. 4–5).
There are two approaches to competition strategies—positioning and resource-based [53] (p. 328). In the former approach, a strategy is chosen on the basis of the structural attractiveness of an industry and its relative position in this industry [54] (pp. 300–323), [55], while in the latter approach, resources which are not productive as such serve to create key competences which determine a strategy [56].
Various processes have had an impact on the current conditions of market competition [57] (pp. 84–179); they have improved the process of competing rather than made it stiffer, facilitating the creation and distribution of the increasing part of value added on a global scale [58].
A new centre and measure of competitive advantage is no longer constituted by a value chain but its module [59]. It is the foundation for developing new forms of activity and migrations to new markets [60]; the vertically integrated value chain is being decomposed, and the classical resource-related barrier no longer ensures maintaining competitive advantage [61].
The ambiguity of the definition of competitiveness affects its assessments, in which theoretical measures do not correspond to their practical applications. Partial and multivariate measures are applied at a macroeconomic level [62]. A microeconomic approach resorts to effectiveness measures (financial results and the share of export sales), the sources of building a competitive potential, and the ways of shaping the microenvironment. Competitiveness assessments are most frequently based on two methods—assessments of changes of effectiveness (total productivity, unit costs, and labour costs), as well as changes in export ratios [63,64]. This very method is a basis for developing the competitiveness measure method applied in this research, the results of which are presented in this article.
A financial approach to measuring competitiveness reports on the potential possessed, its size, and structure [65]. This potential builds opportunities for developing enterprises, and a measure constructed on the money basis becomes universal and simple to apply [66]. The proposed approach facilitates comparisons (both national and international) and the aggregation of multiple categories into a single, financial view [67]. It also makes possible a switch away from subjective qualitative analyses and unrepresentative samples based on interviewing companies (especially a large population of SMEs), towards objectified quantitative analyses. The increased simplicity in making comparisons and their promptness, thanks to the database from public statistics, also allows for the use of the developed model in building economic policies [68].

3. The Methodology of Research

The research study makes use of the model along with the specially designed competitiveness multivariate measure (CM) (Figure 1). This measure is based on four factor elements, their structural relationships that create two partial measures, and statistical procedures used for their calculation (standardization, change of de-stimulants into stimulants, the elimination of negative values—deduction of a scalar and determination of distance from anti-pattern (di0)—origin of the coordinate system).
d i 0 C M = j = 1 K x i j x 0 j 2 x i j = s t y m P L S T D = L E L C ,   | L E = G S E M P ; L C = T S E M P s t y m P E S T D = E A · G E ,   | E A = E X G S ; G E = G S T C
where:
  • PL: Productivity of labour cost;
  • LE: Unit efficiency of labour;
  • LC: Unit cost of labour;
  • PE: Cost productivity in regard to export;
  • EA: Export activity;
  • GE: Overall cost productivity;
  • GS: Gross revenues from sales;
  • EMP: Number of employees;
  • TS: Labour costs (remuneration, social insurance, and other benefits);
  • EX: Revenues from export;
  • TC: Total costs;
  • X0 = (0, …, 0)K;
  • K—Number of multivariate measure components (j = 1, , K).
The concept of competitiveness measure (CM) comprises the characteristics and results of the following areas: labour efficiency and unit costs, export activity, and general effectiveness.
The unit cost of labour (LC) and the unit efficiency of labour (LE) are key economic relationships describing the use of the human labour factor. Their size, and, in particular, their dynamics (overtaking rate—LE dynamics vs. LC dynamics) and trends of changes, allow for explaining their outcome value in the form of the productivity of labour cost stream (PL).
Export activity (EA) quantifies the share in the international division of labour, being a component of the assessment of an economic entity’s competitive position and potential. In turn, the use of the overall cost productivity measure (GE) allows for assessing the general effectiveness of its functioning. The mutual reference of both factors allows for assessing their impact on the outcome value (cost productivity in regard to export—PE) and overtaking rate (EA dynamics vs. GE dynamics).
The research of the relocation of objects in the identified structures is based on the ranking method. For this purpose, multivariate measure values are replaced by regular type ranks. The average rank method is used, and the principle is adopted, which assigns the lowest rank value to the highest value of a given measure. The average rank position (ARP) and the variability of rank position (VRP) are determined for the time series of a given object, treating standard deviation as its measure.
The assessment of the density of objects is based on the specially designed density measure (DM). Its value is proportional to the surface of the ellipse, which covers the analysed set of objects.
D M = s x 2 s y 2 · 1 r x y 2
where:
  • s2x, s2y: Variance of determinant x, variance of determinant y;
  • r2xy: Pearson linear correlation factor between x and y.
The classification of objects is based on ARP and VRP. The resulting four normative patterns are characterised, in terms of competitiveness (CM), by:
  • Pattern I: High and stable position;
  • Pattern II: High and considerably changeable position;
  • Pattern III: Low and stable position;
  • Pattern IV: Low and considerably changeable position.
Assessments of profile similarities are based on the similarity measure (TMS). This measure assumes values <0–1>; the closer this value is to unity, the greater the similarity of compared structures.
T M S = i = 1 N m i n   p i j ,   p i k
where:
  • pij, pik: Share of the i-th object in structure j, k;
  • N: Number of objects.
Causal analysis is based on a deterministic approach and logarithm method. It allows for transforming the sequence of the product of dynamics of independent variables (DX) into the sequence of sums, which is followed by equating the logarithm of dependent variable (DY) to unity. It leads to determining the ratios of the structure, which describe the impact of independent variables (RX) on the dependent variable (RY)
D Y = D X 1 · D X 2 ·   · D X n   ;   log D Y = log D X 1 · D X 2 · · D X n R Y = log D X 1 + log D X 2 + + log D X n log D Y = 1   R X 1 = log D X 1 log D Y   ;   R X 2 = log D X 2 log D Y   ;     ;   R X n = log D X n log D Y R Y = R X 1 + + R X n  
The analysis of the interdependencies of phenomena (time series) assumes critical significance level α = 0.05, compared to p-value test p-value. p-value lower than the critical significance level justifies the use of the procedure in which the null hypothesis on the lack of correlation would be rejected (the degree of correlation as a numeric value is presented in the results of the conducted analyses only if p-value < α). The adopted correlation measure is r-Pearson (r), and the measure of variation is standard deviations (SD). The average rate of change (ARC) is calculated by the formula:
A R C =   x n x 1 n 1 1 · 100 %
The employed descriptive statistics are as follows: average value, median (5th decile, D5), minimum, maximum, measure of differentiation (DF = (D9 − D1)/2), standard deviation (SD), decile distribution and cumulative distribution function, and inter-decile ranges (IDR).
The statistical methods used do not assume multivariate normality or any other parametric multivariate probability distribution, so no diagnostic testing was conducted for multivariate data with a normal distribution. Because there is no dimensionality reduction for the standard bivariate scatterplot used, it was not necessary to calculate the total variance.

4. Results

4.1. Competitiveness Factors

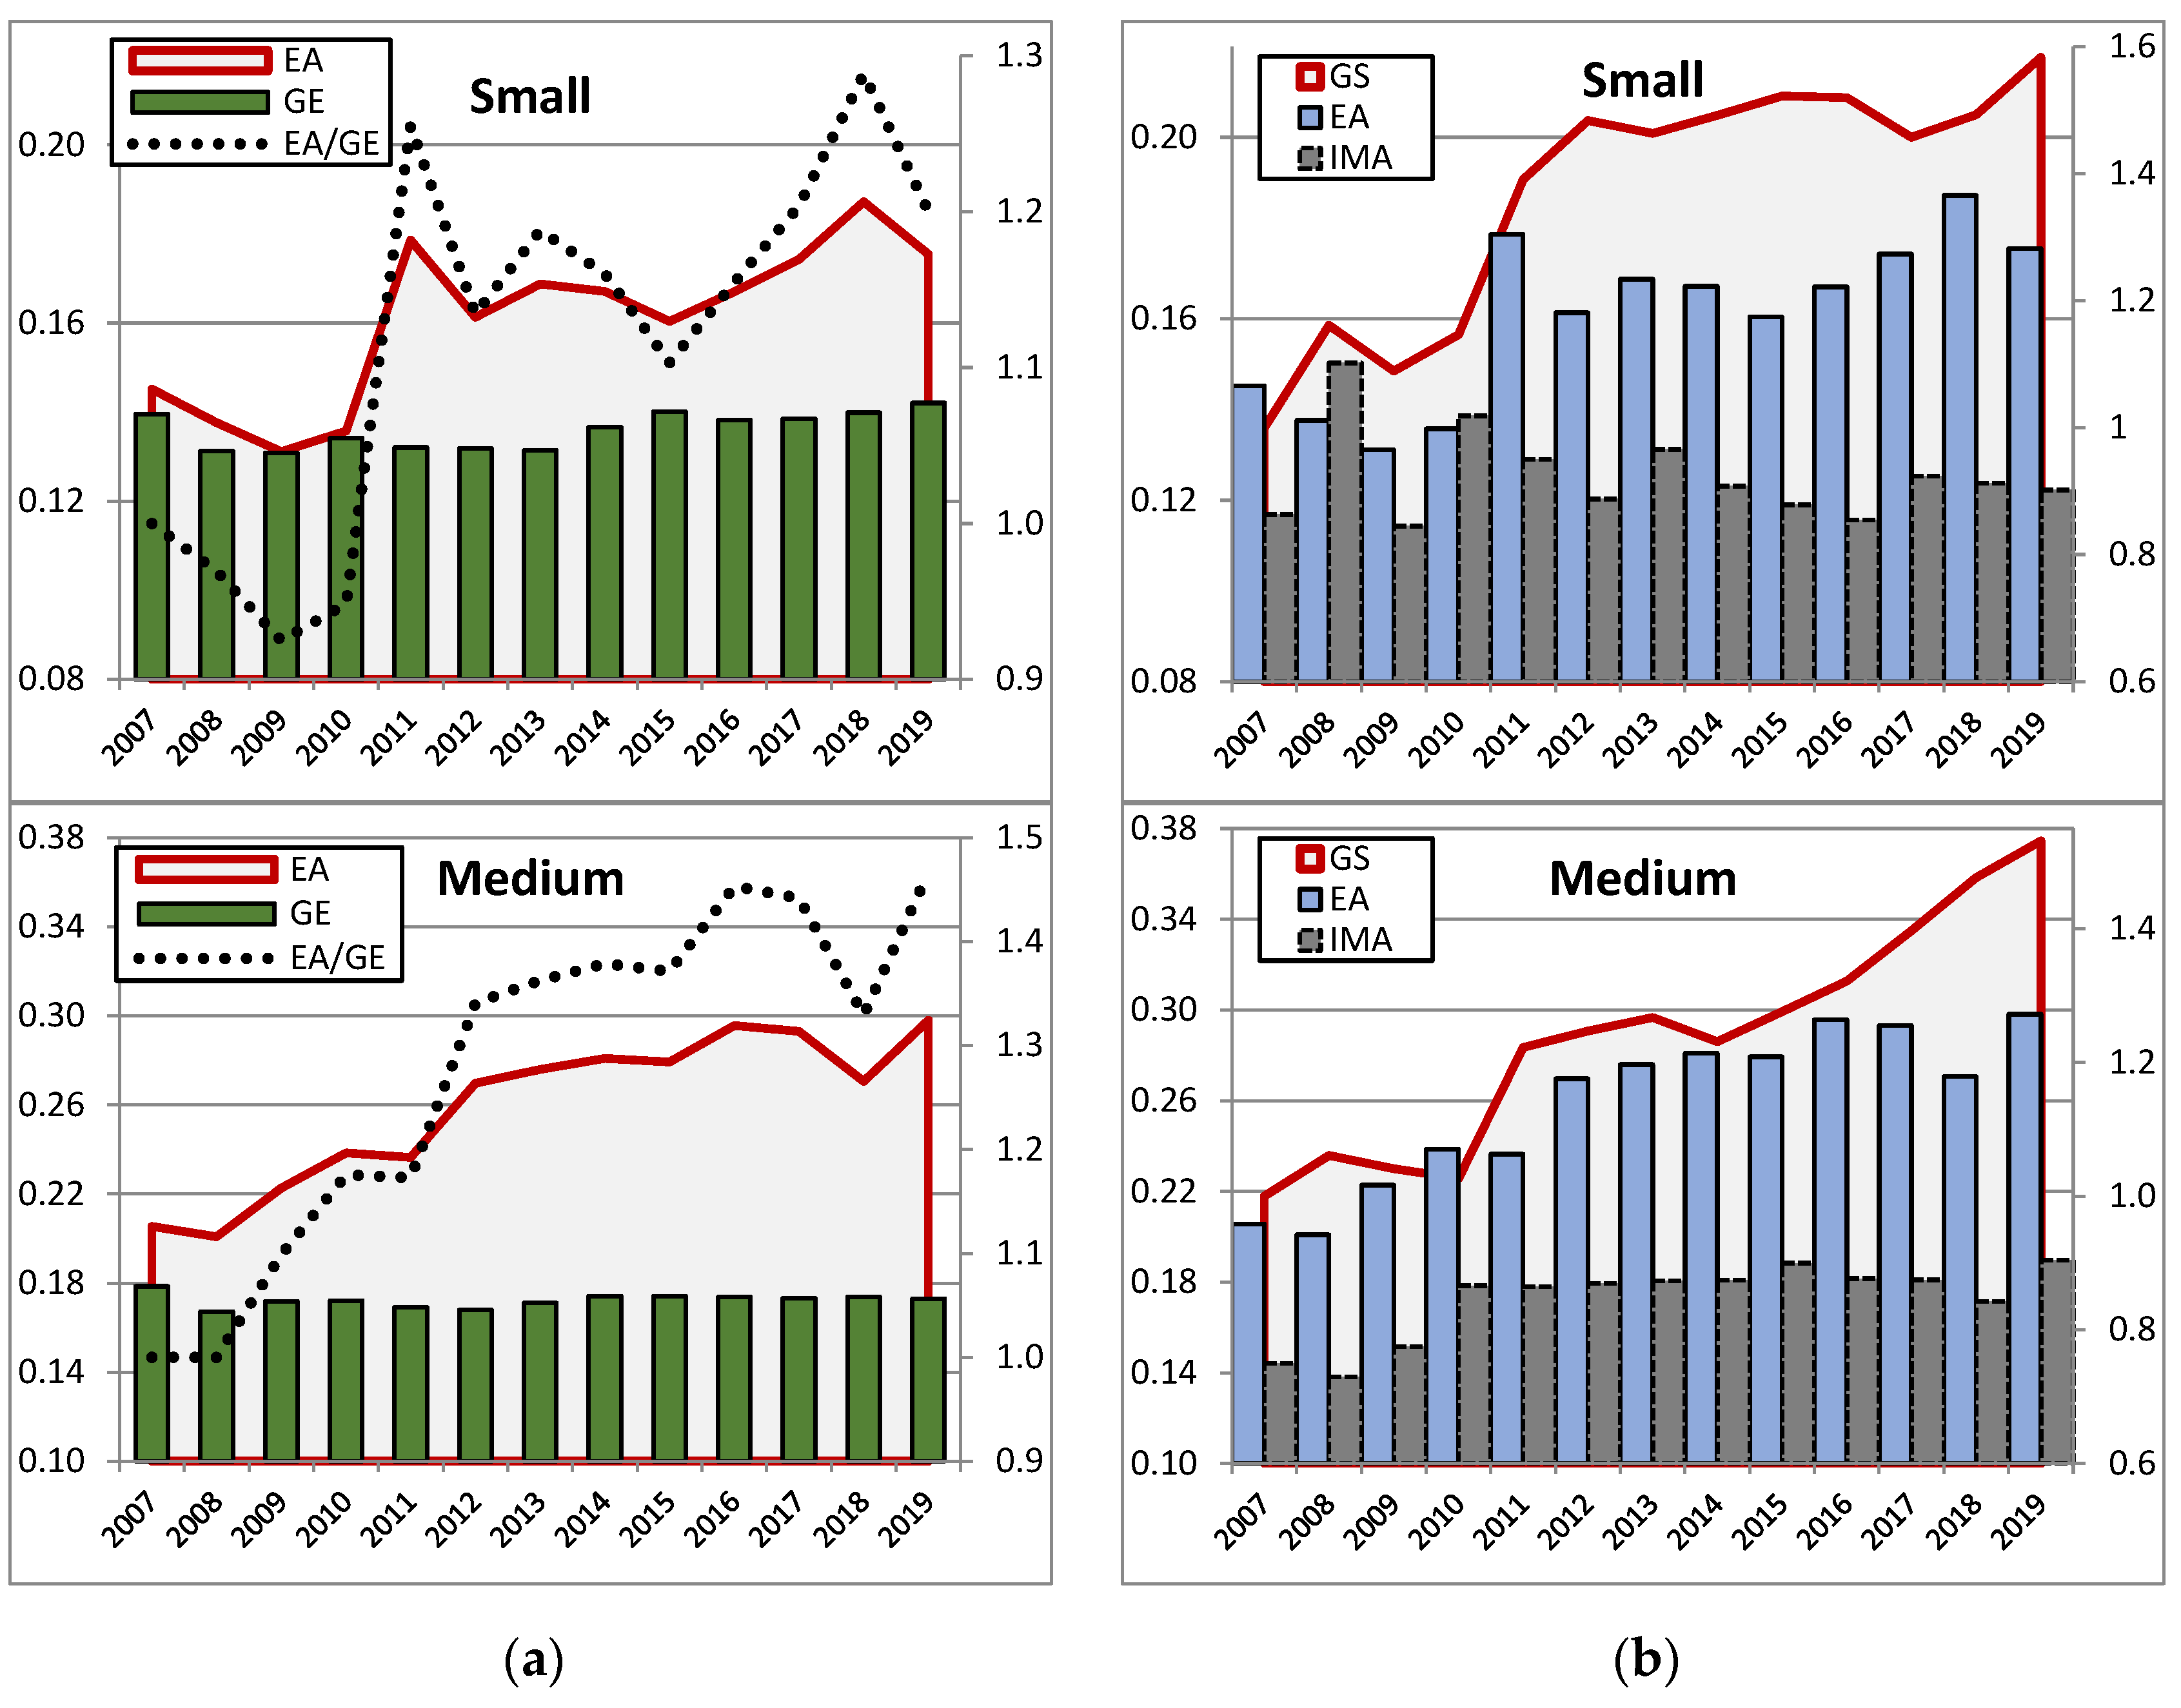
In 2007–2019, small enterprises were characterised by an increase in productivity PE (cost productivity in relation to exports), with average ARC (average rate of change) values of 1.6%, and visible decreases in the periods of economic slowdown (2008–2010). The PE factor, which follows a similar path, is export activity (EA), while the other factor, general effectiveness (GE), remains relatively stable. Density measure DM increases as of 2015, indicating a larger diversity of enterprises (deviation from the values of EA and GE factors). In small companies, the overtaking rate of IMA by EA records show positive trends (from 1.24 in 2007 to 1.44 in 2019).
Medium enterprises are characterised by higher PE values as well as export activity EA values (on average 1.6-fold), with similar average GE values. PE increases are steadier than in small entities, which results from—considering the high stability of GE, and similarly to small enterprises—changes in EA. However, EA values have no longer risen and have generally stabilized since 2015, and similar trends are observed for PE (an increase in small entities). The density of objects is relatively stable, especially after 2010. IMA by EA overtaking rate dynamics increase from 1.42 in 2007 to 1.57 in 2019 (to a smaller degree than in small entities) (Figure 2).
Small enterprises are characterised by higher PL average values (+22.4%) and LE values (+10.1%) as compared with medium enterprises, in the conditions of lower LC values (−10.0%). The shape of the PL curve in both size classes of companies is similar to and strongly correlated (r = 0.87) with a declining trend as of 2012. In small entities, the LE values, following an upward trend up to 2012, stabilise, which, in light of increased LC values, leads to the steady deterioration in PL. In medium enterprises, an average increase in LE values is more stable, but its dynamics is lower than in small entities (ARC = 4.0%), which (with higher LC values) results in lower PL, similarly to dynamics in small entities (Figure 3).

4.2. Multivariate Competitiveness Measure

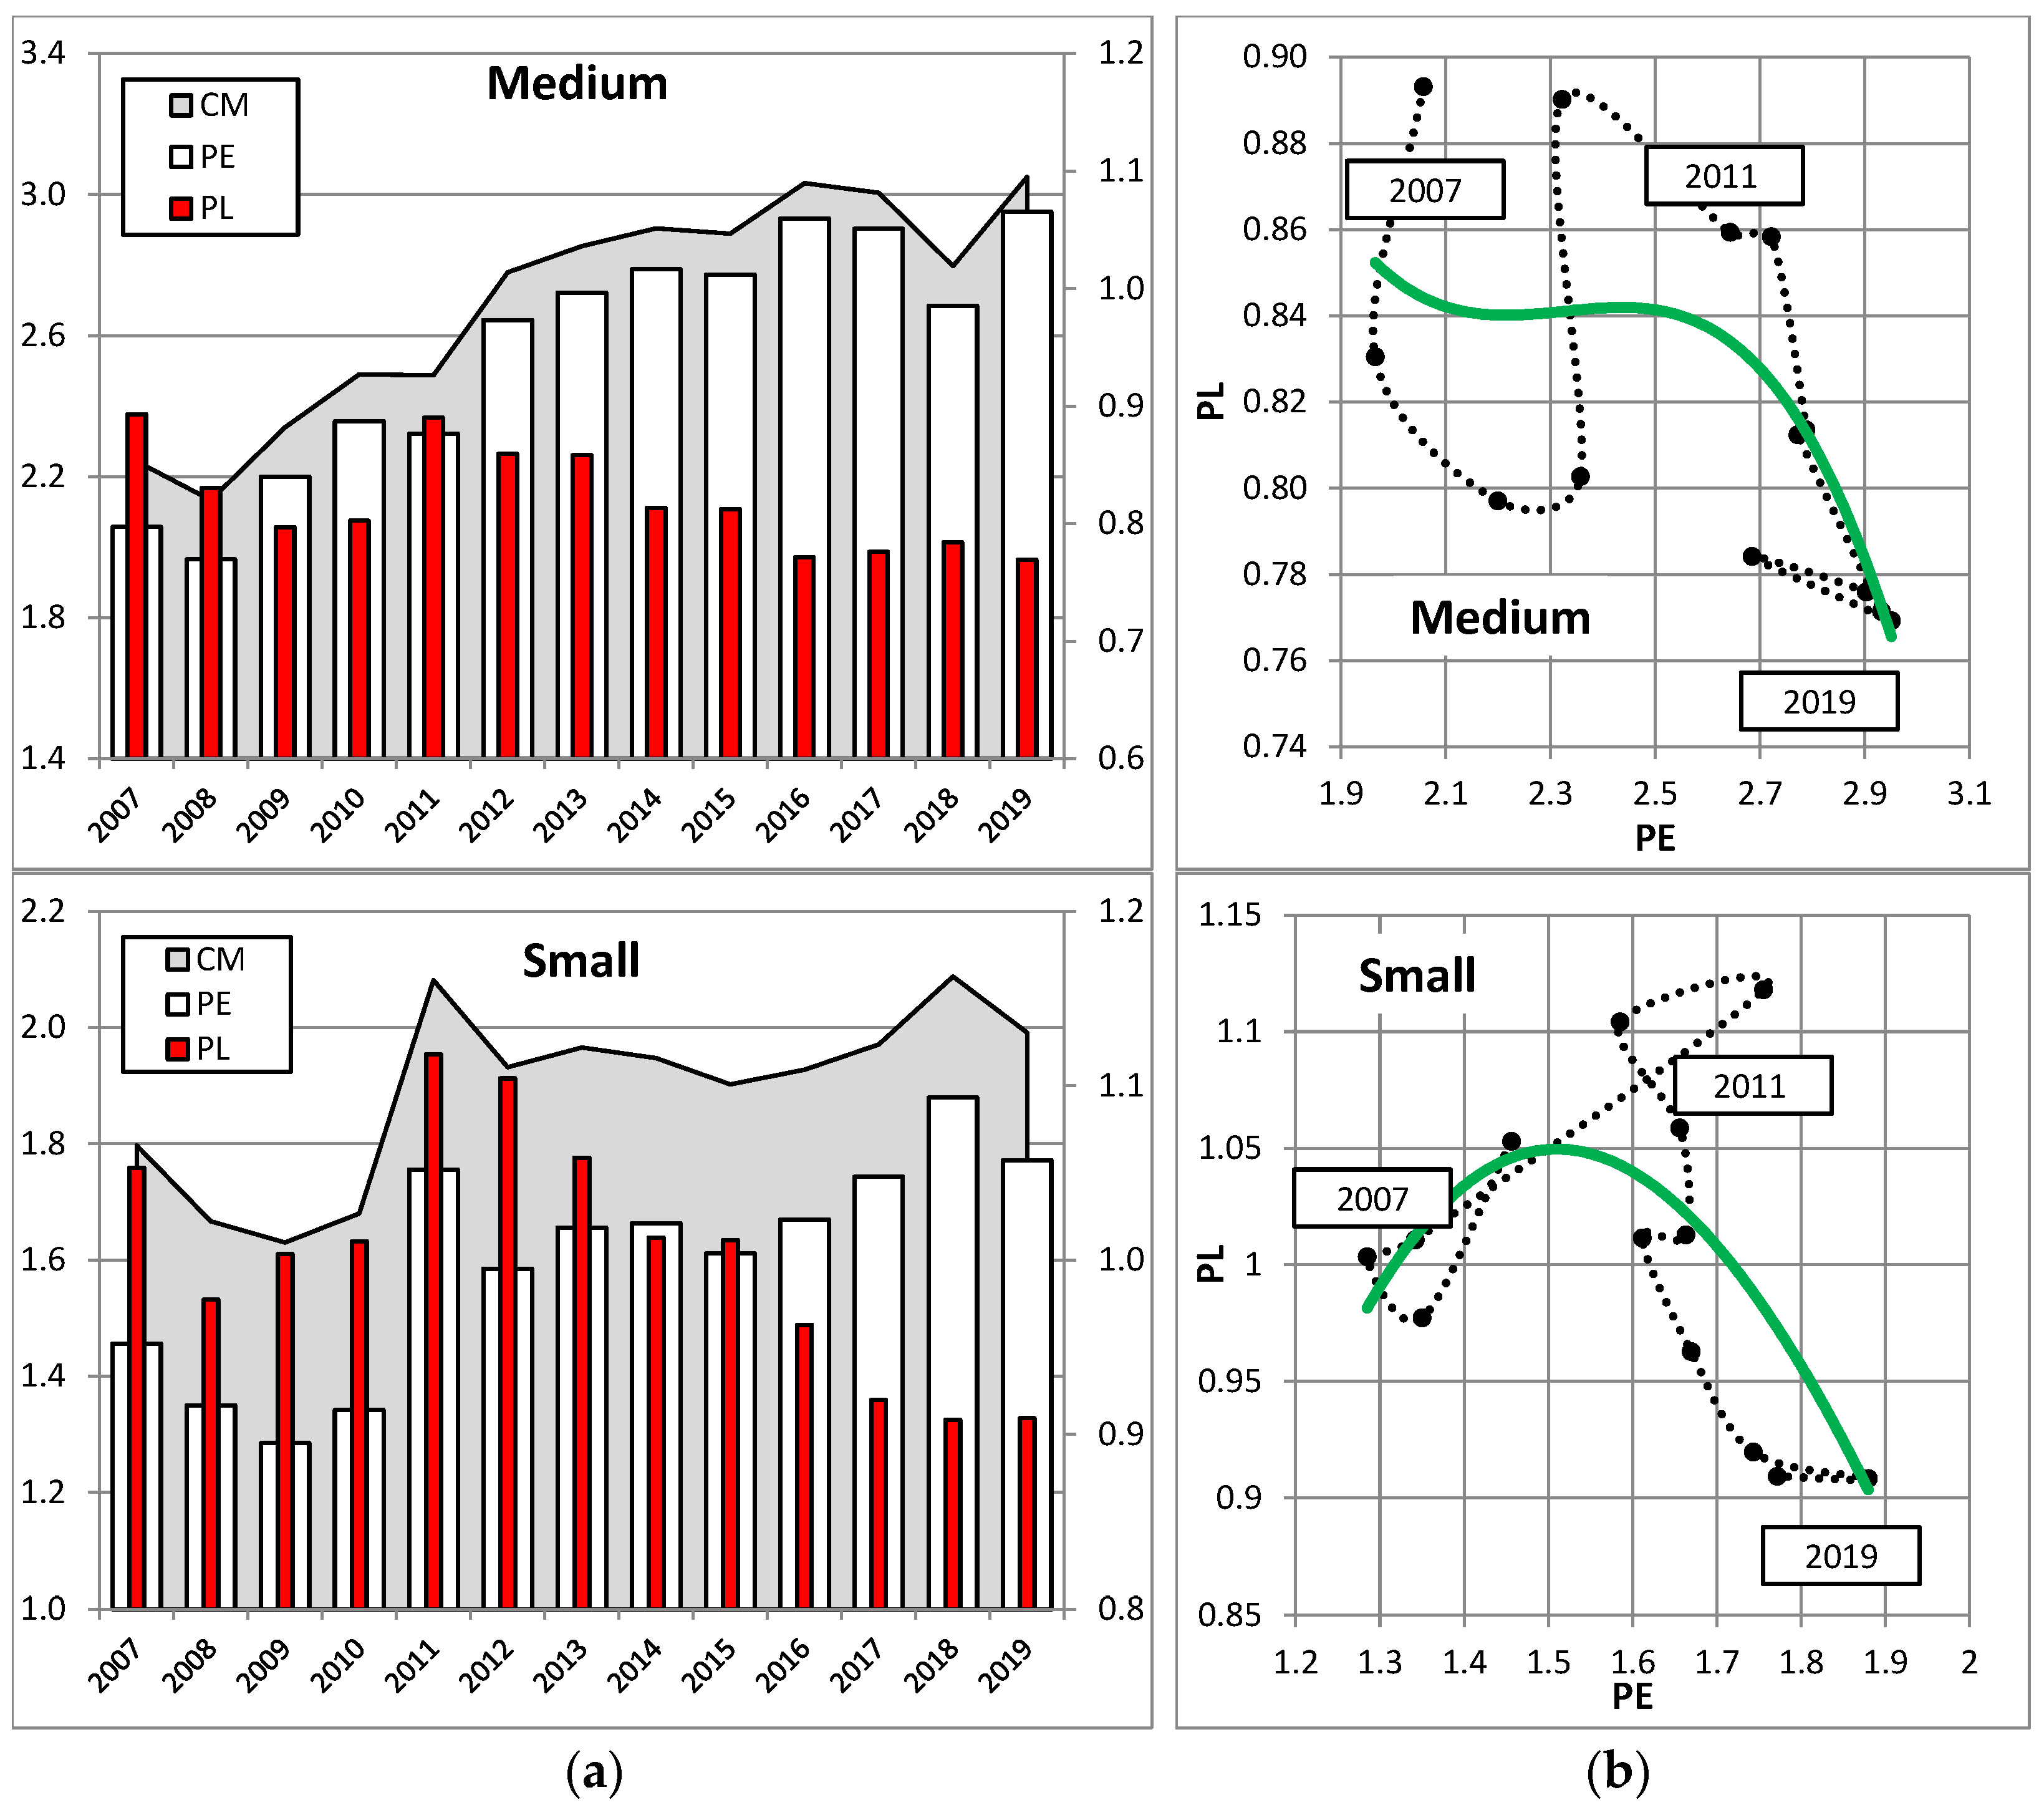
The competitiveness of small enterprises, assessed on the basis of the multivariate measure CM, is characterised by an average pace of changes of 0.9% (ARC), which decreases considerably in 2008–2010. After 2011, the negative trend is slower, until 2015. The year 2018 records values which are comparable with the peak year (2011). At the beginning of the period, a decline results from lower PL and export activity values (PE). A mid-term declining trend in PL, which starts in 2012, is considerably different from the PE growth curve as of 2016, which mitigates the negative effects of declining PL, leading to increased values of the competitiveness measure in the period of the final years. These dependencies are confirmed by the path of the central point representing the population of small enterprises, which clearly points to the year 2011 as a turning point of the impact of PE and PL on CM values.
Medium enterprises record average CM values which are 1.4-fold higher than in small entities; its increase is also higher (ARC = 2.6%) and, particularly, steadier. At the beginning of the period, PL decreases are neutralised by increases in PE, which prevents increases in CM. As of 2011, PL and PE curves considerably depart from each other, and the steady increase in CM is ensured by a considerable increase in PE. Its decline in 2017–2018, in the context of slight increases in PL, leads to the general deterioration in CM, which is recovered, however, in 2019. Similarly to the case of enterprises, the path of the central point marks the year 2011 as a turning point of the impact of PE and PL on CM values (Figure 4).
Generally, both small and medium entities are characterised by a negative mid-term (as of 2011) in PL values, and the maintaining of CM levels is dependent on the PE factor. From the perspective of a causal analysis, the share of the PL factor in small entities falls from 34.3% in 2007 to 20.8% in 2019, and in medium enterprises from 15.9% to 6.4%, respectively.
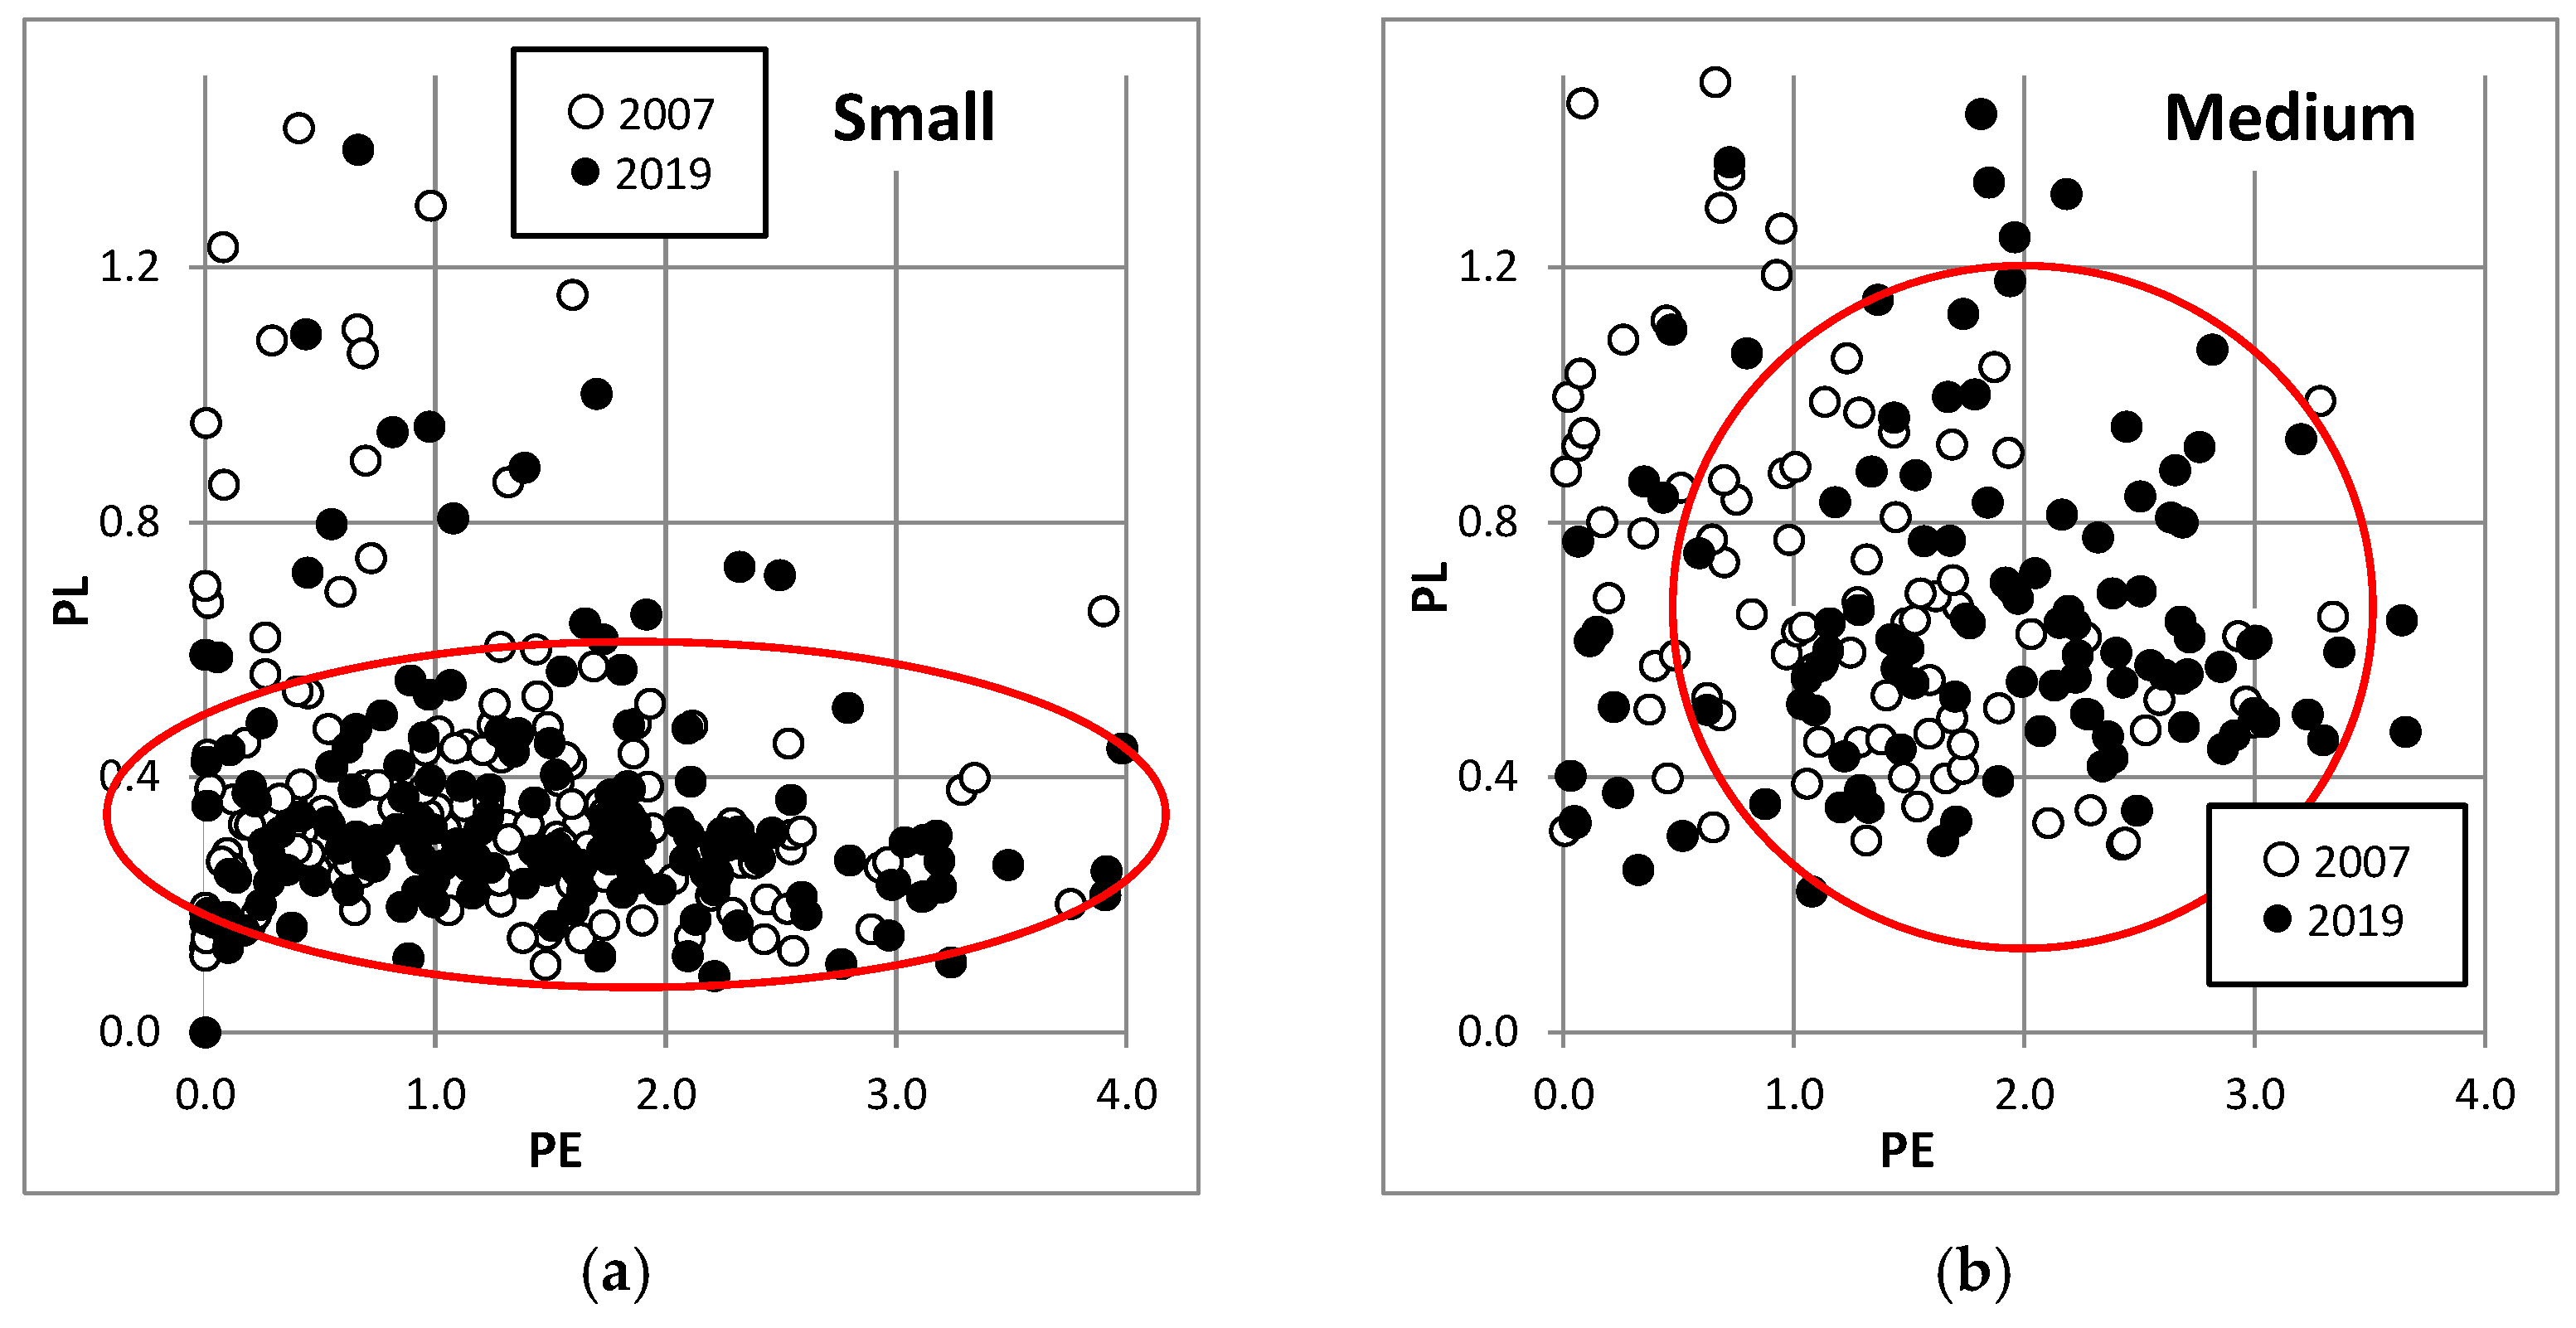
The analysis of the population of companies indicates a higher degree of density in small entities (a decrease in DM by 61.5%) as compared with medium companies (by 19.1%). It implies a greater similarity of enterprises in terms of PE and PL values. In small entities, this similarity relates to a relatively narrow range of PL values, with greater differences in PE values. Medium enterprises are characterised by a lager proportionality between PE and PL values, which determine the position of particular objects (Figure 5).
The conducted time series correlation test for CM and DM points to a strongly negative correlation for small entities (r = −0.70)—increased competitiveness corresponds to the higher density (and vice versa) of micro-structure objects (objects become closer to each other, becoming more similar). Such correlations are not recorded in medium enterprises.

4.3. Changes in Structures (Macro, Meso, and Micro)

At the level of a macrostructure, a special situation is observed in small entities classified as section D (Electricity, gas, steam, hot water, and air conditioning manufacturing and supply)—a sharp decrease in CM as of 2010, with a small recovery in 2019. The average value (ARC = 0.9%, high stability, and SD = 7.7%) for four PKD sections is determined by section C (Manufacturing). It is true that the highest ARC is recorded in section E (Water supply; sewerage, waste management, and remediation activities), but along with section B (Mining and quarrying), they are characterised by the lowest average CM values.
The commentaries related to sections B and E also apply to medium entities, including section D (a decrease in CM up to 2014). However, the highest results are observed in section C, determining the results of the entire class of medium enterprises. This section, along with the low result of section D, achieved positive ARC values (Figure 6).
From the perspective of factors, negative changes in section D and in the class of small entities can be attributed to a considerable decrease in PL values, additionally enhanced by decreased PE values after 2014. Similar conclusions apply to medium companies, except that the weakening of PL was observed until 2014; in the subsequent periods, PL increases, which results in the recovery of CM values.
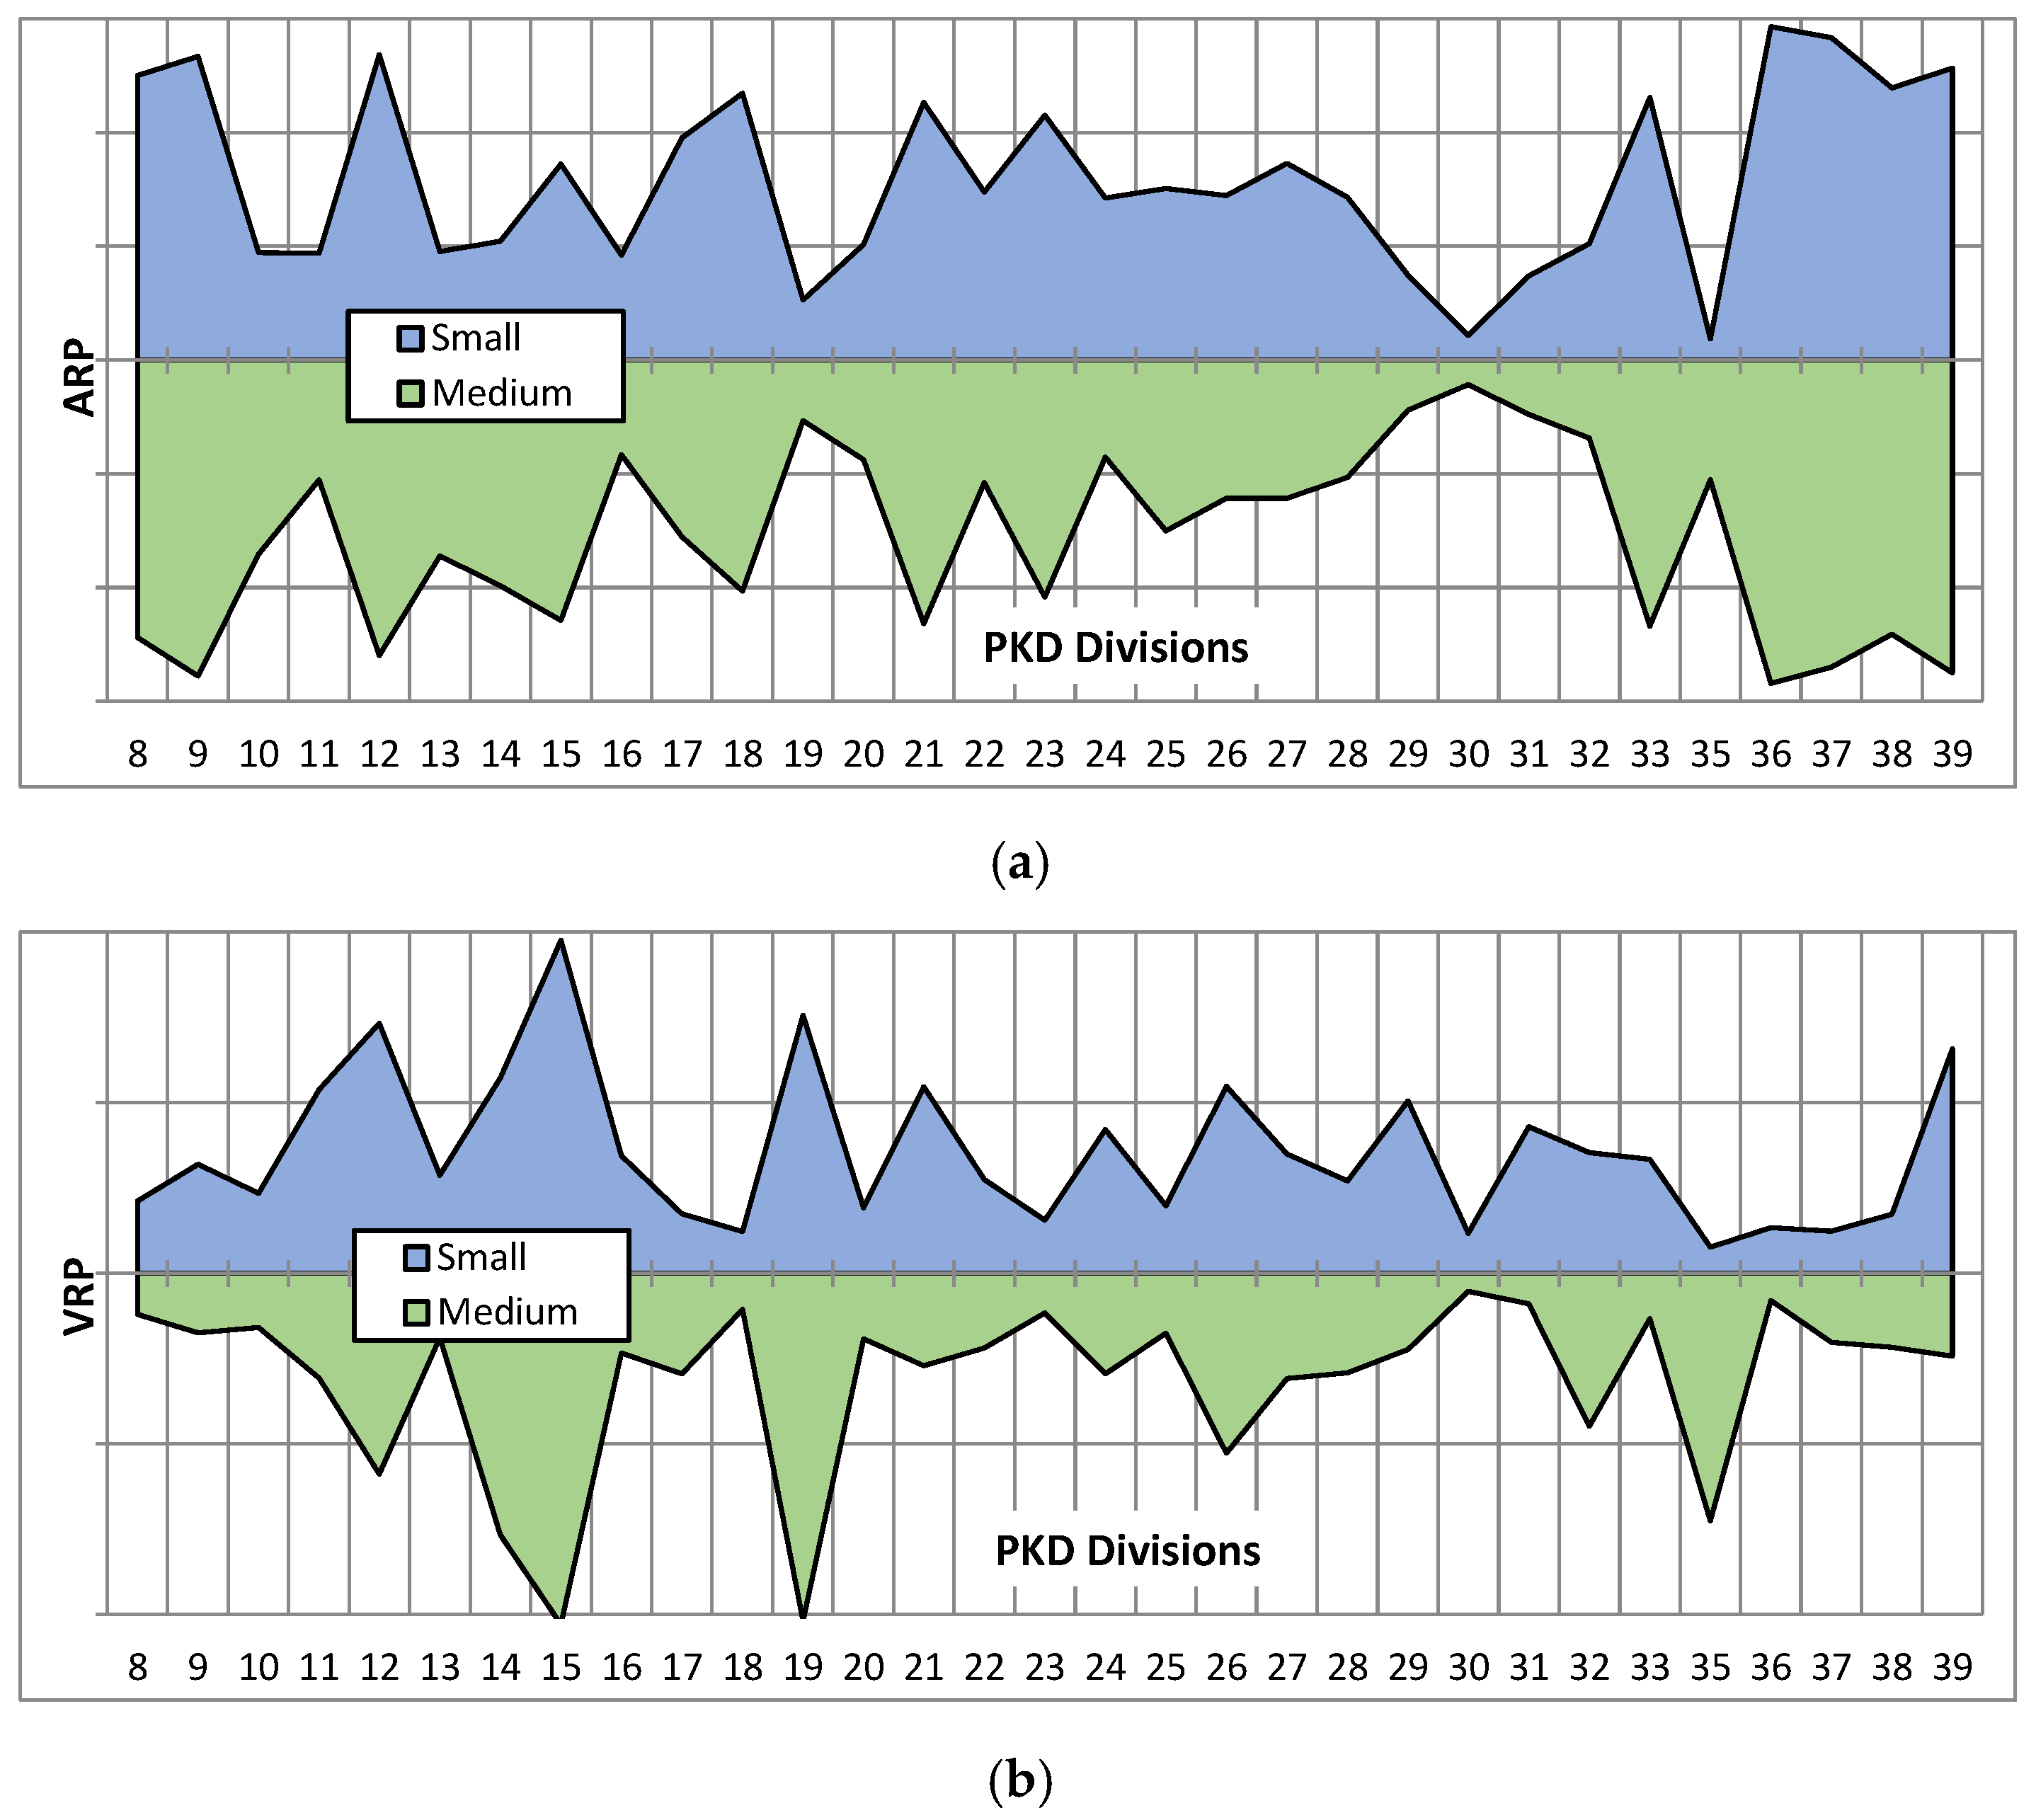
At the level of a meso-structure (PKD divisions) the results of spatial analysis point to a slightly greater degree of the relocation of PKD divisions in small entities (VRP = 22.4%) than in medium ones (19.8%). In the latter class it is greater by 7.4% after rather than before 2012 (the feature of greater persistence in 2007–2012). In small entities this difference is the opposite (−9.7%). In both classes of entities (by size), the smallest number of relocations is observed in the initial and final part of the rank list of PKD divisions, which in the latter case has a very negative effect—the stability of positions is recorded by PKD divisions characterised by the weakest competitive position (Figure 7).
The analysis of normative patterns indicates that pattern I (“leaders”—a highly competitive position with low changeability) comprises in small enterprises of a smaller number of PKD divisions than in medium. In turn, pattern IV (“outsiders”—a low competitive position with high changeability) comprises more PKD small entities than medium ones. This first comparison points to a more favourable position held by medium enterprises. In pattern III, the situation in small enterprises was less favourable than in medium. Greater disproportions occur in pattern II (a highly competitive position with high changeability)—small entities (22.6%) gain an advantage over medium ones (12.9%) (Figure 8).
The presented classification allows for comparing the lists of PKD divisions assigned to particular normative patterns, and, importantly, to pattern I—the core pattern which determines the competitiveness of the entire size class of entities. PKD sections assigned to this pattern are as follows:
Small EnterprisesMedium Enterprises
35 Electricity, gas, steam, hot water, and air conditioning manufacturers and suppliers;
30 Manufactures of other transport equipment;
16 Manufactures of products of wood and cork, except furniture; manufactures of articles of straw and plaiting materials;
10 Manufactures of food products;
13 Manufactures of textiles;
20 Manufactures of chemicals and chemical products;
32 Other manufacturing;
28 Manufactures of machinery and equipment not elsewhere classified;
22 Manufactures of rubber and plastic products;
25 Manufactures of fabricated metal products, except machinery and equipment.
30 Manufactures of other transport equipment;
29 Manufactures of motor vehicles, trailers, and semi-trailers excluding motorcycles’
31 Manufactures of furniture;
16 Manufactures of products of wood and cork, except furniture; manufacture of articles of straw and plaiting materials;
24 Manufactures of metals;
20 Manufactures of chemicals and chemical products;
28 Manufactures of machinery and equipment not elsewhere classified;
11 Manufactures of beverages;
22 Manufactures of rubber and plastic products;
27 Manufactures of electrical equipment;
25 Manufactures of fabricated metal products, except machinery and equipment;
17 Manufactures of paper and paper products.
At the level of micro-structures (262 PKD classes), medium enterprises have an advantage in the group of “leaders”, and they perform better in the group of “outsiders” than small entities, which confirms the results at a meso-structure level (also with reference to pattern II and pattern III). However, the level of micro-structures is characterised by a greater variability of ranking positions (small entities: VRP = 25.2, medium entities: VRP = 13.1), but also in this case the microstructure of medium enterprises deserves a higher assessment (Table 1).

4.4. Competitiveness Profiles

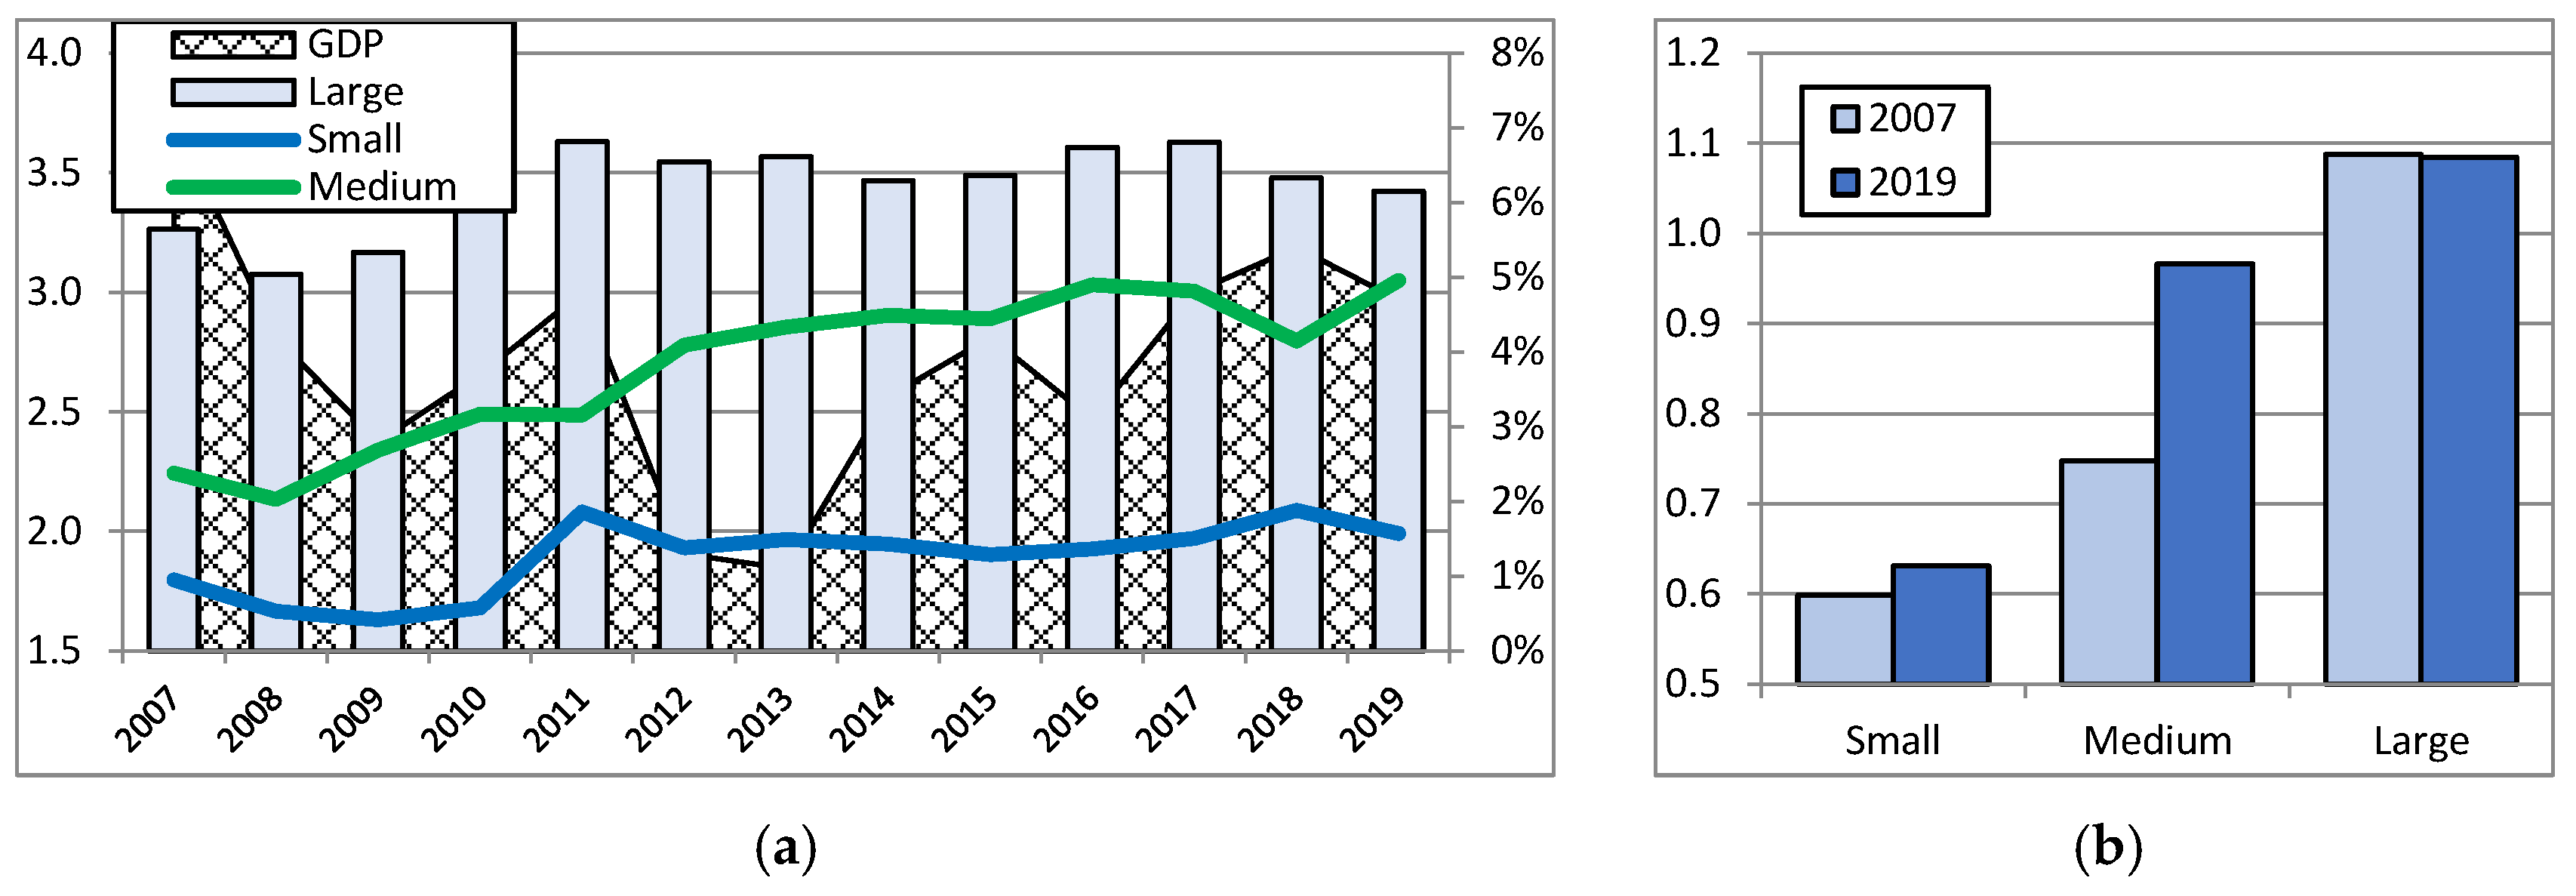
The competitiveness profiles of small and medium enterprises point to clear differences between these groups, which also applies to large enterprises. Large entities are characterised by the highest CM values, relative stability (especially after 2012), and record a slightly increasing trend, which paused in 2018–2019 (ARC = 0.4%, SD = 4.9%). CM values are the lowest for small entities, which record a positive trend in 2007–2019 (ARC = 0.9%, SD = 7.7%). Medium enterprises are characterised by greater dynamics (ARC = 2.6%) but also greater variability (SD = 11.2%). In the period of 13 years, proportions between SMEs and all enterprises improved, especially in the case of medium entities, which became closer to large enterprises (CM from 68.8% in 2007 to 89.8% in 2019). The above-average level of competitiveness, however, applied only to large enterprises. Such phenomena occurred in the context of changes in the entire economy, which was characterised, as of 2014, by a mid-term rising trend (Figure 9).
As already discussed, the meso-structure (PKD divisions) indicates diversified profiles for the classes of enterprises by size in terms of the impact of competitiveness partial measures (PL, PE). In the context of the average ranking position (ARP) and its variability (VRP)—the determinants of the classification of PKD divisions—there are certain differences among profiles. This issue requires further research. It should be stressed here that, generally, the degree of similarity of the meso-structures of small and medium enterprises in terms of ARP is high (TMS = 0.91), and lower in terms of VRP (TMS = 0.80)—small entities are characterised by slightly greater relocations of PKD divisions on ranking lists (SD = 22.4%) as compared with medium entities (SD = 19.8%) (Figure 10).
The further analysis focuses on normative patterns, and the comparison of meso-structures points to a great similarity between small and medium entities (TMS = 0.86). Normative pattern matches occur in 58.1% of PKD divisions.
The lack of matches between small and medium entities in 8/13 PKD divisions relates to positive differences—the number of negative differences is smaller (5/13). Among eight positive pattern differences, not a single one is explicitly positive (pattern IV in relation to I)—all of them indicate a more favourable position under one of the two criteria for identifying patterns (ARP or VRP). Among five negative differences, not a single one is explicitly negative (pattern I in relation to IV), and each of them indicates a worse position according to one of the two above mentioned criteria (Figure 11).
The advantage of positive differences indicates a higher assessment of the meso-structure of medium enterprises, which is also confirmed by its lower variability as well as lower representation in pattern IV, which is characterised by the lowest results (low ranking positions and their high changeability).
With regard to the level of micro-structures (262 PKD classes), the degree of pattern match for small and medium enterprises is 49.2% (TMS = 0.75)—lower than at the level of meso-structures. In most cases, the difference between patterns is positive (58.8%) but to a smaller degree than at the level of meso-structures. Generally, the results of the analysis of micro-structures confirm those for meso-structures, with a more positive assessment given to the micro-structure of medium enterprises. The obtained results require further analyses (Figure 12).
Briefly signalling an entry into detailed microeconomic analysis, the shaping of basic descriptive statistics in small and medium-sized enterprises is presented here. This area of analysis will be further explored. The results already obtained reinforce the analysis conducted above, mainly concerning competitiveness profiles.
In small-sized enterprises, the direction of change among those with relatively highest (9th decile D9 - 1.9%) and average levels of competitiveness (CM + 14.1%) was inconsistent. The value of the measure of differentiation decreased (DF - 8.2%) due to the faster growth of D9 than D1. The variability level also decreased (SD - 35.8%). These changes were reflected in the previously shown increase in density measure (DM). The correlation of SD with mean value was strong and inverse (−0.78)—an increase in CM was accompanied by a decrease in its variability. The dynamics of decile changes took a fading curve, with a slight decrease in D8 and D9 values. For the most part, the inter-decile ranges decreased, so in general the differences between companies included in particular deciles decreased. The decile distribution indicates relatively high D9 values, which determine the mean values.
In general, the descriptive statistics of medium-sized enterprises were different in their nature and meaning from the statistics of small enterprises. First, the direction of changes among enterprises with the relatively highest (D9) and average CM level was compatible but had different dynamics (4.3% and 22.3%, respectively). Second, the SD and DF decreased and the variability level (SD) was much higher than in small-sized enterprises. Third, the inter-decile ranges mostly increased, and the dynamics of decile changes were positive with a flattened curve (lower dynamics for the highest deciles). Fourth, the range of values between D9 and D8 is not significantly wider than the others and narrower than for D2-D1 (Figure 13).

5. Discussion

Because of the pioneering character of the conducted research (the developed model and the coverage of the entire population of SMEs), reference to the results of other studies is not fully reliable. Therefore, it will take time to publicise the model itself and the results of its application, and to subject them to a comparative analysis [69,70].
The discussion of the results of the study is based on the inductive reasoning, which starts with primary competitiveness factors [71,72,73,74] and ends with synthetic conclusions in the form of profiling SMEs, including an emphasis on a more favourable position of small or medium-sized enterprises [75,76].

5.1. Primary Factors

CM competitiveness is determined by four primary factors: export activity (EA), overall cost productivity (GE), unit cost of labour (LC), and unit efficiency of labour (LE).
Generally, the manner and degree of the use of EA and GE factors favour medium enterprises. The opening up to external markets is considerably greater, and it systematically increases. Moreover, their share of participation in international trade is larger, with exports exceeding imports. Simultaneously, much attention is given to ensuring the productivity of total costs. Moreover, medium enterprises are more homogenous in the long run in terms of the use of EA and GE factors.
Generally, despite certain differences in the way and extent of use, LC and LE factors are applied by SMEs in a similar manner. Both size classes face the problem of systematically increasing unit costs of labour [77] under the conditions of domestic labour shortage and the necessity to attract foreign workers [78]. Moreover, both classes face the challenge of low unit efficiency of labour and its pace, which is lower than the pace of an increase in labour costs. All these factors have a negative impact on the process of building effectiveness.

5.2. Major Factors

Primary factors EA and GE determine the CM model’s cost productivity in regard to export (PE), and the two other variables (LE and LC) determine productivity of labour cost stream (PL).
In small, and, in particular, in medium enterprises, the achieved level of competitiveness relies on developing export activities (an exogenous factor gaining in significance) and their effectiveness (PE), benefiting from comparative differences in costs, especially labour costs [79]. These differences, similarly to demographic favourable trends, are no longer of any significance in Poland, which indicates that such factors will be ineffective in overcoming development barriers in the future, thus posing a threat of the middle income trap.
The second factor (an endogenous factor, i.e., PL) was undervalued and its share was very low, having no impact on SMEs’ competitiveness. Moreover, this impact has decreased in the recent years under the conditions of systemic labour shortage and increased labour costs [80]. Therefore, efforts should be made to increase labour productivity, e.g., the departure from the use of extensive in favour of intensive factors (development and increased use of technology) [81] (p. 39), [82]. Unfortunately, Poland has a small and slowly increasing share of the export of high-tech products, due to underinvestment in R&D and, particularly, the SME sector.
The final analysed feature of the SME sector is its homogeneity. The density of population of small enterprises has increased by more than a half. It indicates that they have become similar in terms of the use of competitiveness factors, making competition more intense. It mainly applies to the use of productivity of the labour cost stream (PL). Such changes are not visible in medium enterprises, which points to their better development opportunities—the possibilities to introduce changes and increase competitiveness through diversifying its factors.

5.3. Structures

At the level of SME macrostructures, much attention is given to the Manufacturing section [83]. This area is characterised by higher than average and increasing competitiveness levels. On the other hand, a rapid decline in competitiveness is recorded in Electricity, gas, and steam, etc., particularly in small companies. This is caused by the competition of the expanding corporate structures of large companies, which implement centralization policies in this sector, supported by government policies [84].
At a meso level (aggregation into PKD divisions), medium enterprises are characterised by a more stable competitive position as compared with small entities. It results from the dominance of medium enterprises in the group of “leaders” and their low presence in the group of “outsiders”. It indicates that medium enterprises hold higher and more stable ranking positions (lower variability), which ensures greater stability in building competitiveness.
At a micro level (aggregation into PKD classes), medium enterprises receive higher assessments. This results not only from their dominance in the group of “leaders” but a 50% lower changeability (higher stability) of medium enterprises’ structure. Moreover, the study confirms the coherence of general competitiveness-related characteristics at a micro and meso level. This is an incentive to rely exclusively on meso analyses when it is not always possible to carry out micro analyses, which are time-consuming, labour-intensive, and require a wider range of data, which are often delayed in terms of their availability.

5.4. Profiles

The current winners in a competition race for building a competitive advantage in the SME sector are medium enterprises. First, their level of competitiveness, as compared with small entities, is higher by more than 40%. Second, they have not only improved their position with regard to the average level (for all enterprises), but they have almost achieved this level. It is true that large companies [85] are characterised by higher than average competitiveness, but it is also a fact that they “got stuck” and have not made any progress for the past 13 years. Therefore, medium dynamically competing enterprises have a chance to catch up with the leaders.
A crucial role in profile assessment is played by the classification of enterprises based on normative patterns, which are simultaneously determined by average ranking position and its variability. The level of compliance of normative patterns at a meso level is higher than at a micro level, but it is below ½. Hence the significance has not only the extent but also the nature of the degree of non-compliance. In simple terms, it is the difference between the opposite patterns which assign “good” or “bad” features to enterprises belonging to the same structural object—a division or PKD class [86]. The difference between small and medium enterprises is usually positive, which indicates that medium enterprises are characterised by the dominance of “good” features. Their profile is dominated by the structures of enterprises, which simultaneously hold higher than average competitive positions characterised by lower than average variability (a higher level of stability).
The summary assessment of the competitiveness of small and medium enterprises according to the results obtained and their discussion is presented in a consolidated table (Table 2).

6. Conclusions

Synthesizing the results of the assessment of competitiveness, its factors, and their mutual relationships, the four research hypotheses posed were positively verified, explained by key identified characteristics of small and medium production enterprises, presented as the results of the detailed analysis, and then discussed.
These key characteristics of the competitiveness of the SMEs sector, towards the indication of the advantage of the size class of enterprises belonging to this sector, should be highlighted:
  • Despite belonging to the same sector (SME), small and medium enterprises represent different levels of competitiveness, and the intensity of changes varies in the course of time:
    Based on this characteristic, the more advantageous position was obtained by medium-sized enterprises;
  • Increased competitiveness in both groups of companies results from export activities rather than an increase in labour productivity:
    Based on this characteristic, the more advantageous position was obtained by medium-sized enterprises;
  • Changes in meso- and micro-structures are characterised by a greater density of objects and their increasing stability in ranking positions:
    Based on this characteristic, the more advantageous position was obtained by medium-sized enterprises.
Following the positive proof of the partial hypotheses, the main conclusion of the research should be stated as:
  • In the context of great similarities between small and medium enterprise profiles in terms of their normative competitiveness patterns, the results of the analysis of the existing differences are in favour of medium enterprises.
Regarding limitations in the interpretation of research results, first, it should be pointed out that there is no problem of generalisation of the identified regularities. This is due to the fact that the study examined all manufacturing SMEs in Poland covered by public statistics (no representative sample problem). The limitation for each research is the method used. The literature review provided a conclusion that the ambiguity of the competitiveness definition is transferred to its evaluation, in which theoretical measures are much more broadly defined than the possibilities of their application in practice. Both partial and multivariate measures are used. These last most often use two approaches to evaluate competitiveness, assessing changes in efficiency (total productivity, unit, and labour cost productivity) and changes of export share ratios. In the conducted research, a combination of these two approaches was made using a statistical procedure (distance from the anti-pattern). Obviously, another procedure may provide different results, but it can be hypothesized that the general proportions and trends should not differ significantly.
The added value of the research is to reduce the lack of competitiveness analysis simultaneously at the level of macro-, meso-, and micro-structures, ensuring the comparability of assessments. The article proposes an integrated model for measuring competitiveness in terms of its factors (efficiency and export). This model allows for greater simplicity and quickness of analysis. It is universal and can be applied both by an individual company and the government for economic policies. The measurement of competitiveness is based on a financial approach, which integrates many different categories into one dimension. Moreover, the data that support the model are highly standardized and based on financial reports. Thus, it can be used internationally in any situation, as long as financial reporting rules are followed. Furthermore, the model does not require a survey of enterprises and can be powered by data from official statistics.
The conducted research provides a base for further and fully-fledged analyses of enterprises (objects), groups of entities, as well as sub-structures. Each group or individual object can be the subject of competitiveness factor analysis—a field for further studies. Further studies should be based on multivariate in-depth analyses of specific (subject and type) activities of enterprises. An especially important observation will be the assessment of changes in the competitiveness of enterprises, and its structures and profiles, during the pandemic period (which is no longer just a short-term aberration). However, this requires the collection of data for at least a three-year period of analysis. Thus, the article will have further continuation as an analysis of the pre- and post-pandemic period [87].

Funding

This research and publication was funded by a subvention granted to the Cracow University of Economics.

Institutional Review Board Statement

Not applicable.

Informed Consent Statement

Not applicable.

Data Availability Statement

Restrictions apply to the availability of these data. Data were obtained from: GUS Warszawa (Statistical Head Office in Warsaw)—data bases are of limited access and are available (Statistics Poland Databases. Available online: https://stat.gov.pl/en/databases/ accessed on 30 November 2021) with the fee and permission of GUS, Warsaw; Pont Info Warsaw (Poland), Gospodarka SŚDP—commercial data bases are available (Gospodarka SŚDP. Available online: http://baza.pontinfo.com.pl/index.php accessed on 25 November 2021) with the fee and permission of Pont Info, Warsaw; Coface for Trade, Warsaw—commercial data bases are available (Analizy ekonomiczne. Available online: https://www.coface.pl/Analizy-ekonomiczne accessed on 30 November 2021) with the fee and permission of Coface for Trade, Warsaw.

Conflicts of Interest

The author declare no conflict of interest. The funders had no role in the design of the study; in the collection, analyses, or interpretation of data; in the writing of the manuscript, or in the decision to publish the results.

References

  1. Kaczmarek, J. Mezostruktura Gospodarki Polski w Okresie Transformacji. Uwarunkowania, Procesy, Efektywność (Mesostructure of the Polish Economy during Transformation. Determinants, Processes, Efficiency); Difin Press: Warszawa, Poland, 2012; pp. 81–91, 103–126. [Google Scholar]
  2. Pech, M.; Vrchota, J. Classification of Small- and Medium-Sized Enterprises Based on the Level of Industry 4.0 Implementation. Appl. Sci. 2020, 10, 5150. [Google Scholar] [CrossRef]
  3. Aguilar-Fernández, M.E.; Otegi-Olaso, J.R. Firm Size and the Business Model for Sustainable Innovation. Sustainability 2018, 10, 4785. [Google Scholar] [CrossRef] [Green Version]
  4. Kim, S. Sustainable Growth Variables by Industry Sectors and Their Influence on Changes in Business Models of SMEs in the Era of Digital Transformation. Sustainability 2021, 13, 7114. [Google Scholar] [CrossRef]
  5. Gherghina, Ș.C.; Botezatu, M.A.; Hosszu, A.; Simionescu, L.N. Small and Medium-Sized Enterprises (SMEs): The Engine of Economic Growth through Investments and Innovation. Sustainability 2020, 12, 347. [Google Scholar] [CrossRef] [Green Version]
  6. Zoephel, M.; Zapf, M. Michael Porter’s Competitive Advantage Theory: Focus Strategy for SMEs; GRIN Verlag: Munchen, Germany, 2011; pp. 1–40. [Google Scholar]
  7. Jalagat, R. The Impact of Change and Change Management in Achieving Corporate Goals and Objectives: Organizational Perspective. Int. J. Sci. Res. 2016, 5, 1233–1239. Available online: https://www.ijsr.net/get_abstract.php?paper_id=ART20163105 (accessed on 1 January 2022).
  8. Asikhia, O.; Nneji, N.; Olafenwa, A.; Owoeye, O. Change Management and Organisational Performance: A Review of Literature. Int. J. Adv. Eng. Manag. 2021, 3, 67–69. [Google Scholar] [CrossRef]
  9. Clarke, L. The Essence of Change; Prentice Hall: Hoboken, NJ, USA, 1994; pp. 20–35. [Google Scholar]
  10. Waverman, L. A critical analysis of Porter’s framework on the competitive advantage of nations. In Beyond the Diamond; Rugman, A.M., Van Den Broec, J., Verbeke, A., Eds.; Emerald Group Publishing Limited: Bingley, UK, 1995; pp. 67–95. [Google Scholar] [CrossRef]
  11. Nazarczuk, J.M. Wybrane aspekty konkurencyjności polskiej gospodarki (Some Aspects of Competitiveness of the Polish Economy). In Konkurencyjność Gospodarki Polski (Competitiveness of the Polish Economy); Balcerzak, A.P., Rogalska, E., Eds.; Wydawnictwo A. Marszałek: Toruń, Poland, 2008; pp. 25–35. [Google Scholar]
  12. Krugman, P.R.; Obstfeld, M.; Melitz, M. International Economics; Prentice Hall: New York, NY, USA, 2014; pp. 122–150. [Google Scholar]
  13. Kaczmarek, J. Intensywność i efekty transformacji gospodarczej (Intensity and Effects of Economic Transformation). Przegląd Organ. 2016, 10, 62–71. Available online: http://www.przegladorganizacji.pl/przeglad-organizacji-102016/m/78 (accessed on 10 November 2021). [CrossRef]
  14. Reynauld, A.; Vidal, J.P. Labour Standards and International Competitiveness: A Comparative Analysis of Developing and Industrialized Countries; E. Elgar Publishing: Cheltenham, UK, 1998; p. 59. [Google Scholar]
  15. Frischtak, C. Manufacturing, Competitiveness: Concept, Measurement Policies. In Competition and the World Economy UNIDO; Sercovich, F., Ahn, C.-Y., Frischtak, C., Mrak, M., Muegge, H., Peres, W., Eds.; E. Elgar Publishing: Northampton, UK, 1999; pp. 85–95. [Google Scholar]
  16. Stankiewicz, M.J. Istota i sposoby oceny konkurencyjności przedsiębiorstwa (Essence and Methods of Evaluation of Enterprise Competitiveness). Gospod. Nar. 2000, 7–8, 95–111. Available online: https://gnpje.sgh.waw.pl/Istota-i-sposoby-oceny-konkurencyjnosci-przedsiebiorstwa,113968,0,2.html (accessed on 10 November 2021). [CrossRef]
  17. Dunford, M.; Smith, A.; Tsoukalis, L.; Hall, R.; Louri, H.; Rosenstock, M. Competition, Competitiveness and Enterprise Policies. In Competitiveness and Cohesion in EU Policies; Hall, R., Smith, A., Tsoukalis, L., Eds.; Oxford University Press: Oxford, UK, 2001; pp. 109–146. [Google Scholar]
  18. Obłój, K. Strategia Organizacji. W Poszukiwaniu Trwałej Przewagi Konkurencyjnej (Strategy of Organization. In Search of Permanent Competitive Advantage); PWE Press: Warszawa, Poland, 1998; p. 58. [Google Scholar]
  19. Feenstra, R.C. (Ed.) Trade Policies for International Competitiveness; The University of Chicago Press: Chicago, IL, USA; London, UK, 1989; pp. 1–2. [Google Scholar]
  20. Capobianco-Uriarte, M.; Casado-Belmonte, M.; Marín-Carrillo, G.; Terán-Yépez, E. Bibliometric Analysis of International Competitiveness (1983–2017). Sustainability 2019, 11, 1877. [Google Scholar] [CrossRef] [Green Version]
  21. Klenow, P.J.; Rodríguez-Clare, A. Economic growth: A review essay. J. Monet. Econ. 1997, 40, 597–617. [Google Scholar] [CrossRef]
  22. Sen, S. International Trade Theory and Policy: A Review of the Literature. Levy Econ. Inst. Work. Pap. Ser. 2010, 635, 1–24. [Google Scholar] [CrossRef] [Green Version]
  23. Krafft, J. The Process of Competition; p. 1. Available online: https://hal.archives-ouvertes.fr/hal-00212278/document (accessed on 10 November 2021).
  24. Skoorka, B. Measuring Market Distortion: International Comparisons, Policy and Competitiveness. Appl. Econ. 2000, 32, 253–264. [Google Scholar] [CrossRef]
  25. Stonehouse, G.; Snowdon, B. Competitive Advantage Revisited: Michael Porter on Strategy and Competitiveness. J. Manag. Inq. 2007, 16, 256–273. [Google Scholar] [CrossRef]
  26. Sołoducho-Pelc, L.; Sulich, A. Between Sustainable and Temporary Competitive Advantages in the Unstable Business Environment. Sustainability 2020, 12, 8832. [Google Scholar] [CrossRef]
  27. Huggins, R.; Izushi, H. Competition, Competitive Advantage, and Clusters: The Ideas of Michael Porter; Oxford University Press: Oxford, UK, 2012; pp. 32–47. [Google Scholar] [CrossRef]
  28. Dzemydaitė, G. The Impact of Economic Specialization on Regional Economic Development in the European Union: Insights for Formation of Smart Specialization Strategy. Economies 2021, 9, 76. [Google Scholar] [CrossRef]
  29. Cooper, R.N. Industrial Policy and Trade Distortion: A Policy Perspective. In Protection, Cooperation, Integration and Development; El-Agraa, A.M., Ed.; Palgrave Macmillan: London, UK, 1987; pp. 37–69. [Google Scholar] [CrossRef]
  30. Costinot, A.; Donaldson, D. Ricardo’s Theory of Comparative Advantage: Old Idea, New Evidence. Am. Econ. Rev. 2012, 102, 453–458. [Google Scholar] [CrossRef]
  31. Lebert, D.; El Younsi, H. International Specialization Dynamics; Wiley-ISTE: London, UK, 2017; pp. 120–131. [Google Scholar]
  32. Amable, B. International specialisation and growth. Struct. Change Econ. Dyn. 2000, 11, 413–431. [Google Scholar] [CrossRef]
  33. Corsi, M. Division of Labour. Technical Change and Economic Growth; Gower Publishing: Brookfield, WI, USA, 1991; p. 138. [Google Scholar]
  34. Mosley, H.; Smith, G. Public Services and Competitiveness. In European Competitiveness; Hughes, K.S., Ed.; Cambridge University Press: Cambridge, UK, 1993; pp. 200–231. [Google Scholar] [CrossRef]
  35. Balassa, B. Economic Integration. In The World of Economics; Eatwell, J., Milgate, M., Newman, P., Eds.; The New Palgrave. Palgrave Macmillan: London, UK, 1991; pp. 176–186. [Google Scholar] [CrossRef]
  36. Jensen, C.A. The Staged Competition Innovation Theory. J. Open Innov. Technol. Mark. Complex. 2021, 7, 201. [Google Scholar] [CrossRef]
  37. Klepper, G.; Weiss, F.D. Protection and International Competitiveness: A View from West Germany. In International Productivity and Competitiveness; Hickman, B.G., Ed.; Oxford University Press: New York, NY, USA, 1992; pp. 362–369. [Google Scholar]
  38. Feng, Z.; Luo, N.; Liu, Y. Trade-in Strategy and Competition between Two Independent Remanufacturers. Int. J. Environ. Res. Public Health 2021, 18, 6745. [Google Scholar] [CrossRef]
  39. Lall, S. Competitiveness Indices and Developing Countries: An Economic Evaluation of the Global Competitiveness Report. World Dev. 2001, 29, 1501–1525. [Google Scholar] [CrossRef]
  40. Berger, T.; Bristow, G. Competitiveness and the Benchmarking of Nations? A Critical Reflection. Int. Adv. Econ. Res. 2009, 15, 378–392. [Google Scholar] [CrossRef]
  41. Belton, P. An Analysis of Michael E. Porter’s Competitive Strategy; Macat Library: London, UK, 2017; pp. 44–62. [Google Scholar]
  42. Wu, Y.; Wang, J.; Chen, L. Optimization and Decision of Supply Chain Considering Negative Spillover Effect and Service Competition. Sustainability 2021, 13, 2320. [Google Scholar] [CrossRef]
  43. Xia, R.; Liang, T.; Zhang, Y.; Wu, S. Is Global Competitive Index a Good Standard to Measure Economic Growth? A Suggestion for Improvement. Int. J. Serv. Stand. 2012, 8, 45–57. [Google Scholar] [CrossRef]
  44. Boltho, A. The assessment: International competitiveness. Oxf. Rev. Econ. Policy 1996, 12, 1–16. [Google Scholar] [CrossRef]
  45. Dziembała, M. The Enhancement of Sustainable Competitiveness of the CEE Regions at the Time of the COVID-19 Pandemic Instability. Sustainability 2021, 13, 12958. [Google Scholar] [CrossRef]
  46. Širá, E.; Vavrek, R.; Kravčáková, V.I.; Kotulič, R. Knowledge Economy Indicators and Their Impact on the Sustainable Competitiveness of the EU Countries. Sustainability 2020, 12, 4172. [Google Scholar] [CrossRef]
  47. Dzikowska, M.; Gorynia, M. Teoretyczne aspekty konkurencyjności przedsiębiorstwa-w kierunku koncepcji eklektycznej (Theoretical Aspects of Enterprise Competitiveness-Towards an Eclectic Concept). Gospod. Nar. 2012, 4, 4–13. Available online: http://gospodarkanarodowa.sgh.waw.pl/p/gospodarka_narodowa_2012_04_01.pdf (accessed on 10 November 2021).
  48. Faulkner, D.; Bowman, C. Elements of Competitive Strategy; Teora: Bucharest, Romania, 2000; pp. 35–40, 44. [Google Scholar]
  49. Galli, G.; Pelkmans, J. (Eds.) Regulatory Reform and Competitiveness in Europe; E. Elgar Publishing: Cheltenham, UK, 2000; p. 20. [Google Scholar]
  50. Krugman, P.R. Import Protection as Export Promotion: International Competititionin the Presence of Oligopoly and Economies of Scale. In Rethinking International Trade; Krugman, P.R., Ed.; MIT Press: Cambridge, UK, 2000; pp. 185–198. [Google Scholar]
  51. Foss, N.J.; Mahnke, V. Strategy and the Market Process Perspective. Process of Competition; Edward Elgar: Aldershot, UK, 2002; pp. 1–30. [Google Scholar]
  52. Krafft, J. Introduction to the process of competition. In The Process of Competition; Krafft, J., Ed.; E. Elgar Publishing: Cheltenham, UK, 2000; pp. 4–5. [Google Scholar]
  53. McKiernan, P. (Ed.) Historical Evolution of Strategic Management; Taylor & Francis: London, UK; New York, NY, USA, 2017; p. 328. [Google Scholar]
  54. Porter, M.E. Competitive Strategy: Techniques for Analyzing Industries and Competitors; Simon and Schuster: New York, NY, USA, 2008; pp. 300–323. [Google Scholar]
  55. Magretta, J. Fast, Global and Entrepreneurial: Supply Chain Management, Hong Kong Style. Harv. Bus. Rev. 1998, 9–10, 103–114. Available online: https://hbr.org/1998/09/fast-global-and-entrepreneurial-supply-chain-management-hong-kong-style (accessed on 14 November 2019).
  56. Hamel, G.; Prahalad, C.K. The Core Competence of the Corporation. In Strategic Learning in a Knowledge Economy; Cross, R.L., Jr., Israelit, S.B., Eds.; Routledge: London, UK, 2011; pp. 3–22. [Google Scholar]
  57. Naisbitt, D.; Naisbitt, J. Mastering Megatrends: Understanding and Leveraging the Evolving New World; World Scientific: London, UK, 2017; pp. 84–179. [Google Scholar]
  58. De Vet, J.M.; Edwards, J.H.; Bocci, M. Blue Growth and Smart Specialisation: How to catch maritime growth through ‘Value Nets’. Jt. Res. Cent. Work. Pap. S3 Policy Brief Ser. 2016, 17, 2–25. Available online: https://s3platform.jrc.ec.europa.eu/documents/20182/154989/Blue+Growth+and+Smart+Specialisation.+How+to+catch+maritime+growth+through+%27Value+Nets%27/17053ed6-705f-4905-9963-c63a78df26bc (accessed on 14 November 2021).
  59. Best, M.H. Greater Boston׳s industrial ecosystem: A manufactory of sectors. Technovation 2015, 39–40, 4–13. [Google Scholar] [CrossRef]
  60. Hitt, M.A.; Ireland, R.D.; Sirmon, D.G. Managing firm resources in dynamic environments to create value: Looking inside the black box. Acad. Manag. Rev. 2007, 32, 273–292. [Google Scholar] [CrossRef]
  61. Cirik, K.; Makadok, R. First-Mover Advantages Versus First-Mover Benefits in Network-Based Industries. Acad. Manag. Annu. Meet. Proc. 2017, 1, 115–158. [Google Scholar] [CrossRef]
  62. Zinnes, C.; Eilat, Y.; Sachs, J. Benchmarking Competitiveness in Transition Economies. Econ. Transit. 2001, 9, 315–353. [Google Scholar] [CrossRef]
  63. Marsh, I.W.; Tokarick, S.P. Competitiveness Indicators. A Theoretical and Empirical Assessment. Int. Monet. Fund 1994, 29, 700–722. [Google Scholar] [CrossRef]
  64. Aiginger, K. Unit Value to Signal the Quality Position of CEECs (The Competitiveness of Transition Economies). OECD Proc. 1998, 93–121. Available online: http://ecsocman.hse.ru/data/944/674/1219/chap34.pdf (accessed on 20 November 2021).
  65. Zhang, D. Energy Finance: Background, Concept, and Recent Developments. Emerg. Mark. Financ. Trade 2018, 54, 1687–1692. [Google Scholar] [CrossRef] [Green Version]
  66. Lamont, O. Cash flow and investment: Evidence from internal capital markets. J. Financ. 1997, 52, 83–109. [Google Scholar] [CrossRef]
  67. Cheng, I.-H.; Xiong, W. The financialization of commodity markets. Rev. Financ. Econ. 2014, 6, 419–441. [Google Scholar] [CrossRef] [Green Version]
  68. Kweon, Y. Economic Competitiveness and Social Policy in Open Economies. Int. Interact. 2018, 44, 537–558. [Google Scholar] [CrossRef]
  69. Bartelsman, E.; Scarpetta, S.; Schivardi, F. Comparative analysis of firm demographics and survival: Micro-level evidence for the OECD countries. OECD Econ. Dep. Work. Pap. 2003, 348, 1–61. [Google Scholar] [CrossRef]
  70. SME Competitiveness Outlook 2020; International Trade Centre: Geneve, Switzerland, 2020. [CrossRef]
  71. Martin, R.L. A Study on the Factors of Regional Competitiveness; University of Cambridge: Cambridge, UK, 2004; Available online: http://ec.europa.eu/regional_policy/sources/docgener/studies/pdf/3cr/competitiveness.pdf (accessed on 14 November 2021).
  72. Choudhri, E.U.; Schembri, L.L. Productivity Performance and International Competitiveness: An Old Test Reconsidered. Can. J. Econ./Rev. Can. D’Economique 2002, 35, 341–362. Available online: http://www.jstor.org/stable/3131950 (accessed on 20 November 2021). [CrossRef]
  73. Taçoğlu, C.; Ceylan, C.; Kazançoğlu, Y. Analysis of variables affecting competitiveness of SMEs in the textile industry. J. Bus. Econ. Manag. 2019, 20, 648–673. [Google Scholar] [CrossRef] [Green Version]
  74. Wisenthige, K.; Guoping, C. Firm Level Competitiveness of Small and Medium Enterprises (SMEs): Analytical Framework Based on Pillars of Competitiveness Model. Int. Res. J. Manag. IT Soc. Sci. 2016, 2, 51–56. [Google Scholar] [CrossRef] [Green Version]
  75. Hall, B.H. The Relationship Between Firm Size and Firm Growth in the US Manufacturing Sector. J. Ind. Econ. 1987, 35, 583–606. [Google Scholar] [CrossRef]
  76. Elston, J. An Examination of the Relationship Between Firm Size, Growth and Liquidity in the Neuer Markt. SSRN Electron. J. 2002, 2, 1–25. [Google Scholar] [CrossRef]
  77. Sipa, M.; Gorzeń-Mitka, I.; Skibiński, A. Determinants of Competitiveness of Small Enterprises: Polish Perspective. Procedia Econ. Financ. 2015, 27, 445–453. [Google Scholar] [CrossRef] [Green Version]
  78. Aiginger, K.; Bärenthaler-Sieber, S.; Vogel, J. Competitiveness under New Perspectives. WWW Eur. Work. Pap. 2013, 44, 1–97. [Google Scholar] [CrossRef]
  79. Piatkowski, M. Factors Strengthening the Competitive Position of SME Sector Enterprises. An Example for Poland. Procedia-Soc. Behav. Sci. 2012, 58, 269–278. [Google Scholar] [CrossRef] [Green Version]
  80. Raport o Stanie Sektora Małych i Średnich Przedsiębiorstw w Polsce w 2019 Roku (Report on the Condition of the Small and Medium Enterprise Sector in Poland in 2019); PARP: Warszawa, Poland, 2019. Available online: https://www.parp.gov.pl/component/publications/publication/raport-o-stanie-sektora-malych-i-srednich-przedsiebiorstw-w-polsce-1 (accessed on 10 December 2021).
  81. Oslo Manual. The Measurement of Scientific and Technological Activities. Proposed Guidelines for Collecting and Interpreting Technological Innovation Data, 3rd ed.; OECD: Paris, France; Eurostat: Luxemburg, 2005; p. 39.
  82. Prasanna, R.; Jayasundara, J.; Gamage, S.K.N.; Ekanayake, E.; Rajapakshe, P.; Abeyrathn, G. Sustainability of SMEs in the Competition: A Systemic Review on Technological Challenges and SME Performance. J. Open Innov. Technol. Mark. Complex. 2019, 5, 100. [Google Scholar] [CrossRef] [Green Version]
  83. Kaczmarek, J. The Mechanisms of Creating Value vs. Financial Security of Going Concern-Sustainable Management. Sustainability 2019, 11, 2278. [Google Scholar] [CrossRef] [Green Version]
  84. Sobczyk, E.J.; Kaczmarek, J.; Fijorek, K.; Kopacz, M. Efficiency and Financial Standing of Coal Mining Enterprises in Poland in Terms of Restructuring Course and Effects. Miner. Resour. Manag. 2020, 36, 127–152. [Google Scholar] [CrossRef]
  85. Kaczmarek, J. The concept and Measurement of Creating Excess Value in Listed Companies. Eng. Econ. 2018, 29, 1392–2785. [Google Scholar] [CrossRef] [Green Version]
  86. Fijorek, K.; Denkowska, S.; Kaczmarek, J.; Náñez Alonso, S.L.; Sokołowski, A. Financial threat profiles of industrial enterprises in Poland. Oeconomia Copernic. 2021, 12, 463–498. [Google Scholar] [CrossRef]
  87. Adian, I.; Doumbia, D.; Gregory, N.; Ragoussis, A.; Reddy, A.; Timmis, J. Small and Medium Enterprises in the Pandemic: Impact, Responses and the Role of Development Finance. Policy Res. Work. Pap. World Bank 2020, 9414, 1–33. Available online: https://documents1.worldbank.org/curated/en/729451600968236270/pdf/Small-and-Medium-Enterprises-in-the-Pandemic-Impact-Responses-and-the-Role-of-Development-Finance.pdf (accessed on 10 December 2021).
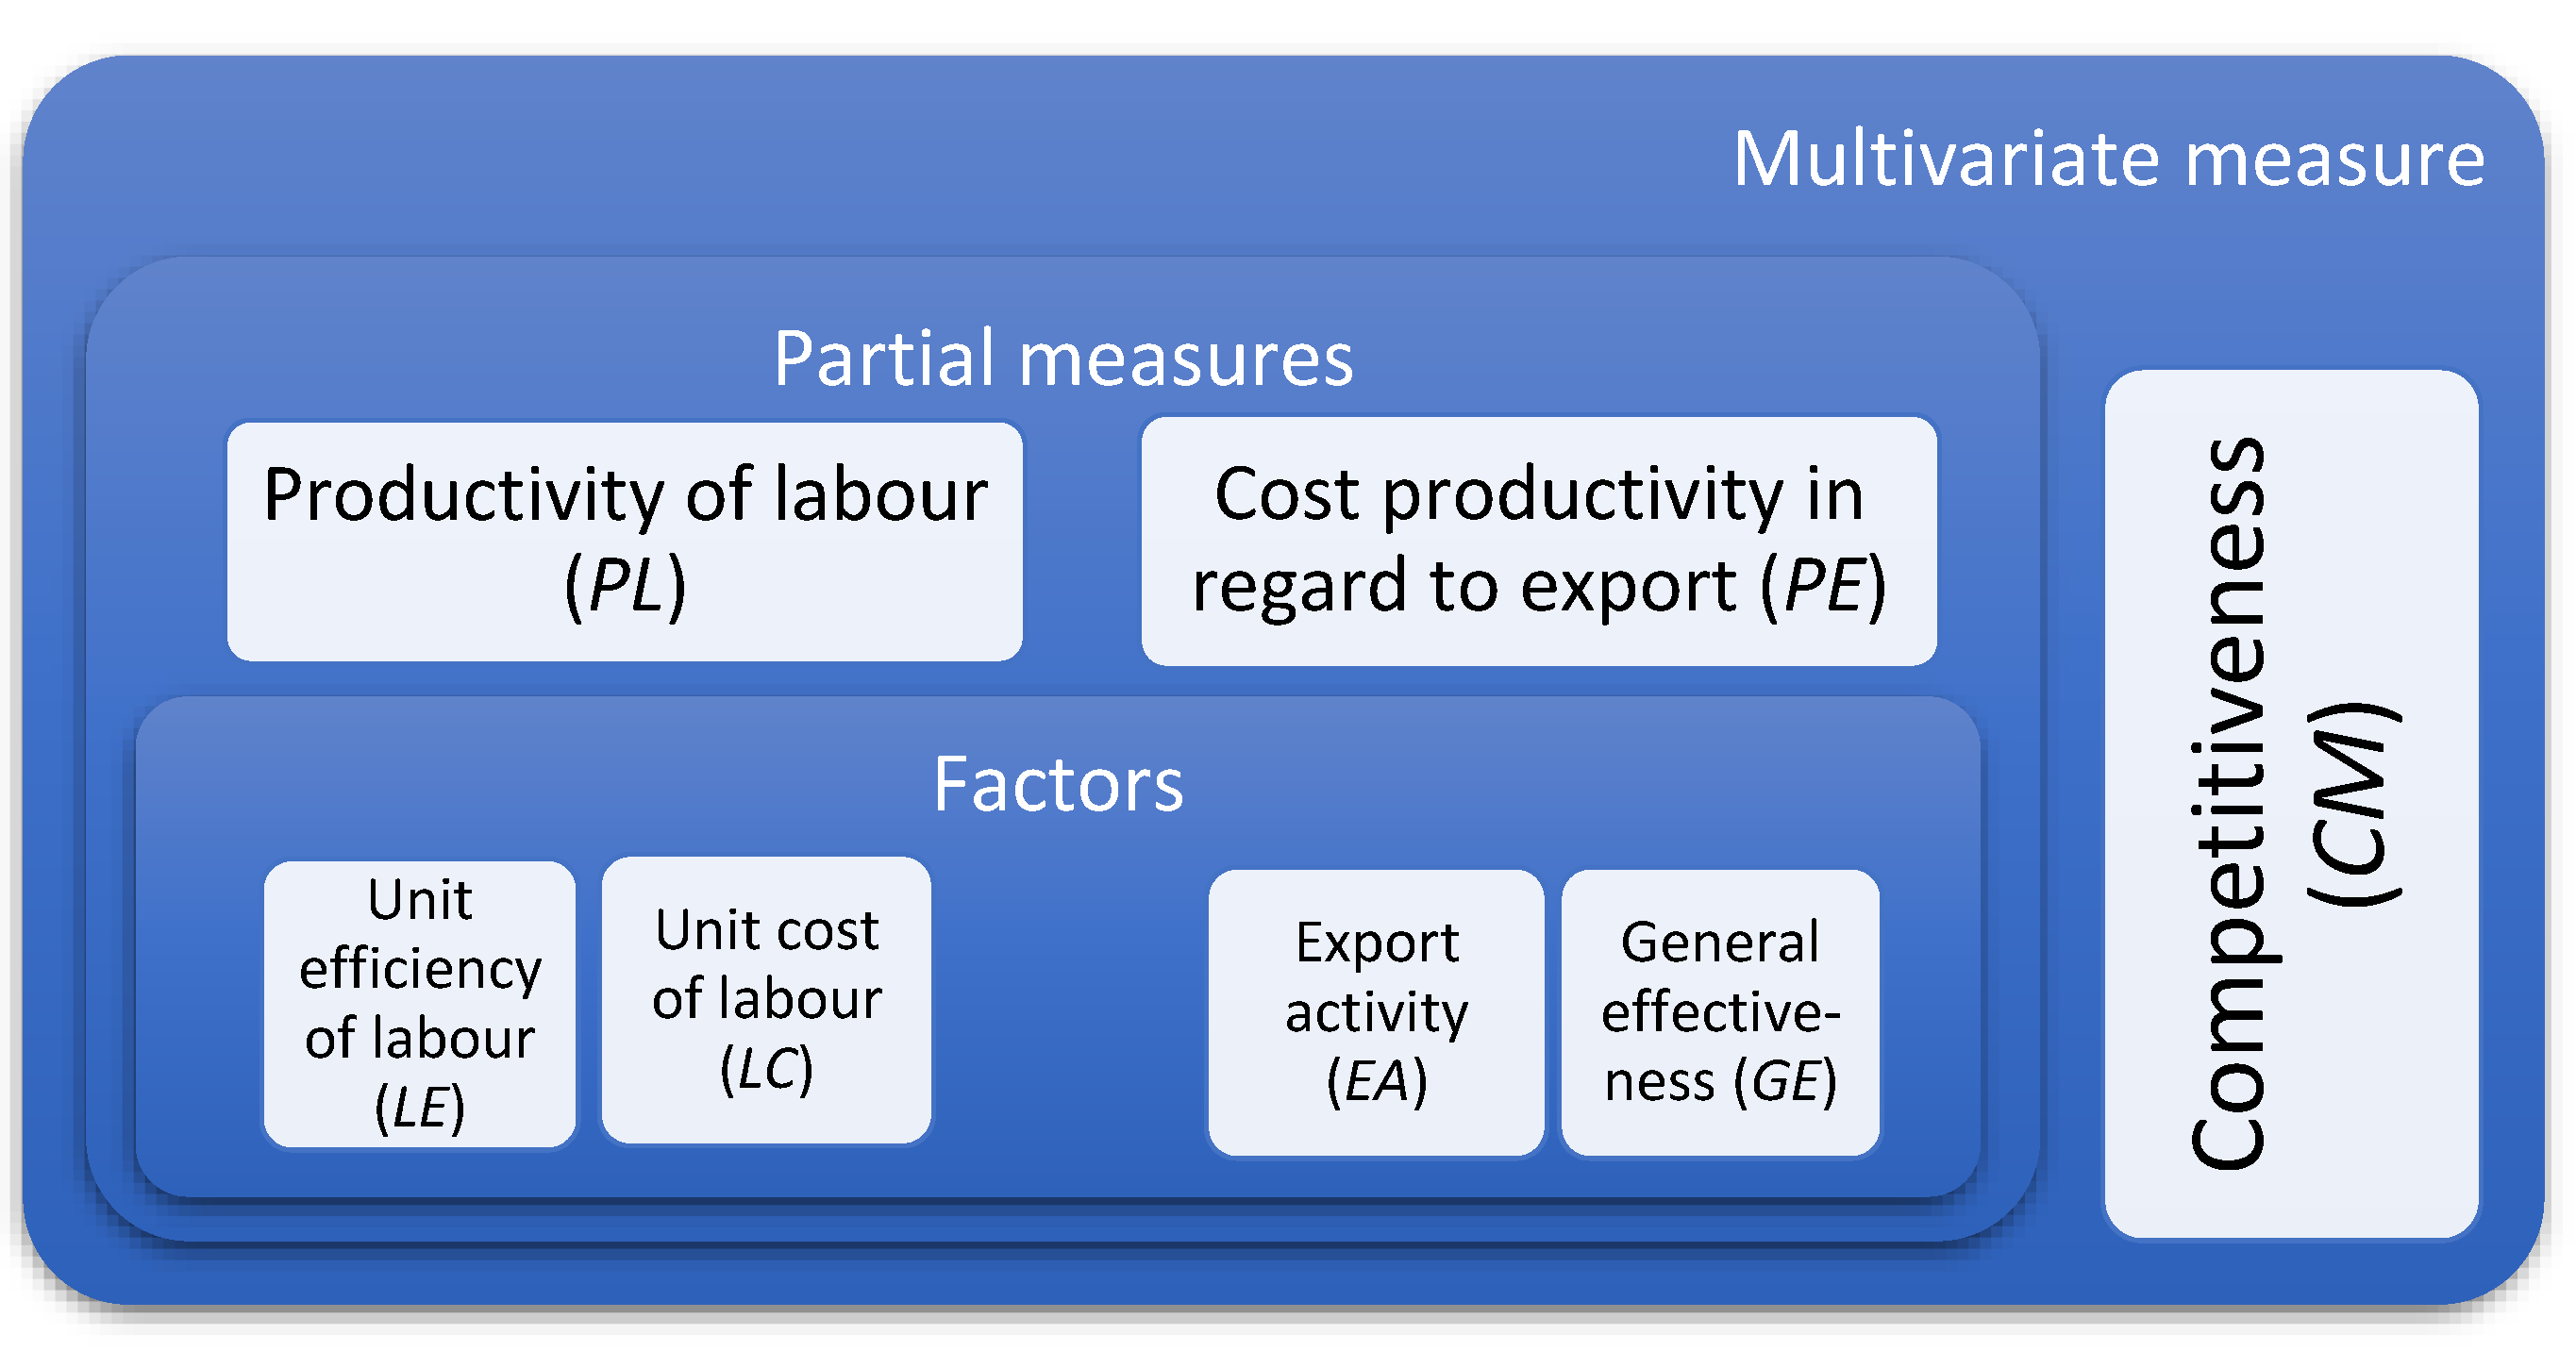
Figure 1. Structure of multivariate competitiveness measure CM. Source: author’s research.
Sustainability 14 01788 g001
Figure 2. (a) Productivity factors of PE in small and medium production enterprises in 2007–2019; (b) Export (EA), and import activity (IMA) in small and medium production enterprises in 2007–2019. Note: measure values are dimensionless. GE, GS, EA/GE—right axis. EA/GE—overtaking rate. Source: author’s research based on GUS in Warsaw (Statistical Head Office in Warsaw, Poland)—data bases of limited access; Pont Info Warsaw—Gospodarka SŚDP, and Coface for Trade, Warsaw—commercial data bases.
Sustainability 14 01788 g002
Figure 3. (a) Productivity factors of PL in small production enterprises in 2007–2019; (b) Productivity factors of PL in medium production enterprises in 2007–2019. Note: dimensionless values. LC—right axis. Source: as in Figure 2.
Sustainability 14 01788 g003
Figure 4. (a) Competitiveness measure CM and its factors in small and medium production enterprises in 2007–2019; (b) The path of the central point for the population of small and medium production enterprises in 2007–2019. Note: standardised values. PL—right axis. Source: as in Figure 2.
Sustainability 14 01788 g004
Figure 5. (a) Density of objects (the main part of the population) in terms of PE and PL in small production enterprises in 2007–2019; (b) Density of objects (the main part of the population) in terms of PE and PL in medium production enterprises in 2007–2019. Note: PKD classes (micro-structure and necessary anonymization of individual data). Standardised values. Source: as in Figure 2.
Sustainability 14 01788 g005
Figure 6. (a) Competitiveness measure CM for small production enterprises by PKD sections in 2007–2019; (b) Competitiveness measure CM for medium production enterprises by PKD sections in 2007–2019. Source: as in Figure 2.
Sustainability 14 01788 g006
Figure 7. (a) The ranking positions of PKD sections by CM values in small production enterprises in 2007–2019; (b) The ranking positions of PKD sections by CM values in medium production enterprises in 2007–2019. Note: PKD divisions 05, 06, and 07 are excluded from the analysis (statistical confidentiality). The shading corresponds to the rank position: from the first (white) to the last (black) position. Source: as in Figure 2.
Sustainability 14 01788 g007
Figure 8. (a) Structure of PKD divisions by CM normative patterns in small production enterprises in 2007–2019; (b) Structure of PKD divisions by CM normative patterns in medium production enterprises in 2007–2019. Source: as in Figure 2.
Sustainability 14 01788 g008
Figure 9. (a) Competitiveness measure (CM) by the size of production enterprises in 2007–2019; (b) Changes in proportions of competitiveness measure (CM) by the size in relation to the general level of production enterprises in 2007 and 2019. Source: as in Figure 2.
Sustainability 14 01788 g009
Figure 10. (a) The profiles of PKD divisions in terms of a average ranking position (ARP) based on CM for small and medium production enterprises in 2007–2019; (b) The variability of a ranking position (VRP) based on CM for small and medium production enterprises in 2007–2019. Note: as in Figure 7. Source: as in Figure 2.
Sustainability 14 01788 g010
Figure 11. The profiles of PKD divisions in terms of normative patterns based on competitiveness measure (CM) for small and medium production enterprises in 2007–2019. Note: (Y)—pattern match, (+) positive difference between patterns, (-) negative difference between patterns. Source: as in Figure 2.
Sustainability 14 01788 g011
Figure 12. The profiles of PKD classes in terms of normative patterns based on competitiveness measure CM for small and medium production enterprises in 2007–2019. Note: 53 PKD classes are excluded from the analysis (statistical confidentiality). Source: as in Figure 2.
Sustainability 14 01788 g012
Figure 13. (a) Time series of CM values, of deciles 1–9, for small and medium production enterprises in 2007–2019; (b) Change in decile (DD) and a inter-decile ranges (IDR) of CM values for small and medium production enterprises in 2007–2019; (c) Time series of CM values, 9th decile (D9), measure of differentiation (DF) and standard deviation (SD) for small and medium production enterprises in 2007–2019. Note: DD, SD—right axis, IDR—left axis. Source: as in Figure 2.
Sustainability 14 01788 g013
Table 1. Structure of PKD classes by CM normative patterns for small and medium production enterprises in 2007–2019.
ItemsPattern IPattern IIPattern IIIPattern IV
Small enterprises23.3%32.1%28.2%16.4%
Cut-off pointsARP = 131.0; VRP = 25.2
Medium enterprises31.7%21.5%36.0%10.8%
Cut-off pointsARP = 131.0; VRP = 13.1
Source: as in Figure 2.
Table 2. Summary results of competitiveness assessment of small and medium production enterprises in 2007–2019.
“Leaders” by Pattern“Outsiders” by PatternVariability of Rank Position (Divisions)Variability of Rank Position (Classes)
Small < Medium
(+36.1%)
Small > Medium
(+51.9%)
Small > Medium
(+22.4%)
Small > Medium
(+92.3%)
Density measure rateSmall
(61.5% extension along PL)
Medium
(19.1% balanced position PL/PE)
Position in sector (CM)Small
(63.0% of average)
Medium
(96.5% of average)
Multivariate measureCM
(competitiveness level)
Small < Medium
(+42.3%)
Partial measuresPL
(productivity of labour cost)
PE
(cost productivity in regard to export)
Small > Medium
(+22.4%)
Small < Medium
(+60.3%)
FactorsLE
(unit efficiency of labour)
LC
(unit cost of labour)
EA
(export activity)
GE
(overall cost productivity)
Small > Medium
(+10.1%)
Small < Medium
(+11.1%)
Small < Medium
(+60.9%)
Small ≈ Medium
Note: evaluation of the results: higher—green colour, lower—red colour. Source: as in Figure 2.
Publisher’s Note: MDPI stays neutral with regard to jurisdictional claims in published maps and institutional affiliations.