Article

Analysis of Crash Severity of Texas Two Lane Rural Roads Using Solar Altitude Angle Based Lighting Condition

by
Mohammadhossein Abbasi
1,
Cristiana Piccioni
2,
Grzegorz Sierpiński
3,* and
Iman Farzin
1
1
Faculty of Civil and Environmental Engineering, Tarbiat Modares University, Tehran 14115-111, Iran
2
Department of Civil, Building and Environmental Engineering, Sapienza University of Rome, 00184 Rome, Italy
3
Department of Transport Systems, Traffic Engineering and Logistics, Faculty of Transport and Aviation Engineering, Silesian University of Technology, 44-100 Gliwice, Poland
*
Author to whom correspondence should be addressed.
Sustainability 2022, 14(3), 1692; https://doi.org/10.3390/su14031692
Submission received: 23 December 2021 / Revised: 19 January 2022 / Accepted: 25 January 2022 / Published: 1 February 2022
(This article belongs to the Special Issue Road Safety and Better Mobility in Sustainable Urban Transport)

Abstract

:
Many studies have examined the impact of factors affecting accident severity in rural areas; however, little attention has been paid to different lighting conditions (LCs), and less to the detailed categories and precise determining of twilight. In this paper, solar altitude angle (SAA), as a basis for differentiating and categorizing LCs, is proposed to investigate explanatory variables in much greater detail. For each LC, namely, dark, twilight, dark lit (dark with street lights) and daylight, separate random parameter models are developed to investigate the impacts of some factors on crash injury severity data of 2017 and 2018 in two lane rural roads of Texas. The model estimation results indicated that different LCs have various contributing factors, indeed, to each injury severity, further stressing the significance of investigating crashes based on SAA. The key differences include crash location, marked lane, grade direction, no passing zone, shoulder width, weekday and collision type. The important findings were that developing artificial lighting at intersections and LED raised pavement markers on two lane rural roads could lead to enhanced road safety under dark LCs. Furthermore, increasing shoulder width in straight segments of two lane rural roads is important for decreasing severe injury in daylight conditions.

1. Introduction

Accidents are one of the main causes of fatality and disability in the world. Based on statistics, about 1.35 million persons die in road traffic crashes annually [1]. A total of 37,133 people are killed in motorized crashes in the United States, of which 46 percent (17,216) occurred in rural areas, while 19 percent of the population lived in rural areas in 2017 [2]. From the vehicle mile traveled (VMT) perspective, rural crashes are 2.5 times higher than urban crashes per 100 miles traveled [3]. All the above highlights how crucial is research into road crashes in rural areas. In general, accident analysis can also be conducted based on frequency or severity. However, the analysis of accident severities has more priority than accident frequencies regarding the nature of accidents, since it leads to a decrease in their number and intensity [4]. Hence, determining the most critical factors in motorized crashes could facilitate decision-making processes and enhance roads′ safety.
Many researchers have studied the critical factors in crash severity [5,6,7,8] and some focused on the effect of lighting conditions on crash severity [9,10,11,12,13,14,15,16]. Table 1 illustrates a selection of research conducted in this field, making it clear that lighting conditions influence injury severity. Based on previous studies, roadway lighting condition has been considered a significant factor in crash severity, and used as either a control variable or an explanatory variable. Most previous studies have considered the impact of different lighting conditions by dummy explanatory variables. For example, Islam, Jones and Dye used mixed logit models to explore the differential aspects of the crash severities of single vehicle and multivehicle large trucks in rural and urban roads. They found that dark, unlit conditions will increase the probability of major injuries in multivehicle crashes in urban locations [11]. Meanwhile, in studies by Rezapour, Moomen, and Ksaibati and Xie, Zhao, and Huynh, (2012), contradictory findings have been reported that show a reduction in injury severity likelihood in dark conditions [17,18]. For instance, Rezapour, Moomen, and Ksaibati analyzed the injury severity of downgrade crashes in single and multiple vehicle crashes between 2005 and 2015 in two lane highways of Wyoming. They found that dark and dark lit conditions decrease the likelihood of severe injury in multiple vehicle crashes [17]. Song et al. examined the related injury severity in four states, including California, Minnesota, North Carolina and Ohio, using Highway Safety Information System (HSIS) data. They used just a dummy variable for lighting. They concluded that the six most critical variables impacting the severity of hazardous material transportation crashes are fatigue/asleep, number of lanes, speeding, poor weather, and lighting [14]. In some other studies, twilight, as a transition zone between darkness and light, was determined to have a significant effect on the likelihood of crash severity [19,20,21,22]. Jalayer et al. employed a random parameters ordered probit to analyze the impacts of different factors on the injury severity of wrong way driving crashes. They revealed that dawn conditions lead to more severe injuries [19]. Another study investigated the crash data (2003–2006) of unsignalized intersections of Florida using probit models and found that the likelihood of fatal injuries significantly decreases in dawn conditions [20]. According to the mentioned studies, it seems that considering lighting conditions as an explanatory variable does not clearly indicate the effect of significant factors on the injury severity of crashes under different lighting conditions.
Moreover, several prior studies have investigated the specific effects of different lighting conditions (daylight, dark, and dark lit) on the injury severity of crashes [4,24,26,27]. For example, Anarkooli and Hosseinlou studied two lane rural road crashes of Washington between 2009 and 2011 in different lighting conditions. Crash location, speed limit, shoulder width, driver performance, and crash type were found as the heterogeneous variables in different lighting condition models (daylight, dark, and dark with street lights) [4]. In another study, Obeidat et al. evaluated the effectiveness of roadway lighting on night time crash reduction in Jordan before and after continuous lighting system installation. They used the crash data from 2009 to 2018 and a generalized linear model to examine the effects of driver information, road surface, weather condition, lighting condition, and time on crash injury severities on Jordan roadways [24].
In summary, it could be concluded that, in previous researches, generally, authors have investigated the influential factors in crash severity levels under different lighting conditions, such as daylight, dark, and dark lit, but they did not consider the condition of twilight. The possible reason is that they could not provide a precise definition of the twilight condition. In addition, as lighting conditions were categorized based on police reports, the results may not account for the relationship between lighting conditions and injury severity. Although most of the police reports that include dark and light conditions are reliable, it is challenging for them to identify the transition zone between darkness and daylight. In some cases, the twilight data might be attributed to dark or day. In this regard, this paper aims to propose solar altitude angle (SAA) to determine lighting conditions more precisely, and according to the necessary information for calculation of the SAA provided by police and other supplemental sources, lighting conditions would be determined in a more systematic way.
The present paper attempts to fill this knowledge gap by the segmentation of lighting conditions based on SAA as a systematic method for determining twilight as one of the four predefined lighting conditions. To accomplish this, the SAA at the moment of the crashes is calculated. Thus, the data are classified into four different lighting conditions based on SAA, namely, daylight (positive altitude), dark (negative altitude lower than −6), twilight (negative altitude higher than −6), and dark lit (night time with supplemental lighting). Finally, using the random parameter (mixed logit) model, factors affecting the severity of crashes were investigated more accurately in each lighting condition.
The remainder of this paper is structured as follows: Section 2 describes the methodology, Section 3 introduces the data, and Section 4 and Section 5 present the modeling process and data analysis, respectively. Finally, Section 6 outlines the crucial conclusions and some policy implications.

2. Methodology

The methodological approach is described in the following two sections. The former presents the SAA assessment using the crash position and occurrence time, while the latter explains the mixed logit modeling.

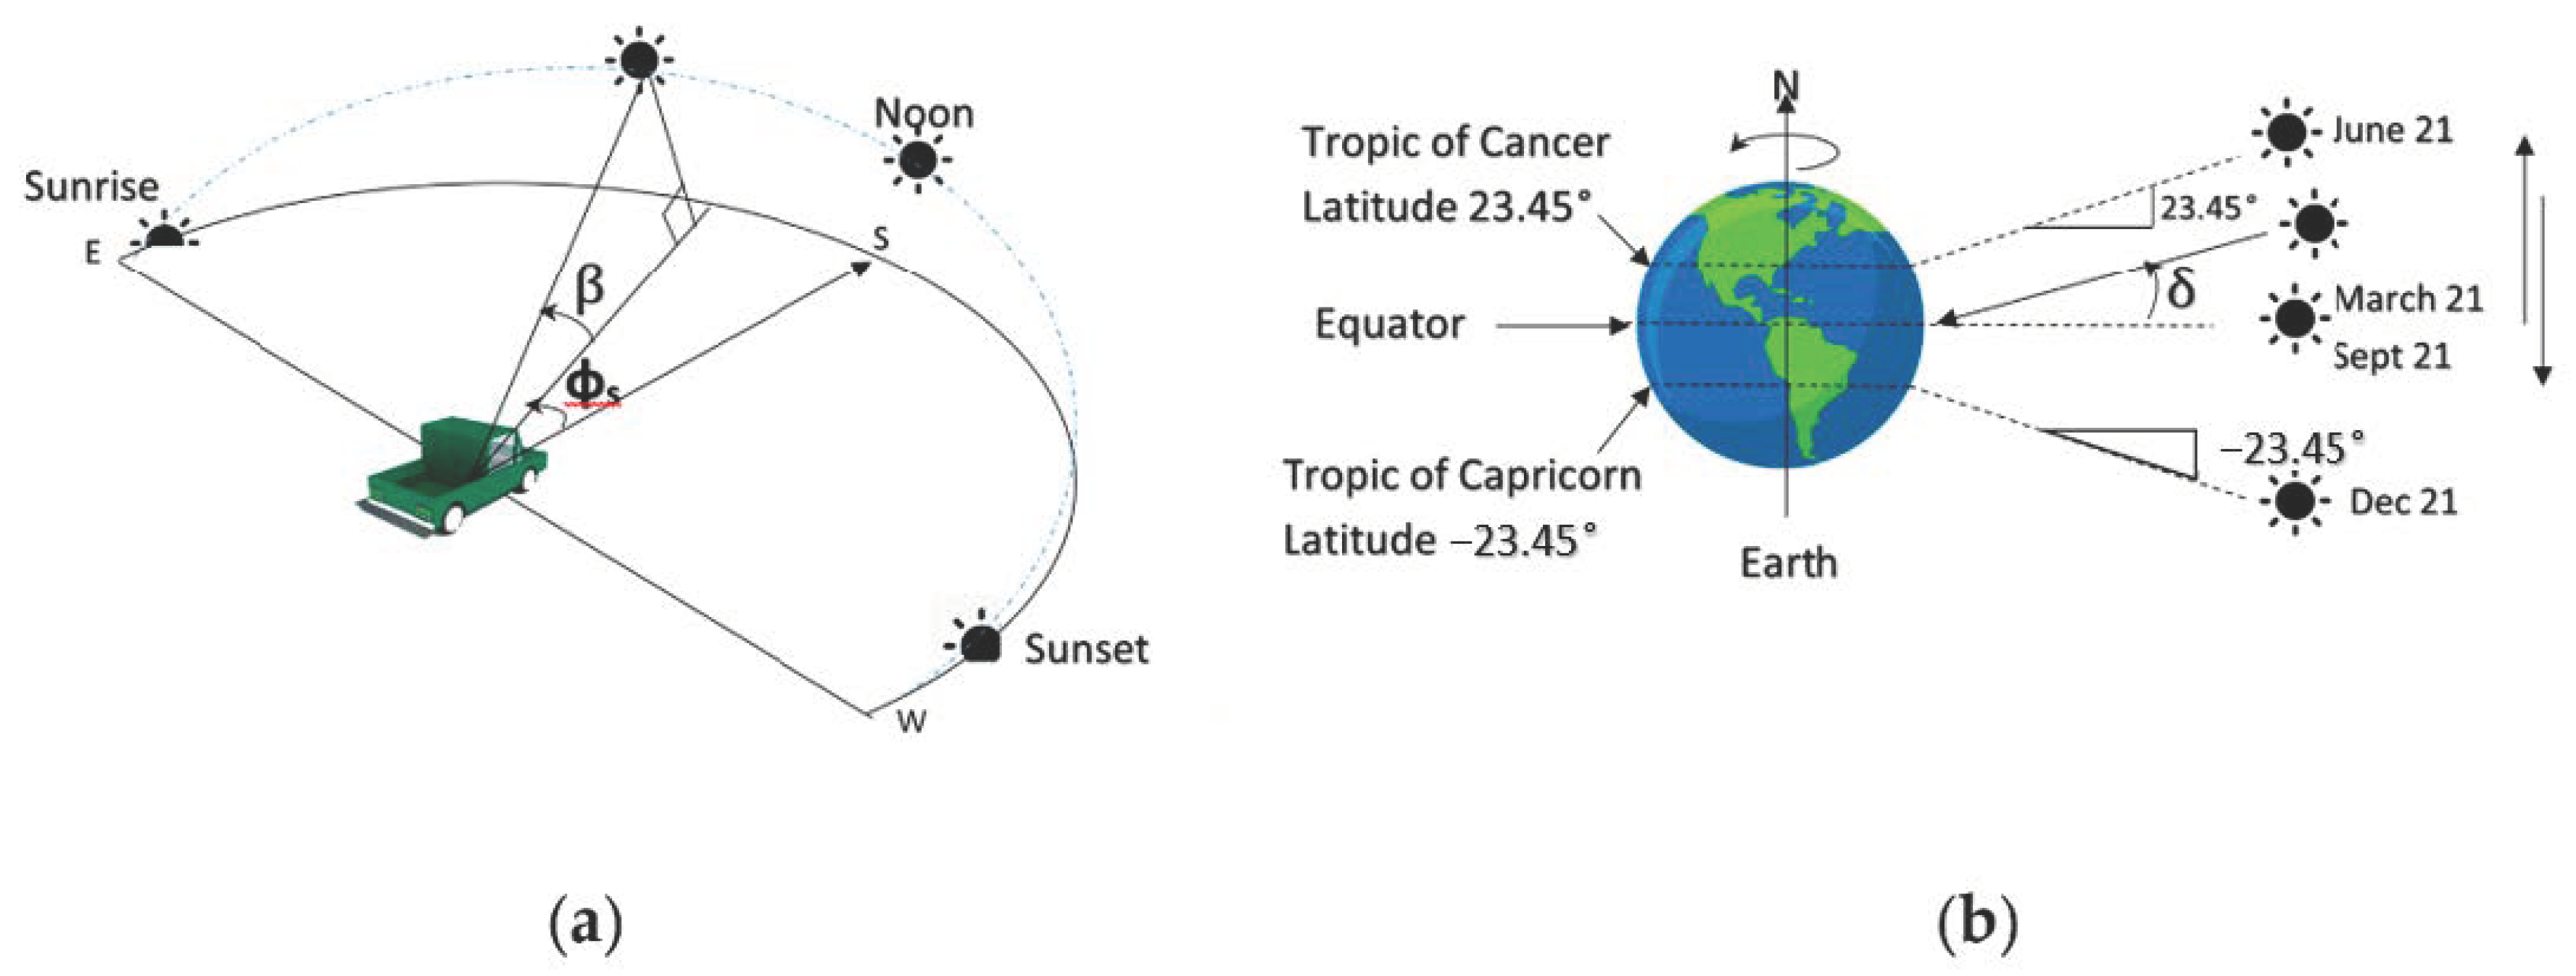
2.1. Solar Altitude Angle

The position of the sun can be described using SAA (β) and azimuth angle (φs) (Figure 1a). The SAA illustrates the sun′s height at any time. Using the latitude and longitude of each point on the Earth, the altitudes and azimuth angles could be calculated at any time of the day. To calculate SAAs, declination angle and hour angle must be calculated. The declination of the sun (δ) is the angle between the equator (centerline) of the Earth and the line drawn from the center of the sun to the center of the Earth as shown in Figure 1b [28]. This angle varies from −23.5° to +23.5° due to the declination of the polar axis of the Earth and the Earth′s circulation around the sun.
The declination angle is calculated using Equation (1). This relationship is a sinusoidal relationship covering 365 days of a year, with the first day of spring being the 81st day of the year [28].
δ = 23.45 s i n [ 360 365 ( n 81 ) ]
where δ is the solar declination angle, and n is the number of days since 1st of January. The hour angle (H) is the number of degrees that the Earth must turn before the sun is directly over the local meridian. It is the difference between the sun′s meridian and the local meridian, calculated using Equation (2) [28].
H = ( 15 ° h o u r ) · ( h )  
where H is the hour angle and h is hours before solar noon. According to Equation (2), the hour angle has a positive value when the sun is before the local meridian. To calculate the solar noon, it should be noted that the sun is at the solar noon when it is at the top of the sky, and this time is not necessarily at 12 P.M. local time. Solar time calculates the sun′s passage time based on the sun′s position in the sky. Therefore, state times (local time) should be converted to solar time to calculate the hour angle. Two adjustments are needed to convert local time to solar time. In the first step, a longitudinal modification must be made. Longitudinal correction is performed based on the time it takes to move the sun between the local time meridian and the longitude of the observer′s line [28]. Table 2 presents the local time meridians in the United States. In this research, the case study was Texas at a longitude of 99.9. The solar noon will occur 9.6 min after the sun passes from the 90° local time meridian of the Center Zone [28].
Therefore, a modification should be conducted in solar and state time, due to the circulation of the Earth around the sun in elliptical orbit. The difference between a 24-h day and a solar day over a year will be calculated using Equations (3) and (4) [28].
E = 9.87 s i n 2 B 7.53 c o s B 1.5 s i n B
B = 360 364 ( n 81 )
where E is the time difference between a solar day and a 24-h day, and n is the number of days since 1st January. Afterward, the solar time can be calculated at any time using Equation (5).
s o l a r   t i m e   ( S T ) = C l o c k   T i m e   ( C T ) + 4   m i n d e g r e e   ( L o c a l   T i m e   M e r i d i a n L o c a l   l o n g i t u d e ) + E ( m i n )
After converting the crash time to the solar time and calculating the hourly angles of the sun, the SAA will be calculated according to Equation (6) [28].
s i n β = c o s L   c o s δ   c o s H + s i n L   s i n δ
where β is the SAA, L accounts for the latitude, δ is the declination angle and H is the hour angle.

2.2. Mixed Logit Model (MXL)

Discrete choice models have become more prominent over recent decades. Regarding the ordinal nature of crash severities, many researchers have used ordered logit/probit to investigate the influential factors on crash severities [4,17,29]. A principal limitation of ordered probit is the parallel slope assumption, which may restrict the associated coefficients′ effects on severity outcomes [22,30]. It is worth mentioning that the developed version of the ordered models, such as the generalized ordered logit/probit model, is an efficient solution to lessen the parallel assumption [26,30], although it still exists [11]. Furthermore, standard logit/probit models are limited to a specific distribution and cannot find heterogeneity in individuals′ behavior nor even its sources [9,31]. Due to the ordered probit model′s weaknesses, some researchers have used multinomial logit models (MNL) to analyze the crash injury severities [19,22]. MNL does not consider the assumption of independence from irrelevant alternatives (IIA) [26]. In the light of previous studies, the mixed logit (MXL) model was one of the selected alternatives because of the MNL weaknesses [32]. This model′s structure is a generalized version of MNL, which can estimate any model with random utility. It also addresses the three essential deficiencies of MNL by considering the difference in taste variation, the unlimited substitution pattern, and the correlation of unobserved factors [33].
In modeling, this paper followed the methodology presented by Washington et al. [34]. Equation (7) shows the relationship between crash severity level and the explanatory variables.
Y n i = V n i + e n i = β n X n i + e n i
where Yni is the function of severity category i in observation n, and Vni and eni are defined as the deterministic and unobserved term of severity level of crash I for individual n, respectively. β n is the vector of the observed attribute parameters for individual n, representing people′s tastes, and is different for each individual, and Xni is the explanatory variables. Regarding the lack of closed form in MXL [29,33], random parameter models are defined as an integration of the logit model over density function of β parameter (Equation (8)).
P ni = exp ( β n   X n i ) i   I exp ( β n   X n I ) f ( β | θ   )   d β
where P ni is the probability of injury severity level i for individual n, f ( β | θ ) is the density function of β , and θ relates to the known density function assigned to parameters. Distributions that are most commonly used for the f ( β ) include normal, lognormal, uniform, triangular, and Johnson′s SB [10,33,34,35,36,37,38].
Marginal effects are used to determine the most influential factors in the crash injury severities by calculating the impacts of one unit change in the explanatory variables on the dependent variable using Equation (9) [34] and are computed as derivatives of the probability of injury severity level i with respect to attribute k in alternative m (Equation (9)):
P i X k m = [   Q ( i = m ) P m ] P i β k ,   i ,   m ϵ I
Where i represents the injury severity levels, and k and m account for attributes and alternatives. According to Equation (9), if i equals m, therefore Q ( i = m ) takes 1, and 0 otherwise. P i and Pm are the probability of injury severity level i and m, respectively.

3. Data

Two lane rural roads′ crash records (about 55,700 crash cases) of the state of Texas collected over a two year period (2017–2018), provided by the Texas Department of Transportation (TxDOT), are used in this paper [39,40]. According to the necessary information for the calculation of the SAA provided by police and other supplemental sources, the crash dataset is classified to four lighting conditions, namely, daylight, dark, dark lit and twilight. The daylight condition refers to the period when the geometric center of the sun is above the horizon (positive altitude). Furthermore, the dark lit records include crashes that occurred in locations with supplemental lighting at night time periods. The dark condition refers to the period when the geometric center of the sun is 6 degrees below the horizon, without any supplemental lighting. The transition zone between dark and daylight is twilight, which is the period between (astronomical) dawn and sunrise, or between sunset and (astronomical) dusk. The spatial distribution of crashes (Figure 2) based on the lighting conditions and crash severities shows that the east side of Texas is more dangerous and most of crashes have occurred in these areas. The fatal, minor and possible/no injury crashes are shown in red, yellow and green, respectively.
The TxDOT database includes information on driver and occupation, lighting condition, collision, environmental features, land use, and roadway typology/condition. The database also reports five levels of injuries including (1) fatal injury, (2) incapacitating injury, (3) nonincapacitating injury, (4) possible injury, and (5) no injury. For research purposes, fatal injuries and incapacitating injuries are combined to increase the number of observations and placed in a new category called severe injury. The nonincapacitating injury data is placed in the minor injury category. In addition, possible and no injury data are combined and placed in a further category called possible/no injury. In previous studies, this categorization was used to ensure sufficient sample size at different injury levels [11,19,26]. Table 3 provides the statistical analysis of the explanatory and dependent variables of proposed models. It shows that approximately 24 percent of accidents occurred in daylight conditions at intersections. In addition, a large number of accidents in dark lighting conditions occurred at curve segments of roads. In terms of crash information, most accidents in dark lighting conditions were related to fixed object and animal crashes. Most of the angular crashes belong to the twilight lighting condition. Regarding the temporal and environmental information, most of the accidents on weekdays and dry road surfaces occurred under twilight lighting conditions.
For modeling analysis, the final dataset consists of 55,627 crash records, of which 32,285 (58%) were at possible/no injury level, 16,159 (29%) were at minor injury level, and 7183 (13%) were at the severe injury level.

4. Model Specification Tests

Likelihood ratio tests have been frequently used to examine the suitability of disaggregate models against an aggregate model [4,26,36,41]. Therefore, in this paper, once four models were developed for different light conditions, likelihood ratio tests were applied to compare the aggregate model to each model made for different light conditions [34].
The coefficients of the aggregate model were tested for transferability against all of the independent, disaggregate lighting condition models using the first log-likelihood ratio test, calculated as Equation (10):
χ 2 = 2 [ L L F u l l ( β F u l l ) i L L i β i ]
where L L F u l l ( β F u l l ) is the log-likelihood at convergence for the aggregate model (−51023); L L i β i is the log-likelihood at convergence for the different lighting condition models using the same variables contained in the full model ( i L L i β i = 50685 ) , and degrees of freedom (df) the difference in the sum of the number of coefficients in all separate models and the number of coefficients in the aggregate model. Results rejected the null hypothesis (no significant difference between the parameters of the aggregate model and four separate models) at the 99 percent confidence level.
The transferability of coefficients to each corresponding lighting condition model is calculated as Equation (11), which indicates the second log-likelihood ratio.
χ 2 = 2 [ L L i 1 i 2 ( β i 1 i 2 ) L L i 1 ( β i 1 ) ]
where L L i 1 i 2 ( β i 1 i 2 ) is the log-likelihood at the convergence of a model using the parameters of i2′s model for lighting condition i1′s data and L L i 1 ( β i 1 ) is the log-likelihood at the convergence of the model using lighting condition i1′s data [4]. Table 4 shows the results with df equals to the number of estimated parameters in β i 1 i 2 . In such a case, two of all tests reject the null hypotheses at a 99 percent confidence level. Based on these two tests, it can be concluded that the data disaggregate approach seems to be logical, since four separate models have been statistically justified.

5. Estimation Results and Discussion

Four separate MXLs, namely, daylight, dark lit, dark, and twilight, were developed for crashes involving cars at three levels of severity, including severe injury, minor injury, and possible/no injury. Regarding the lack of closed form in the MXL model, the simulation based maximum likelihood method used to estimate parameter vector and 500 Halton draws were utilized. Some related distributions were considered to identify the proper distribution of the random parameters. Finally, normal distribution was statistically significant with coefficients at 90% or higher confidence level.
Table 5 summarizes and compares the models, indicating the value and sign of significant variables in each crash severity level. The main difference among the variables, their combination, sign, and value can be observed for the different models, justifying their separation, i.e., the different lighting conditions do have various contributing factors to each injury severity, further stressing the significance of investigating crashes based on SAA.
Among all explanatory variables reported in Table 5, only weekday was significant in all the models, although with different effects. For instance, weekday was positively associated with a minor injury in the dark conditions model. However, it was found to be a random parameter and normally distributed with the mean −0.97 and the standard deviation of 2.20 in the possible/no injury. This indicates that 33% of crashes at weekdays had a higher probability of possible/no injury, while 67% of crashes occurring on weekdays had decreased likelihood of being involved in a possible/no injury. This shows that most crashes had a lower likelihood of being involved in a possible/no injury. This may be because of traffic volume during weekdays and drivers being more careful. Among all of the significant explanatory variables, a total of nine variables were found to be statistically significant as random parameters with a normal distribution, which accounts for unobserved heterogeneity. These random variables illustrate that the effects of a particular variable differ across the observations. For example, level and straight roads were a random parameter and normally distributed with the mean −1.38 and standard deviation of 1.75 in the possible/no injury function under daylight conditions. The above indicates that 78% of crashes occurring on level and straight segments of roads decreased the probability of being involved in a possible/no injury. In comparison, 22% of the observations increased the likelihood of possible/no injury. All the findings are described and critically discussed in the following subsections.

5.1. Roadway Characteristics

Concerning the significant roadway characteristics in injury severity under dark lighting conditions (Table 6), the indicator variable representing crash location (occurring at intersection) is positively associated with severe injury. A possible reason for this is due to the careless behavior of drivers as well as the poor sight distance at night. This finding is in accordance with previous studies [4]. While at intersections with street lights (Table 7), there is a sufficient sight distance which increases the probability of possible/no injury crashes. This finding is consistent with prior research findings [10,12]. Considering this variable has been normally distributed, with a mean of 0.09 and a standard deviation of 2.89 under dark conditions, 49% of crashes at intersections increased the likelihood of fatal injury while the remaining (51%) decreased the probability of being involved in severe crashes. In addition, when a crash occurs in a curved road section, the likelihood of severe injury will be increased at dark (Table 6) and daylight (Table 8) conditions, respectively. One possible reason for this on two-lane rural roads is the limited sight distance at curves and the slow reaction of drivers.
Straight and level roads were found to decrease the probability of minor or possible/no injury in all lighting conditions (except the dark lit). Moreover, this variable has been normally distributed under dark lit and daylight conditions and a possible reason for this positive relationship in fatal injury is the increased sight distance and higher speeds, which decrease the likelihood of minor and possible/no injury crashes. This finding is in line with previous studies [4,26].
The divider/center stripe was associated with lower fatal injuries under dark lighting conditions and increased the likelihood of possible/no injury under twilight (Table 9) conditions. A possible reason for this matter is the separation of opposing traffic flow. This result is in line with previous studies [42,43].
The impacts of using marked lanes on crash severities vary in different lighting conditions. For example, the likelihood of fatal injury has been decreased in the roads with marked lane under dark lit lighting conditions. One possible reason for this is informing the drivers to determine the boundaries of the road and lanes more accurately. Moreover, it has been normally distributed in possible/no injury function with a mean of −0.82 and a standard deviation of 1.56 at daylight conditions. This indicates that 70% of the observations decreased the likelihood of being involved in a possible/no injury. In comparison, 30% of the observations increased the likelihood of possible/no injury.
During daylight, no passing zones were found to decrease the probability of being involved in a fatal injury because of the more careful behavior of drivers in these zones.
Concerning the shoulder characteristics, when the shoulder type is the same as the road surface, the probability of minor and possible/no injury decreases under the dark condition. In addition, the likelihood of fatal injury decreased in daylight condition. In addition, partially consistent results can be found in past studies [27,44]. As the shoulder width increased, the probability of fatal injury decreased under the daylight condition. At the same time, this parameter was found to increase the likelihood of possible/no injury. One possible explanation for this finding could be that wide shoulders may provide additional space for the driver, decreasing the probability of severe crashes. In addition, several studies have found partially similar results, that shoulder width is negatively associated with injury severity [20,42,45]. In dark conditions, the probability of major injury crashes decreases on dry surfaces. Similarly, this parameter in twilight and daylight increased the probability of possible/no injury severity.
Under both dark and daylight conditions, LogAADT was positively associated with minor and fatal injury, respectively. Additionally, it was found to decrease the likelihood of possible/no injury under daylight conditions. However, during twilight, it was normally distributed with a mean of -0.12 and standard deviation of 0.18, indicating that 25% of crashes increased the likelihood of being involved in a minor injury, while the remaining (75%) increased the probability of minor injury. This finding makes sense, and also accords with studies conducted by Uddin and Huynh [26].
Crashes that occurred at uphill (grade direction) have different impacts on crash severities according to lighting conditions. For example, this variable is negatively associated with the fatal and possible/no injury under twilight and dark conditions, respectively. A possible explanation for this is the more cautious driving uphill due to the lower sight distance of drivers. These findings are partially in line with the results of Anarkooli and Hosseinlou [4].

5.2. Temporal and Environmental Characteristics

Under dark lit conditions, weekday was positively associated with minor injuries compared to weekend trips. In addition, it was normally distributed under daylight and dark conditions, which decrease the likelihood of possible/no injury, respectively. COnsidering higher mandatory trips on weekdays than weekends and subsequently busier roads, these findings are rational. These findings align with studies conducted by Anarkooli et al. [9] and Islam and Burton [27].
In dark conditions, the probability of major injury crashes decreases on dry surfaces. Similarly, this parameter in twilight and daylight increased the probability of possible/no injury severity. Regarding the safer conditions of the dry surface of roads due to the better operation of braking, the probability of severe crashes decrease. In addition, partially consistent results can be found in past studies [46,47].

5.3. Collision Characteristics

Hitting fixed objects was significant under dark lighting conditiona, which increases the probability of fatal and minor injuries. A possible explanation for this may be the poor visibility of roadside objects under dark conditions, which delay drivers’ reactions. This finding was in line with studies conducted by Anarkooli and Hosseinlou [4] and Islam et al. [11].
The severity of angular crashes varies under different lighting conditions. Under the daylight, it was positively associated with minor injury, while under dark lit conditions, the probability of fatal and minor injuries decreased, respectively. Animal involved crashes were found to be significant only under dark lit and twilight conditions. Under both lighting conditions, when a vehicle hits an animal, the probability of minor injury decreases. This finding is rational and consistent with those reported in previous studies [10,12,48,49].
Head on collisions were found to increase the probability of minor and major injuries under daylight conditions. In addition, this collision was found to increase the likelihood of major injury under twilight condition. This is most likely due to drivers having lower response times and perceptual abilities during head on crashes on two lane rural roads in twilight situations. This finding is in line with studies by Jalayer et al. [19] and Anarkooli and Hosseinlou [4].

6. Conclusions

In this paper, solar altitude angle (SAA) as an essential factor in identifying lighting conditions (LCs) has been proposed to precise differentiation between daylight, dark, dark lit, and twilight LCs.
In this research, after calculating SAA at the time of each crash, a random parameter (mixed logit) model was used to study the severity of crashes under different LCs based on the periods of the SAA in two lane rural roadways in Texas. Based on different SAAs, four separate models were proposed for different LCs using crash records. The model estimation results and likelihood ratio tests indicated that different LCs have various contributing factors to each injury severity, further stressing the significance of investigating crashes based on SAA.
There were significant differences between the models developed for different LCs and justified the disaggregate approach of developed models. The principal difference among the variables, their combination, sign, value, and significance of the explanatory variables can be observed for different models, confirming their individuality. The key differences include crash location, marked lane, grade direction, no passing zone, shoulder width, weekday, and collision type. For example, it was found that increasing shoulder width causes a decrease in the probability of fatal injuries occurring in daylight condition, but it does not have a significant effect on crash severity under the dark lighting condition.

6.1. Implications for Policy and Practice

By comparing the models and the significance of different variables, it can be concluded that several implications affect road safety. First, according to the models for the night time, crashes at intersections were found to increase the probability of severe injury under dark LCs, while increasing the likelihood of possible/no injury crashes. This outcome suggests the importance of developing street lights at intersections during night-time periods. Second, the shoulder width is negatively associated with severe injury under daylight conditions. Based on the marginal effects of the variable for the dark LC, the models indicate that crashes are less likely to be severe in spots with broad shoulders. Therefore, this finding implies that increasing the shoulder width can be effective in reducing crash injury severity. Third, the presence of the center strip/divider is negatively associated with fatal injuries under dark LC. This indicates that crashes are less likely to be severe on roads with a center stripe. Hence, this finding suggests the importance of implementing LED raised pavement markers in two lane rural roads to avoid fatal crashes at night. Fourth, the no passing zone variable was significant with a negative sign in possible/no injury severity under daylight conditions. Therefore, the likelihood of severe injuries in these areas would be decreased. Hence, this finding implies that implementing no passing zone signs on two lane rural roads might reduce the severity of crashes. Finally, crashes at the curve segment of the two lane rural roads are more likely to be fatal under dark and daylight conditions. Therefore, this finding implies that implementing warning signs before the curve might decrease severity and increase drivers′ awareness.

6.2. Limitations and Recommendations for Further Studies

Proposing four separate injury models for crashes on two lane rural roads based on different lighting conditions using SAA provided some new contributions not previously presented in the literature. Nevertheless, like most previous studies, this paper has some limitations, such as only focusing on a single state to derive definitive estimates for variables. In this regard, it is recommended to conduct a multistate study and compare the significant variables and their impacts for further studies. Besides, it is recommended that a shorter interval of altitudes be considered according to the crash types.

Author Contributions

Conceptualization, M.A., C.P. and G.S.; methodology, M.A.; formal analysis, M.A.; investigation, M.A., C.P. and G.S.; resources, M.A. and G.S.; data acquisition, M.A.; writing—original draft preparation, M.A.; writing—review and editing, M.A., C.P., G.S. and I.F.; validation C.P.; visualization, G.S.; interpretation of data, M.A., C.P., G.S. and I.F. All authors have read and agreed to the published version of the manuscript.

Funding

This research received no external funding.

Institutional Review Board Statement

Not applicable.

Informed Consent Statement

Not applicable.

Data Availability Statement

Restrictions apply to the availability of these data. Data was obtained from Texas Department of Transportation and are available at https://www.txdot.gov/driver/safety/crash-reports.html (accessed on 20 October 2019) with the permission of Texas Department of Transportation.

Acknowledgments

The authors appreciate the Texas Department of Transportation (TxDOT) for providing with the data used in this study.

Conflicts of Interest

The authors declare no conflict of interest.

References

  1. World Health Organization. Global Status Report on Road Safety; World Health Organization: Geneva, Switzerland, 2018. [Google Scholar]
  2. National Highway Traffic Safety Administration (NHTSA). The SAGE Encyclopedia of Business Ethics and Society; Sage: New Brunswick, NJ, USA, 2020. [Google Scholar]
  3. Ratcliffe, M.; Burd, C.; Holder, K.; Fields, A. Defining rural at the US Census Bureau. Am. Community Surv. Geogr. Brief 2016, 1, 1–8. [Google Scholar]
  4. Anarkooli, A.J.; Hosseinlou, M.H. Analysis of the injury severity of crashes by considering different lighting conditions on two-lane rural roads. J. Saf. Res. 2016, 56, 57–65. [Google Scholar] [CrossRef] [PubMed]
  5. Zhou, B.; Zhang, X.; Zhang, S.; Li, Z.; Liu, X. Analysis of Factors Affecting Real-Time Ridesharing Vehicle Crash Severity. Sustainability 2019, 11, 3334. [Google Scholar] [CrossRef] [Green Version]
  6. Klinjun, N.; Kelly, M.; Praditsathaporn, C.; Petsirasan, R. Identification of Factors Affecting Road Traffic Injuries Incidence and Severity in Southern Thailand Based on Accident Investigation Reports. Sustainability 2021, 13, 12467. [Google Scholar] [CrossRef]
  7. González-Sánchez, G.; Olmo-Sánchez, M.I.; Maeso-González, E.; Gutiérrez-Bedmar, M.; García-Rodríguez, A. Traffic Injury Risk Based on Mobility Patterns by Gender, Age, Mode of Transport and Type of Road. Sustainability 2021, 13, 10112. [Google Scholar] [CrossRef]
  8. Pashkevich, A.; Nowak, M. Road safety risk assessment at pedestrian crossings: A case study from Sułkowice. Sci. J. Sil. Univ. Technol. Ser. Transp. 2017, 95, 159–170. [Google Scholar] [CrossRef]
  9. Anarkooli, A.J.; Hosseinpour, M.; Kardar, A. Investigation of factors affecting the injury severity of single-vehicle rollover crashes: A random-effects generalized ordered probit model. Accid. Anal. Prev. 2017, 106, 399–410. [Google Scholar] [CrossRef]
  10. Naik, B.; Tung, L.-W.; Zhao, S.; Khattak, A.J. Weather impacts on single-vehicle truck crash injury severity. J. Saf. Res. 2014, 58, 57–65. [Google Scholar] [CrossRef]
  11. Islam, S.; Jones, S.L.; Dye, D. Comprehensive analysis of single- and multi-vehicle large truck at-fault crashes on rural and urban roadways in Alabama. Accid. Anal. Prev. 2014, 67, 148–158. [Google Scholar] [CrossRef]
  12. Chen, F.; Chen, S. Injury severities of truck drivers in single- and multi-vehicle accidents on rural highways. Accid. Anal. Prev. 2011, 43, 1677–1688. [Google Scholar] [CrossRef]
  13. Dong, C.; Richards, S.H.; Huang, B.; Jiang, X. Identifying the factors contributing to the severity of truck-involved crashes. Int. J. Inj. Control Saf. Promot. 2013, 22, 116–126. [Google Scholar] [CrossRef] [PubMed]
  14. Song, X.; Wu, J.; Zhang, H.; Pi, R. Analysis of Crash Severity for Hazard Material Transportation Using Highway Safety Information System Data. SAGE Open 2020, 10, 1–8. [Google Scholar] [CrossRef]
  15. Nowosielski, A.; Małecki, K.; Forczmański, P.; Smoliński, A.; Krzywicki, K. Embedded Night-Vision System for Pedestrian Detection. IEEE Sens. J. 2020, 20, 9293–9304. [Google Scholar] [CrossRef]
  16. Nowosielski, A.; Małecki, K.; Forczmański, P.; Smoliński, A. Pedestrian Detection in Severe Lighting Conditions: Comparative Study of Human Performance vs. Thermal-Imaging-Based Automatic System. Int. Conf. Comput. Recognit. Syst. 2019, 977, 174–183. [Google Scholar] [CrossRef]
  17. Rezapour, M.; Moomen, M.; Ksaibati, K. Ordered logistic models of influencing factors on crash injury severity of single and multiple-vehicle downgrade crashes: A case study in Wyoming. J. Saf. Res. 2018, 68, 107–118. [Google Scholar] [CrossRef] [PubMed]
  18. Xie, Y.; Zhao, K.; Huynh, N. Analysis of driver injury severity in rural single-vehicle crashes. Accid. Anal. Prev. 2012, 47, 36–44. [Google Scholar] [CrossRef] [PubMed]
  19. Jalayer, M.; Shabanpour, R.; Pour-Rouholamin, M.; Golshani, N.; Zhou, H. Wrong-way driving crashes: A random-parameters ordered probit analysis of injury severity. Accid. Anal. Prev. 2018, 117, 128–135. [Google Scholar] [CrossRef]
  20. Haleem, K.; Abdel-Aty, M. Examining traffic crash injury severity at unsignalized intersections. J. Saf. Res. 2011, 41, 347–357. [Google Scholar] [CrossRef]
  21. Li, H.; Huang, H.; Liu, J. Parameter Estimation of the Mixed Logit Model and Its Application. J. Transp. Syst. Eng. Inf. Technol. 2010, 10, 73–78. [Google Scholar] [CrossRef]
  22. Khorashadi, A.; Niemeier, D.; Shankar, V.; Mannering, F. Differences in rural and urban driver-injury severities in accidents involving large-trucks: An exploratory analysis. Accid. Anal. Prev. 2005, 37, 910–921. [Google Scholar] [CrossRef]
  23. Ahmad, N.; Ahmed, A.; Wali, B.; Saeed, T.U. Exploring factors associated with crash severity on motorways in Pakistan. Proc. Inst. Civ. Eng. Transp. 2021, 1–10. [Google Scholar] [CrossRef]
  24. Obeidat, M.S.; Khrais, S.K.; And, B.S.B.; Rababa, M.M. Impacts of roadway lighting on traffic crashes and safety in Jordan. Int. J. Crashworthiness 2020, 1–10. [Google Scholar] [CrossRef]
  25. Zhang, K.; Hassan, M. Crash severity analysis of nighttime and daytime highway work zone crashes. PLoS ONE 2019, 14, e0221128. [Google Scholar] [CrossRef] [PubMed] [Green Version]
  26. Uddin, M.; Huynh, N. Truck-involved crashes injury severity analysis for different lighting conditions on rural and urban roadways. Accid. Anal. Prev. 2017, 108, 44–55. [Google Scholar] [CrossRef]
  27. Islam, S.; Burton, B. A comparative injury severity analysis of rural intersection crashes under different lighting conditions in Alabama. J. Transp. Saf. Secur. 2020, 12, 1106–1127. [Google Scholar] [CrossRef]
  28. Masters, G.M. Renewable and Efficient Electric Power Systems, 2nd ed.; John Wiley & Sons, Inc.: Hoboken, NJ, USA, 2004. [Google Scholar]
  29. Zhou, M.; Chin, H.C. Factors affecting the injury severity of out-of-control single-vehicle crashes in Singapore. Accid. Anal. Prev. 2019, 124, 104–112. [Google Scholar] [CrossRef]
  30. Anarkooli, A.J.; Persaud, B.; Hosseinpour, M.; Saleem, T. Comparison of univariate and two-stage approaches for estimating crash frequency by severity—Case study for horizontal curves on two-lane rural roads. Accid. Anal. Prev. 2018, 129, 382–389. [Google Scholar] [CrossRef]
  31. Rezaei, A.; Puckett, S.M.; Nassiri, H. Heterogeneity in Preferences of Air Travel Itinerary in a Low-Frequency Market. Transp. Res. Rec. J. Transp. Res. Board 2011, 2214, 10–19. [Google Scholar] [CrossRef]
  32. Paz, A.; Arteaga, C.; Cobos, C. Specification of mixed logit models assisted by an optimization framework. J. Choice Model. 2019, 30, 50–60. [Google Scholar] [CrossRef]
  33. Train, K.E. Discrete Choice Methods with Simulation; Cambridge University Press: New York, NY, USA, 2009. [Google Scholar]
  34. Washington, S.P.; Karlaftis, M.G.; Mannering, F. Statistical and Econometric Methods for Transportation Data Analysis; CRC: Boca Raton, FL, USA, 2003. [Google Scholar] [CrossRef]
  35. Hensher, D.A.; Rose, J.M.; Greene, W.H. Applied Choice Analysis; Cambridge University Press: New York, NY, USA, 2005. [Google Scholar] [CrossRef]
  36. Pahukula, J.; Hernandez, S.; Unnikrishnan, A. A time of day analysis of crashes involving large trucks in urban areas. Accid. Anal. Prev. 2015, 75, 155–163. [Google Scholar] [CrossRef]
  37. Hess, S. Advanced Discrete Choice Models with Applications to Transport Demand. Ph.D. Thesis, University of London, London, UK, 2005. [Google Scholar]
  38. Adler, T.; Falzarano, C.S.; Spitz, G. Modeling Service Trade-Offs in Air Itinerary Choices. Transp. Res. Rec. J. Transp. Res. Board 2005, 1915, 20–26. [Google Scholar] [CrossRef]
  39. Texas Department of Transportation (TxDOT). Crash Reports and Records. 2019. Available online: https://www.txdot.gov/driver/safety/crash-reports.html (accessed on 20 October 2019).
  40. Billah, K.; Sharif, H.O.; Dessouky, S. Analysis of Pedestrian–Motor Vehicle Crashes in San Antonio, Texas. Sustainability 2021, 13, 6610. [Google Scholar] [CrossRef]
  41. Li, Z.; Ci, Y.; Chen, C.; Zhang, G.; Wu, Q.; Qian, Z.; Prevedouros, P.D.; Ma, D.T. Investigation of driver injury severities in rural single-vehicle crashes under rain conditions using mixed logit and latent class models. Accid. Anal. Prev. 2019, 124, 219–229. [Google Scholar] [CrossRef] [PubMed]
  42. Hosseinpour, M.; Yahaya, A.S.; Sadullah, A.F. Exploring the effects of roadway characteristics on the frequency and severity of head-on crashes: Case studies from Malaysian Federal Roads. Accid. Anal. Prev. 2014, 62, 209–222. [Google Scholar] [CrossRef]
  43. Baba, N. Increased presence of foreign investors and dividend policy of Japanese firms. Pac.-Basin Financ. J. 2009, 17, 163–174. [Google Scholar] [CrossRef]
  44. Zhu, X.; Srinivasan, S. A comprehensive analysis of factors influencing the injury severity of large-truck crashes. Accid. Anal. Prev. 2011, 43, 49–57. [Google Scholar] [CrossRef]
  45. Castillo-Martinez, A.; Medina-Merodio, J.-A.; Gutierrez-Martinez, J.-M.; Aguado-Delgado, J.; De-Pablos-Heredero, C.; Otón, S. Evaluation and Improvement of Lighting Efficiency in Working Spaces. Sustainability 2018, 10, 1110. [Google Scholar] [CrossRef] [Green Version]
  46. Deehr, C.S.; Rees, M.H.; Belon, A.E.H.; Romick, G.J.; Lummerzheim, D. Influence of the ionosphere on the altitude of discrete auroral arcs. Ann. Geophys. 2005, 23, 759–766. [Google Scholar] [CrossRef] [Green Version]
  47. Huang, H.; Chin, H.C.; Haque, M.M. Severity of driver injury and vehicle damage in traffic crashes at intersections: A Bayesian hierarchical analysis. Accid. Anal. Prev. 2008, 40, 45–54. [Google Scholar] [CrossRef]
  48. Kardar, A.; Davoodi, S.R. A generalized ordered probit model for analyzing driver injury severity of head-on crashes on two-lane rural highways in Malaysia. J. Transp. Saf. Secur. 2019, 12, 1067–1082. [Google Scholar] [CrossRef]
  49. Sari, Y.; Yudhistira, M.H. Bad light, bad road, or bad luck? The associations of road lighting and road surface quality on road crash severities in Indonesia. Case Stud. Transp. Policy 2021, 9, 1407–1417. [Google Scholar] [CrossRef]
Figure 1. (a) The altitude and azimuth angles illustration, (b) illustration of the solar declination angle δ [28].
Sustainability 14 01692 g001
Figure 2. Spatial distribution of two years’ crashes in Texas under different lighting conditions: (a) dark; (b) dark lit; (c) daylight; (d) twilight [39].
Sustainability 14 01692 g002
Table 1. Selected injury severity studies related to lighting conditions.
Author(s)Independent VariablesModelKey Outcomes
Vehicle InfoRoadway InfoLand UseTemporal and Environmental InfoLighting ConditionsCollision InfoDriver InfoOccupation Info
Ahmad et al. [23] Ordered probit modelSpeeding, drowsiness, head on collision due to wrong way driving, illegal motorway crossing by pedestrian, and aging drivers will increase the fatality of crashes.
Song et al. [14] Random forest and ordered logistic modelAADT, fatigued/asleep, number of lanes, speeding, adverse weather, and light are the six most important factors affecting crash severity.
Obeidat et al. [24] Generalized linear modelCrash year, road surface, whether the crash occurred during the day or the night, number of vehicles involved, and lighting condition affect crash severities.
Zhang and Hassan [25] Mixed logit modelOlder and male drivers, the number of lane closures, sidewise crashes, and rainy weather have opposite effects on injury severity in night time and daytime crashes.
Rezapour, Moomen and Ksaibati [17] Ordered logit modelDark and dark lit conditions decrease the likelihood of severe injury crashes for multiple vehicle crashes
Uddin and Huynh [26]Mixed logit modelAge, gender, truck type, AADT, speed and weather affect crash severities in rural and urban areas, and also the lighting condition (daylight, dark, and dark with street lights)
Anarkooli, Hosseinpour, and Kardar [9]Mixed logit and random effects generalized ordered probit modelThe dark without supplemental lighting leads to an increase in the probability of deaths or severe injuries in single vehicle rollover crashes.
Anarkooli and Hosseinlou [4] Fixed effects ordered probit modelThe critical differences between proposed models for different lighting conditions (daylight, dark, and dark with street lights) are the crash location, speed limit, shoulder width, driver performance and crash type.
Naik et al. [10]Mixed logit and random parameter ordered logitThe dark without supplemental lighting and dusk/dawn conditions decrease visible injury probabilities.
Table 2. Local time meridians of U.S. standard time zones [20].
Time ZoneLT Meridian
Eastern 75 °
Central 90 °
Mountain 105 °
Pacific 120 °
Eastern Alaska 135 °
Alaska and Hawaii 150 °
Table 3. Frequency analysis (percent) of research data by lighting conditions.
VariablesDark LightDarkTwilightDay Light
MeanS.DMeanS.DMeanS.DMeanS.D
Crash Severity
Severe0.07 0.09 0.08 0.1
Minor0.3 0.25 0.24 0.31
Possible/no 0.63 0.66 0.68 0.59
Roadway info
Crash location (1 if at an intersection, 0 otherwise)0.180.530.090.290.220.590.240.2
Curve (1 if at a curve, 0 otherwise)0.240.520.320.420.280.560.190.39
Road alignment (1 if level and straight, 0 otherwise)0.430.610.380.520.510.480.580.63
Center stripe/divider (1 if center stripe/divider exist, 0 otherwise)0.190.240.470.6141.50.740.330.65
Marked lane (1 if marked lane exists, 0 otherwise)0.150.340.210.360.180.580.390.49
No passing zone (1 if crashes occur in no passing zone, 0 otherwise)18.340.620.745.25.936.320.1155.2
Shoulder type (1 if is the same as road surface, 0 otherwise)0.750.480.680.440.70.660.690.36
Shoulder width (shoulder width varied between 11 and 66 ft.)23.52.7124.33.6624.232.9523.813.16
LogAADT (AADT varied between 101 and 55106 veh/day)7.611.16.411.168.811.218.031.22
Grade direction (1 if uphill; 0 downhill)0.670.480.480.430.520.470.580.44
Crash info
Fixed object (1 if a collision with roadside objects; 0 otherwise)0.110.320.160.360.130.410.090.18
Angle (1 if angular collision; 0 otherwise)0.160.330.170.350.170.390.260.3
Animal (1 if a collision with an animal; 0 otherwise)0.110.480.270.430.140.610.070.36
Head on (1 if head on collision; 0 otherwise)0.030.20.040.240.010.180.050.29
Temporal and Environmental info
Dry road surface (1 if dry surface; otherwise 0)0.870.380.810.390.90.450.750.29
Weekday (1 if a crash occurred on a weekday; 0 weekends)0.650.480.710.330.760.560.620.39
Table 4. Transferability test for comparing the models.
df12141218
i2Dark LitTwilightDarkDay
i1
Dark Lit0.00115.09250.2066.74
Twilight1142.400.003360.82109.23
Dark6186.036257.640.006438.52
Day218.791131.812896.730.00
Table 5. An overview of the variables affecting injury severity among the four lighting conditions.
VariablesDark-LightedDarkTwilightDay Light
Roadway Info
Crash location—intersectionN(±)F(±)
Road alignment M(±), N(±) M(−)M(−), N(±)
Center stripe/divider F(−)N(+)
Shoulder type M(−), N(±) F(−)
No passing zone F(−)
LogAADT M(+)M(±)F(+), N(−)
Curve F(+) F(+)
Shoulder width F(−), N(+)
Marked laneF(−), M(−) M(+), N(±)
Grade directionM(−)N(−)F(−), N(+)
Crash info
Fixed object F(+), M(+)
AngleF(−), M(−) F(−),N(+)M(+),
Animal M(−), N(+) F(−), M(+)
Head on F(+)F(+), M(+)
Temporal and Environmental info
Dry road surface F(−)N(+)N(+)
WeekdayM(+)M(+),N(±)M(−), N(+)M(+),N(±)
F—fatal, M—minor, N—possible/no injury. (+) means increasing the likelihood of a specific severity level, (−) means decreasing likelihood of a specific severity level, (±) as an indicator of random parameters.
Table 6. Estimated parameters of crash injury severity under dark conditions.
Meaning of VariablesCoefficientt-StatisticMarginal Effects
Severe InjuryMinor InjuryPossible/No Injury
Defined for severe injury
Constant1.90 ***26.39
Crash location (standard deviation of parameter distribution)0.09 (2.89 *)0.28 (1.8)−0.00590.00470.0012
Curve0.22 ***5.080.0287−0.0216−0.0071
Dry road surface −0.12 **−2.2−0.02070.01540.0053
Fixed object0.56 ***10.450.0187−0.0135−0.0052
Center stripe/divider−0.37 ***−4.05−0.03120.02910.0021
Defined for minor injury
Fixed Object0.49 ***9.17−0.11840.1411−0.0227
Shoulder type−0.09 **−2.050.0101−0.01170.0016
LogAADT0.11 ***12.52−0.13210.1525−0.0204
Weekday0.29 ***6.3−0.01220.0141−0.0018
Defined for Possible/no injury
Grade direction−0.15 **−2.170.00490.0021−0.007
Shoulder type (standard deviation of parameter distribution)−0.37 (1.41 *)−0.62 (1.84)−0.0076−0.0030.0106
Weekday (standard deviation of parameter distribution)−0.97 (2.20 **)−0.97 (2.07)−0.0068−0.00260.0094
Model statistics
Number of observations14125
Restricted Log-likelihood (constant only)−15380.6
Log-likelihood at convergence−11405.8
McFadden Pseudo R-squared ( ρ 2 ) 0.258
Note: *: p < 0.05; **: p < 0.01; ***: p < 0.001.
Table 7. Estimated parameters of crash injury severity under dark lit conditions.
Meaning of VariablesCoefficientt-StatisticMarginal Effects
Severe InjuryMinor InjuryPossible/No Injury
Defined for severe injury
Marked lane−2.04 ***−4.07−0.01840.01220.0062
Angle−0.54 **−2.35−0.01560.01180.0038
Defined for minor injury
Marked lane−0.07 ***−2.850.0426−0.04760.005
Road alignment (1 if level and straight, 0 otherwise) (standard deviation of parameter distribution)−1.29
**(2.96 **)
−2.36 (2.42)−0.00190.0043−0.0024
Angle−1.10 **−2.240.0066−0.00950.003
Animal−1.58 ***−2.870.0061−0.00650.0003
Weekday 0.38 *1.86−0.01250.0138−0.0013
Grade direction−0.58 ***−3.040.0242−0.0270.0028
Defined for Possible/no injury
Constant−2.61 ***−7.37
Crash location 0.62 **2.05−0.0091−0.00330.0124
Road alignment (1 if level and straight, 0 otherwise) (standard deviation of parameter distribution)−2.29 ***
(2.53 *)
−1.28 (1.68)−0.0163−0.00680.0231
Animal 0.62 *1.84−0.0058−0.00210.0079
Model statistics
Number of observations1853
Restricted Log-likelihood (constant only)−2035.73
Log-likelihood at convergence−1521.06
McFadden Pseudo R-squared ( ρ 2 ) 0.252
Note: *: p < 0.05; **: p < 0.01; ***: p < 0.001.
Table 8. Estimated parameters of crash injury severity under daylight conditions.
Meaning of VariablesCoefficientt-StatisticMarginal Effects
Severe InjuryMinor InjuryPossible/No Injury
Defined for severe injury
No passing zone−0.09 ***−3.38−0.00450.00350.001
Head on0.86 ***8.190.0211−0.0187−0.0024
Shoulder width −0.01 ***−3.85−0.01710.01390.0032
LogAADT0.11 ***27.250.2005−0.1632−0.0373
Shoulder type−0.20 ***−8.83 −0.02290.01870.0042
Curve0.22 ***2.820.0165−0.0151−0.0014
Defined for minor injury
Road alignment (1 if level and straight, 0 otherwise)−0.13 ***−4.960.0271−0.03620.0091
Marked lane0.58 ***15.87−0.01210.0144−0.0023
Head on 0.91 ***8.38−0.01960.0208−0.0012
Angle0.28 ***7.69−0.0070.0077−0.0007
Weekday0.21 **2.52−0.00480.0052−0.0004
Defined for Possible/no injury
Road alignment (1 if level and straight, 0 otherwise)(standard deviation of parameter distribution)−1.38 ***
(1.75 ***)
−4.34
(5.41)
−0.0073−0.00330.0106
Dry road surface0.51 ***8.32−0.0195−0.01060.0301
Angle −0.23 ***−4.570.00270.0014−0.0041
Marked lane (standard deviation of parameter distribution)−0.82
(1.56 **)
−1.49 (2.24)−0.0015−0.00090.0024
Shoulder width0.02 ***3.2−0.0053−0.00280.0081
LogAADT−0.19 ***−18.860.06430.034−0.0983
Weekday (standard deviation of parameter distribution)−0.03
(1.26 **)
−0.08 (2.33)−0.0055−0.00290.0084
Model statistics
Number of observations36517
Restricted log-likelihood (constant only)−40118
Log-likelihood at convergence−31784.9
McFadden Pseudo R-squared ( ρ 2 ) 0.208
Note: **: p < 0.01; ***: p < 0.001.
Table 9. Estimated parameters of crash injury severity under twilight conditions.
Meaning of VariablesCoefficientt-StatisticMarginal Effects
Severe InjuryMinor InjuryPossible/No Injury
Defined for severe injury
Head on0.29 **2.070.013−0.0087−0.0043
Angle−1.26 ***−6.37−0.02690.01710.0098
Grade direction−0.22 *−1.93−0.00810.00510.003
Animal−0.23 **−2.05−0.01010.00860.0015
Defined for minor injury
Road alignment (1 if level and straight, 0 otherwise)−0.22 *−1.680.0163−0.01830.002
Weekday−0.66 **−2.40.009−0.01190.0029
Animal−2.14 ***−5.060.0312−0.03390.0027
LogAADT (standard deviation of parameter distribution)−0.12 ***
(0.18 *)
−2.87 (1.69)0.0407−0.04740.0067
Defined for Possible/no injury
Constant−3.16 ***−14.47
Dry road surface0.37 *1.94−0.0187−0.00490.0236
Center stripe/divider 0.61 ***3.94−0.0089−0.00260.0115
Grade direction0.74 ***3.56−0.0105−0.00310.0136
Angle 0.59 ***2.6−0.0035−0.00110.0046
Weekday0.41 ***2.98−0.011−0.00320.0142
Model statistics
Number of observations3132
Restricted log-likelihood (constant only)−3440.85
Log-likelihood at convergence−2390.07
McFadden Pseudo R-squared ( ρ 2 ) 0.305
Note: *: p < 0.05; **: p < 0.01; ***: p < 0.001.
Publisher’s Note: MDPI stays neutral with regard to jurisdictional claims in published maps and institutional affiliations.

