
Use of Sentinel-2 Satellite for Spatially Variable Rate Fertiliser Management in a Sicilian Vineyard


Abstract
:1. Introduction
2. Materials and Methods
2.1. Study Area
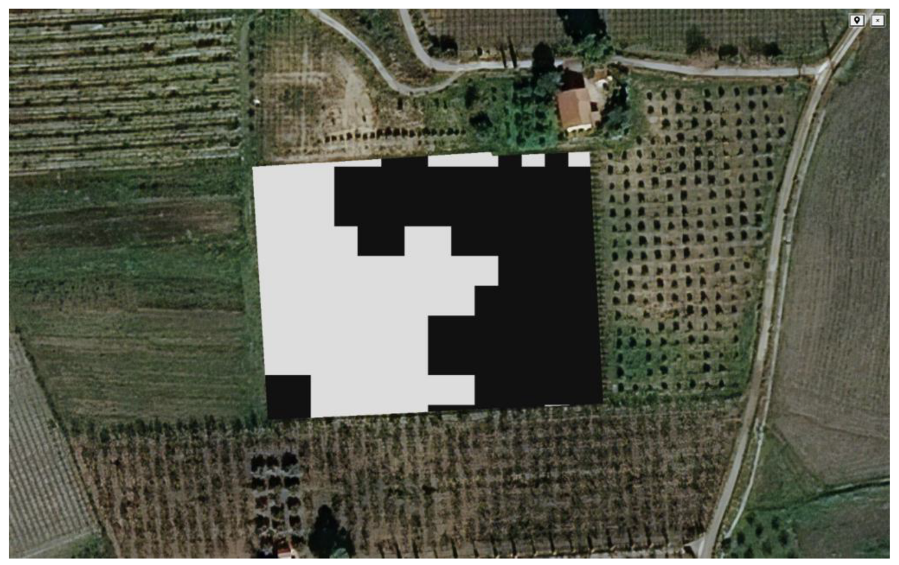
- (1)
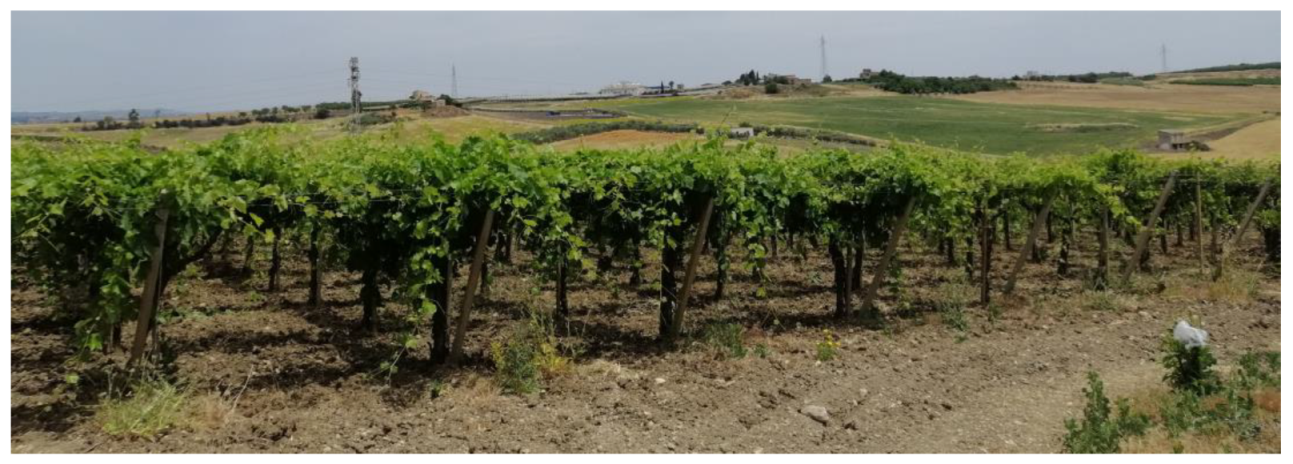
- plot having an area of 1.75 ha ca., where the vine variety Syrah is cultivated, using the fruit tree form step-over espalier with plant distances of 2.5 × 1 m (Figure 1);
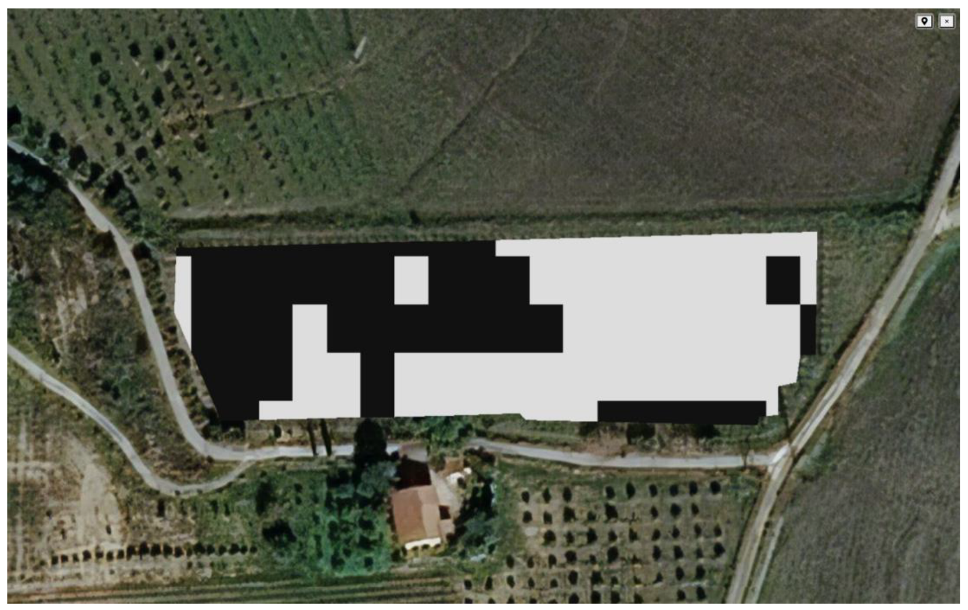
- (2)
- plot having an area of 1 ha ca., where the vine variety Nero d’Avola is cultivated, using the fruit tree form marquee with plant distances of 2.8 × 2.8 m (Figure 2).
2.2. Satellite Image Sensing and Statistical Data Analysis
- -
- ρRED is the radiance (in reflectance units) of a red channel near 0.66 µm; and
- -
- ρNIR is the radiance (in reflectance units) of a near-IR channel around 0.86 µm [39].
- -
- ρ(λ) is apparent reflectance;
- -
- λ is wavelength; and
- -
- ρ(λ) is equal to Π L(λ)/[cos(ϴ0) E0(λ)], with L(λ) measured radiance, ϴ0, solar zenith angle and E0(λ) solar irradiance above the earth atmosphere [39].
- -
- NIR is near-infrared channel;
- -
- RED is red channel;
- -
- B8 is Band 8 in Sentinel-2 satellite (NIR); and
- -
- B4 is Band 4 in Sentinel-2 satellite (RED).
- -
- NIR is near-infrared channel;
- -
- MIR is mide-infrared channel;
- -
- B8 is Band 8 in Sentinel-2 satellite (NIR); and
- -
- B12 is Band 12 in Sentinel-2 satellite (MIR).
- before green pruning (May);
- after green pruning (June);
- before harvest (August); and
- after harvest (September).
3. Results
- -
- vegetative vigour;
- -
- leaf water content;
- -
- criterion for deciding the optimal fertilisation time;
- -
- temporal variability; and
- -
- spatial variability.
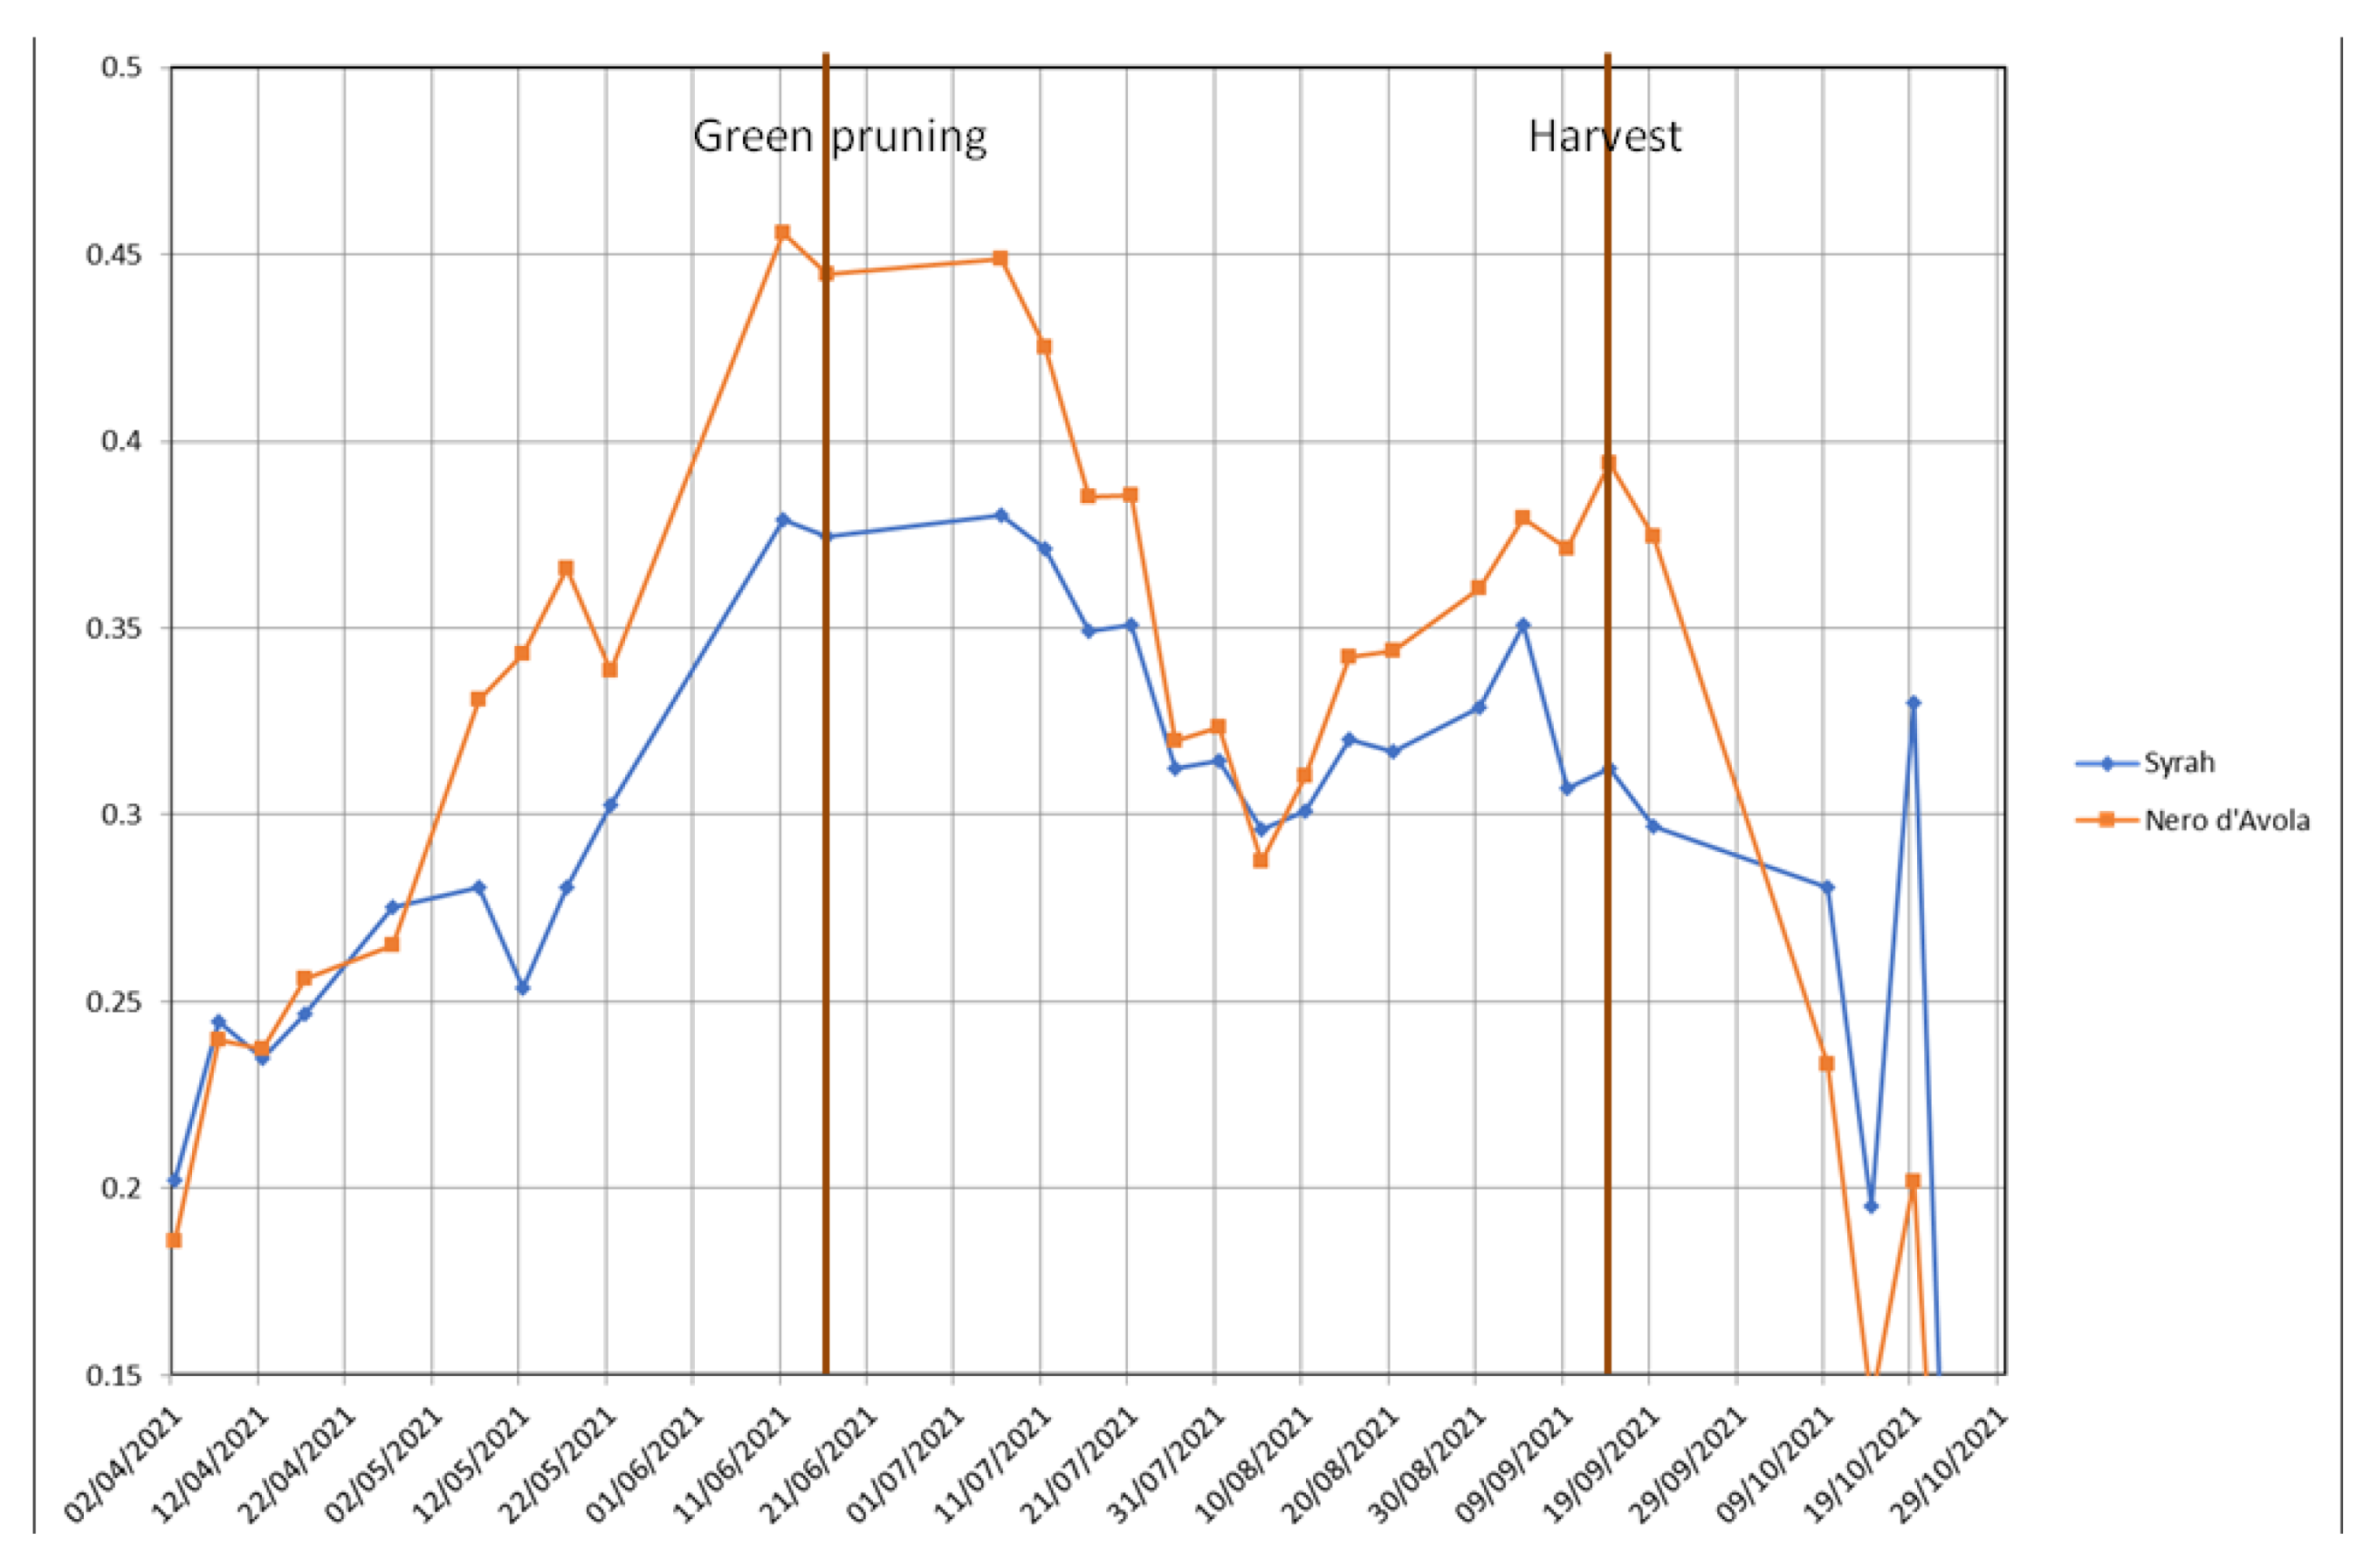
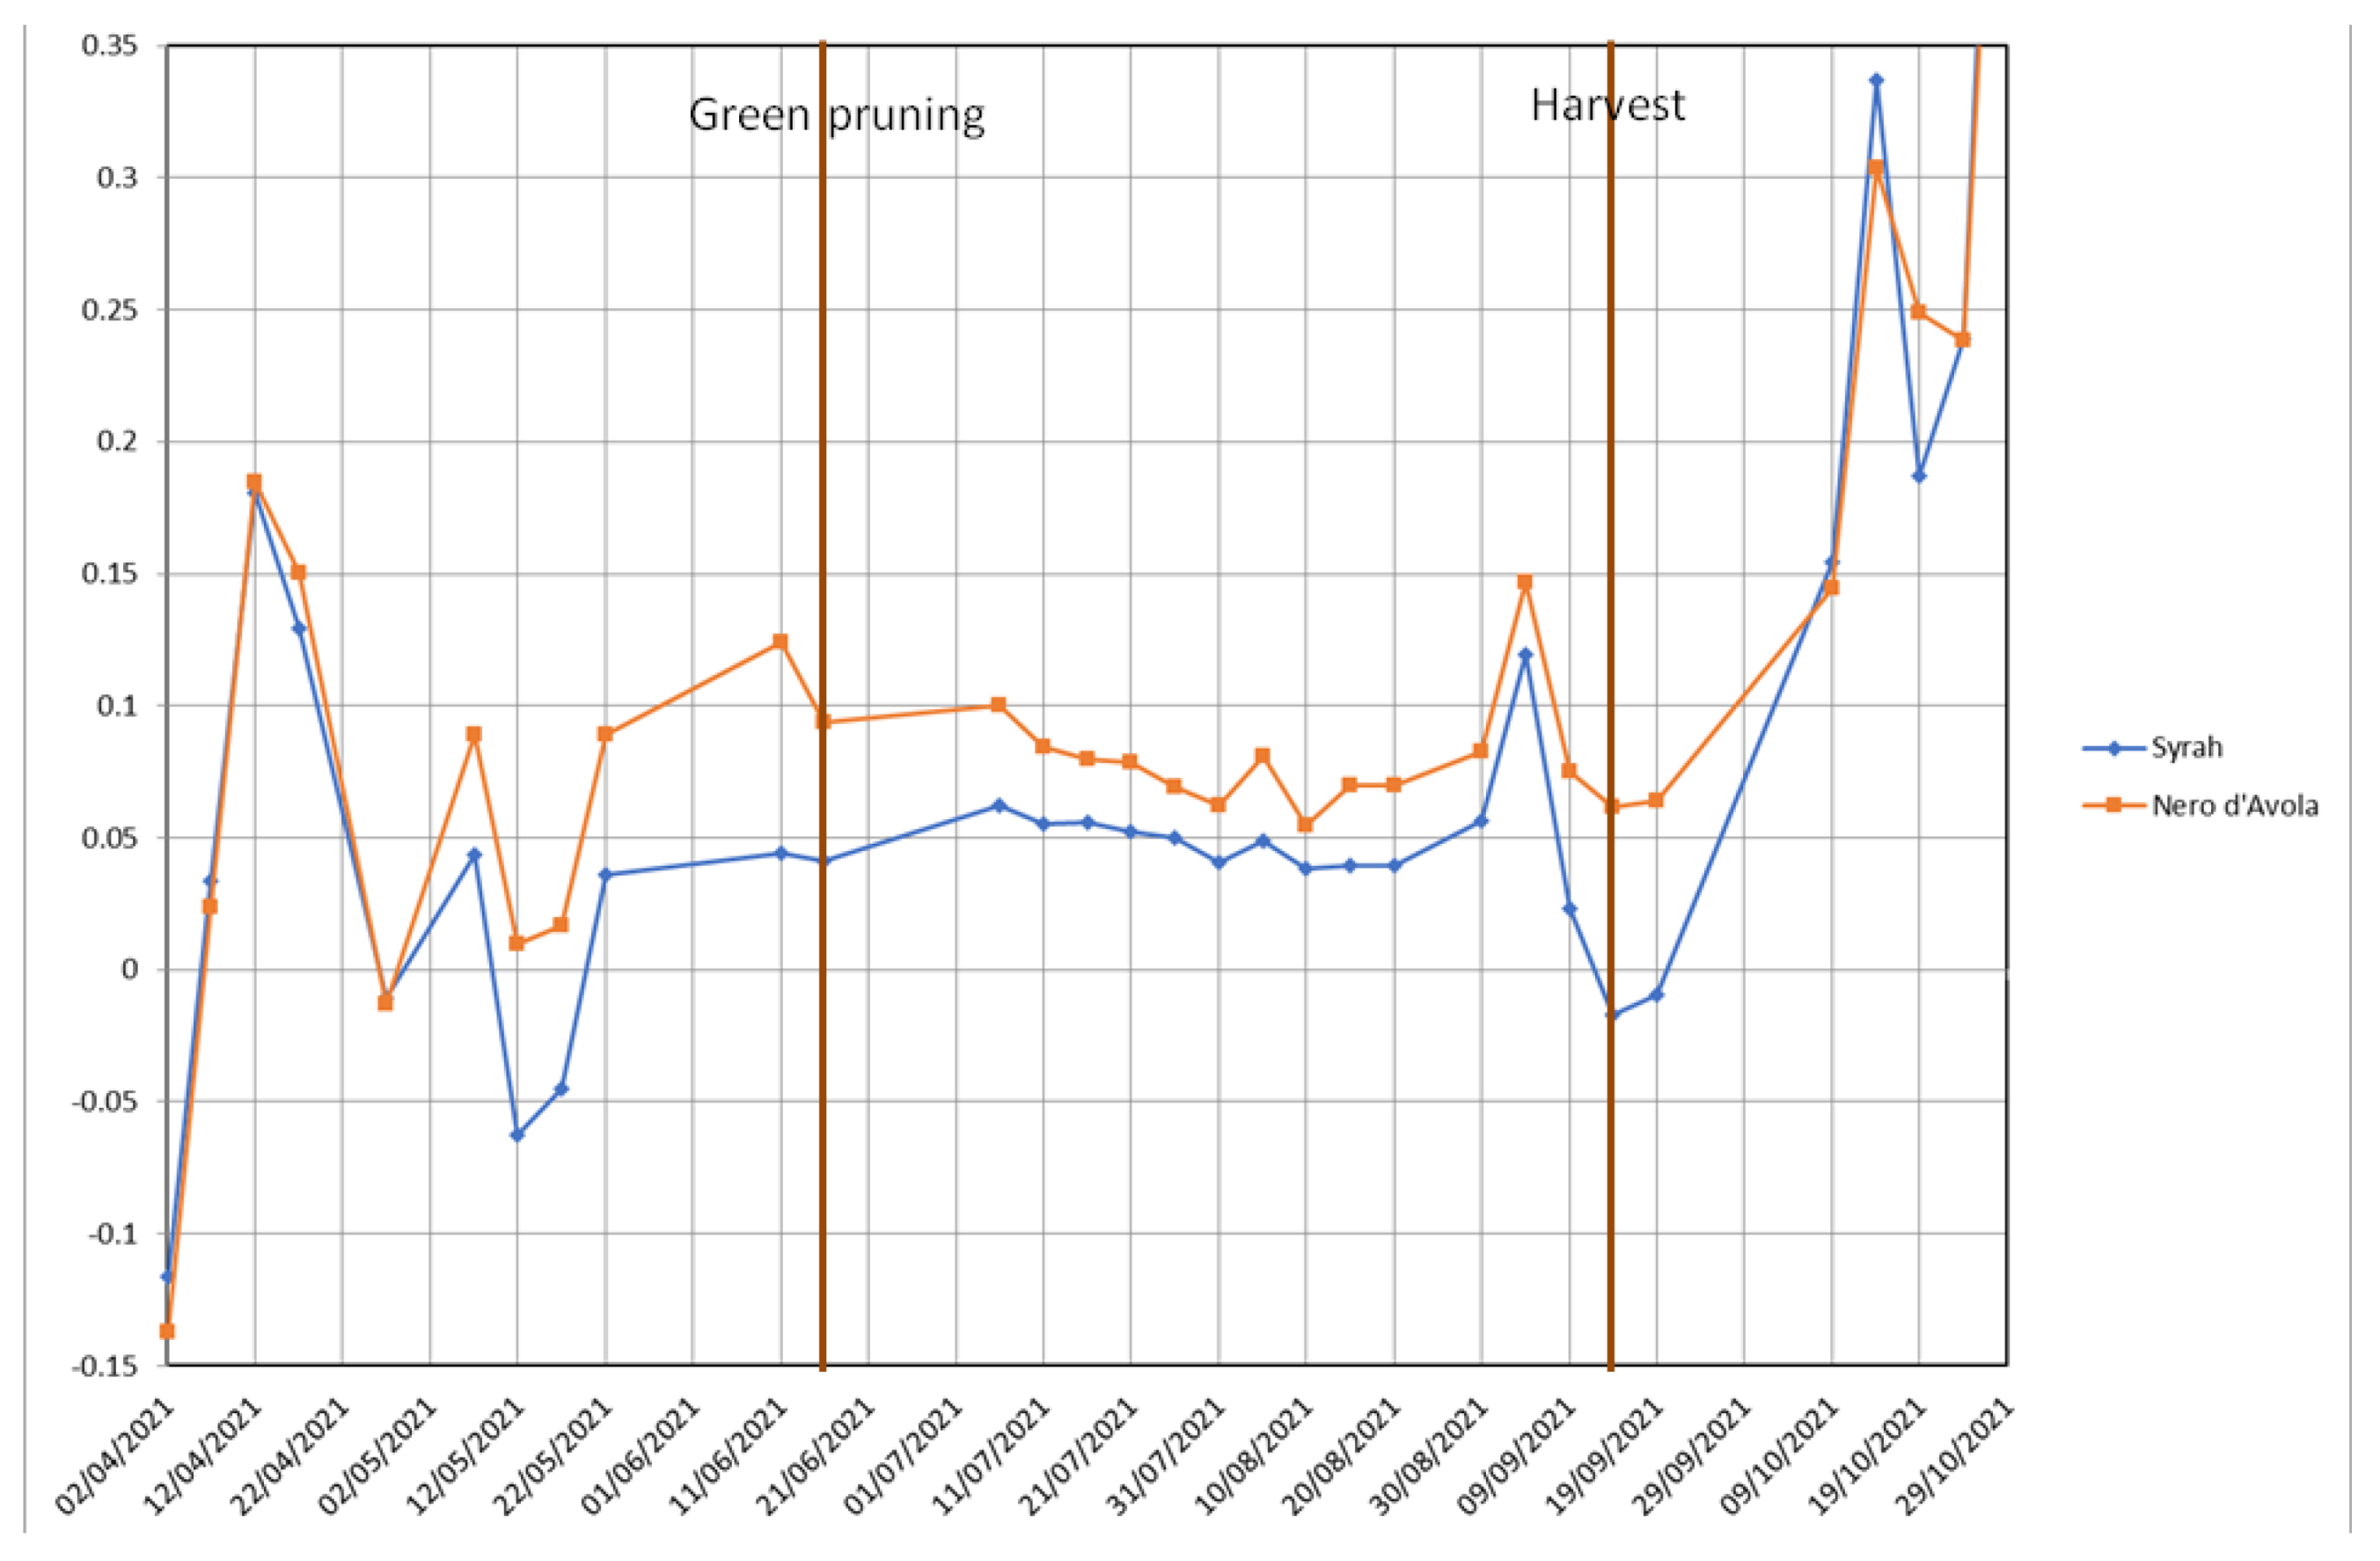
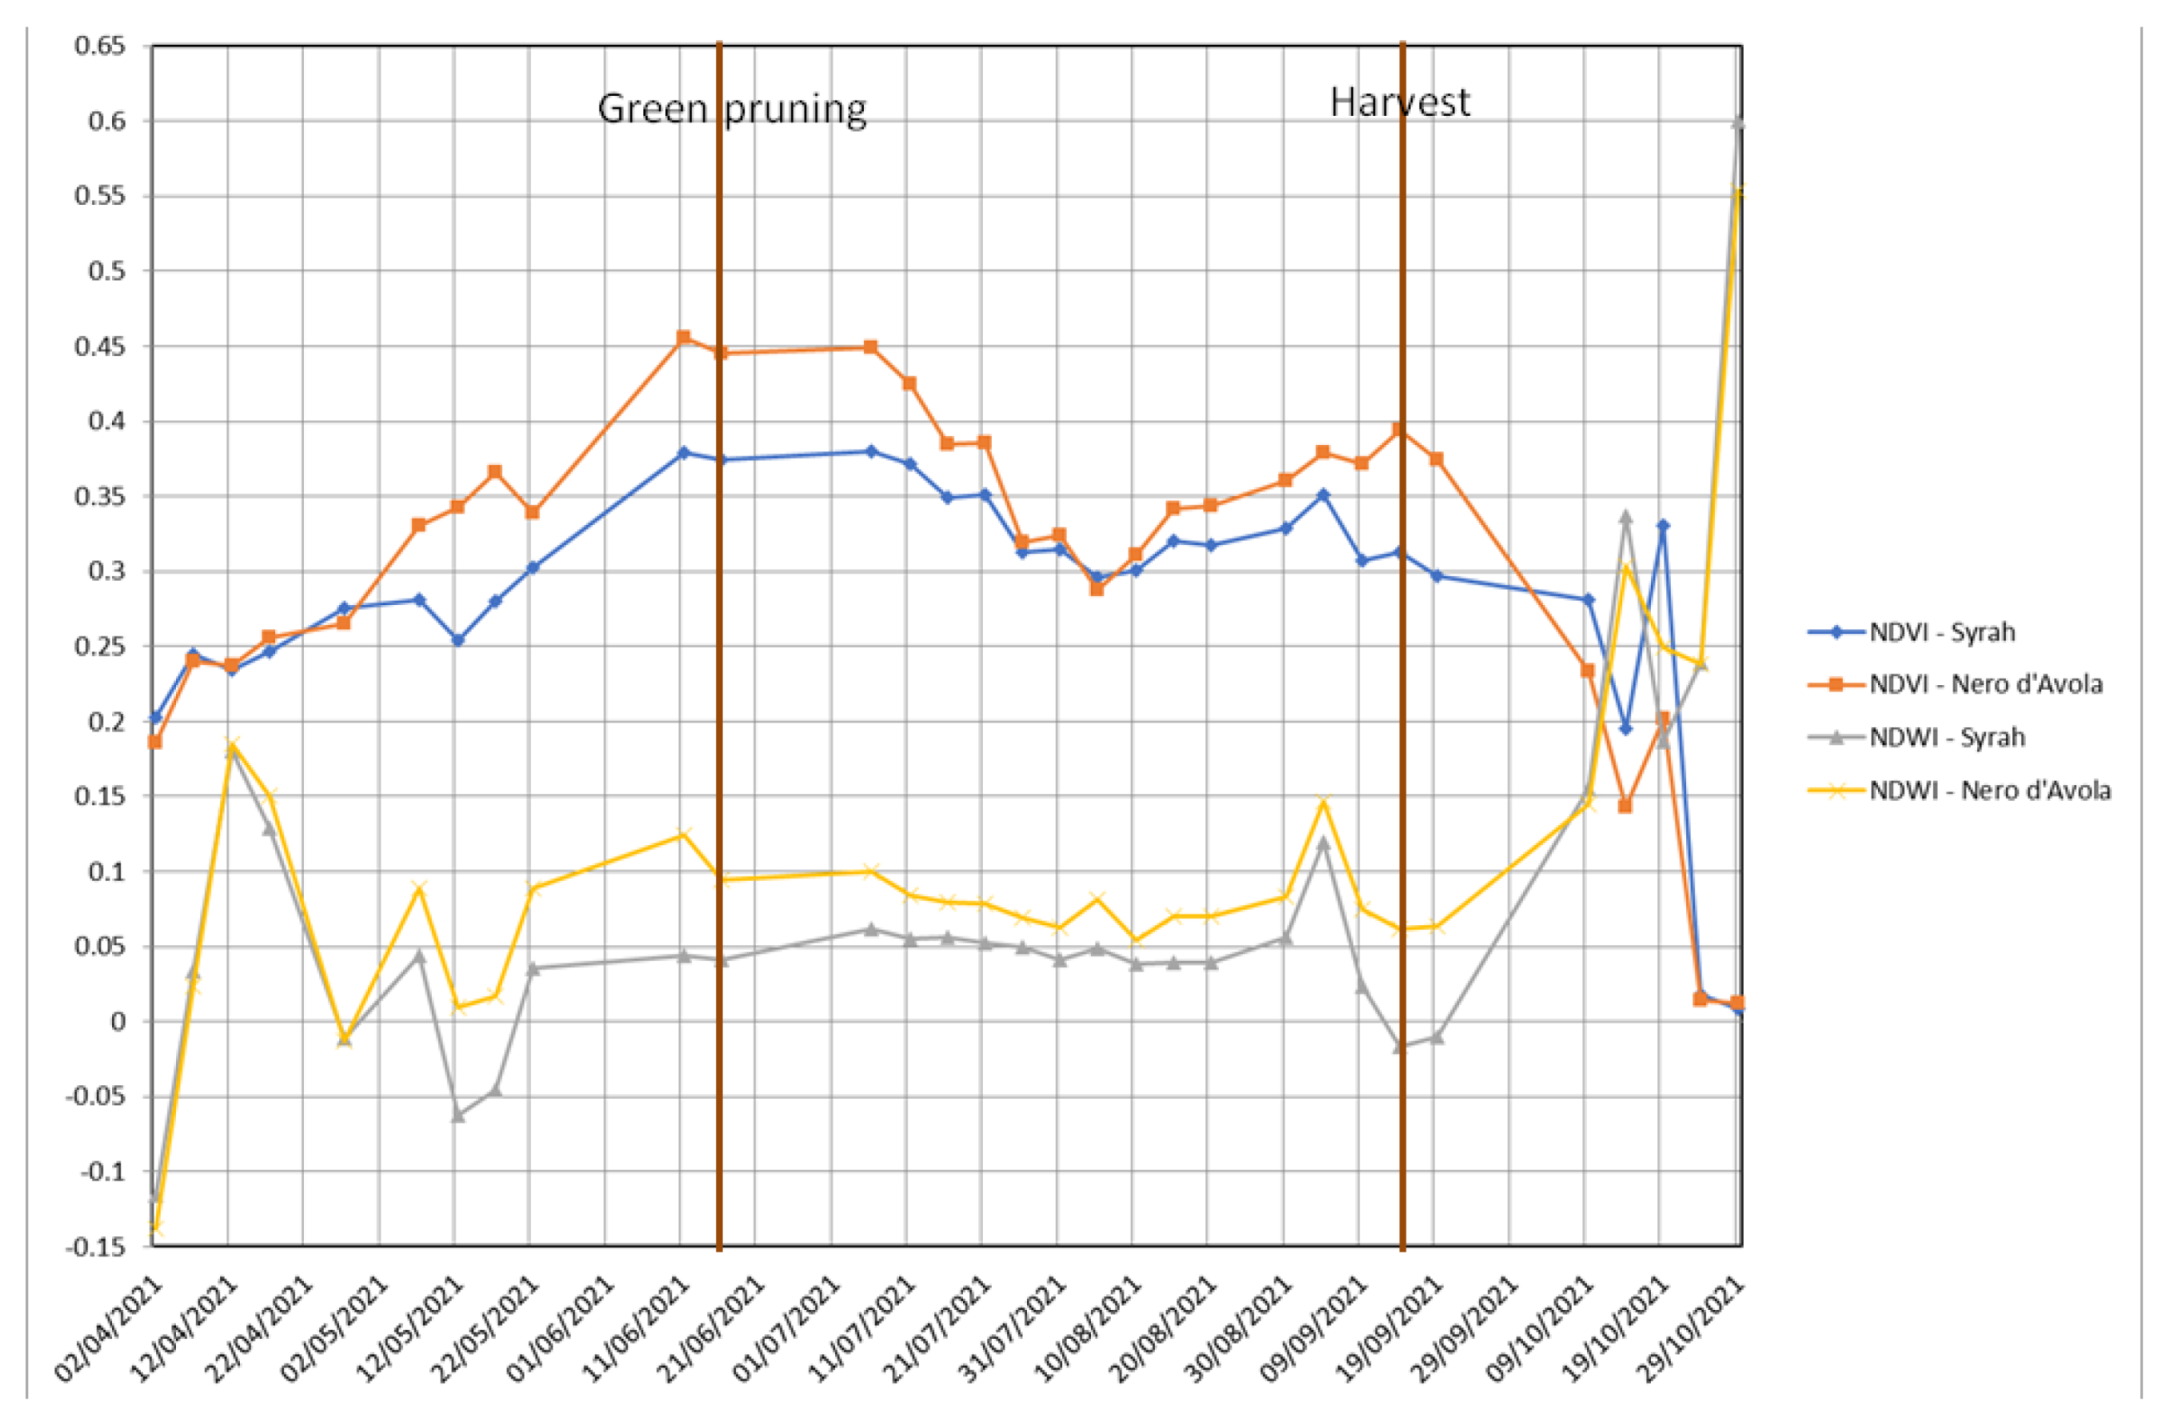
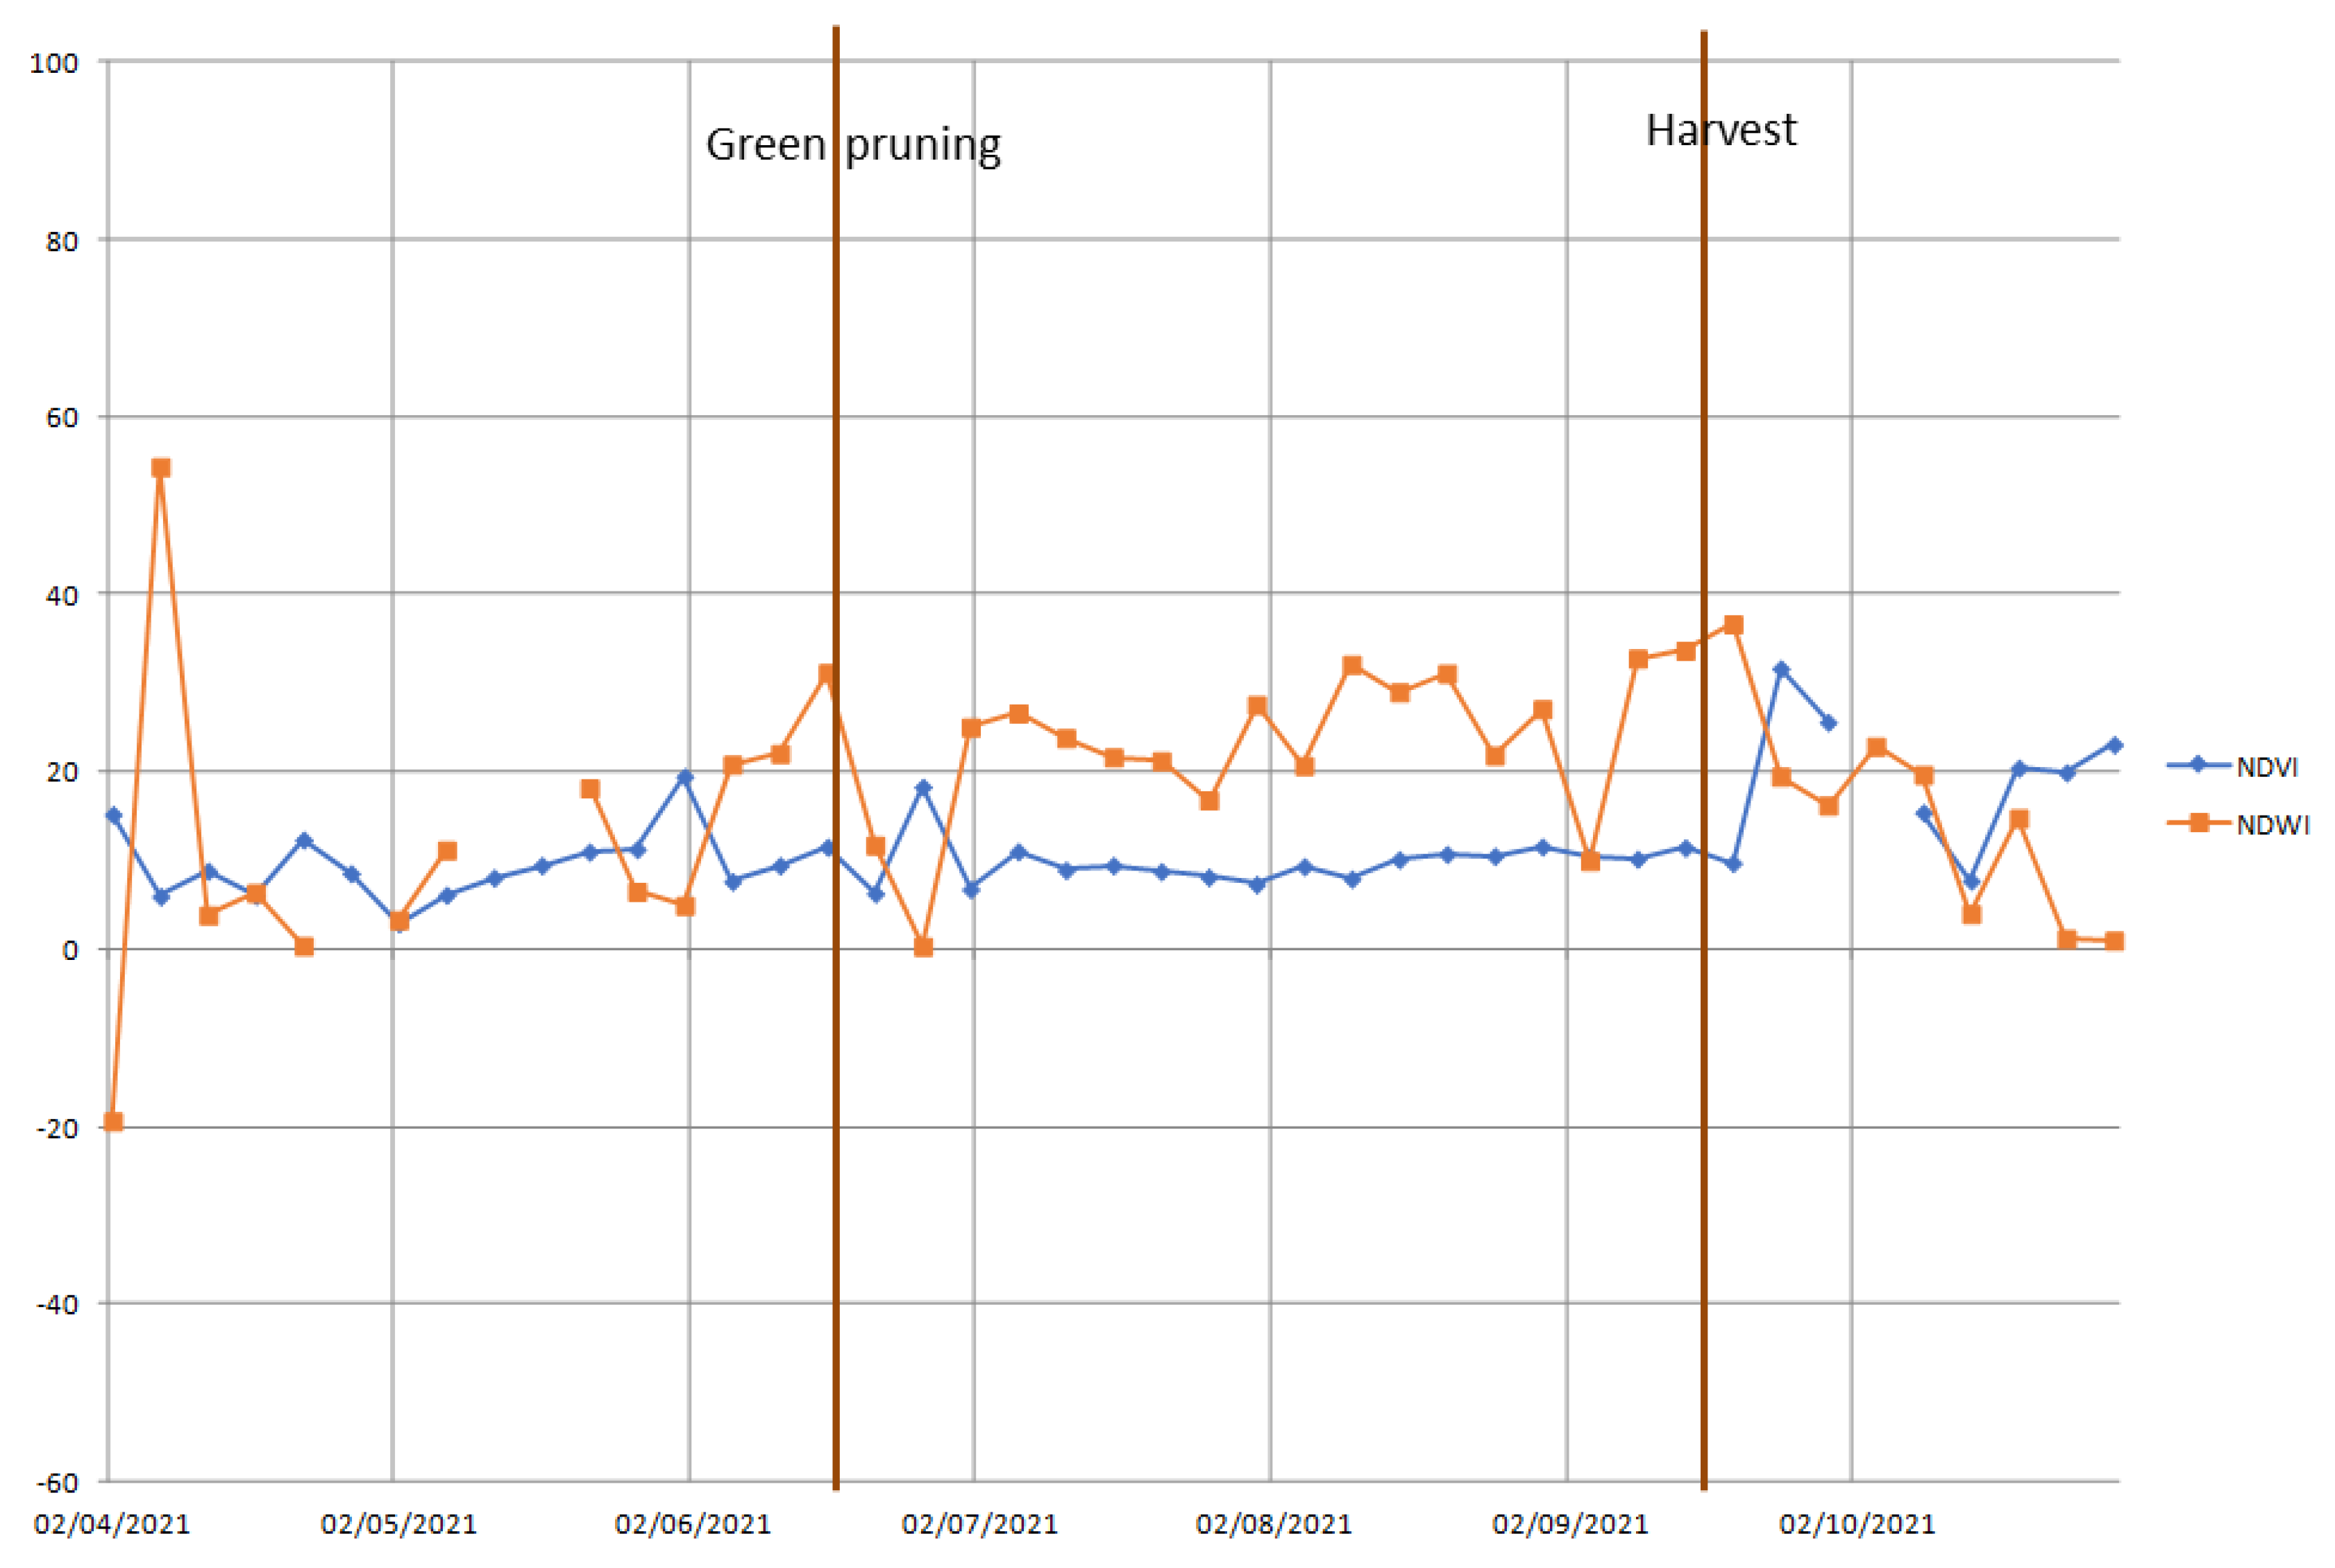
3.1. Vegetative Vigour
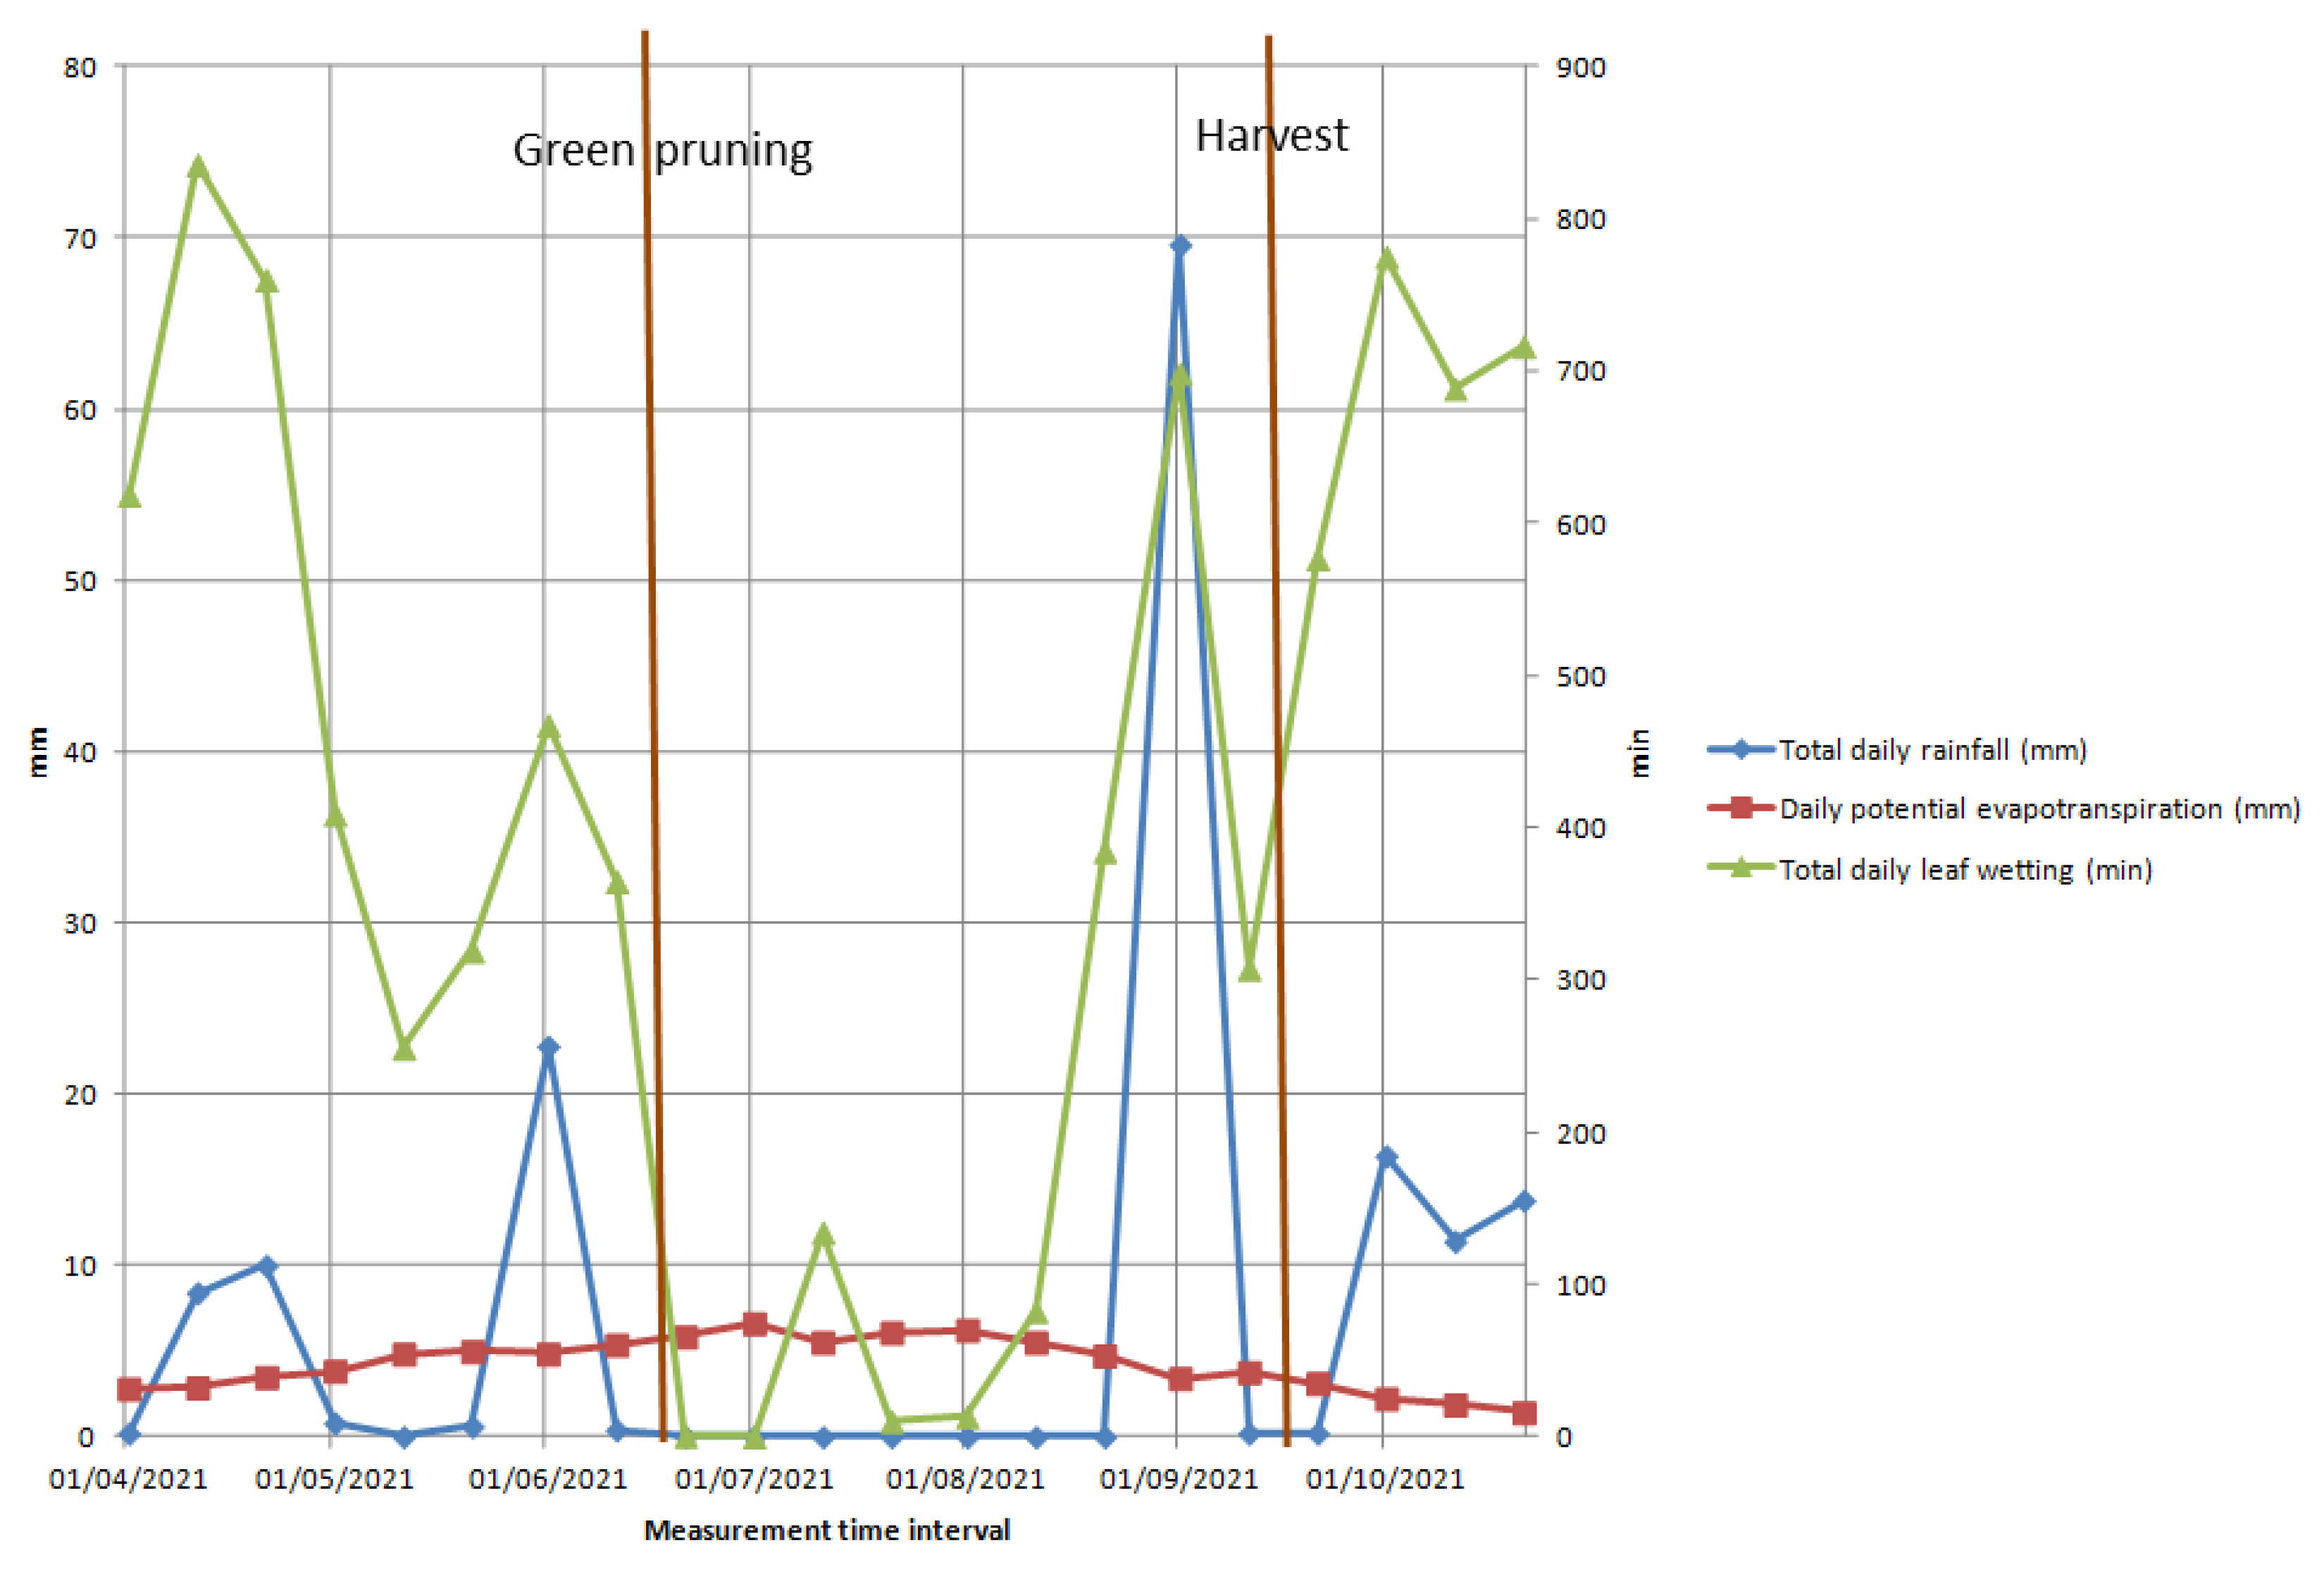
3.2. Leaf Water Content
3.3. Criterion for Deciding the Optimal Fertilisation Time
3.4. Temporal Variability
3.5. Spatial Variability
4. Discussion
5. Conclusions
- -
- deciding if spatially variable rate fertiliser management must be performed in a field, based on the eventual within-field spatial variability of plant vegetative vigour;
- -
- identifying the optimal fertilisation time, based on the comparison between the graph of plant vegetative vigour and that of plant leaf water content (also for spatially uniform rate fertilisation, within traditional viticulture); and
- -
- determining the spatially variable fertiliser rate to be applied in each management zone, based on the within-field spatial variability of plant vegetative vigour.
Author Contributions
Funding
Informed Consent Statement
Acknowledgments
Conflicts of Interest
References
- Bramley, R.G.V. Precision Viticulture: Managing vineyard variability for improved quality outcomes. In Precision Viticulture; Woodhead Publishing Limited: Cambridge, UK, 2010; Volume 12, pp. 445–480. [Google Scholar]
- Bramley, R.G.V. 12—Precision Viticulture: Managing vineyard variability for improved quality outcomes. In Woodhead Publishing Series in Food Science, Technology and Nutrition, Managing Wine Quality, 2nd ed.; Reynolds, A.G., Ed.; Woodhead Publishing Limited: Cambridge, UK, 2022; pp. 541–586. ISBN 9780081020678. [Google Scholar] [CrossRef]
- Bonilla, I.; de Toda, F.M.; Martínez-Casasnovas, J.A. Vine vigor, yield and grape quality assessment by airborne remote sensing over three years: Analysis of unexpected relationships in cv. Tempranillo. Span. J. Agric. Res. 2015, 13, e0903. [Google Scholar] [CrossRef]
- Government of Canada: Remote Sensing Tutorials. Available online: https://www.nrcan.gc.ca/maps-tools-publications/satellite-imagery-air-photos/tutorial-fundamentals-remote-sensing/9309 (accessed on 27 October 2021).
- Ammoniaci, M.; Kartsiotis, S.-P.; Perria, R.; Storchi, P. State of the art of monitoring technologies and data processing for precision viticulture. Agriculture 2021, 11, 201. [Google Scholar] [CrossRef]
- Zhaoa, D.H.; Li, J.L.; Qi, J.G. Identification of red and NIR spectral regions and vegetative indices for discrimination of cotton nitrogen stress and growth stage. Comput. Electron. Agric. 2005, 48, 155–169. [Google Scholar] [CrossRef]
- Zhu, Y.; Yao, X.; Tian, Y.-C.; Liu, X.-J.; Cao, W.-X. Analysis of common canopy vegetation indices for indicating leaf nitrogen accumulations in wheat and rice. Int. J. Appl. Earth Obs. Geoinf. 2008, 10, 1–10. [Google Scholar] [CrossRef]
- Bagheri, N.; Ahmadi, H.; Alavipanah, S.K.; Omid, M. Multispectral remote sensing for site-specific nitrogen fertilizer management. Pesq. Agropec. Bras. Brasília 2013, 48, 1394–1401. [Google Scholar] [CrossRef] [Green Version]
- Cammarano, D.; Fitzgerald, G.J.; Casa, R.; Basso, B. Assessing the Robustness of Vegetation Indices to Estimate Wheat N in Mediterranean Environments. Remote Sens. 2014, 6, 2827–2844. [Google Scholar] [CrossRef] [Green Version]
- Elazab, A.; Ordónez, R.A.; Savin, R.; Slafer, G.A.; Araus, J.L. Detecting interactive effects of N fertilization and heat stress on maize productivity by remote sensing techniques. Eur. J. Agron. 2016, 73, 11–24. [Google Scholar] [CrossRef]
- Carvajal-Ramírez, F.; Marques da Silva, J.R.; Agüera-Vega, F.; Martínez-Carricondo, P.; Serrano, J.; Moral, F.J. Evaluation of Fire Severity Indices Based on Pre- and Post-Fire Multispectral Imagery Sensed from UAV. Remote Sens. 2019, 11, 993. [Google Scholar] [CrossRef] [Green Version]
- Reynolds, A.G.; Brown, R.; Jollineau, M.; Shemrock, A.; Kotsaki, E.; Lee, H.-S.; Zheng, W. Application of remote sensing by unmanned aerial vehicles to map variability in Ontario Riesling and Cabernet Franc vineyards. In Proceedings of the 11th International Terroir Congress, McMinnville, OR, Canada, 12 July 2016; pp. 1–7. [Google Scholar]
- Rey-Caramés, C.; Diago, M.P.; Martín, M.P.; Lobo, A.; Tardaguila, J. Using RPAS Multi-Spectral Imagery to Characterise Vigour, Leaf Development, Yield Components and Berry Composition Variability within a Vineyard. Remote Sens. 2015, 7, 14458–14481. [Google Scholar] [CrossRef] [Green Version]
- Anastasiou, E.; Balafoutis, A.; Darra, N.; Psiroukis, V.; Biniari, A.; Xanthopoulos, G.; Fountas, S. Satellite and Proximal Sensing to Estimate the Yield and Quality of Table Grapes. Agriculture 2018, 8, 94. [Google Scholar] [CrossRef] [Green Version]
- Fontana, D.C.; Melo, R.W.; Wagner, A.P.L.; Weberb, E.; Gusso, A. Use of remote sensing for crop yield and area estimates in Southern Brazil. In ISPRS (International Society for Photogrammetry and Remote Sensing) Archives, WG VIII/10 Workshop Proceedings 2006 “Remote Sensing Support to Crop Yield Forecast and Area Estimates”, Stresa, Italy, 30 November–1 December 2006; Baruth, B., Royer, A., Genovese, G., Eds.; JRC (Joint Research Centre), Institute for the Protection and Security of the Citizen: Stresa (Verbano-Cusio-Ossola), Italy, 2013; Volume XXXVI. [Google Scholar]
- Macedo, F.L.; Sousa, A.M.O.; Gonçalves, A.C.; Marques da Silva, J.R.; Mesquita, P.A.; Rodrigues, R.A.F. Above-ground biomass estimation for Quercus rotundifolia using vegetation indices derived from high spatial resolution satellite images. Eur. J. Remote Sens. 2018, 51, 932–944. [Google Scholar] [CrossRef] [Green Version]
- Sousa, A.M.O.; Gonçalves, A.C.; Mesquita, P.; Marques da Silva, J.R. Biomass estimation with high resolution satellite images: A case study of Quercus rotundifolia. ISPRS J. Photogramm. Remote Sens. 2015, 101, 69–79. [Google Scholar] [CrossRef] [Green Version]
- Vélez, S.; Rubio, J.A.; Andrés, M.I.; Barajas, E. Agronomic classification between vineyards (‘Verdejo’) using NDVI and Sentinel-2 and evaluation of their wines. Vitis 2019, 58, 33–38. [Google Scholar] [CrossRef]
- Gatti, M.; Garavani, A.; Terron, A.; Parisi, M.G.; Bernizzoni, F.; Poni, S. Preliminary application of variable rate N-fertilization in the Colli Piacentini area. Internet J. Enol. Vitic. 2016, 5, 1–20. Available online: www.infowine.com (accessed on 28 December 2021).
- Catania, P.; Comparetti, A.; Febo, P.; Morello, G.; Orlando, S.; Roma, E.; Vallone, M. Positioning accuracy comparison of GNSS receivers used for mapping and guidance of agricultural machines. Agronomy 2020, 10, 924. [Google Scholar] [CrossRef]
- Meyers, J.M.; Dokoozlian, N.; Ryan, C.; Bioni, C.; Vanden Heuvel, J.E. A New, Satellite NDVI-Based Sampling Protocol for Grape Maturation Monitoring (Technical Note). Remote Sens. 2020, 12, 1159. [Google Scholar] [CrossRef] [Green Version]
- AgroInsider: Agroinsider Web App. Available online: https://agromap.agroinsider.com/ (accessed on 27 October 2021).
- European Space Agency (ESA): Earth Online, Earth Observation Information Discovery Platform. Available online: https://earth.esa.int/eogateway (accessed on 27 October 2021).
- Sánchez-Crespo, F.A.; Marques da Silva, J.R.; Gómez-Villarino, M.T.; Gallego, E.; Fuentes, J.M.; García, A.I.; Ayuga, F. Differential Interferometry over Sentinel-1 TopSAR Images as a Tool for Water and Tillage Soil Erosion Analysis. Agronomy 2021, 11, 2075. [Google Scholar] [CrossRef]
- Borgogno-Mondino, E.; de Palma, L.; Novello, V. Investigating Sentinel 2 Multispectral Imagery Efficiency in Describing Spectral Response of Vineyards Covered with Plastic Sheets. Agronomy 2020, 10, 1909. [Google Scholar] [CrossRef]
- The European Space Agency (ESA): Sentinel Online, Polarimetry. Available online: https://sentinels.copernicus.eu/web/sentinel/user-guides/sentinel-1-sar/product-overview/polarimetry (accessed on 27 October 2021).
- Government of Canada: Radar Polarimetry, Introduction to Polarization. Available online: https://www.nrcan.gc.ca/maps-tools-publications/satellite-imagery-air-photos/remote-sensing-tutorials/microwave-remote-sensing/radar-polarimetry/9275 (accessed on 27 October 2021).
- Raiyani, K.; Gonçalves, T.; Rato, L.; Salgueiro, P.; da Silva, J.R.M. Sentinel-2 Image Scene Classification: A Comparison between Sen2Cor and a Machine Learning Approach. Remote Sens. 2021, 13, 300. [Google Scholar] [CrossRef]
- Serrano, J.; Shahidian, S.; da Silva, J.M.; Paixão, L.; Calado, J.; Carvalho, M.D. Integration of Soil Electrical Conductivity and Indices Obtained through Satellite Imagery for Differential Management of Pasture Fertilization. AgriEngineering 2019, 1, 567–585. [Google Scholar] [CrossRef] [Green Version]
- Serrano, J.; Shahidian, S.; da Silva, J.M.; Paixão, L.; Carreira, E.; Carmona-Cabezas, R.; Nogales-Bueno, J.; Rato, A.E. Evaluation of Near Infrared Spectroscopy (NIRS) and Remote Sensing (RS) for Estimating Pasture Quality in Mediterranean Montado Ecosystem. Appl. Sci. 2020, 10, 4463. [Google Scholar] [CrossRef]
- Serrano, J.; Shahidian, S.; Paixão, L.; da Silva, J.M.; Morais, T.; Teixeira, R.; Domingos, T. Spatiotemporal Patterns of Pasture Quality Based on NDVI Time-Series in Mediterranean Montado Ecosystem. Remote Sens. 2021, 13, 3820. [Google Scholar] [CrossRef]
- Serrano, J.; da Silva, J.M.; Shahidian, S.; Silva, L.L.; Sousa, A.; Baptista, F. Differential vineyard fertilizer management based on nutrient’s spatio-temporal variability. J. Soil Sci. Plant Nutr. 2017, 17, 46–61. [Google Scholar]
- Sozzi, M.; Bernardi, E.; Kayad, A.; Marinello, F.; Boscaro, D.; Cogato, A.; Gasparini, F.; Tomasi, D. On-the-go variable rate fertilizer application on vineyard using a proximal spectral sensor. In Proceedings of the 2020 IEEE, International Workshop on Metrology for Agriculture and Forestry (MetroAgriFor), Trento, Italy, 4–6 November 2020; pp. 343–347. [Google Scholar]
- Allegro, G.; Martelli, R.; Pizziolo, A.; Pastore, C.; Valentini, G.; Pezzi, F.; Filippetti, I. Using canopy proximal sensors for variable rate fertilization in a Trebbiano Romagnolo vineyard. In Proceedings of the ISHS (International Society for Horticultural Science) 2021, International Symposium on Precision Management of Orchards and Vineyards, Bologna, Italy, 7 October 2021. [Google Scholar]
- Zinkevičienė, R.; Jotautienė, E.; Juostas, A.; Comparetti, A.; Vaiciukevičius, E. Simulation of granular organic fertilizer application by centrifugal spreader. Agronomy 2021, 11, 247. [Google Scholar] [CrossRef]
- Junges, A.H.; Fontana, D.C.; Anzanello, R.; Bremm, C. Normalized difference vegetation index obtained by ground-based remote sensing to characterize vine cycle in Rio Grande do Sul, Brazil, Índice de vegetação por diferença normalizada obtido por sensor remoto de superfície para caracterização do ciclo de videiras no Rio Grande do Sul, Brasil. Ciência E Agrotecnologia 2017, 41, 543–553. [Google Scholar]
- Mazzetto, F.; Calcante, A.; Mena, A.; Vercesi, A. Integration of optical and analogue sensors for monitoring canopy health and vigour in precision viticulture. Precis. Agric. 2010, 11, 636–649. [Google Scholar] [CrossRef]
- Earth Observing System: Index Stack (NDVI, NDWI, NDSI). Available online: https://eos.com/make-an-analysis/index-stack/ (accessed on 9 January 2022).
- Gao, B.-C. NDWI—A normalized difference water index for remote sensing of vegetation liquid water from space. Remote Sens. Environ. 1996, 58, 257–266. [Google Scholar] [CrossRef]
- Johnson, L.F. Temporal stability of an NDVI-LAI relationship in a Napa Valley vineyard. Aust. J. Grape Wine Res. 2003, 9, 96–101. [Google Scholar] [CrossRef]
- Pringle, M.J.; McBratney, A.B.; Whelan, B.; Taylor, J.A. A preliminary approach to assessing the opportunity for site-specific crop management in a field, using yield monitor data. Agric. Syst. 2003, 76, 273–292. [Google Scholar] [CrossRef]
- Arnó, J.; Martínez-Casasnovas, J.A.; Moral, M.T. Assessing opportunities for selective winery vintage with a market-driven composite index. Cogent Food Agric. 2017, 3, 1386438. [Google Scholar] [CrossRef]
- Comparetti, A. Precision Agriculture: Past, Present and Future. In Proceedings of the International Scientific Conference “Agricultural Engineering and Environment—2011”, Key-Note Presentation. Akademija, Kaunas District, Lithuania, 22–23 September 2011; pp. 216–230. [Google Scholar]


| Parameter | Obtained Value (Syrah) | Obtained Value (Nero d’Avola) | Measurement Unit | Reference Value |
|---|---|---|---|---|
| Clay | 45 | 46 | % | 45 |
| Loam | 29 | 28 | % | 18.5 |
| Sand | 26 | 26 | % | 36.5 |
| Total Nitrogen (Kjeldhal) | 1.25 | 1.10 | g kg−1 | 1.03–6.50 |
| Organic matter (organic Carbonium × 1.72) | 2.71 | 1.88 | % | 1.5–3.5 |
| Absorbable Phosporus (P2O5) | 46.5 | 45.7 | ppm | 35.0–92.5 |
| Total Limestone | 3.4 | 5.4 | g kg−1 | 10–15 |
| Active Limestone | 1.3 | 2.1 | % | 2–5 |
| pH (inside water) | 7.3 | 7.4 | - | 5.5–8.0 |
| Electrical Conductivity (EC) at 25 °C (extract 1:5) | 0.45 | 0.44 | mS cm−1 | 0.1–1.0 |
| Cationic Exchange Capacity (CEC) | 17 | 18 | mEq 100 g−1 | 10–20 |
| Exchangeable Calcium (Ca2+) | 3050 | 3020 | ppm | 3500–4500 |
| Exchangeable Magnesium (Mg2+) | 176 | 155 | ppm | 250–400 |
| Exchangeable Sodium | 7 | 6 | ppm | <300 |
| Exchangeable Potassium (K+) | 323 | 321 | ppm | 250–500 |
| Parameter | Value | Measurement Unit |
|---|---|---|
| Water | 22–26 | % |
| Organic matter (humus) | 38–45 | % |
| pH | 6–7 | - |
| Total Nitrogen | 3–4 | % |
| Phosphorus | 3–4 | % |
| Potassium | 3–4 | % |
| Boron | 25 | mg kg−1 |
| Magnesium | 1 | % |
| Fulvic acids | 9 | % |
| Humic acids | 10 | % |
| Sulphur trioxide (SO3) | 1 | % |
| C/N ratio | 7.3 | - |
| Total aerobic bacteria | 2,164,000,000 | units forming colony g−1 |
| Total anaerobic bacteria | 1,715,000,000 | units forming colony g−1 |
| Raw proteins | 19–25 | % |
| Raw lipids | 2–3 | % |
| Raw fibre | 8–12 | % |
| Cationic Exchange Capacity (CEC) | 30–50 | mEq 100 g−1 |
| Specific weight | 0.5–0.6 | kg dm−3 |
| Measurement Time Interval | Average Daily Air Temperature (°C) | Maximum Daily Air Temperature (°C) | Minimum Daily Relative Humidity (%) |
|---|---|---|---|
| 1–10 April 2021 | 11.56 | 17.58 | 45.8 |
| 11–20 April 2021 | 11.18 | 16.81 | 47.5 |
| 21–30 April 2021 | 15.73 | 22.29 | 44.7 |
| 1–10 May 2021 | 17.84 | 24.4 | 33.1 |
| 11–20 May 2021 | 17.96 | 24.8 | 27.1 |
| 21–31 May 2021 | 19.53 | 26.99 | 26.91 |
| 1–10 June 2021 | 20.13 | 27.24 | 30.6 |
| 11–20 June 2021 | 22 | 30.08 | 27.5 |
| 21–30 June 2021 | 29.34 | 38 | 16.5 |
| 1–10 July 2021 | 27.32 | 34.67 | 21.8 |
| 11–20 July 2021 | 24.37 | 31.3 | 31.5 |
| 21–31 July 2021 | 27.71 | 35.25 | 19.91 |
| 1–10 August 2021 | 29.07 | 37.14 | 19 |
| 11–20 August 2021 | 27.87 | 35.22 | 26 |
| 21–31 August 2021 | 24.32 | 31.38 | 31.73 |
| 1–10 September 2021 | 21.3 | 28.19 | 44.9 |
| 11–20 September 2021 | 22.71 | 29.93 | 34 |
| 21–30 September 2021 | 22.31 | 28.64 | 44.8 |
| 1–10 October 2021 | 17.47 | 23.57 | 55.3 |
| 11–20 October 2021 | 14.22 | 20.03 | 51.3 |
| 21–31 October 2021 | - | - | 74.18 |
Publisher’s Note: MDPI stays neutral with regard to jurisdictional claims in published maps and institutional affiliations. |
© 2022 by the authors. Licensee MDPI, Basel, Switzerland. This article is an open access article distributed under the terms and conditions of the Creative Commons Attribution (CC BY) license (https://creativecommons.org/licenses/by/4.0/).
Share and Cite
Comparetti, A.; Marques da Silva, J.R. Use of Sentinel-2 Satellite for Spatially Variable Rate Fertiliser Management in a Sicilian Vineyard. Sustainability 2022, 14, 1688. https://doi.org/10.3390/su14031688
Comparetti A, Marques da Silva JR. Use of Sentinel-2 Satellite for Spatially Variable Rate Fertiliser Management in a Sicilian Vineyard. Sustainability. 2022; 14(3):1688. https://doi.org/10.3390/su14031688
Chicago/Turabian StyleComparetti, Antonio, and Jose Rafael Marques da Silva. 2022. "Use of Sentinel-2 Satellite for Spatially Variable Rate Fertiliser Management in a Sicilian Vineyard" Sustainability 14, no. 3: 1688. https://doi.org/10.3390/su14031688
APA StyleComparetti, A., & Marques da Silva, J. R. (2022). Use of Sentinel-2 Satellite for Spatially Variable Rate Fertiliser Management in a Sicilian Vineyard. Sustainability, 14(3), 1688. https://doi.org/10.3390/su14031688