Article

Effects of Climate Change and Human Activities on Aeolian Desertification Reversal in Mu Us Sandy Land, China

1
Key Laboratory of Desert and Desertification, Northwest Institute of Eco-Environment and Resources, Chinese Academy of Sciences, Lanzhou 730000, China
2
University of Chinese Academy of Sciences, Beijing 100049, China
3
Key Laboratory of Ecohydrology of Inland River Basin, Northwest Institute of Eco-Environment and Resources, Chinese Academy of Sciences, Lanzhou 730000, China
*
Author to whom correspondence should be addressed.
Sustainability 2022, 14(3), 1669; https://doi.org/10.3390/su14031669
Submission received: 12 January 2022 / Revised: 23 January 2022 / Accepted: 26 January 2022 / Published: 31 January 2022

Abstract

:
The aeolian desertification in Mu Us Sandy Land (MUSL) in northern China have been paid much attention, but the relative contributions of climate change and human activities to desertification dynamics are still not clear. Based on the Landsat MSS, TM, ETM+ and OLI images in 1975, 1990, 1995, 2000, 2005, 2010 and 2015, we developed a database of aeolian desertification land distribution, discussed the spatial and temporal variation of aeolian desertification, and discovered the relative contributions of climate change and human activities to desertification reversal, using the trends of the potential net primary productivity (NPP) and the human-influenced NPP with meteorological data and MODIS NPP products. The results indicated that aeolian desertification developed firstly from 1975 to 2000, with serious and severe aeolian desertification land continually increasing, and then changed into a reversal state from 2000 to 2015, as the serious aeolian desertification land decreased, although the severe, moderate and light aeolian desertification land lightly increased. Human activities were the dominant factor in desertification dynamics in MUSL and had different contributions to aeolian desertification reversal in different periods. This study will improve our understanding of the processes of aeolian desertification.

Graphical Abstract

1. Introduction

Aeolian desertification, defined as a phenomenon where aeolian transport is exacerbated by decreases in vegetation cover or increases in the intensity of aeolian processes, is a dominant form of land degradation in arid regions [1]. Since the 1950s, desertification has increasingly affected environmental and social sustainable development in the world’s arid, semi-arid and sub-humid zones, which account for a half of the global land area [2,3,4]. In general, the driving factors for desertification mainly include climate change and human activities [5], but their interaction at different spatio-temporal scales makes the desertification process more complex [6,7]. Many scholars in China and abroad share the consensus that significant climate changes, population explosion, intensive land use and large-scale ecological policies and projects have led to a highly complicated desertification dynamics, especially in the past 30 years [8]. So far, most studies have estimated the effects of each driving factor using correlation analysis [9] and principal-components analysis methods [10]. These methods rely on administrative socio-economic statistical and meteorological data, suffer, to some extent, from obvious subjectivity in terms of selecting variables, and are difficult to use to distinguish areas with various dominant factors. Therefore, quantifying the relative contributions of climate change and human activities to the desertification process (desertification development and reversal) is challenging but necessary [11,12].
As an indicator of land surface changes, vegetation can reflect the total condition of the eco-environment, especially the application of NPP. NPP change is caused by various factors, mainly including climate change and human activities [13,14]. Therefore, a vegetation NPP dynamic was used to reveal the impacts of human activities and climate change on the desertification process. Then, the human appropriation of NPP was proposed and used to measure the environmental impacts of human activities [15], which provided a good approach for the quantitative assessment of the effects of human activities on landscape changes, such as desertification [16]. Recent studies confirmed that the dynamics of NPP was a reliable indicator to explain the process of desertification exacerbation and mitigation, and even quantitively estimate the relative contributions of climate change and human activities to desertification dynamics by integrating the potential NPP (PNPP) and the human influenced NPP (HNPP). With the development of remote sensing technology, it has proven to be an effective tool for monitoring and estimating the explicit vegetation growing information in a large region [17]. In particular, multispectral satellite imagery frequently acquired over long periods is a precious resource for the long-term analyses of surface processes [18].
The agropastoral ecotone is highly sensitive to external disturbance, has low self-restoration ability, and has many typical problems in regard to the relationship between human activities and the natural environment [19]. Therefore, the agropastoral ecotone is a typical area of policy implementation and desertification dynamics. The Mu Us Sandy Land (MUSL) is located at the middle of the agropastoral ecotone of China, which is situated nearly 4000 km from northeast to southwest. Based on the remote sensing technique, many scholars have taken MUSL as a case study area to carry out research on the relationship between natural environmental changes and human activities at different scales, including land desertification, land use and cover change and vegetation evolution [20,21]. However, the relative contributions of climate change and human activities to desertification dynamics are still not clear in MUSL; even the reversal of the desertification has been confirmed successively in this region in this century, which limits the understanding of the driving mechanism of desertification dynamics.
In the present study, we aim to discover the desertification dynamics from 1975 to 2015, based on the Landsat MSS, TM, ETM+ and OLI images in 1975, 1990, 1995, 2000, 2005, 2010 and 2015, and to quantify the relative contributions of climate change and human activities to desertification dynamics, using PNPP and HNPP data from 2000 to 2014, where the PNPP was determined based on climate conditions, and HNPP was calculated as the difference between PNPP and the actual NPP (ANPP) from the MODIS NPP data products of NASA. The study will improve our understanding of the processes of aeolian desertification and its driving forces.

2. Materials and Methods
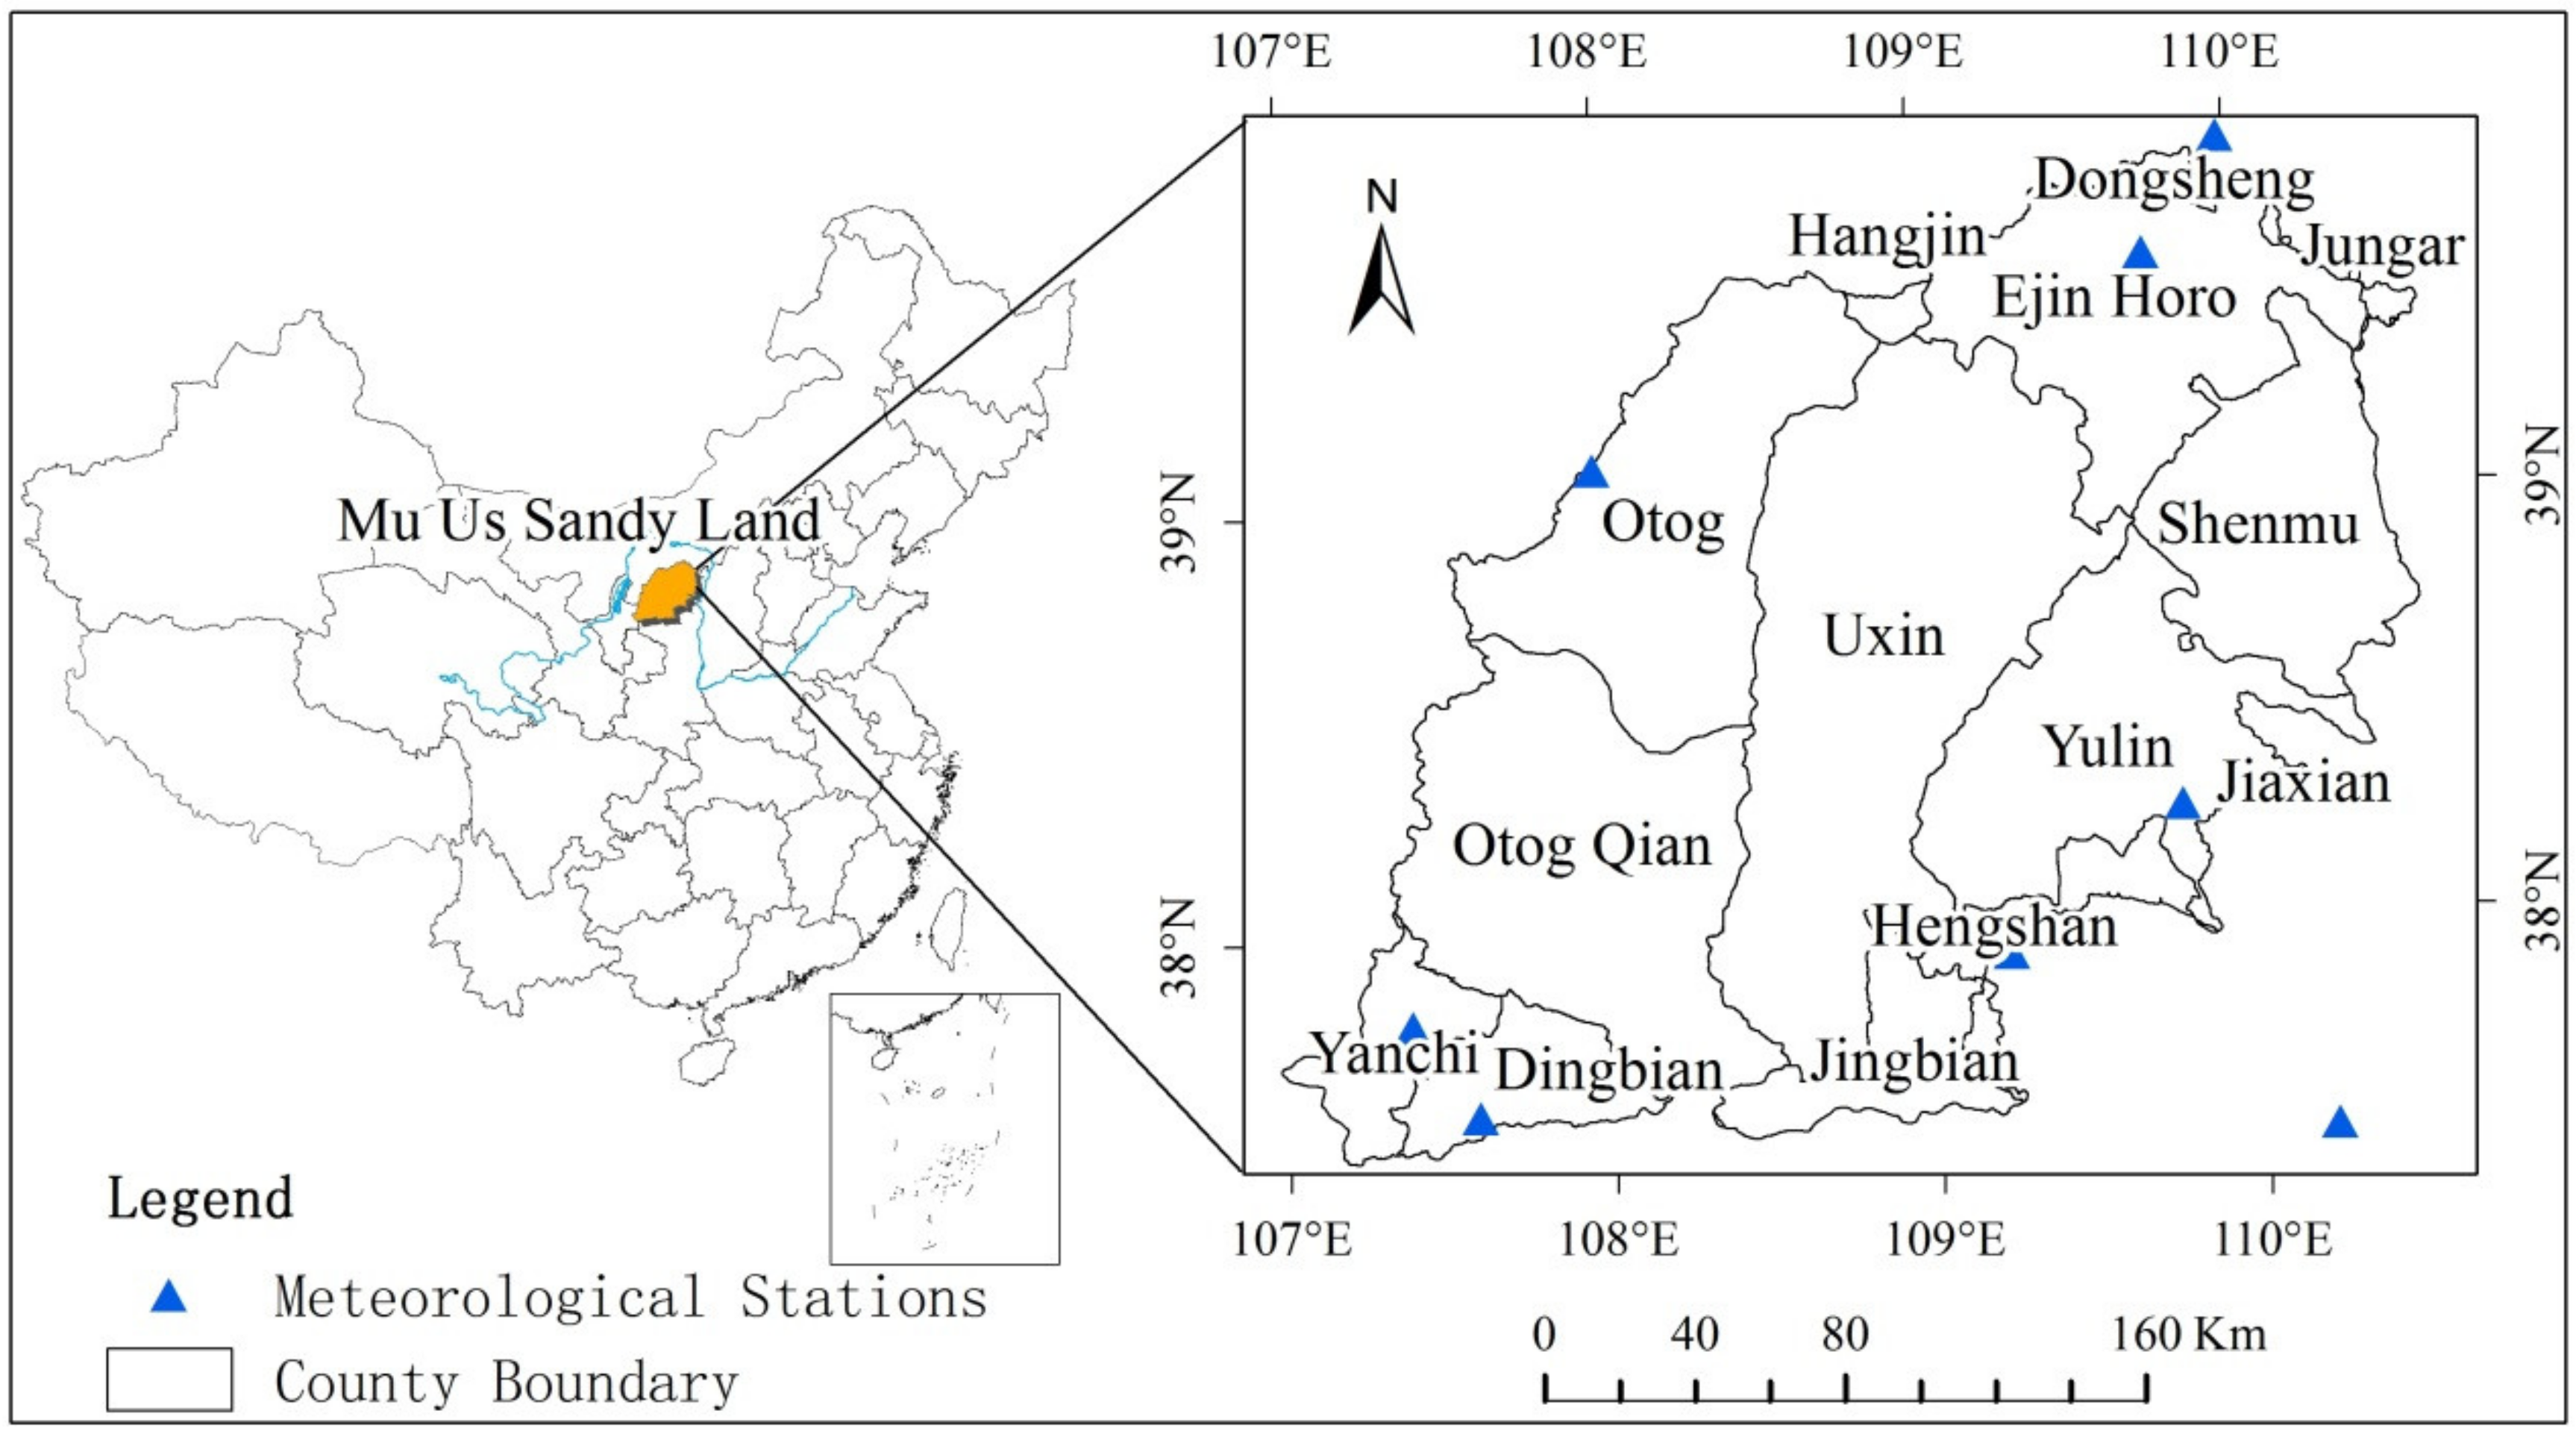
2.1. Study Area

MUSL, across Inner Mongolia Autonomous Region, Ningxia Hui Autonomous Region and Shaanxi Province (106°58′–110°35′ E, 37°28′–39°48′ N), covers an area of 48,289 km2 (see Figure 1). It is the transitional zone between the Ordos Plateau and the Loess Plateau and the elevation ranges from 950 to 1600 m. Its climate type varies from a middle temperate zone to a warm temperate zone, and the annual mean temperature is 6.0–8.5 °C. The mean annual precipitation varies from 250 mm in the northwest to 440 mm in the southeast, about 60–80% of which falls in summer. Semi-mobile sand dunes and semi-fixed sand dunes occupy the majority of MUSL, and fixed sand dunes are widely distributed in the study region [22].
As an agropastoral transition zone, MUSL is dominated by agriculture and animal husbandry; meanwhile, it is an important energy and mineral base in China. The implementation of ethnic, ecological protection and land policies has had profound impacts on surface processes in MUSL. For example, the national policies and projects include the reform and liberalization policy, while the regional policies and projects include the Three-North Shelterbelt Project (TNSP), the Natural Forest Conservation Program (NFCP) and the Grain to Green Program (GTGP) [21].

2.2. Data Sets

The development of sand sheets and dunes indicates the presence of aeolian desertification and can be clearly recognized by remote sensing images [23]. We used Landsat MSS images in 1975, TM images in 1990, 1995 and 2010, ETM+ images in 2000 and OLI images in 2015 to create a database of aeolian desertification land distribution. Some images from 1976, 1989, 1994, 1999, 2004/2006, 2009 and 2014 were chosen to replace unsuitable (bad track and cloudy) images from the relevant periods, respectively. All images were obtained from May to October to represent the growing season for vegetation in the study area.
The meteorological data—including annual temperature and precipitation [24]—was used to calculate the PNPP, and the MODIS NPP products from 2000 to 2014 [25] were used as the ANPP.

2.3. Classification of Aeolian Desertification

Based on the classification system of aeolian desertification in northern China [18], there are four types depending on the vegetation coverage and landscape indicators, including slight, moderate, severe and serious aeolian desertification (Table 1). The object-oriented classification technology was used to extract the types of aeolian desertification, which was more efficient than the traditional interpretation method, with a multi-segmentation algorithm and multiple parameters (e.g., DEM, slope, vegetation coverage, NDVI, band information and texture features). The accuracy of the interpretation results was evaluated by field investigation or with high resolution remote sensing data and the Google Earth platform.
The dynamic of desertification was the changes in desertification land over certain periods. It mainly included two types (desertification development and desertification reversal), and it also was classified into four categories based on the characteristics of desertification land changes, including appeared desertification land, disappeared desertification land, severer degree of desertification land and lighter degree of desertification land (Table 2).

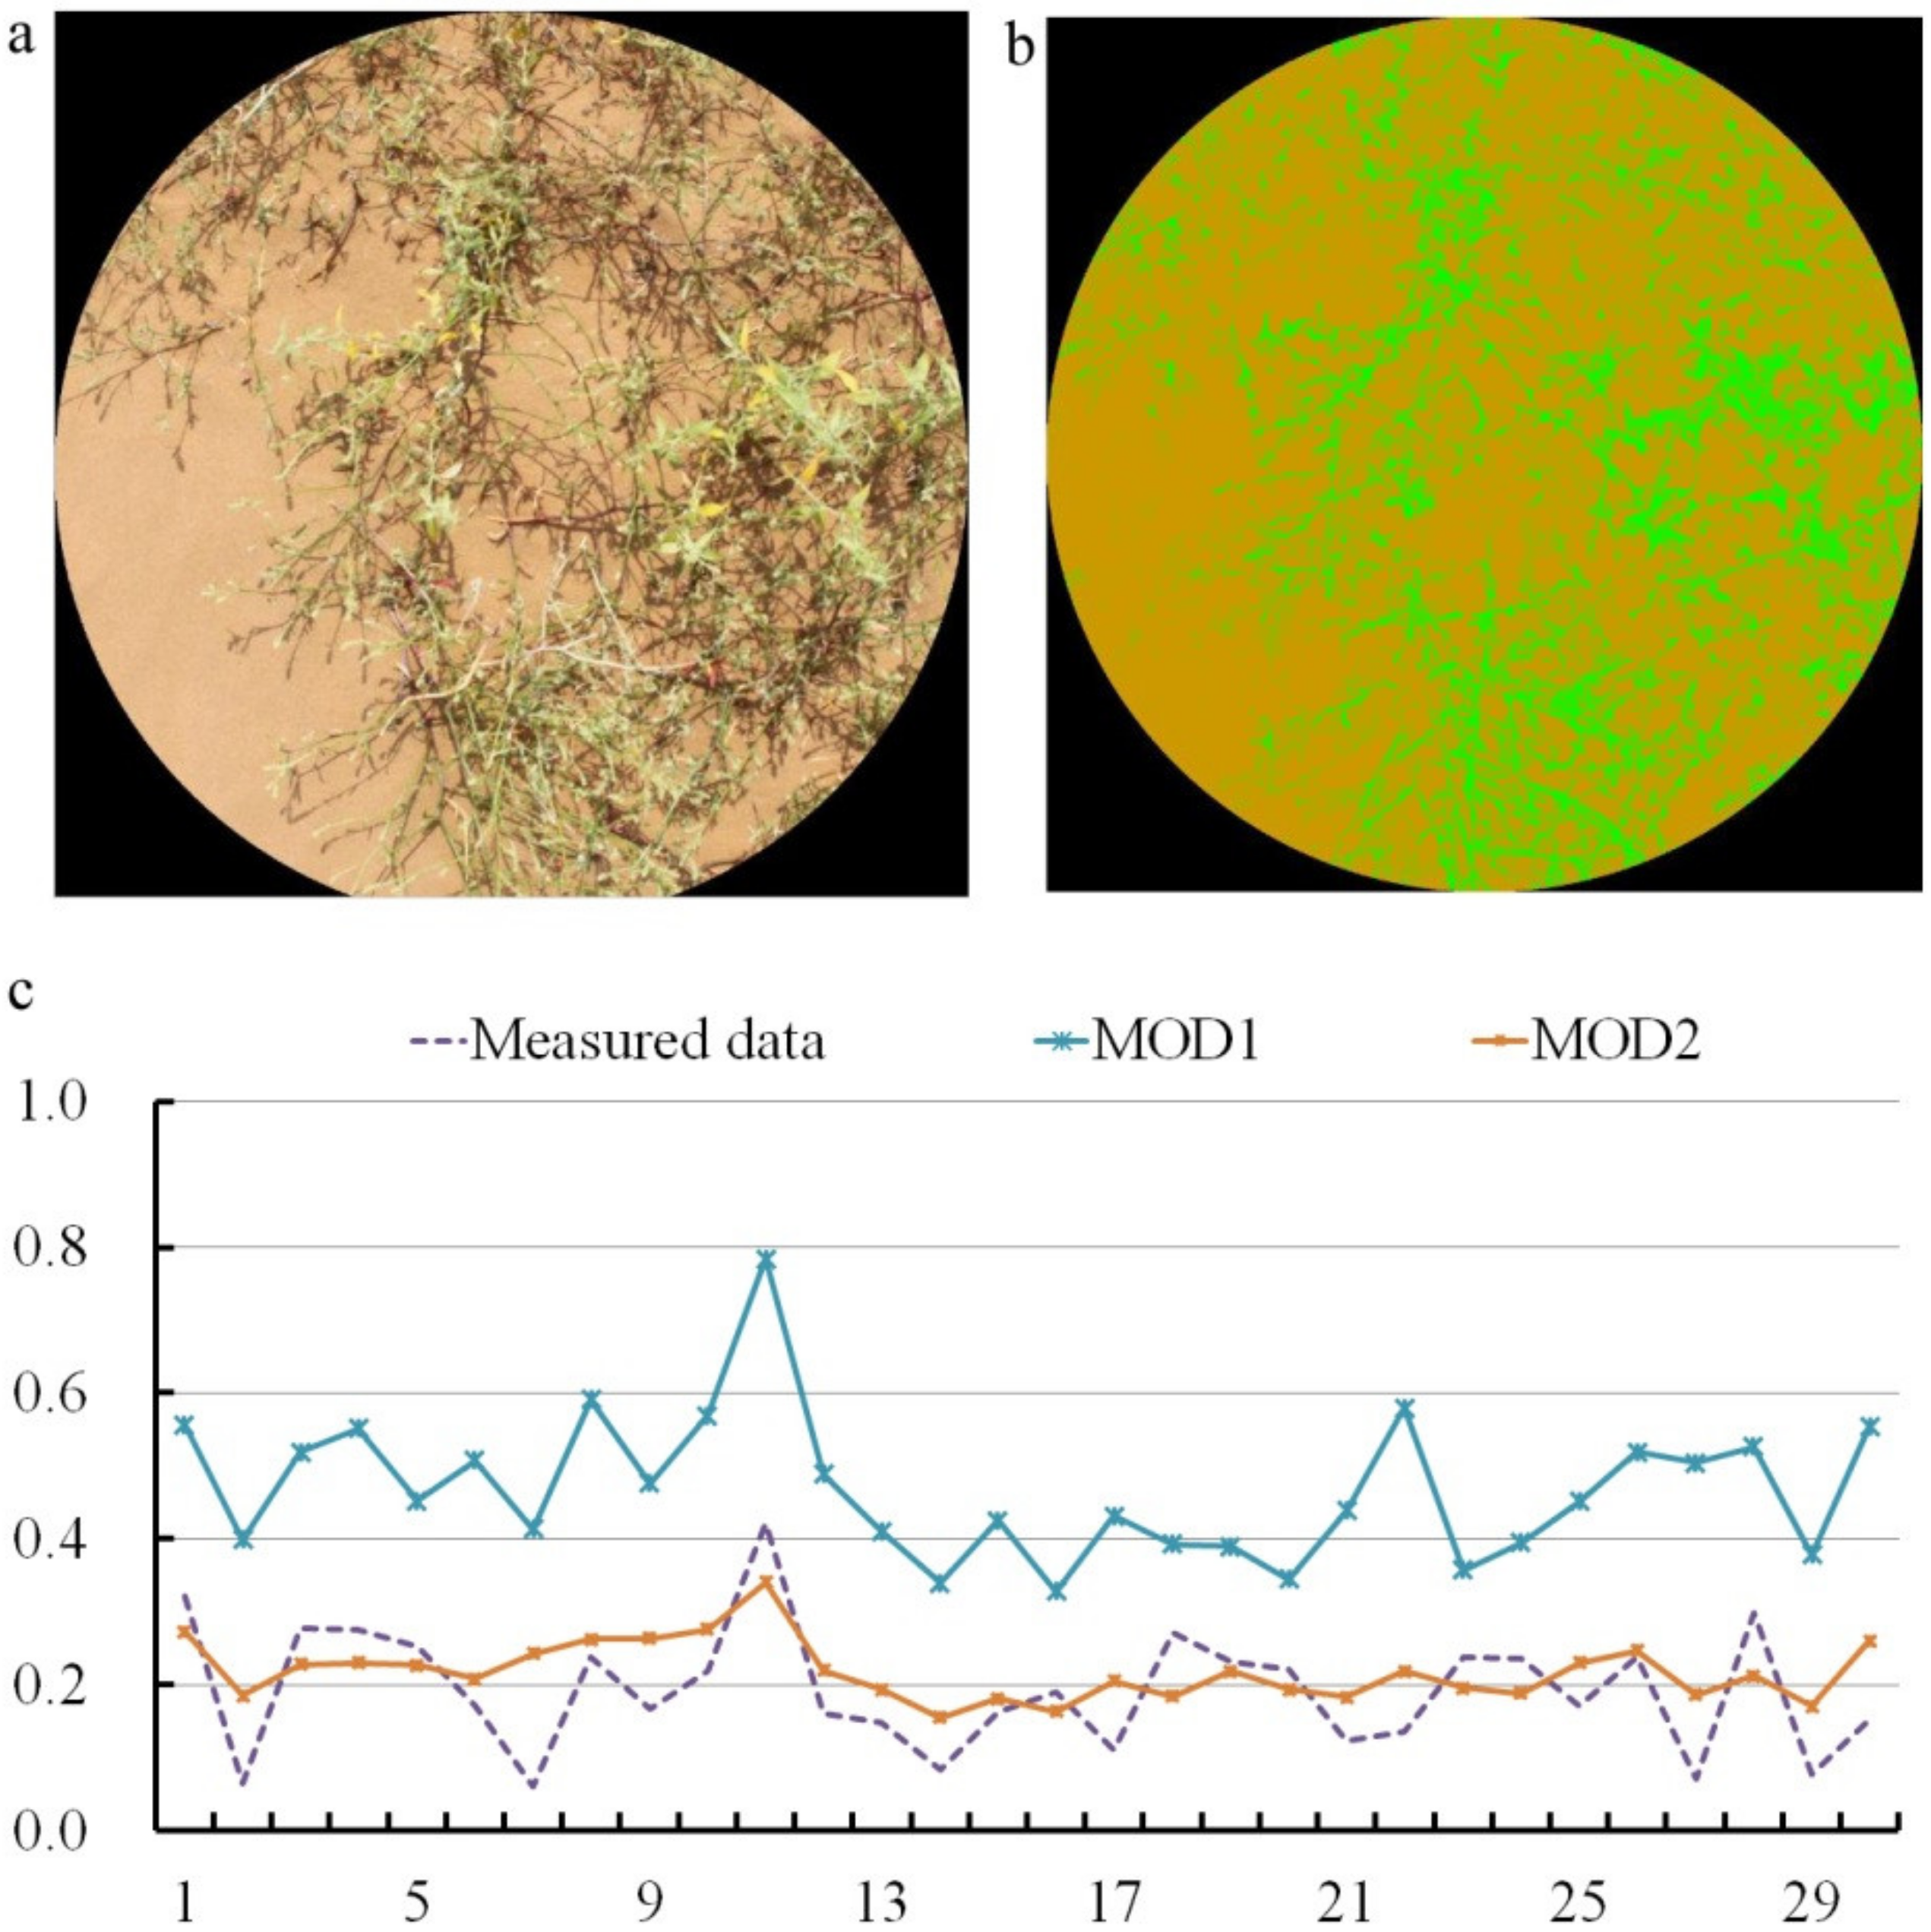
2.4. Fractional Vegetation Cover

Fractional vegetation cover (FVC) is an important index for the extraction of aeolian desertification information. In the process of classification, the first type was divided into a vegetation region and a non-vegetation region based on FVC. However, in an arid or semi-arid region, the spectral information of images was affected by soil background, so the traditional method of FVC based on NDVI (MOD1) [26] was the least accurate (see Figure 2). Compared with the measured data, we used the three-band maximum gradient method (MOD2) to calculate vegetation coverage [27]. The measured data were acquired by digital camera, and then processed with the Can_eye Software. The MOD1 and MOD2 methods are expressed as follows:
  • MOD1:
    F V C = N D V I N D V I soil / N D V I veg N D V I soil
    where, NDVI is the normalized difference vegetation index, NDVIsoil is the NDVI of bare soil areas, and NDVIveg is the NDVI of total vegetation pixel.
  • MOD2:
    F V C = d d max , d = T M 4 T M 3 λ T M 4 λ T M 3 T M 7 T M 4 λ T M 7 λ T M 4
    where, d is the gradient difference of pixel, dmax is the maximum gradient difference of pixel; TM3, TM4 and TM7 are the digital number of red, near infrared and short-wave infrared for Landsat data; λTM3, λTM4 and λTM7 are the wavelength of red, near infrared and short wave infrared, respectively.

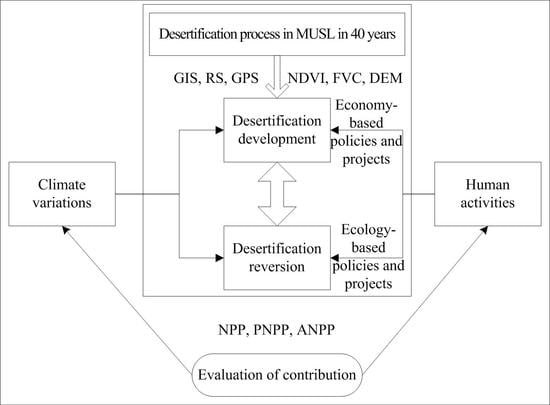
2.5. The Relative Contributions of Climate Variations and Human Activities to the Aeolian Desertification

As the vegetation dynamics measured by NPP are the most intuitive manifestation of desertification [28], the relative contributions of climate variations and human activities to aeolian desertification can be assessed by comparing the trends in PNPP and HNPP during the same periods. In this model, PNPP is calculated with temperature and precipitation data from national meteorological stations [29]. HNPP is the difference between PNPP and ANPP, and the MODIS NPP data from NASA data sharing platform is used as the ANPP. The equations are as follows:
PNPP = RDI2 × r(1 + RDI + RDI2)(1 + RDI)(1 + RDI2) × EXP(−9.87 + 6.25 × RDI2)
  R D I = 0.629 + 0.237 P E R 0.00313 P E R 2 2
P E R = P E T r = B T × 58.93 / r
B T = t / 365 = T / 12
where, PNPP is the potential NPP (t·hm−2·a−1), RDI is the radiation dryness index, r is the annual precipitation (mm), PER is the annual potential evapotranspiration rate, PET is the annual potential evapotranspiration (mm), BT is the average annual biological temperature (between 0~30 °C), T and t are average month temperature and average daily temperature, respectively (between 0~30 °C, and they are set to 30 °C or 0 °C when they are higher than 30 °C or lower than 0 °C, respectively).
Then, we established the trends of PNPP and HNPP in a period based on the rates of changes in the two variables as a function during the period:
S l p o e = [ n × i = 1 n i × N P P i ( i = 1 n i i = 1 n N P P i ) ] n × i = 1 n i 2 i = 1 n i
where i = 1, 2, …, n are the first year, second year, …, then year n, respectively (e.g., n was 15 when the period is from 2000 to 2014), and NPPi is the NPP value in year i.
The values of SPNPP and SHNPP during the study periods reveal the effects of climate change and human activities on desertification process, respectively. There are six scenarios to describe the causes of the desertification process [28,30,31] (Table 3). Combined with the aeolian desertification data, the contribution of climate variations and human activities was analyzed in stages.

3. Results

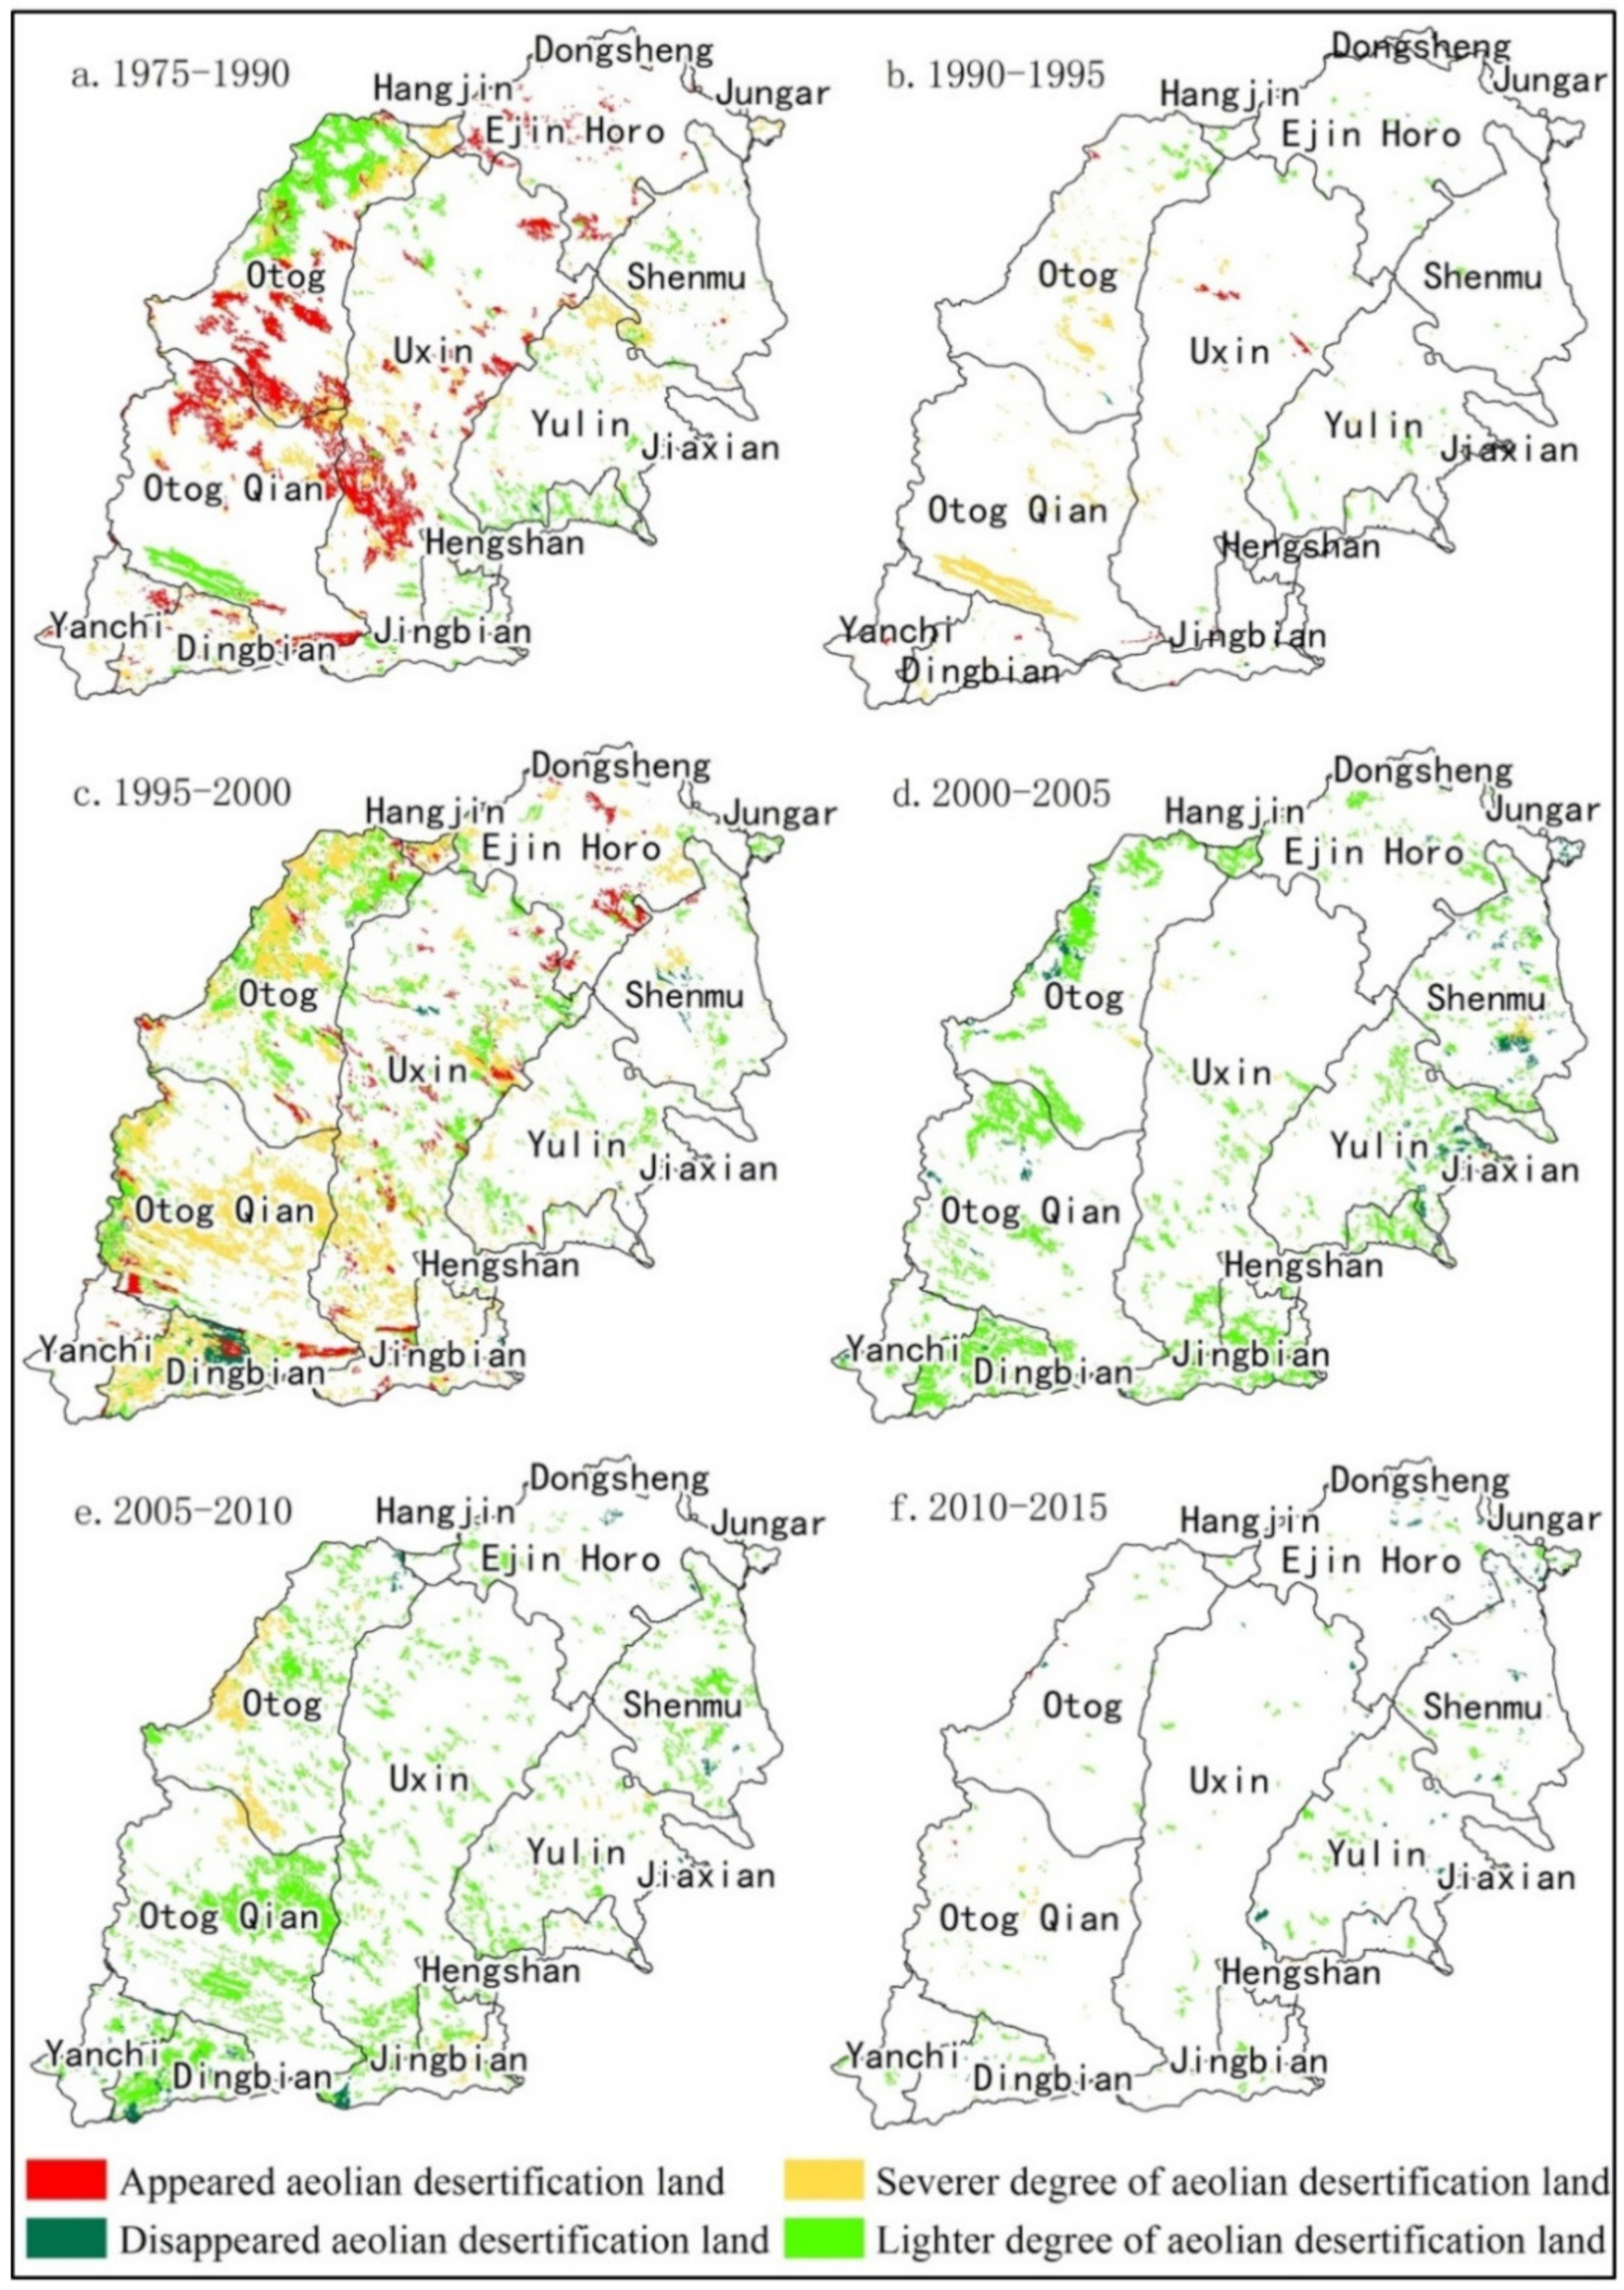
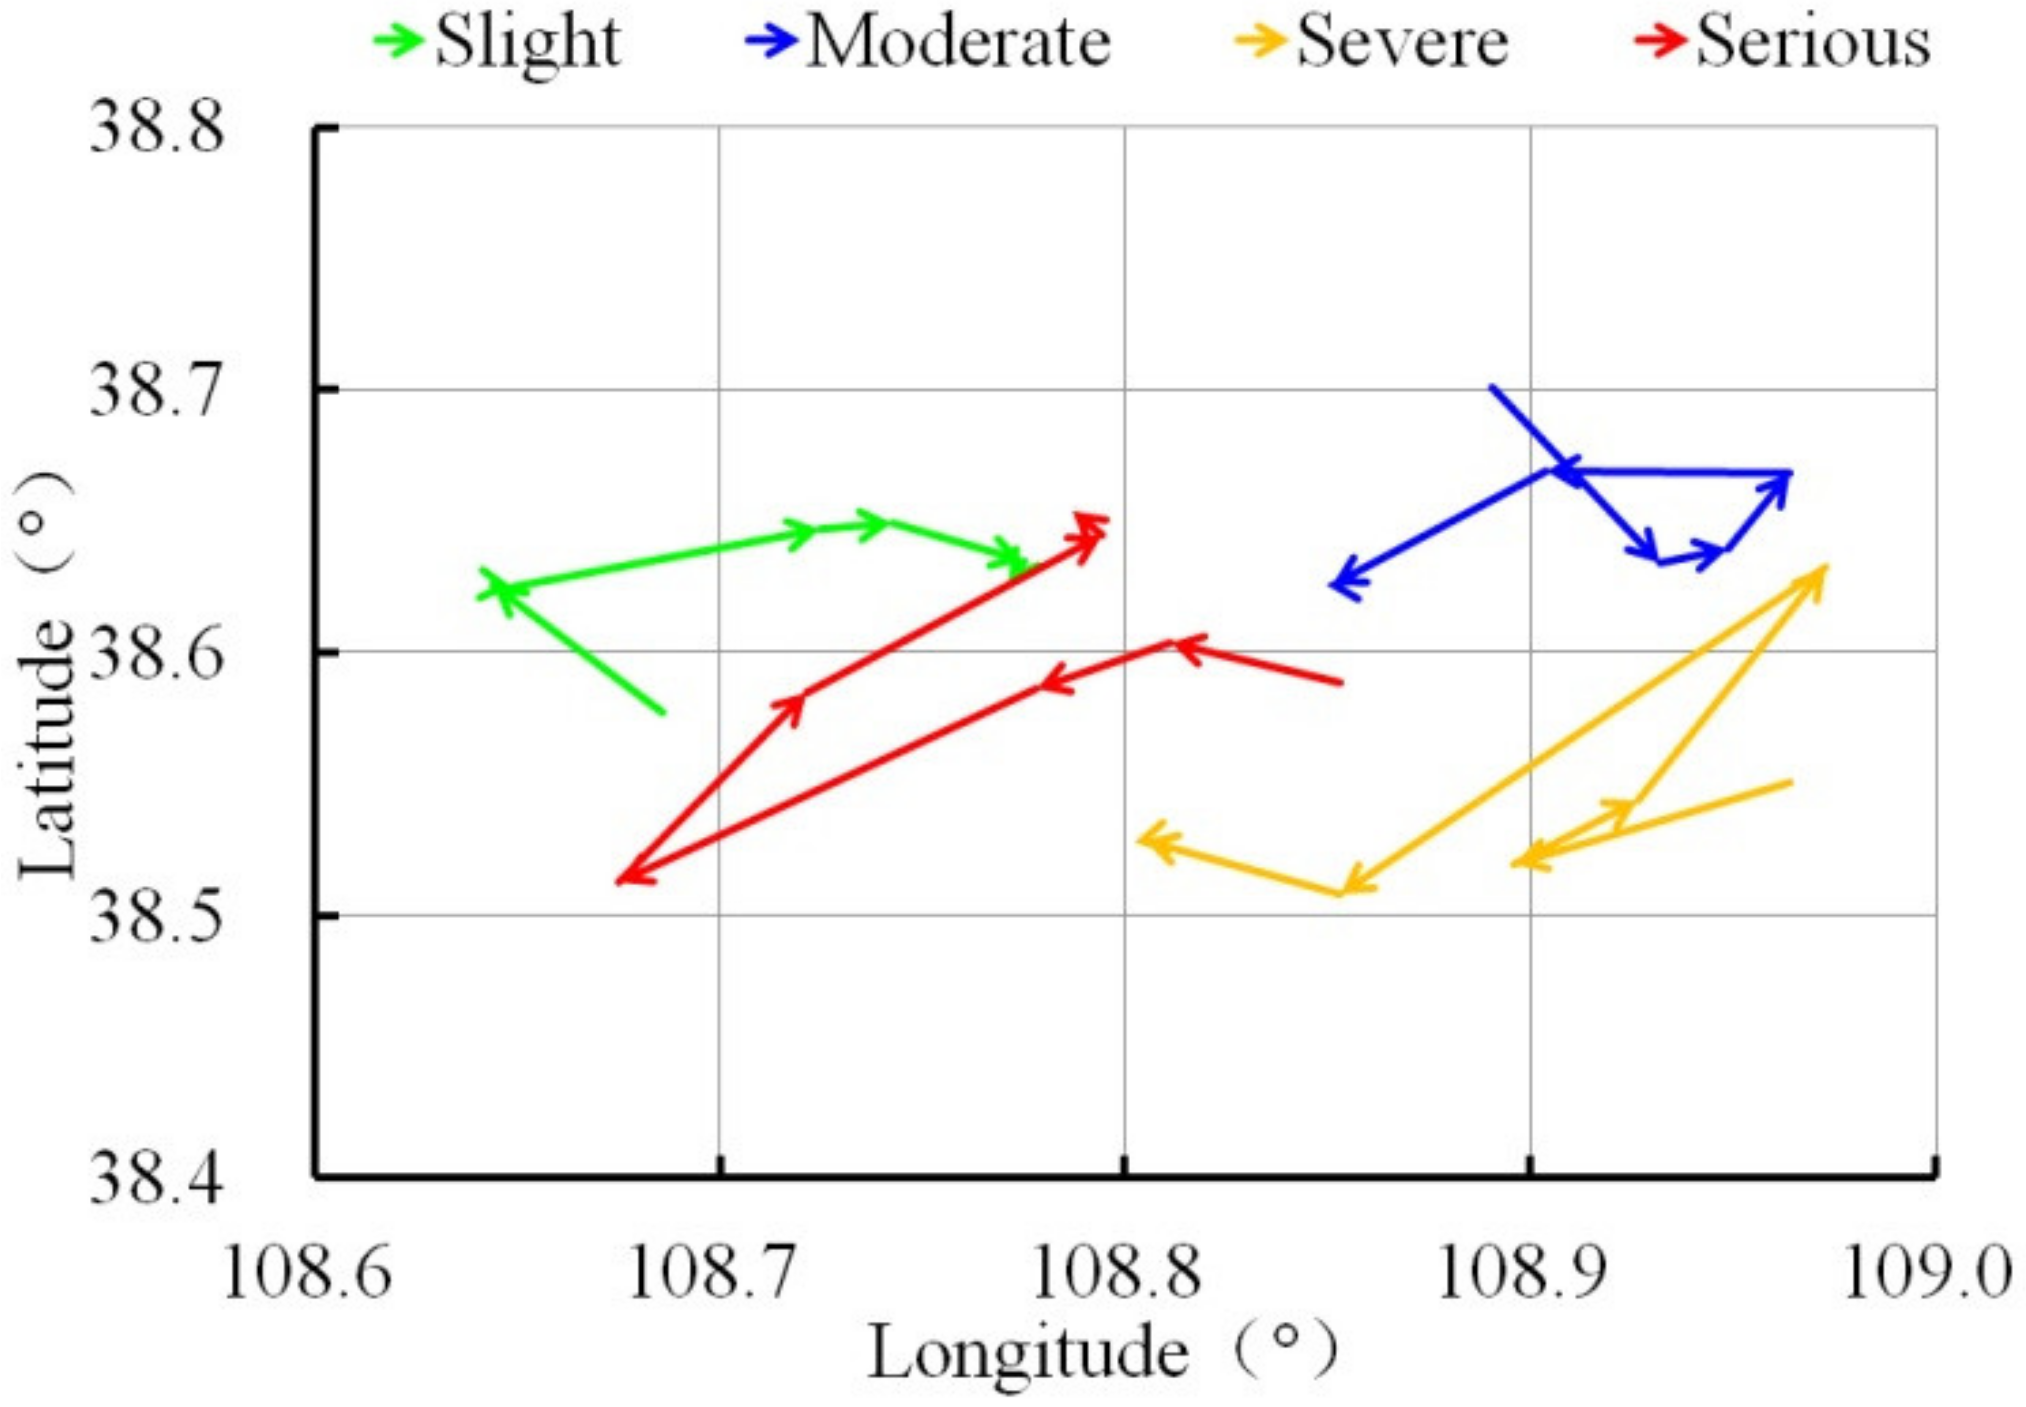
3.1. Spatial and Temporal Changes of Aeolian Desertification in MUSL from 1975 to 2015

The aeolian desertification land in MUSL firstly increased and then decreased from 1975 to 2015, and the year 2000 was the turning point (Table 4). In the first stage of 1975–1990 (Figure 3a), the added regions of aeolian desertification land were located mainly in the countries of Ejin Horo, Uxin, Otog and Otog Qian in the Midwest, which accounted for 43.09% of the total new aeolian desertification land; the main type of new aeolian desertification was light aeolian desertification land. The added area of aeolian desertification land was 2749.70 km2. In the second stage of 1990–1995 (Figure 3b), the added regions of aeolian desertification land were located mainly in the country of Uxin in the middle, and the severed degree of Aeolian desertification land was situated in the country of Otog and Otog Qian in the west. The main type of appeared aeolian desertification was serious aeolian desertification land, which accounted for 59.26% of the total appeared aeolian desertification land in this period. In the third stage of 1995–2000 (Figure 3c), the main type of newly appeared aeolian desertification was light aeolian desertification land, which accounted for 56.43% of the total newly appeared aeolian desertification land. Since 2000, serious aeolian desertification land decreased sharply, and the severe, moderate and light aeolian desertification land increased (Figure 3d–f). From 2000 to 2015, the total decreased area of aeolian desertification land was 886.77 km2, and located in every country of the study regions.
The changes in the centers of all kinds of aeolian desertification land are shown in Figure 4. In general, the moderate, severe and serious aeolian desertification lands moved west, except the slight aeolian desertification land, which moved east, reflecting that aeolian desertification was becoming more serious in the west. However, there were differences between the detailed changes in the four types aeolian desertification land. For the slight aeolian desertification lands, its center moved north-westward in the period of 1975–1990, and then moved to the east; for the moderate aeolian desertification lands, its center moved southeast in the period of 1975–1990, northeast in the period of 1990–2000, west in the period of 2000–2005, and then moved southwest in the period of 2005–2015; for the severe aeolian desertification lands, its center moved southwest in the period of 1975–1990, northeast in the period of 1990–2000, southwest in the period of 2000–2005, and then moved north-westward in the period of 2005–2015. For the serious aeolian desertification lands, its center moved west in the period of 1975–1990, southwest in the period of 1990–2000, and then moved northeast in the period of 2000–2015. From 1975 to 2010, the spatial changes of the centers of the four kinds of aeolian desertification land were obvious, but from 2010 to 2015, the centers hardly moved, which meant that the spatial pattern of aeolian desertification land in MUSL was stable. Moreover, for the moderate, severe and serious aeolian desertification lands, the moving directions of their centers changed obviously before and after year of 2000. The centers of the four kinds of aeolian desertification land in 2015 were more concentrated compared to 1975.

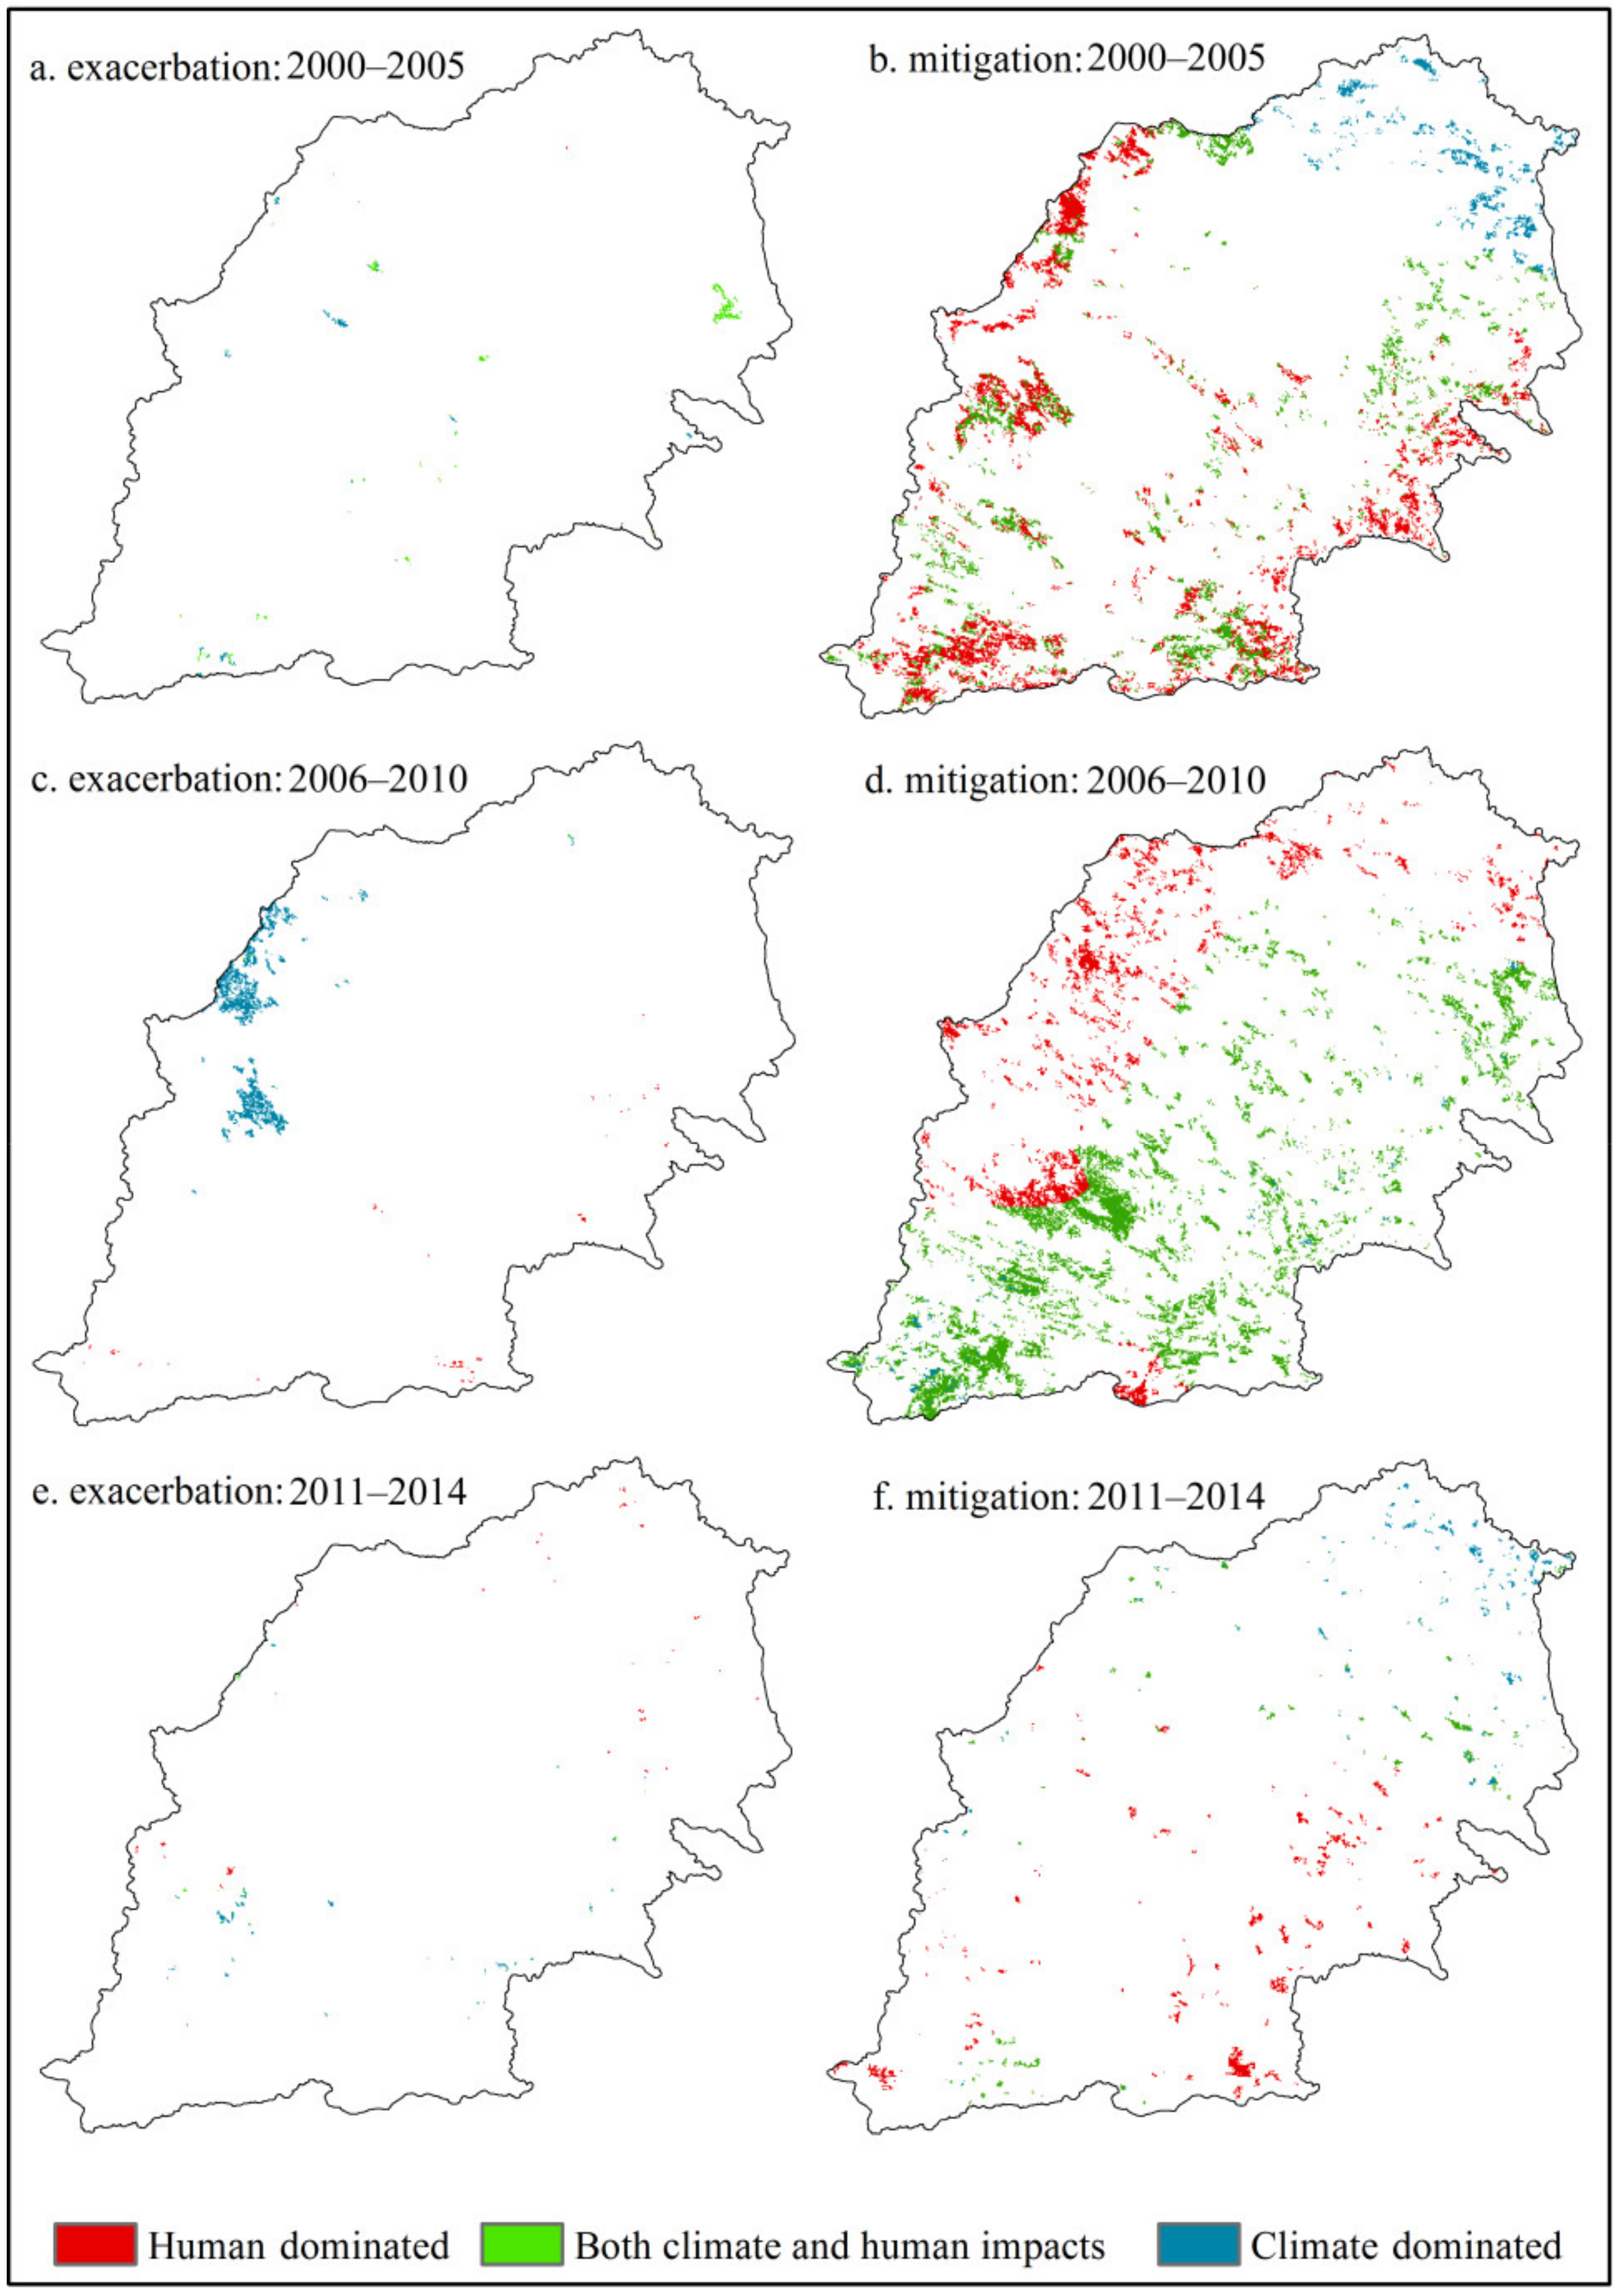
3.2. The Relative Contributions of Climate Variations and Human Activity to the Desertification Processes in MUSL after 2000

As shown in Table 4 and Figure 3, the desertification in MUSL was mainly in reverse after 2000, in which there was no appeared aeolian desertification land on one hand, and there were many disappeared and lighter degrees of aeolian desertification land on the other hand, although a severer degree of appeared aeolian desertification land was noted from 2005 to 2010. Thus, we analyzed the relative contributions of climate change and human activity to the desertification process in MUSL in three periods, including 2000–2005, 2006–2010 and 2011–2014.

3.2.1. Period from 2000 to 2005

From 2000 to 2005, the regions of desertification exacerbation distributed sporadically, and their area was small. This was affected both by climate change and human activity (Figure 5a). The area of desertification mitigation was up to 4499.39 km2, and the human dominated regions distributed in the south and west accounted for 52.59%, while the climate dominated regions distributed in north-east of the MUSL accounted for only 8.74% (Figure 5b).

3.2.2. Period from 2006 to 2010

From 2006 to 2010, the areas of desertification exacerbation were 710.34 km2, distributed in Otog and Otog Qian in the western of the MUSL, and were mainly affected by the climate (Figure 5c). The area of desertification mitigation was up to 4848.94 km2, and the human dominated regions distributed in the north-west accounted for 27.82%, while the regions affected by both humans and the climate distributed in the southeast of the MUSL accounted for 68.78% (Figure 5d).

3.2.3. Period from 2011 to 2014

From 2011 to 2014, the regions of desertification exacerbation distributed sporadically, and their area was small. It was affected by the climate, humans, or both climate and humans (Figure 5e). The area of desertification mitigation was up to 752 km2 and far less than the area in the periods of 2000–2005 and 2006–2010. The human dominated regions distributed in the south part and accounted for 52.49%, while the climate dominated regions distributed in the north part of the MUSL and accounted for 23.17% (Figure 5f).

4. Discussion

4.1. The Causes of Aeolian Desertification Development from 1975 to 2000

With the pressure of further increasing GDP, people extracted the land resources vigorously, which led to the development of desertification in the period of 1975–2000. After the Cultural Revolution (1966–1976), China desperately needed to place development on the national agenda. With the implementation of economic reform and market economy in the late 1980s, land resources were optimized. The livestock (1983) and then usable grassland (1984–1985) were distributed to households with the promotion of the Household Responsibility System (HRS) in Inner Mongolia, which resulted in the expansion of grassland and cultivated land [32]. Moreover, mining activities were expanding [21], thus, overgrazing and worsening deforestation were the result of improper grassland management and the farmers and herdsmen’s production enthusiasm at the beginning of the HRS (before 1990). This led to intense aeolian desertification development from 1975 to 1990.
Ecological protection became the second factor affecting surface processes, along with economic development. Many governmental ecological programs have been launched, starting with the TNSP, since 1979, and MUSL is the key area of TNSP. Meanwhile, a series of environmental protection policies have been issued, such as the policies and projects of migration (1982–2008), the basic national policies of environmental protection in 1986, and sustainable development in 1992 [32]. The development of desertification had been controlled in the periods of 1990~1995 and 1995~2000 to a certain extent. However, the limited precipitation of 169.8~472.1 mm per year cannot satisfy the water demands of reforestation and crop production in most areas of the MUSL. Surface water and groundwater were overused and overexploited, which led to half of the wetland dried and deteriorated into saline land [32]. In the period from 1975 to 2000, the continuous growth of the population with the rate of about 12.8 thousands per year, and the progress of the economy, were the leading factors in the development of desertification, and the continuous rise in temperature with the rate of 0.57 °C per ten years, and a general decrease in precipitation with the rate of 10.2 mm per ten years, accelerated the desertification process.

4.2. The Main Drivers of Aeolian Desertification Reversal from 2000 to 2015

With the rapid economic development of China over the last 20 years, a series of ecological and environmental policies and projects have been promulgated and implemented. For example, the NFCP and the GTGP was extensively implemented. In succession, the government promulgated a law on desert prevention and transformation in 2001 and the Grazing Forbidden Project (GFP) and carried out the construction of ecological civilization in 2012 [33]. Meanwhile, many economic policies and projects were implemented, such as the Great Western Development Strategy in 2000 and the New Rural Development Strategy in 2004 [21]. These policies and projects had a superposition effect on land use/land cover, converting large amounts of grassland, unused land and cultivated land into artificial surfaces, including construction land, green land, and roads. This led to the obvious reversal of desertification, which was mainly affected by human activities.
There was also exacerbation of desertification in a few areas with scattered distribution from 2000 to 2015, which was mainly due to agropastoralists, who started a new round of cultivation. Meanwhile, coal mining destructed the surface in the golden decade of coal from 2001 to 2010. Additionally, the cancelation of the agricultural tax (2006), and reform of the system of collective rights and land transfer (2008) promoted agricultural development and caused local desertification in the MUSL [32].
In general, policies and large-scale conservation programs have played a vital role in the reversal of aeolian desertification from 2000 to 2015. However, follow-up to policies and projects, the carrying capacity of the regional natural resources (e.g., water resources), as well as people’s livelihoods, are still huge challenges for ecological protection in MUSL.

4.3. The Uncertainty Analyses

We chose NPP as an indicator to access the relative impacts of climate change and human activities on the desertification process by analyzing the relationship between the NPP changes and desertification process caused by climate change and human activities. At the same time, the change in NPP was continuously represented in different temporal and spatial scales with the means of model, combined with remote sensing data, which allowed us to overcome the limitations in the research on the driving force of desertification in administrative units [34]. However, there were still some uncertainties in this method. On the one hand, the uncertainties were caused by the uniform resampling of the different types of data with different resolutions. The fragmentation of habitat is high in the MUSL, and some information with low different resolution can be masked over. On the other hand, the uncertainties were caused by the station’s representativeness. The PNPP was estimated with data from a nearby meteorological station. However, there are few meteorological stations with uneven distribution, and most of them are located in urban areas, where climatic conditions in desert areas with less human activity have been questioned.

5. Conclusions

The dynamic changes in aeolian desertification in MUSL firstly presented a developing trend from 1975 to 2000, with the severe and serious aeolian desertification land continually increasing, but then changed to a reversal trend from 2000 to 2015, as serious aeolian desertification land decreased; although the severe, moderate and light aeolian desertification land lightly increased. With the reversal of desertification since 2000, human and climate dominated areas accounted for 52.59% and 8.74% in the period of 2000–2005, 27.81%, 3.4% in the period of 2006–2010, and 52.49% and 23.17% in the period of 2011–2014, respectively, and the other area of desertification reversal was affected by both human activity and climate change together. Human activity is the dominant factor of desertification dynamics in MUSL.

Author Contributions

Conceptualization, J.X. and Z.L.; methodology, J.X.; formal analysis, J.X. and Z.L.; investigation, J.X.; resources, J.X. and K.F.; data curation, J.X.; writing—original draft preparation, J.X. and Z.L.; writing—review and editing, J.X. and Z.L.; visualization, J.X.; supervision, J.X. and Z.L.; project administration, J.X. and Z.L.; funding acquisition, J.X. and Z.L. All authors have read and agreed to the published version of the manuscript.

Funding

This research was funded by National Key Research and Development Program, grant number 2016YFC0500201, Major science and technology projects of Gansu Province, grant number 21ZD4FA008, and the Natural Science Foundation of China, grant number 41601036.

Institutional Review Board Statement

Not applicable.

Informed Consent Statement

Not applicable.

Data Availability Statement

The source of relevant data acquisition has been described in the text.

Conflicts of Interest

The authors declare no conflict of interest.

References

  1. Martínez-Graña, A.M.; Goy, J.L.; Zazo, C. Cartographic Procedure for the Analysis of Aeolian Erosion Hazard in Natural Parks (Central System, Spain). Land Degrad. Dev. 2015, 26, 110–117. [Google Scholar] [CrossRef]
  2. Duro, A.; Piccione, V.; Ragusa, M.A.; Veneziano, V. New enviromentally sensitive patch index—ESPI—for MEDALUS protocol. AIP Conf. Proc. 2014, 1637, 305–312. [Google Scholar]
  3. Xue, Z.; Qin, Z.; Cheng, F.; Ding, G.; Li, H. Long-term dynamic characterization of aeolian desertification in northwest Shanxi, China. Environ. Sci. Pollut. Res. 2017, 20, 17166–17174. [Google Scholar] [CrossRef] [PubMed]
  4. Wang, X.; Hua, T.; Lang, L.; Ma, W. Spatial differences of aeolian desertification responses to climate in arid Asia. Glob. Planet. Chang. 2017, 148, 22–28. [Google Scholar] [CrossRef] [Green Version]
  5. Zhang, Z.; Huisingh, D. Combating desertification in China: Monitoring, control, management and revegetation. J. Clean. Prod. 2018, 182, 765–775. [Google Scholar] [CrossRef]
  6. Peters, D.P.C.; Havstad, K.M. Nonlinear dynamics in arid and semi-arid systems: Interactions among drivers and processes across scales. J. Arid Environ. 2006, 65, 196–206. [Google Scholar] [CrossRef]
  7. Xu, D.; Song, A.; Tong, H.; Ren, H.; Hu, Y.; Shao, Q. A spatial system dynamic model for regional desertification simulation—A case study of Ordos, China. Environ. Model. Softw. 2016, 83, 179–192. [Google Scholar] [CrossRef]
  8. Wang, T. Aeolian desertification and its control in Northern China. Int. Soil Water Conserv. Res. 2014, 2, 34–41. [Google Scholar]
  9. Zhang, Y.; Wang, L.; Zhang, H.; Li, X. An analysis on land use changes and their driving factors in Shule River: An example from Anxi County. Prog. Geogr. 2003, 22, 270–278. [Google Scholar]
  10. Zhang, D. Quantitative analysis of influential factors on land desertification in Qinghai Gonghe Basin. J. Desert Res. 2000, 20, 59–62. [Google Scholar]
  11. Wang, X.; Chen, F.; Dong, Z. The relative role of climatic and human factors in desertification in semiarid China. Glob. Environ. Chang. 2006, 16, 48–57. [Google Scholar] [CrossRef]
  12. Xu, D.; Li, C.; Song, X.; Ren, H. The dynamics of desertification in the farming-pastoral region of North China over the past 10 years and their relationship to climate change and human activity. Catena 2014, 123, 11–22. [Google Scholar] [CrossRef]
  13. Paudel, K.P.; Andersen, P. Assessing rangeland degradation using multi temporal satellite images and grazing pressure surface model in Upper Mustang, Trans Himalaya, Nepal. Remote Sens. Environ. 2010, 114, 1845–1855. [Google Scholar] [CrossRef]
  14. Sun, Y.; Yang, Y.; Zhang, L.; Wang, Z. The relative roles of climate variations and human activities in vegetation change in North China. Phys. Chem. Earth Parts A/B/C 2015, 87-88, 67–78. [Google Scholar] [CrossRef]
  15. Haberl, H. Human appropriation of net primary production as an environmental indicator: Implications for sustainable development. Ambio 1997, 26, 143–146. [Google Scholar]
  16. Taelman, S.E.; Schaubroeck, T.; De Meester, S.; Boone, L.; Dewulf, J. Accounting for land use in life cycle assessment: The value of NPP as a proxy indicator to assess land use impacts on ecosystems. Sci. Total Environ. 2016, 550, 143–156. [Google Scholar] [CrossRef] [PubMed]
  17. Weber, D.; Schaepman-Strub, G.; Ecker, K. Predicting habitat quality of protected dry grasslands using Landsat NDVI phenology. Ecol. Indic. 2018, 91, 447–460. [Google Scholar] [CrossRef]
  18. Wang, T.; Yan, C.; Song, X.; Xie, J. Monitoring recent trends in the area of aeolian desertified land using Landsat images in China’s Xinjiang region. ISPRS J. Photogramm. Remote Sens. 2012, 68, 184–190. [Google Scholar] [CrossRef]
  19. Zhai, X.; Huang, D.; Tang, S.; Li, S.; Guo, J.; Yang, Y.; Liu, H.; Li, J.; Wang, K. The emergy of metabolism in different ecosystems under the same environmental conditions in the agro-pastoral ecotone of northern China. Ecol. Indic. 2017, 74, 198–204. [Google Scholar] [CrossRef] [Green Version]
  20. Feng, K.; Yan, C.; Xie, J.; Qian, D. Spatial-temporal Evolution of Aeolian Desertificattion Process in Ordos City during 1975–2015. J. Desert Res. 2018, 38, 233–242. [Google Scholar]
  21. Li, N.; Yan, C.; Xie, J. Remote sensing monitoring recent rapid increase of coal mining activity of an important energy base in northern China, a case study of Mu Us Sandy Land. Resour. Conserv. Recycl. 2015, 94, 129–135. [Google Scholar] [CrossRef]
  22. Yan, C.; Wang, T.; Han, Z. Using MODIS data to assess land desertification in Ordos Plateau—Mu Us Sandy Land case study. In Proceedings of the 2005 IEEE International Geoscience and Remote Sensing Symposium, IGARSS ’05, Seoul, Korea, 29 July 2005; IEEE: New York, NY, USA, 2005; pp. 2373–2375. [Google Scholar]
  23. Yan, C.; Wang, T.; Song, X.; Xie, J. Temporal and spatial changes in the pattern of sandy desert and sandy land in northern China from 1975 to 2010 based on an analysis of Landsat images. Int. J. Remote Sens. 2017, 38, 3551–3563. [Google Scholar] [CrossRef]
  24. Annual Data Set of Surface Climate Standard Values in China (1981–2010). Available online: http://data.cma.cn/data/cdcdetail/dataCode/SURF_CLI_CHN_MUL_MYER_19812010.html (accessed on 11 January 2022).
  25. MOD17A3—MODIS/Terra Net Primary Production Yearly L4 Global 1km SIN Grid. Available online: https://ladsweb.modaps.eosdis.nasa.gov/missions-and-measurements/products/MOD17A3 (accessed on 11 January 2022).
  26. Li, M. The Method of Vegetation Fraction Estimation by Remote Sensing. Master’s Thesis, Chinese Academy of Sciences, Beijing, China, 2003. [Google Scholar]
  27. Tang, S.; Zhu, Q.; Zhou, Y.; Bai, X. A simple method to estimate crown cover fraction and rebuild the background information. J. Image Graph. 2003, 8, 1034–1039. [Google Scholar]
  28. Zhou, W.; Gang, C.; Zhou, F.; Li, J.; Dong, X.; Zhao, C. Quantitative assessment of the individual contribution of climate and human factors to desertification in northwest China using net primary productivity as an indicator. Ecol. Indic. 2015, 48, 560–569. [Google Scholar] [CrossRef]
  29. Jiang, C.; Wang, F.; Mu, X.; Li, R. Effect of climate change on net primary productivity (NPP) of natural vegetation in Wei river basin (Ⅱ). NPP of natural vegetation in Wei river basin. J. Arid Land Resour. Environ. 2013, 27, 53–57. [Google Scholar]
  30. Xu, D.; Kang, X.; Zhuang, D.; Pan, J. Multi-scale quantitative assessment of the relative roles of climate change and human activities in desertification—A case study of the Ordos Plateau, China. J. Arid Environ. 2010, 74, 498–507. [Google Scholar] [CrossRef]
  31. Li, Q.; Zhang, C.; Shen, Y.; Jia, W.; Li, J. Quantitative assessment of the relative roles of climate change and human activities in desertification processes on the Qinghai-Tibet Plateau based on net primary productivity. Catena 2016, 147, 789–796. [Google Scholar] [CrossRef]
  32. Li, S.; Wang, T.; Yan, C. Assessing the Role of Policies on Land-Use/Cover Change from 1965 to 2015 in the Mu Us Sandy Land, Northern China. Sustainability 2017, 9, 1164. [Google Scholar] [CrossRef] [Green Version]
  33. Liu, J.; Li, S.; Ouyang, Z.; Tam, C.; Chen, X. Ecological and socioeconomic effects of China’s policies for ecosystem services. Proc. Natl. Acad. Sci. USA 2008, 105, 9477–9482. [Google Scholar] [CrossRef] [Green Version]
  34. Xu, D.; Kang, X.; Liu, Z.; Zhuang, D.; Pan, J. Assessing the relative role of climate change and human activities in sandy desertification of Ordos region, China. Sci. China Ser. D Earth Sci. 2009, 39, 516–528. [Google Scholar] [CrossRef]
Figure 1. Location of the study area.
Sustainability 14 01669 g001
Figure 2. Comparisons between the measured and estimated vegetation coverage (a) the image of vegetation by digital camera in field investigation; (b) the image of vegetation processed with the Can_eye Software; (c) the comparisons between the measured data and the estimated results using the MOD1 and MOD2 methods).
Sustainability 14 01669 g002
Figure 3. Spatial and temporal changes in aeolian desertification in MUSL (a) 1975–1990 (b) 1990–1995 (c) 1995–2000 (d) 2000–2005 (e) 2005–2010 (f) 2010–2015.
Sustainability 14 01669 g003
Figure 4. The changes in the centers of four types of aeolian desertification land in MUSL from 1975 to 2015.
Sustainability 14 01669 g004
Figure 5. Spatial distribution of the relative roles of climate, human activities, and the combination of these two factors on the exacerbation and the mitigation of desertification, (a) exacerbation: 2000–2005 (b) mitigation: 2000–2005 (c) exacerbation: 2006–2010 (d) mitigation: 2006–2010 (e) exacerbation: 2011–2014 (f) mitigation: 2011–2014.
Sustainability 14 01669 g005
Table 1. Classification system of aeolian desertification.
Degree of Aeolian DesertificationLandscape Characteristics
SlightFixed dunes (sandy land), area of semi-exposed gravel;
vegetation coverage: 60~70%
ModerateSemi-fixed dunes (sandy land), area of bare gravel;
vegetation coverage: 30~60%
SevereShifting dunes (sandy land); vegetation coverage: 10~30%
SeriousShifting dunes (sandy land); vegetation coverage: <10%
Table 2. Classification system of aeolian desertification dynamic.
Desertification DirectionDynamic CategoriesMeaning
Desertification developmentAppeared aeolian desertification landNon-desertification land was transformed into desertification land.
Severed degree of aeolian desertification landThe degree of desertification became severer.
Desertification reversalDisappeared aeolian desertification landDesertification land was transformed into non-desertification land.
Lighter degree of aeolian desertification landThe degree of desertification became lighter.
Table 3. The possible scenarios of desertification mitigation and exacerbation.
Desertification ProcessSPNPPSHNPPCauses
Desertification mitigation
(SANPP > 0)
<0<0human activities
>0>0climate change
>0<0human activities and climate change
Desertification exacerbation
(SANPP < 0)
<0<0climate change
>0>0human activities
<0>0human activities and climate change
Table 4. Variation of aeolian desertification area in MUSL from 1975 to 2015 (km2).
Categories1975199019952000200520102015
Light10,293.5411,353.9611,265.4310,495.3310,855.1211,221.9411,319.19
Moderate9039.159107.839023.579133.099456.439948.389987.23
Severe6368.487073.697164.467715.039624.8611,252.3111,276.41
Serious12,035.2812,932.2613,075.8313,937.3210,885.708115.207811.17
Total37,736.4440,467.7340,529.2941,280.7740,822.1240,537.8240,394.00
Publisher’s Note: MDPI stays neutral with regard to jurisdictional claims in published maps and institutional affiliations.

