Technological Convergence Assessment of the Smart Factory Using Patent Data and Network Analysis


Abstract
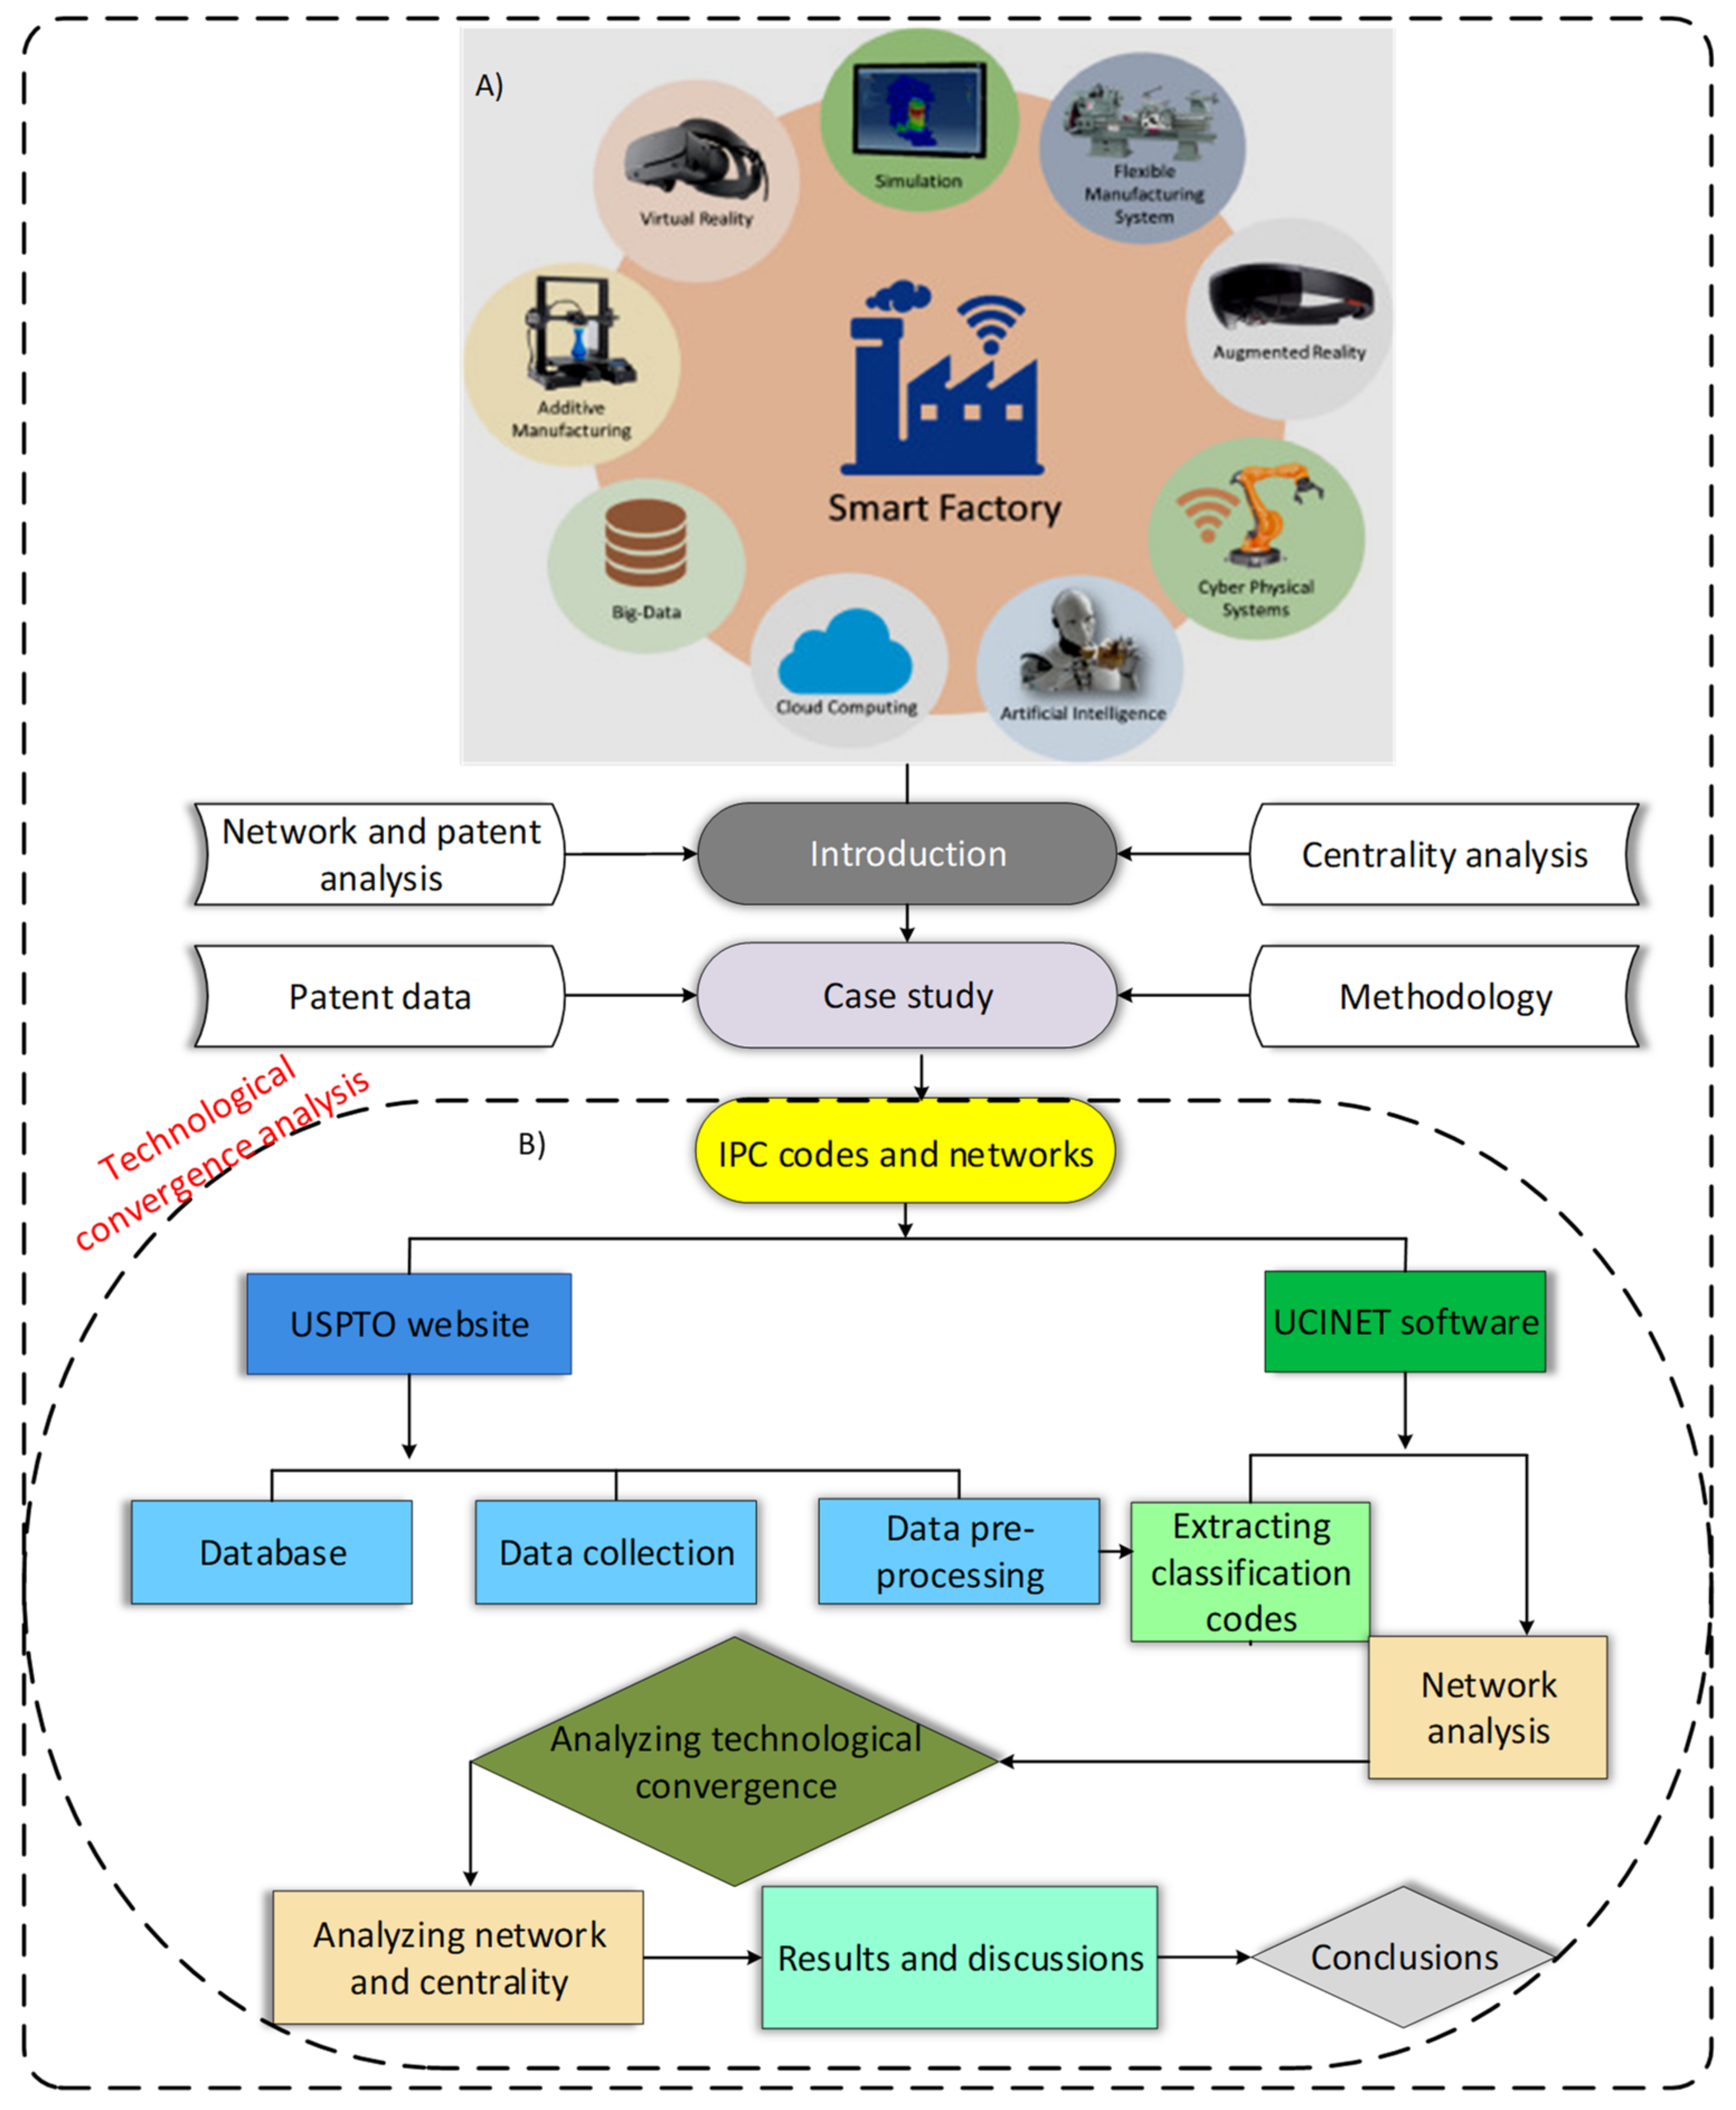
:1. Introduction
2. Literature Review
2.1. Smart Factory
2.2. Network and Patent Analysis
2.3. Centrality Analysis
3. Data and Methodology
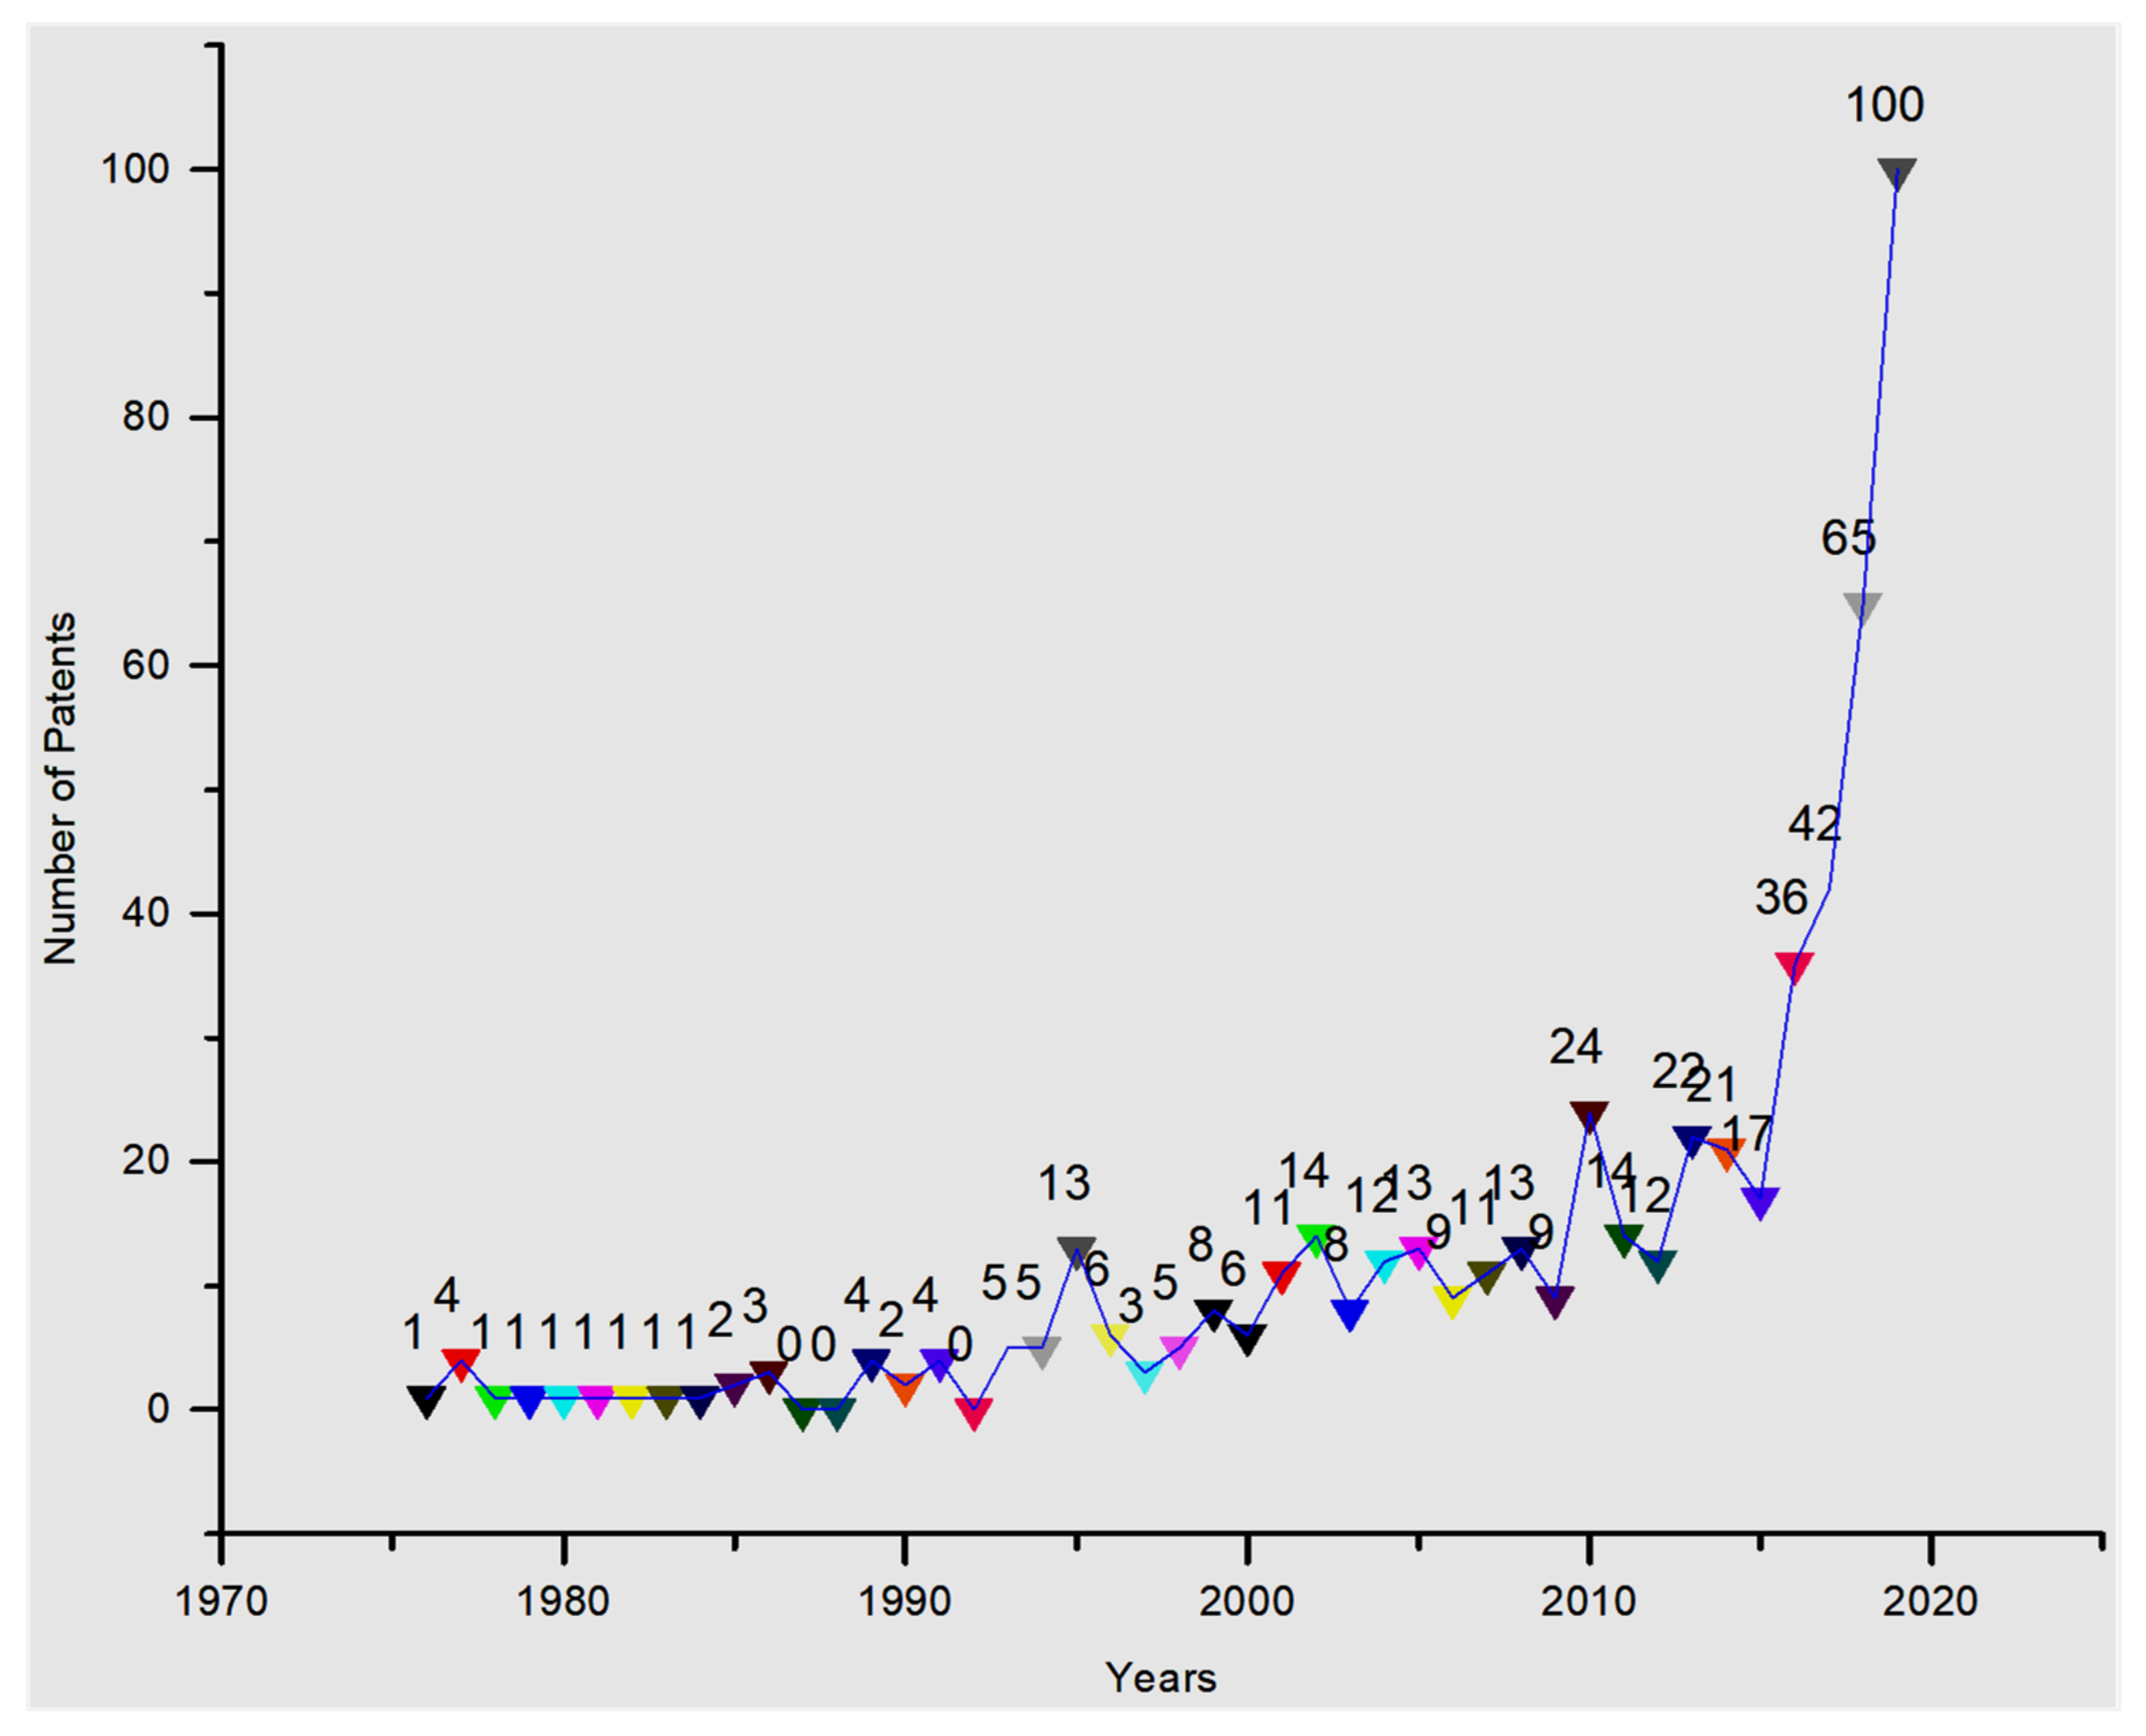
3.1. Data
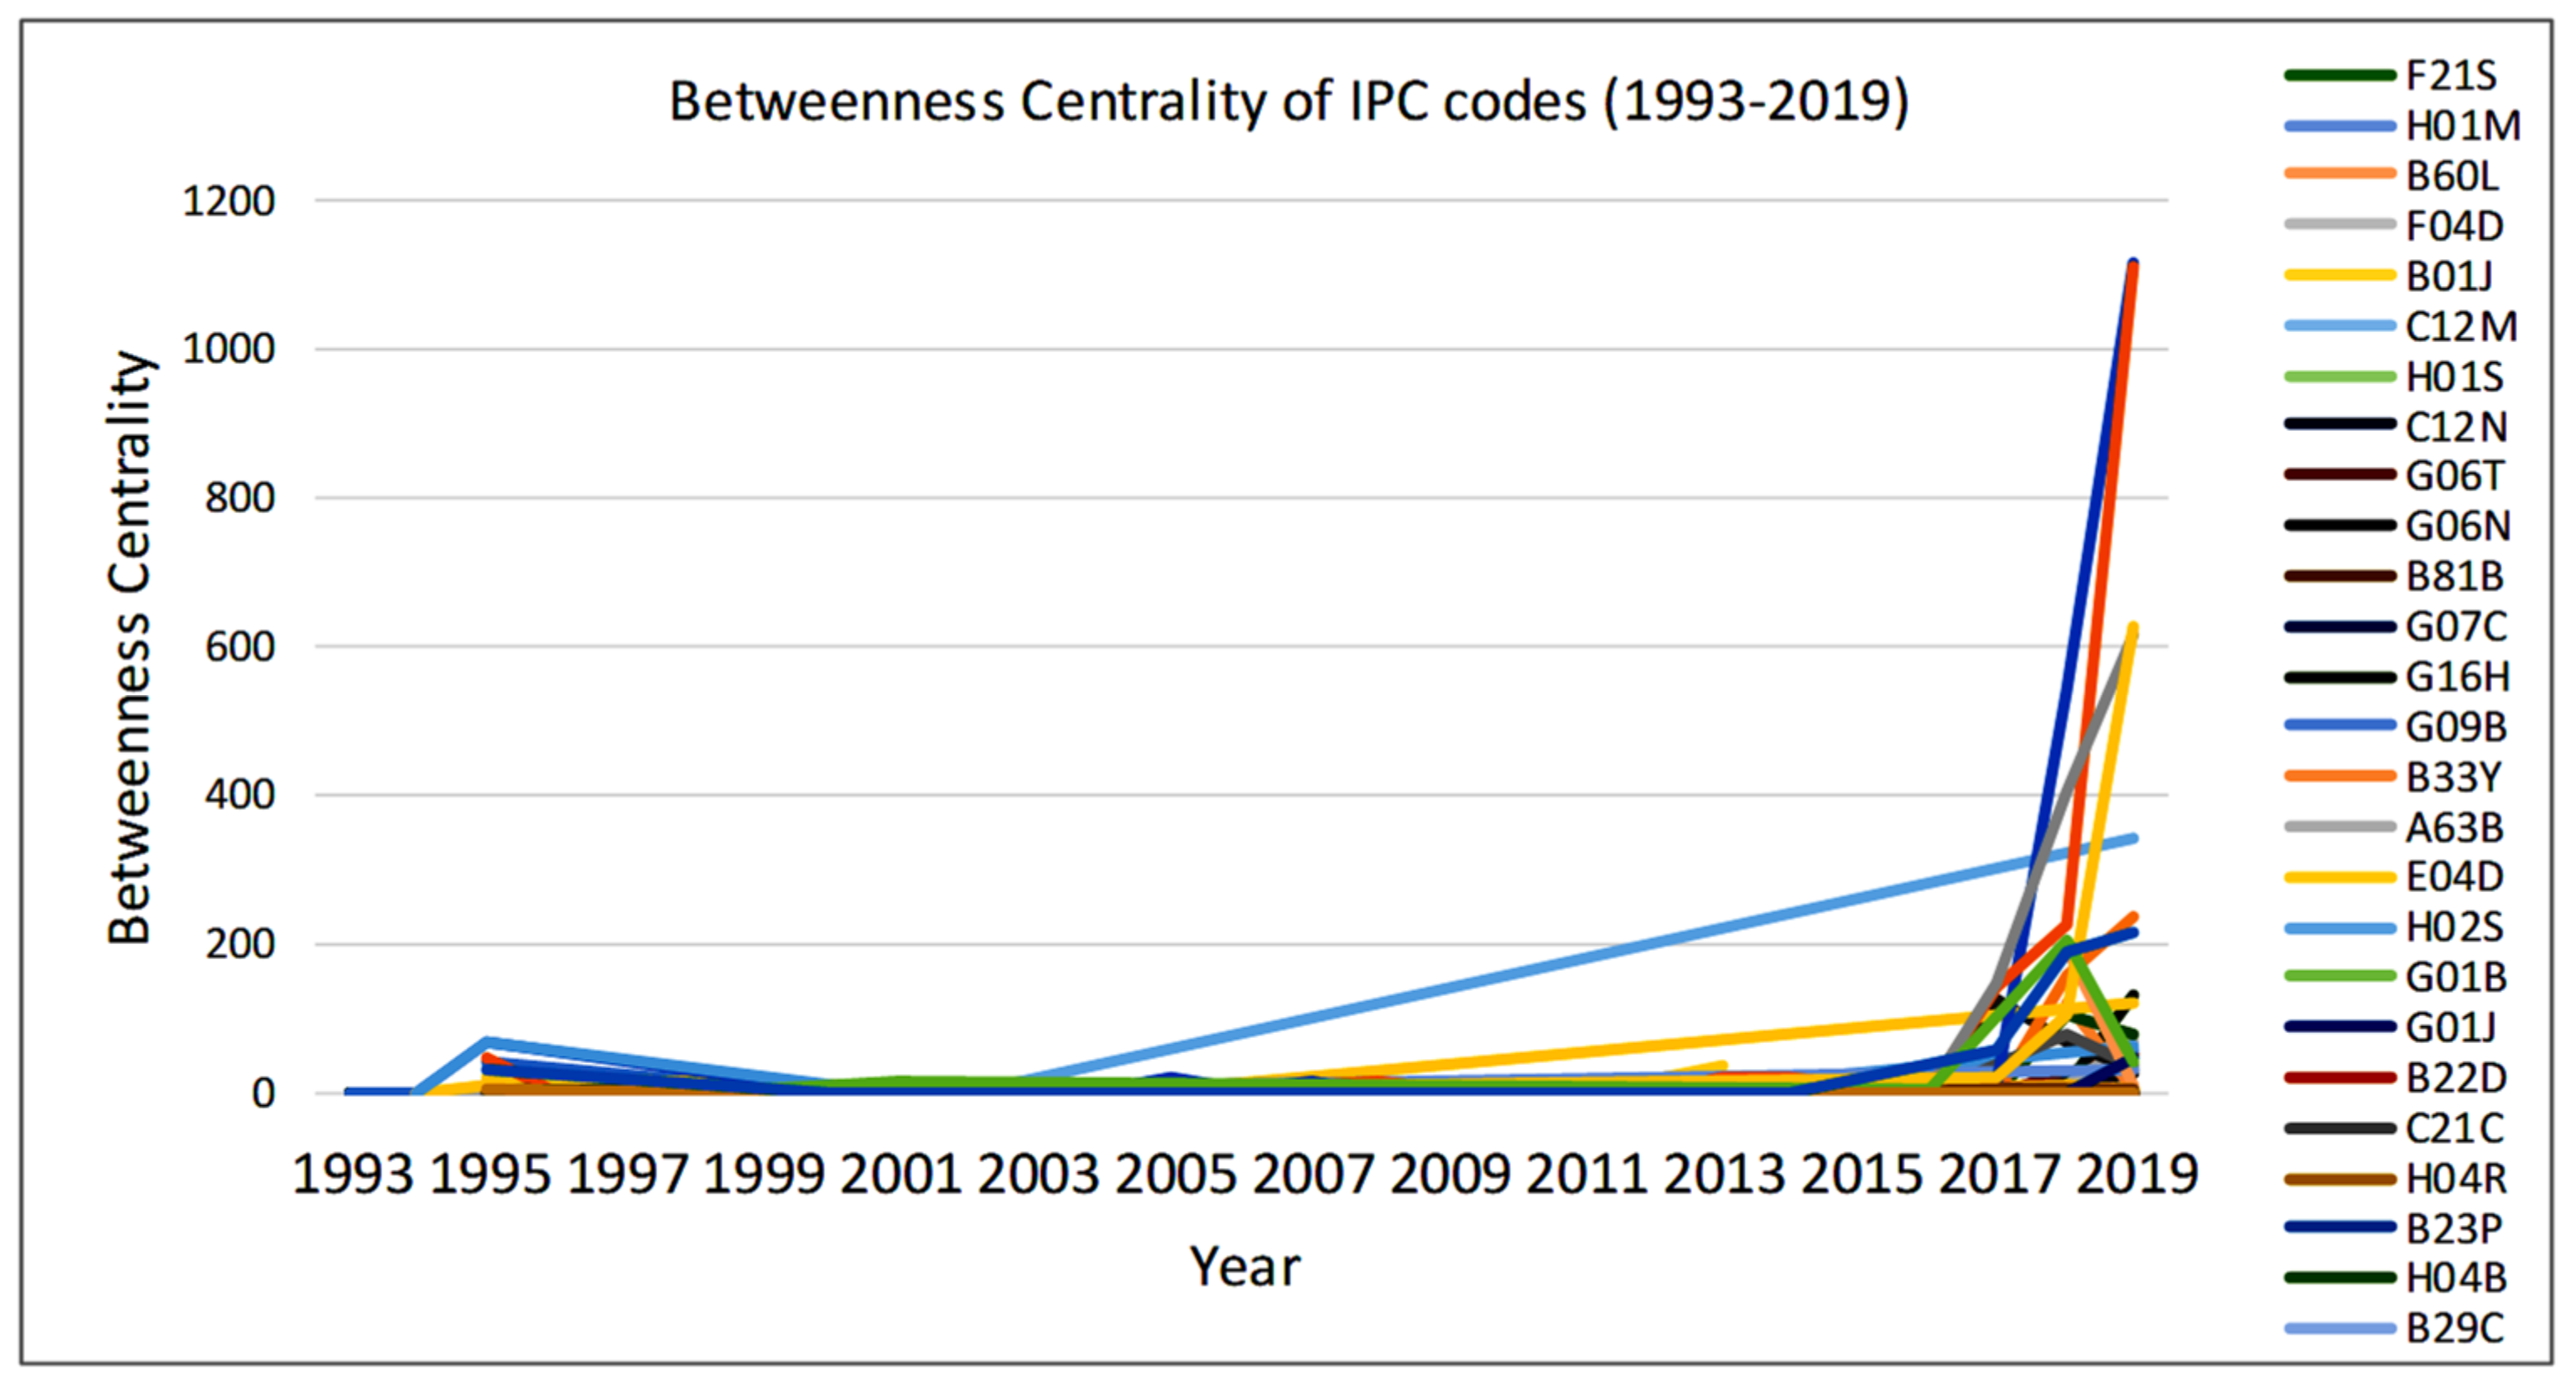
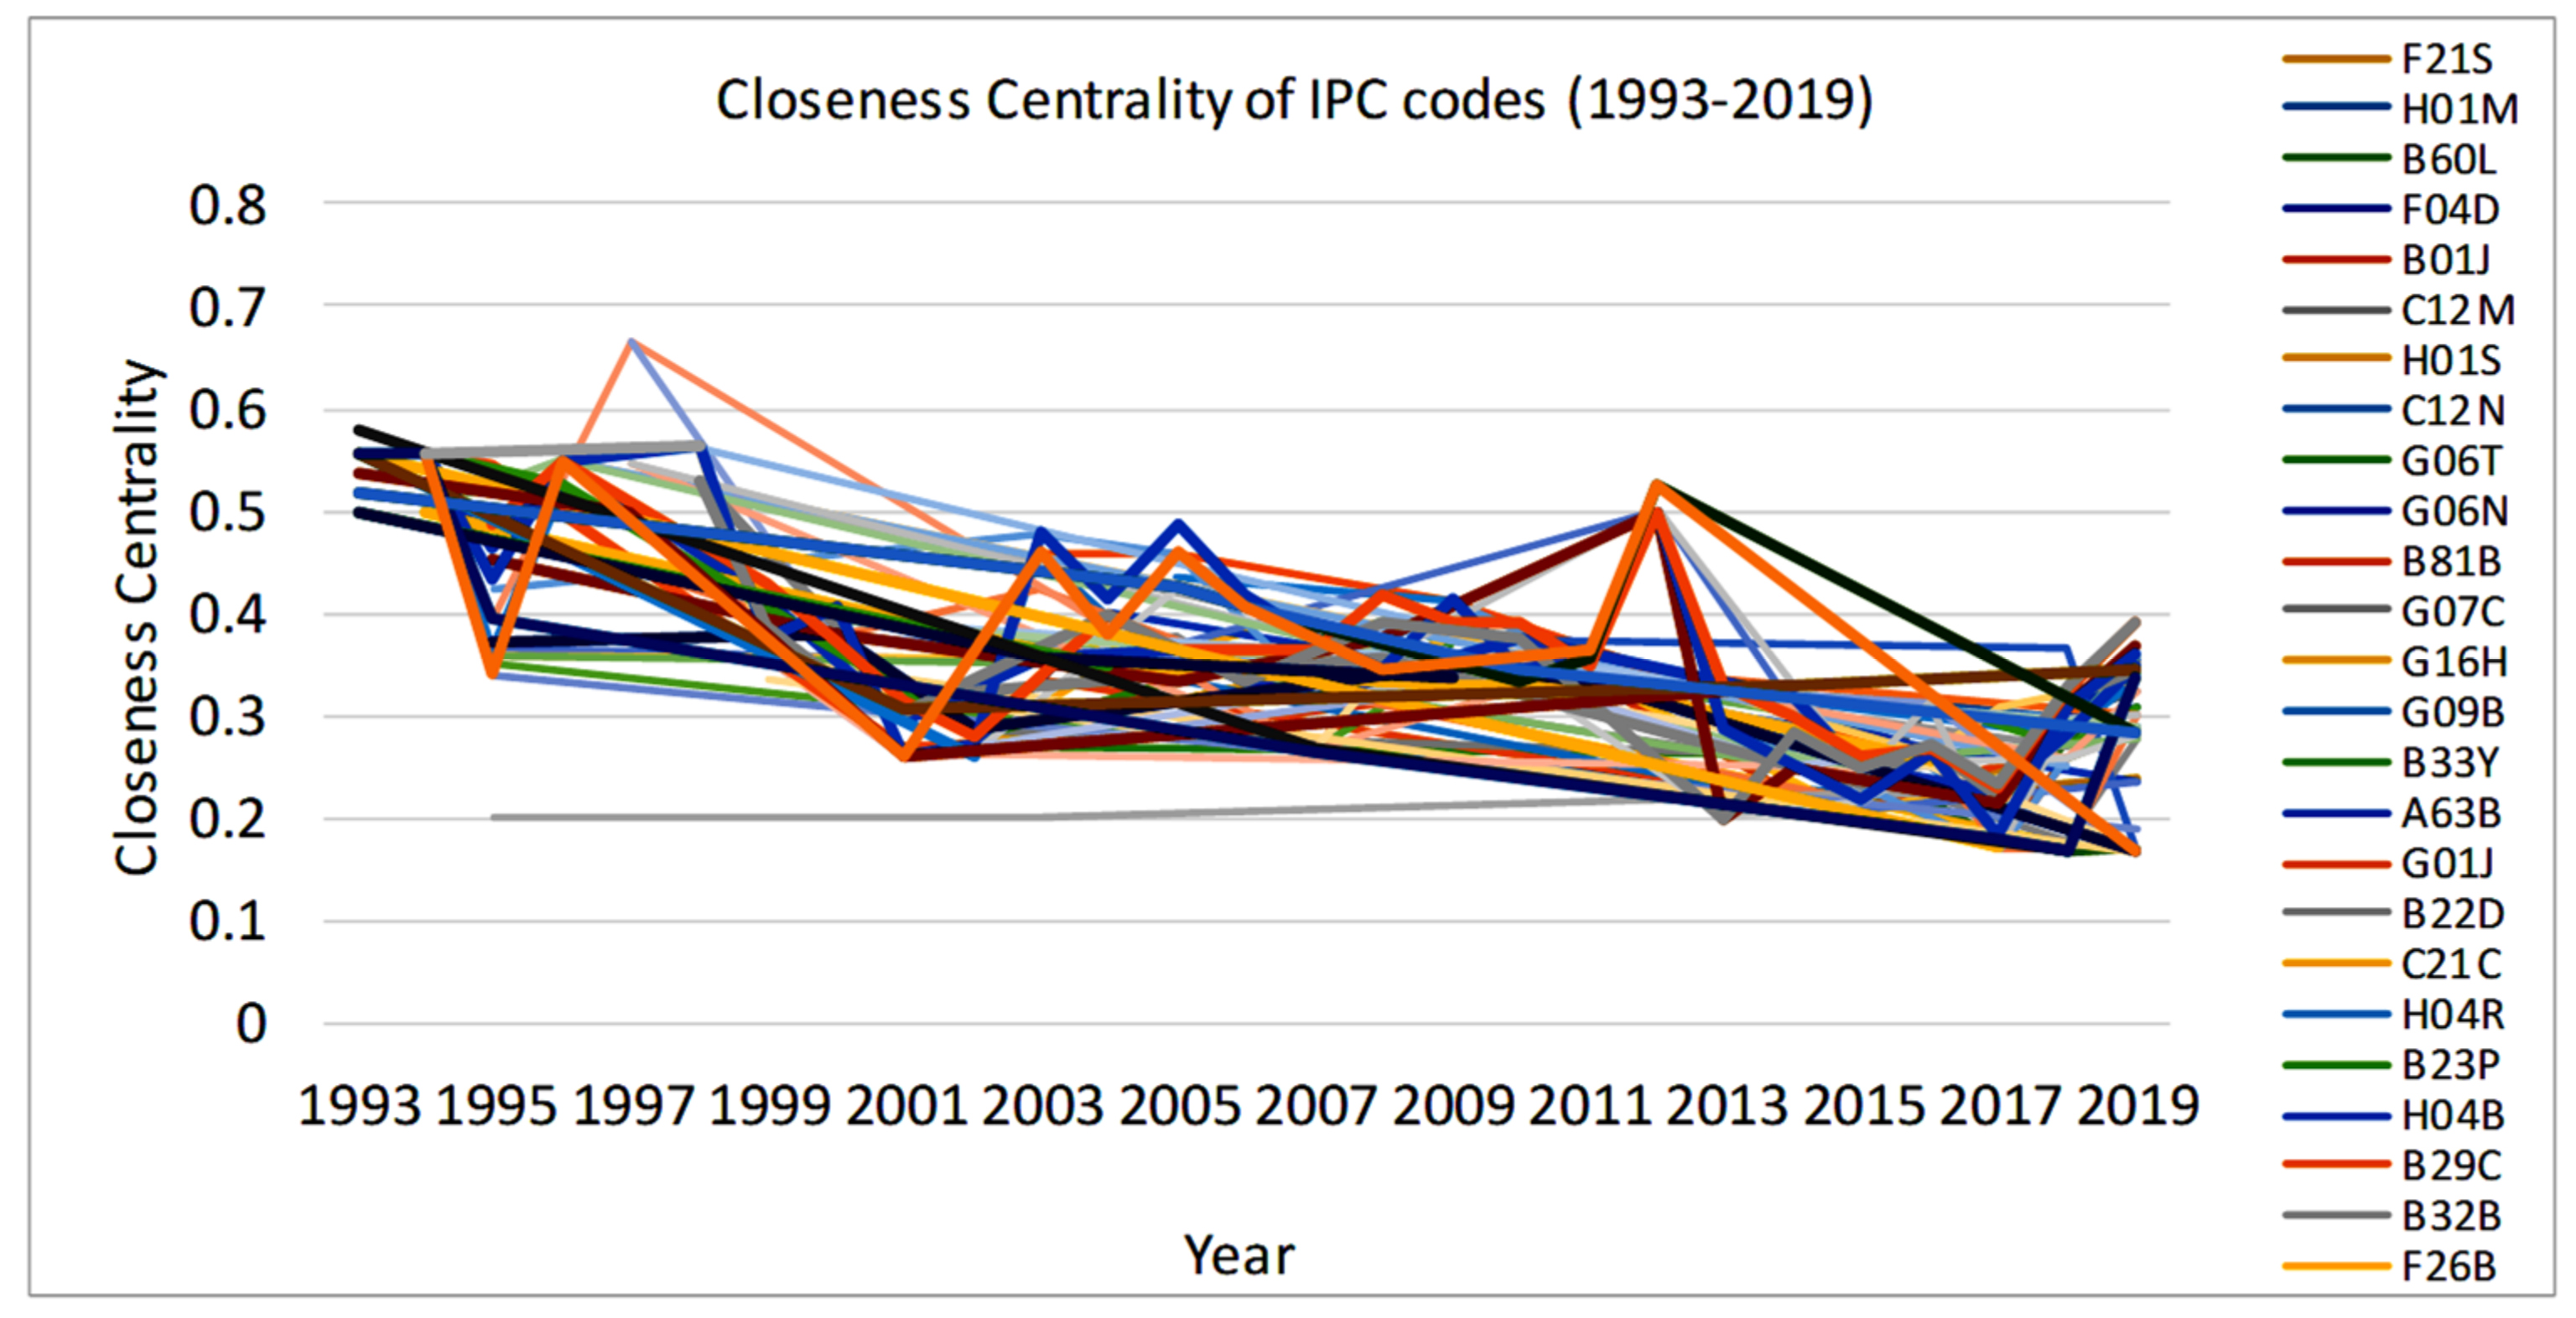
3.2. Methodology
4. Results and Discussion
4.1. Results
4.2. Discussion
5. Concluding Remarks and Recommendations for Future Work
- Results show that data-oriented technologies have gained a significant uprise over the last decade and they are going to play a vital role in the smart factory. The top related IPC network codes include G06f, H01L, and H04L.
- According to the World Intellectual Property Organization (WIPO), these IPC codes reflect digital data transformation and communication technologies. The technological convergence and connections between diverse technologies are investigated via these networks. The findings from WIPO patent data depict the major technologies in the smart factory’s IPC code networks. Then, a centrality analysis of these networks demonstrates how some specific technologies have gained significance.
- The obtained results illustrate that major technologies in these networks are associated with digital data transmission, communication technologies, electrical digital data processing, and data recognition. Moreover, the authors witnessed the technological convergence and dominance of data-oriented technologies over the last couple of years.
- The technological convergence evolution of the smart factory over the past couple of decades.
- This work can provide a reference to assess the technological convergence of the smart factory field using patent data.
- This study offers assistance to industries in investing and flourishing in a predictable manner, rather than in an unpredictable manner.
- The results of this research offer help to policymakers and other relevant authorities in making decisions for future policy development.
- The smart factory technological assessment study can assist industry managers in identifying new technology investment possibilities, avoiding risks, and forecasting future technological trends in the transformation of industries.
- It will also assist government officials in developing policies based on future requirements. It can also be beneficial to science and technology research and development policies.
- Firstly, the data employed in this study is restricted. In this study, only patent data from a small number of patents are evaluated. However, researchers will be able to use a large quantity of data from different sources in the future. Collecting more accurate and larger amounts of data can help to guarantee the legitimacy and breadth of the research.
- Secondly, IPC codes are occasionally altered or modified to meet other demands. In addition, other patent information, such as citation and patent number, can be utilized to evaluate the data, instead of only IPC codes.
- Future studies can also look at the new potential of the smart factory technological assessment using different techniques other than network analysis and patent analysis.
Author Contributions
Funding
Informed Consent Statement
Data Availability Statement
Conflicts of Interest
References
- Nascimento, D.L.M.; Alencastro, V.; Quelhas, O.L.G.; Caiado, R.G.G.; Garza-Reyes, J.A.; Lona, L.R.; Tortorella, G. Exploring Industry 4.0 technologies to enable circular economy practices in a manufacturing context: A business model proposal. J. Manuf. Technol. Manag. 2019, 30, 607–627. [Google Scholar] [CrossRef]
- Chen, B.; Wan, J.; Shu, L.; Li, P.; Mukherjee, M.; Yin, B. Smart Factory of Industry 4.0: Key Technologies, Application Case, and Challenges. IEEE Access 2017, 6, 6505–6519. [Google Scholar] [CrossRef]
- Lasi, H.; Fettke, P.; Kemper, H.G.; Feld, T.; Hoffmann, M. Industry 4.0. Bus. Inf. Syst. Eng. 2014, 6, 239–242. [Google Scholar] [CrossRef]
- Li, L. China’s manufacturing locus in 2025: With a comparison of “Made-in-China 2025” and “Industry 4.0”. Technol. Forecast. Soc. Chang. 2018, 135, 66–74. [Google Scholar] [CrossRef]
- Tantawi, K.H.; Fidan, I.; Tantawy, A. Status of Smart Manufacturing in the United States. In Proceedings of the 2019 IEEE 9th Annual Computing and Communication Workshop and Conference (CCWC), Las Vegas, NV, USA, 7–9 January 2019; pp. 281–283. [Google Scholar] [CrossRef]
- Kim, G.; Bae, J. A novel approach to forecast promising technology through patent analysis. Technol. Forecast. Soc. Chang. 2017, 117, 228–237. [Google Scholar] [CrossRef]
- Lucke, D.; Constantinescu, C.; Westkämper, E. Smart Factory-A Step towards the Next Generation of Manufacturing. Manuf. Syst. Technol. New Front. 2008, 115–118. [Google Scholar] [CrossRef]
- Hameed, B.; Durr, F.; Rothermel, K. RFID based complex event processing in a smart real-time factory. Expert Discuss. Distrib. Syst. Smart Spaces 2011. [Google Scholar] [CrossRef] [Green Version]
- Zuehlke, D. SmartFactory-Towards a factory-of-things. Annu. Rev. Control 2010, 34, 129–138. [Google Scholar] [CrossRef]
- Zhu, Q.; Li, G.; Wu, W. Research on Smart Factory Model of Color TV Industry Based on Intelligent Manufacturing. In Proceedings of the 2018 IEEE 4th Information Technology and Mechatronics Engineering Conference (ITOEC), Chongqing, China, 14–16 December 2018; pp. 1739–1742. [Google Scholar] [CrossRef]
- Radziwon, A.; Bilberg, A.; Bogers, M.; Madsen, E.S. The smart factory: Exploring adaptive and flexible manufacturing solutions. Procedia Eng. 2014, 69, 1184–1190. [Google Scholar] [CrossRef] [Green Version]
- Feng, J.; Li, F.; Xu, C.; Zhong, R.Y. Data-Driven Analysis for RFID-Enabled Smart Factory: A Case Study. IEEE Trans. Syst. Man Cybern. Syst. 2020, 50, 81–88. [Google Scholar] [CrossRef]
- Yang, H.L.; Chang, T.W.; Choi, Y. Exploring the research trend of smart factory with topic modeling. Sustainability 2018, 10, 2779. [Google Scholar] [CrossRef] [Green Version]
- Nagpal, C.; Upadhyay, P.K.; Shahzeb Hussain, S.; Bimal, A.C.; Jain, S. IIoT Based Smart Factory 4.0 over the Cloud. In Proceedings of the 2019 International Conference on Computational Intelligence and Knowledge Economy (ICCIKE), Dubai, United Arab Emirates, 11–12 December 2019; pp. 668–673. [Google Scholar] [CrossRef]
- Kim, C.; Jeon, J.H.; Kim, M.S. Identification and Management of opportunities for technology-based services: A patent-based portfolio approach. Innov. Manag. Policy Pract. 2015, 17, 232–249. [Google Scholar] [CrossRef]
- Jeon, J.; Lee, C.; Park, Y. How to use patent information to search potential technology partners in open innovation. J. Intellect. Prop. Rights 2011, 16, 385–393. [Google Scholar]
- Park, H.S. Technology convergence, open innovation, and dynamic economy. J. Open Innov. Technol. Mark. Complex. 2017, 3, 24. [Google Scholar] [CrossRef] [Green Version]
- Phuyal, S.; Bista, D.; Bista, R. Challenges, Opportunities and Future Directions of Smart Manufacturing: A State of Art Review. Sustain. Futur. 2020, 2, 100023. [Google Scholar] [CrossRef]
- Lee, M.H.; Yun, J.H.J.; Pyka, A.; Won, D.K.; Kodama, F.; Schiuma, G.; Park, H.S.; Jeon, J.; Park, K.B.; Jung, K.H.; et al. How to respond to the Fourth Industrial Revolution, or the second information technology revolution? Dynamic new combinations between technology, market, and society through open innovation. J. Open Innov. Technol. Mark. Complex. 2018, 4, 21. [Google Scholar] [CrossRef] [Green Version]
- Jeon, J.; Suh, Y. Analyzing the Major Issues of the 4th Industrial Revolution. Asian J. Innov. Policy 2017, 6, 262–273. [Google Scholar]
- Wang, S.; Wan, J.; Zhang, D.; Li, D.; Zhang, C. Towards smart factory for industry 4.0: A self-organized multi-agent system with big data based feedback and coordination. Comput. Netw. 2016, 101, 158–168. [Google Scholar] [CrossRef] [Green Version]
- Pagnon, W. The 4th Industrial Revolution—A Smart Factory Implementation Guide. Int. J. Adv. Robot. Autom. 2017, 2, 1–5. [Google Scholar] [CrossRef]
- Forcina, A.; Introna, V.; Silvestri, A. Enabling technology for maintenance in a smart factory: A literature review. Procedia Comput. Sci. 2021, 180, 430–435. [Google Scholar] [CrossRef]
- Lin, Y.J.; Wei, S.H.; Huang, C.Y. Intelligent manufacturing control systems: The core of smart factory. Procedia Manuf. 2019, 39, 389–397. [Google Scholar] [CrossRef]
- Profile, S.E.E. Technological Transformation of Manufacturing by Smart Factory Vision: Original Research Article Technological Transformation Of Manufacturing. Int. J. Dev. Res. 2017, 7, 17371–17382. [Google Scholar]
- Lee, W.J.; Lee, W.K.; Sohn, S.Y. Patent network analysis and quadratic assignment procedures to identify the convergence of robot technologies. PLoS ONE 2016, 11, e0165091. [Google Scholar] [CrossRef] [PubMed] [Green Version]
- Kolleck, N. Social network analysis in innovation research: Using a mixed methods approach to analyze social innovations. Eur. J. Futures Res. 2013, 1, 1–9. [Google Scholar] [CrossRef] [Green Version]
- Suh, Y.; Jeon, J. Monitoring patterns of open innovation using the patent-based brokerage analysis. Technol. Forecast. Soc. Chang. 2019, 146, 595–605. [Google Scholar] [CrossRef]
- Agbo, I.; Kupriyanov, A.; Rytsarev, I. Big Data Architecture: Designing the Right Solution for Social Network Analysis. In Proceedings of the 2020 8th International Symposium on Digital Forensics and Security (ISDFS), Beirut, Lebanon, 1–2 June 2020. [Google Scholar] [CrossRef]
- Freeman, L.C. Centrality in social networks conceptual clarification. Soc. Netw. 1978, 1, 215–239. [Google Scholar] [CrossRef] [Green Version]
- Caviggioli, F. Technology fusion: Identification and analysis of the drivers of technology convergence using patent data. Technovation 2016, 55–56, 22–32. [Google Scholar] [CrossRef]
- Jeon, J.; Suh, Y.; Koh, J.; Kim, C.; Lee, S. Identifying core robot technologies by analyzing patent co-classification Information. Asian J. Innov. Policy 2019, 8, 73–96. [Google Scholar]
- Han, E.J.; Sohn, S.Y. Technological convergence in standards for information and communication technologies. Technol. Forecast. Soc. Chang. 2016, 106, 1–10. [Google Scholar] [CrossRef]
- Jeon, J.; Suh, Y. Multiple patent network analysis for identifying safety technology convergence. Data Technol. Appl. 2019, 53, 269–285. [Google Scholar] [CrossRef]
- Park, S.; Lee, S.J.; Jun, S. A network analysis model for selecting sustainable technology. Sustainability 2015, 7, 13126–13141. [Google Scholar] [CrossRef] [Green Version]
- Kim, J.; Jun, S.; Jang, D.; Park, S. Sustainable technology analysis of artificial intelligence using Bayesian and social network models. Sustainability 2018, 10, 115. [Google Scholar] [CrossRef] [Green Version]
- Jun, S. IPC code analysis of patent documents using association rules and maps-Patent analysis of database technology. Commun. Comput. Inf. Sci. 2011, 258, 21–30. [Google Scholar] [CrossRef]
- Jun, S. Central technology forecasting using social network analysis. Commun. Comput. Inf. Sci. 2012, 340, 1–8. [Google Scholar] [CrossRef]
- Park, H.; Yoon, J. Assessing coreness and intermediarity of technology sectors using patent co-classification analysis: The case of Korean national R&D. Scientometrics 2014, 98, 853–890. [Google Scholar] [CrossRef]
- Jun, S.; Park, S.S. Examining technological innovation of Apple using patent analysis. Ind. Manag. Data Syst. 2013, 113, 890–907. [Google Scholar] [CrossRef]
- Cho, T.S.; Shih, H.Y. Patent citation network analysis of core and emerging technologies in Taiwan: 1997–2008. Scientometrics 2011, 89, 795–811. [Google Scholar] [CrossRef]
- Lee, S.; Kim, W.; Lee, H.; Jeon, J. Identifying the structure of knowledge networks in the US mobile ecosystems: Patent citation analysis. Technol. Anal. Strateg. Manag. 2016, 28, 411–434. [Google Scholar] [CrossRef]
- Opsahl, T.; Agneessens, F.; Skvoretz, J. Node centrality in weighted networks: Generalizing degree and shortest paths. Soc. Netw. 2010, 32, 245–251. [Google Scholar] [CrossRef]
- Abbasi, A.; Hossain, L.; Leydesdorff, L. Betweenness centrality as a driver of preferential attachment in the evolution of research collaboration networks. J. Informetr. 2012, 6, 403–412. [Google Scholar] [CrossRef] [Green Version]
- Wei, B.; Deng, Y. A cluster-growing dimension of complex networks: From the view of node closeness centrality. Phys. A Stat. Mech. Its Appl. 2019, 522, 80–87. [Google Scholar] [CrossRef]
- Li, H. Centrality Analysis of Online Social Network Big Data. In Proceedings of the 2018 IEEE 3rd International Conference on Big Data Analysis (ICBDA), Shanghai, China, 9–12 March 2018; pp. 38–42. [Google Scholar] [CrossRef]
- White, D.R.; Borgatti, S.P. Betweenness centrality measures for directed graphs. Soc. Netw. 1994, 16, 335–346. [Google Scholar] [CrossRef] [Green Version]
- USPTO. Available online: https://www.uspto.gov/ (accessed on 30 March 2021).
- WIPO. Available online: https://www.wipo.int/portal/en/index.html (accessed on 27 April 2021).
- Won, J.Y.; Park, M.J. Smart factory adoption in small and medium-sized enterprises: Empirical evidence of manufacturing industry in Korea. Technol. Forecast. Soc. Chang. 2020, 157, 120117. [Google Scholar] [CrossRef]
- Resman, M.; Turk, M.; Herakovic, N. Methodology for planning smart factory. Procedia CIRP 2020, 97, 401–406. [Google Scholar] [CrossRef]


| Acronym | Terminology | Acronym | Terminology |
|---|---|---|---|
| IPC | International Patent Classification | ICT | Information and communication technology |
| CPS | Cyber-physical system | IIoT | Industrial internet of things |
| AI | Artificial intelligence | AR | Augmented reality |
| RFID | Radio frequency identification | SCADA | Supervisory control and data acquisition |
| SNA | Social network analysis | CE | Circular economy |
| USPTO | United States Patent and Trademark Office | WIPO | World Intellectual Property Organization |
| S. No. | Keywords | Quantity |
|---|---|---|
| 1 | smart factory | 27 |
| 2 | smart manufacturing | 86 |
| 3 | smart industry | 14 |
| 4 | cyber-physical system | 140 |
| 5 | Industry 4.0 | 52 |
| 6 | connected factory | 353 |
| Total | 672 |
| Sr. No. | IPC Code Alphabet | Major Classification |
|---|---|---|
| 1 | A | Human necessities |
| 2 | B | Performing operations; Transporting |
| 3 | C | Chemistry; Metallurgy |
| 4 | D | Textile; Paper |
| 5 | E | Fixed construction |
| 6 | F | Mechanical Engineering; Lighting; Heating; Weapons; Blasting |
| 7 | G | Physics |
| 8 | H | Electricity |
| Sr. No. | IPC Codes | Detailed Technological Applications Corresponding to IPC Codes |
|---|---|---|
| 1 | G06F | Electric digital data processing |
| 2 | H01L | Semiconductor Devices: Electric solid-state devices not otherwise provided for |
| 3 | H04L | Transmission of digital information, e.g., Telegraphic communication |
| 4 | H04W | Wireless Communication Networks |
| 5 | G05B | Control or regulating systems in general; Functional elements of such systems; Monitoring or testing arrangements for such systems or elements |
| 6 | G01N | Investigating or analyzing materials by determining their chemical or physical properties |
| 7 | G01J | Measurement of intensity, velocity, spectral content, polarization, phase or pulse characteristics of infra-red, visible or ultra-violet light; Colorimetry; Radiation pyrometry |
| 8 | G06K | Recognition of data; Presentation of data; Record carriers; Handling record carriers |
| 9 | G06Q | Data processing systems or methods, specially adapted for administrative, commercial, financial, managerial, supervisory or forecasting purposes |
| 10 | A61B | Diagnosis; Surgery; Identification |
| Sr. No. | Year | IPC Code Networks | Remarks |
|---|---|---|---|
| 1 | 2008 | 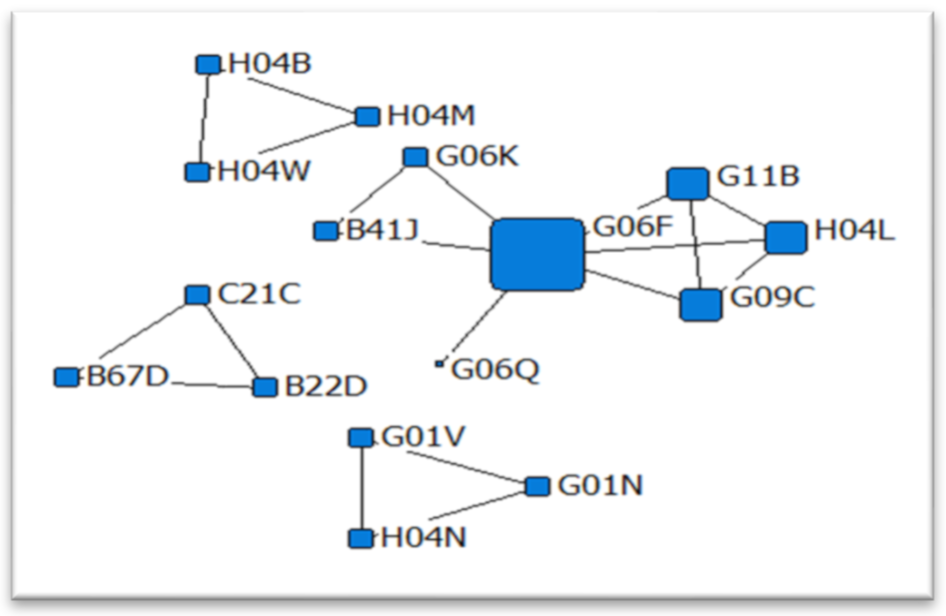 | This network represents the technological convergence of digital data processing systems and related technologies. |
| 2 | 2009 |  | This network represents the technological convergence of photolithography for semiconductors. |
| 3 | 2010 | 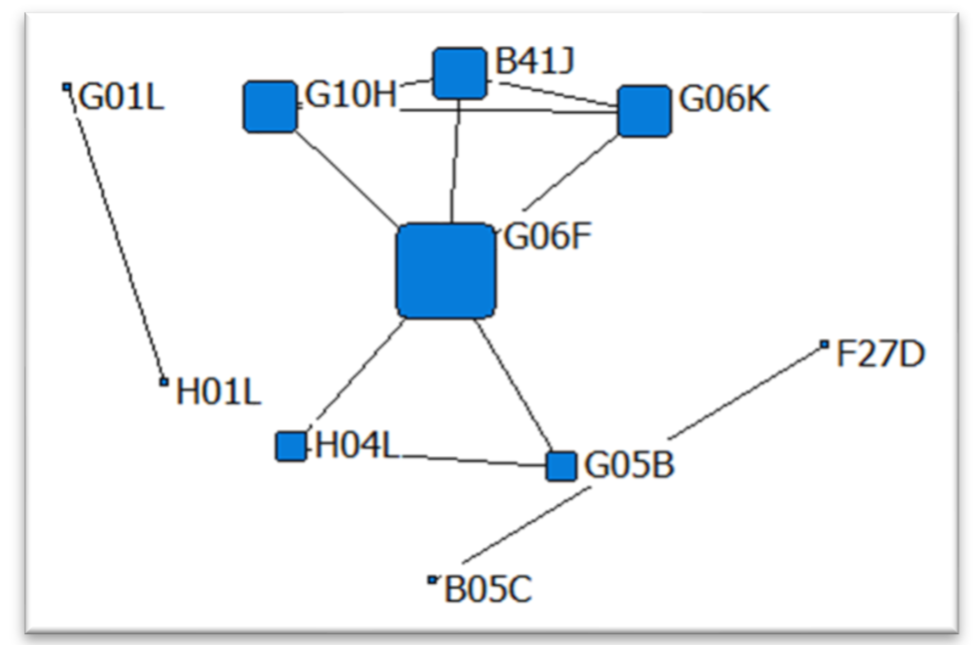 | This network represents the technological convergence of data processing and data transfer control systems. |
| 4 | 2013 | 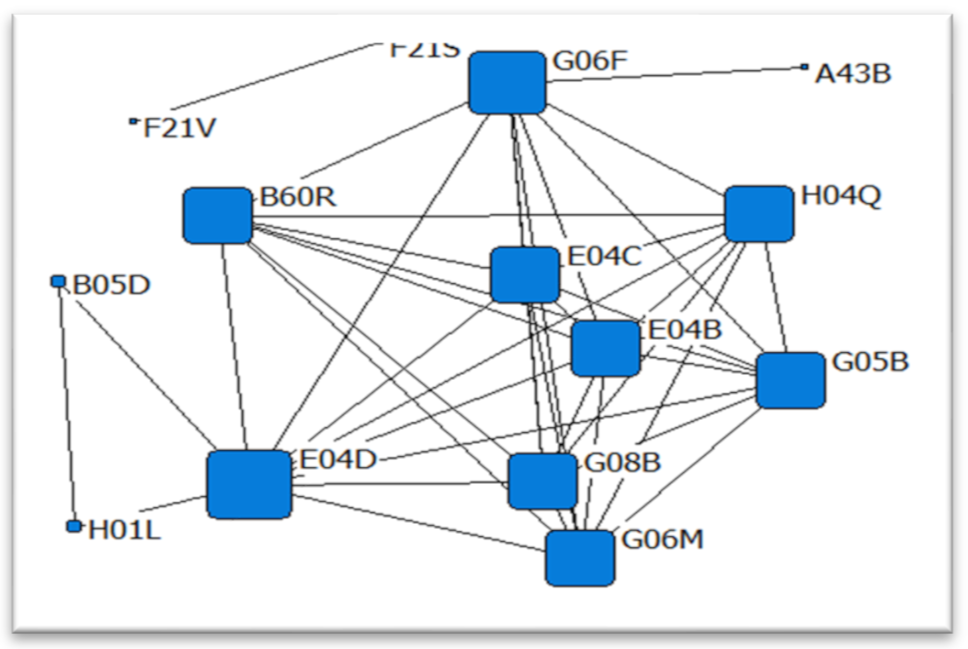 | This network represents the technological convergence of signal and call systems. |
| 5 | 2014 | 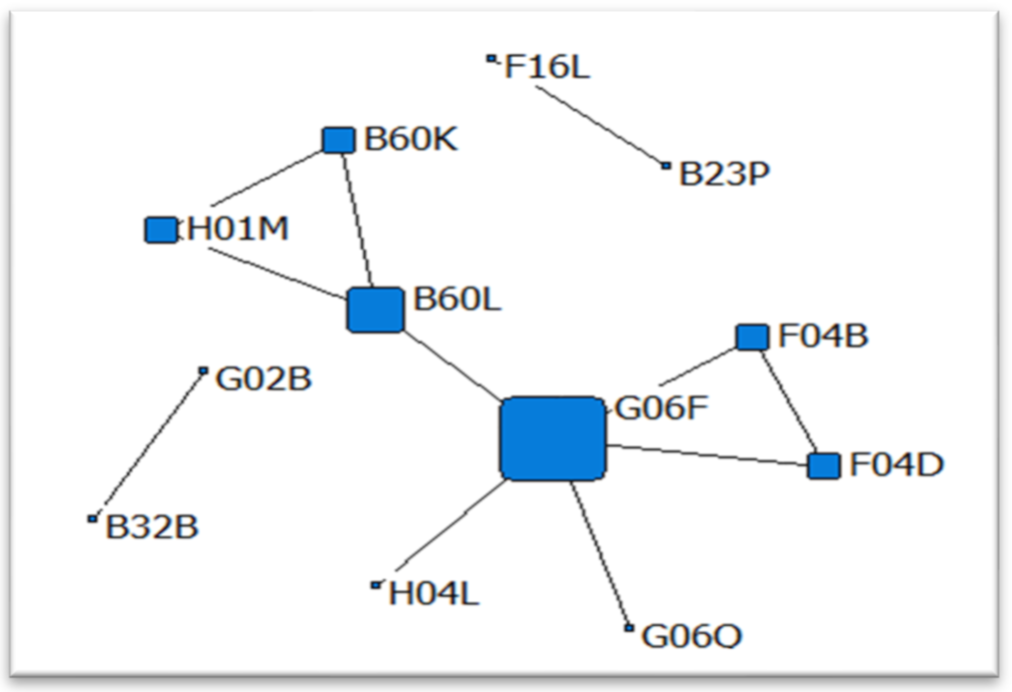 | This network represents the technological convergence of vehicle systems and data processing. |
| 6 | 2015 |  | This network represents the technological convergence of material diagnosis and communication systems. |
| 7 | 2016 | 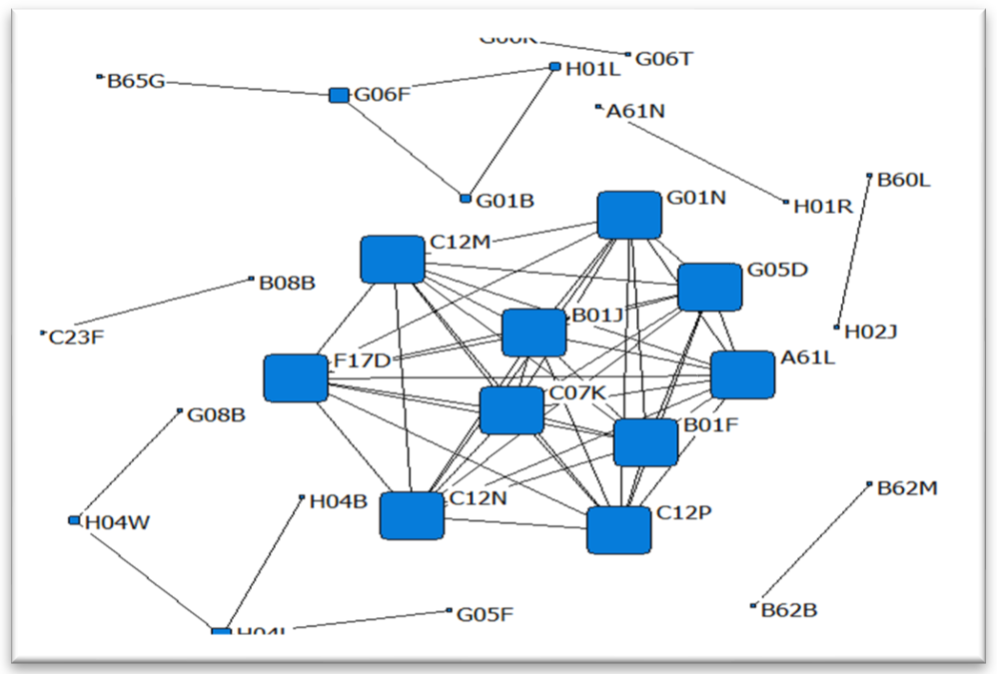 | This network represents the technological convergence of wireless communication networks and investigating material properties. |
| 8 | 2017 | 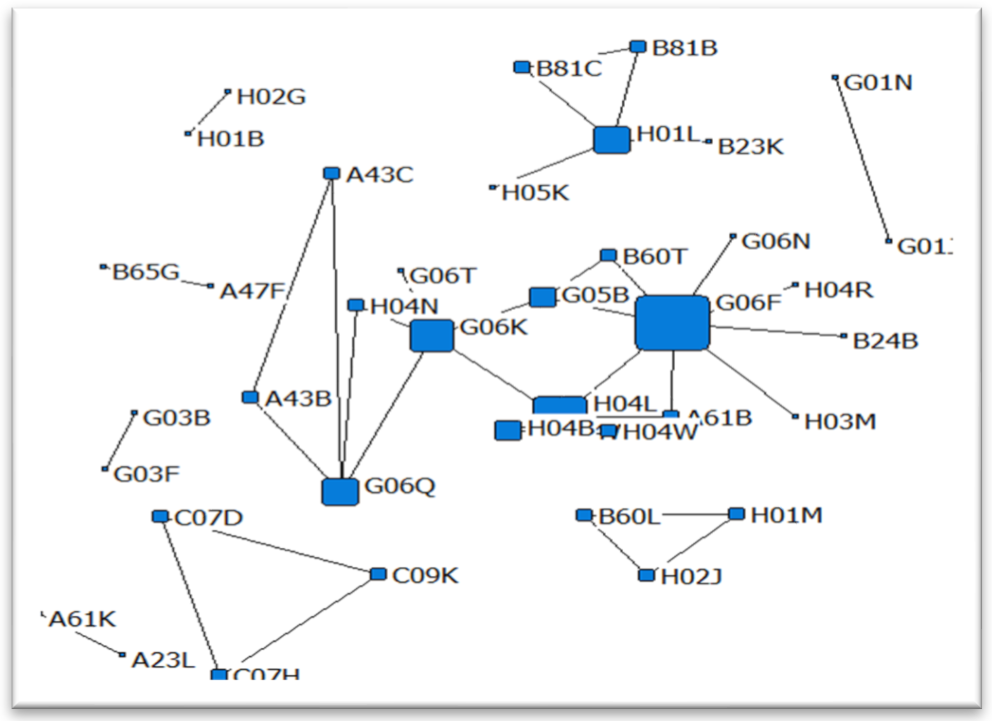 | This network represents the technological convergence of recognition of data, electrical digital data processing, and communication networks. |
| 9 | 2018 |  | The IPC code network of the year 2018, containing technologies such as vehicle control systems, semiconductor applications, recognition and data processing, wireless communications, data transmission, and other technologies. |
| 10 | 2019 | 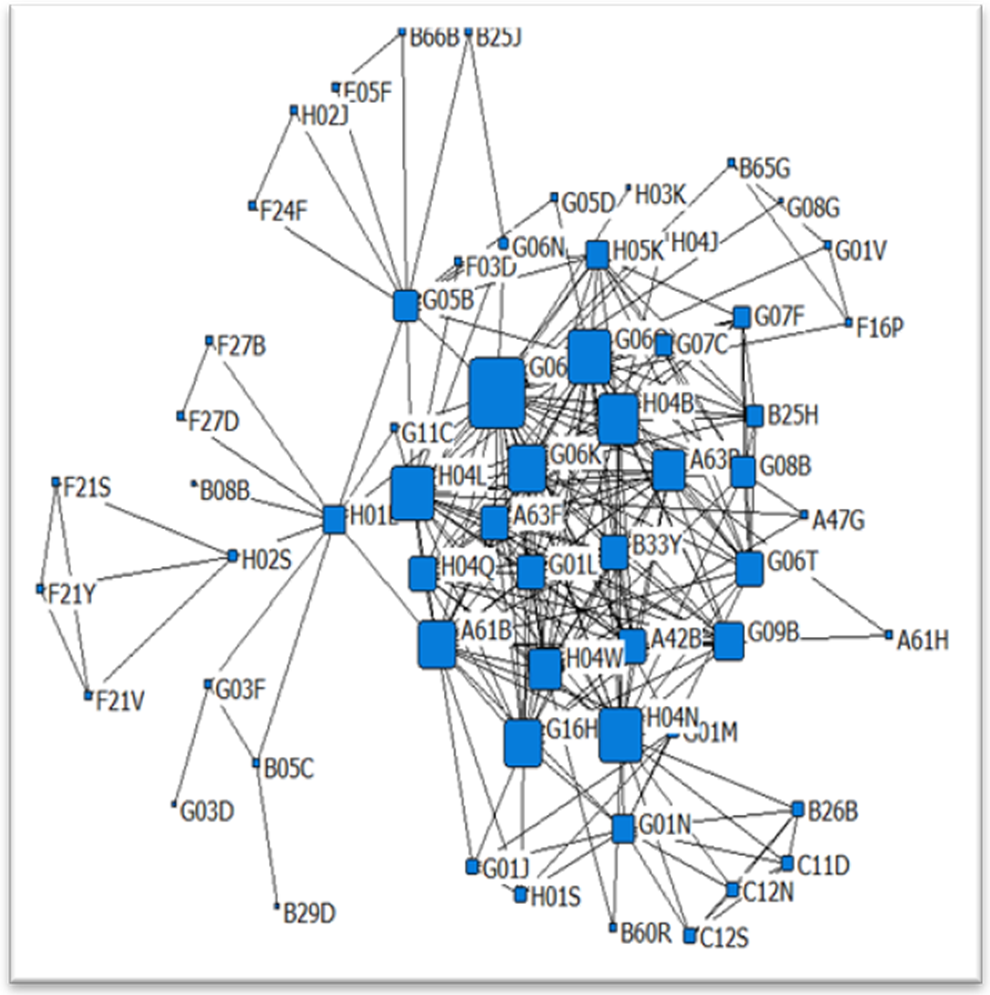 | While the IPC code network of the year 2019 contains the technological cluster of control systems in general, light and devices related to it, diagnosis and investigation technologies, furnace technology, digital data processing and transmission systems, and communication networks are also included. |
| Year | 2017 | 2018 | 2019 |
|---|---|---|---|
| 1st | G06F | G06F | G06F |
| (Electric digital data processing) | (Electric digital data processing) | (Electric digital data processing) | |
| 2nd | H04L | H04L | H04L |
| (Transmission of digital information) | (Transmission of digital information) | (Transmission of digital information) | |
| 3rd | G06K | H04W | G06Q |
| (Recognition of data) | (Wireless communication networks) | (Data processing systems) | |
| 4th | H01L | H01L | H04N |
| (Semiconductor devices) | (Semiconductor devices) | (Pictorial communication) | |
| 5th | G06Q | A61B | H04B |
| (Data processing systems) | (Diagnosis; Surgery; Identification) | (Transmission) |
Publisher’s Note: MDPI stays neutral with regard to jurisdictional claims in published maps and institutional affiliations. |
© 2022 by the authors. Licensee MDPI, Basel, Switzerland. This article is an open access article distributed under the terms and conditions of the Creative Commons Attribution (CC BY) license (https://creativecommons.org/licenses/by/4.0/).
Share and Cite
Hussain, A.; Jeon, J.; Rehman, M. Technological Convergence Assessment of the Smart Factory Using Patent Data and Network Analysis. Sustainability 2022, 14, 1668. https://doi.org/10.3390/su14031668
Hussain A, Jeon J, Rehman M. Technological Convergence Assessment of the Smart Factory Using Patent Data and Network Analysis. Sustainability. 2022; 14(3):1668. https://doi.org/10.3390/su14031668
Chicago/Turabian StyleHussain, Adnan, Jeonghwan Jeon, and Mudassar Rehman. 2022. "Technological Convergence Assessment of the Smart Factory Using Patent Data and Network Analysis" Sustainability 14, no. 3: 1668. https://doi.org/10.3390/su14031668
APA StyleHussain, A., Jeon, J., & Rehman, M. (2022). Technological Convergence Assessment of the Smart Factory Using Patent Data and Network Analysis. Sustainability, 14(3), 1668. https://doi.org/10.3390/su14031668