Article

Influence of Tourism Safety Perception on Destination Image: A Case Study of Xinjiang, China

School of Geography and Tourism, Shaanxi Normal University, Xi’an 710119, China
*
Author to whom correspondence should be addressed.
Sustainability 2022, 14(3), 1663; https://doi.org/10.3390/su14031663
Submission received: 21 December 2021 / Revised: 20 January 2022 / Accepted: 28 January 2022 / Published: 31 January 2022
(This article belongs to the Collection Advances in Marketing and Managing Tourism Destinations)

Abstract

:
Tourism safety perception is one of the factors influencing destination image, but there is a lack of systematic research on the multidimensional influence of tourism safety perception on destination image. In this paper, based on the survey data collected from 623 tourists traveling in Xinjiang, China, we classified the respondents into three types of high, medium, and low levels of tourism safety perception by cluster analysis, and studied the influence of tourism safety perception on destination image in multiple dimensions by means of content analysis, diversity index, one-way ANOVA, and factor analysis. We found that tourism safety perception significantly affects the cognitive image, affective image, and conative image of the destination. Tourists with a high safety perception evaluate and affectively experience destination attributes more positively with higher satisfaction and stronger willingness to revisit and recommend. Tourism safety perception affects the stereotype image of the destination to a certain extent. Tourists in general produce a broadly homogeneous stereotype image, but there are differences in diversity and emotions. Tourists with a high safety perception have a richer and more positive stereotype image. This study enriches and deepens the theory regarding the influence of tourism safety perception on destination image, and also provides a richer theoretical basis for destination image construction and precision marketing.

1. Introduction

Tourism safety is not only the premise and guarantee of normal tourism activities, but also the lifeline of tourism development [1]. With the development of tourism, the tourism safety problem has become increasingly prominent. For example, the Fukushima nuclear disaster in Japan in 2011 forged a widespread negative image and brought concerns about travel risks for international tourists to Japan, resulting in a drop of more than 50% in international tourist arrivals [2]. The 2015 terrorist attacks in Paris produced a serious impact on the French tourism industry [3], and researchers found that people’s perception of safety in Paris affected their intention to travel to Paris [4]. The 2018 Phuket cruise ship overturning accident in Thailand brought a great negative impact on the tourism image of Phuket, and resulted in a decline in tourism demand for Phuket [5]. Therefore, tourism safety is clearly emerging as a hot issue in academic circles and industries [6].
The perception of safety at a destination not only affects the tourist’s perception of the destination image, but also has an impact on their travel decisions and travel behavior, for tourists would have a negative impression of the destination and they would be less likely to revisit the destination or recommend it to others if they felt unsafe or threatened there [7]. Tourists’ evaluation of destinations and travel decisions are often made based on subjective perceptions rather than objective reality [8,9,10], and negative images are hard to reverse once they are formed. Governments have taken a series of measures in recent years to address the issue of tourism safety and have maintained better safety and stability in the tourism industry in general. Besides, the factors affecting the safety of world tourism are complex and changeable, and there still exist both traditional and non-traditional unsafe factors. Therefore, creating a good tourism image by improving the perception of destination safety is essential to enhance the attractiveness and competitiveness of the destination.
Tourism safety perception and destination image were two separate research themes in earlier studies, and scholars have conducted a series of studies on both. In terms of impact and outcome, both tourism safety perception and destination image have an influence on travelers’ tourism decisions, behavioral intentions, satisfaction, and loyalty. Is there some connection between tourism safety perception and destination image, and what connection is it? These are theoretical issues worthy of studying.
According to the available literature, there are few studies on the relationship between tourism safety perception and destination image. Xinjiang is a typical case in the study of tourism safety perception and destination image. Xinjiang is the largest provincial administrative region in China and also a major tourist destination in northwest China. With the advancement of China’s Belt and Road Initiative, Xinjiang has a rare chance for the development of its tourism industry. However, it is also facing numerous challenges in its rapid development of tourism. For example, the “three forces” planned and perpetrated thousands of violent terrorist attacks in Xinjiang from 1990 to 2016. These incidents received widespread attention and coverage by domestic and international media, negatively impacting Xinjiang’s tourism image, and the tourism industry suffered as a result. Xinjiang has achieved significant milestones in social stability in recent years, creating a favorable tourism environment for domestic and foreign tourists. Influenced by the previous negative public opinion, some tourists have formed an inherent impression in their minds that Xinjiang is a tourism destination with high risks, and they still have certain concerns about the safety of tourism there [11]. Therefore, there is an urgent need to promote the sustainable development of tourism and social economy in Xinjiang by enhancing tourists’ safety perception and the destination image of Xinjiang.
By conducting a case study of Xinjiang, carrying out a survey on tourism safety perceptions and destination image among tourists traveling there, and exploring the influence of tourism safety perception on destination image, this paper will help destination management organizations (DMOs) to better manage tourism safety and build destination image, and provide theoretical support for the healthy and sustainable development of tourism destinations.

2. Literature Review

2.1. Tourism Safety Perception

Tourism safety perception refers to the subjective feelings and perceptions of tourists about the safety of a destination under the influence of external information involvement and their own factors [12]. Tourists’ perception of destination safety may be both positive and negative [13]. Scholars generally measure tourism safety perception of destinations based on the natural and social environment of destinations and tourism elements and types of tourism safety issues. There are currently two major measurement methods: one is to measure the overall tourism safety perception, for example by asking visitors to respond to statements such as, “××× is a safe/unsafe place, ××× is as safe/unsafe as other tourist destinations, I am told that ××× is a safe/unsafe tourist destination” [11,14,15]; the second is to measure the safety perception of tourists by asking about topics such as terrorism, natural disasters, public health, social security, cultural conflicts, tourism services, and tourism activity elements [16,17,18,19,20]. The overall security perception measurement is generally based on structural equation modeling for an impact path study, and the measurement of safety perception elements is generally based on factor analysis for dimension extraction.
Empirical studies have shown that tourism safety perception has a certain influence on tourism decision-making [21,22], tourism preference [16], tourism behavioral intention [4,17,23], satisfaction [15], and loyalty [17]. Barker et al. argued that tourist concerns about safety and fear of crime are as important as whether they experience crime victimization for their influence on tourism decisions and travel behavior [24]. Sönmez and Graefe found in their study that the level of risk perception directly affects tourists’ choice of holiday destinations across the world [22]. Chen et al. found that terrorist events and war risk factors have an impact on travel preferences [16]. Li et al. found that both tourist safety perception and tourism image perception have a significant positive effect on loyalty, and tourist safety perception and tourism image perception have a full mediating effect between negative public opinion and tourist loyalty [11]. Yang and Xie found that tourists’ safety perception affects willingness to travel; specifically, micro safety perception positively affects tourists’ micro travel intention and macro safety perception positively affects macro travel intention [4].

2.2. Destination Image

Destination image is the sum of individuals’ beliefs, ideas, and impressions about a destination [25]. In the conceptual dimension of destination image, most scholars believe that destination image is a multidimensional structure including cognitive components and affective components. The cognitive dimension refers to knowledge and beliefs about a destination with a focus on the evaluation of destination attributes; the affective dimension refers to the feelings or affection for the destination with focus on the subjective feeling of the destination [8,26]. On this basis, Gartner believes that destination image is developed from three components that are interrelated and interact with each other: cognition, emotion, and conation. The component of conation includes the behavior or intention of an individual to revisit and recommend the destination [27,28,29], and also includes spreading positive reputation [30]. Cognitive image, affective image, and conative image are generally measured in a structured way and studied quantitatively. Scholars have done extensive research on these three image dimensions.
Echtner and Ritchie developed a conceptual framework for destination image, which is a three-dimensional continuum composed of attribute–holistic, functional–psychological, and common–unique [31]. Echtner and Ritchie, based on the conceptual framework of the three-dimensional continuum, developed a structured scale of cognitive image and unstructured measurement questions regarding stereotype image, affective image, and unique image [32]. The concept of stereotype image has its origin in social psychology and refers to people’s beliefs in characteristics, attributes, and behaviors of a specific group [33,34]. In the field of tourism, scholars have extended the study of stereotype image from “groups” to “destinations” to investigate people’s beliefs in characteristics or attributes of a particular destination. Stereotype image is generally measured in an unstructured way and studied both quantitatively and qualitatively. There are few research results in this area.
Destination image is a very complex concept, and its formation is influenced by a combination of factors. Many scholars believe that destination image is mainly influenced by personal and stimulus factors. Personal factors are internal determinants, i.e., demographic characteristics (gender, age, schooling, family life cycle, social class, and place of residence), and psychological characteristics (motivation, values, personality, and lifestyle); stimulus factors include primary sources of information (information obtained by tourists from field visits to the destination) and secondary sources of information (tourism information and tourism advertisements provided by destination marketing organizations, destination-related news or TV programs presented by mass media, and introductions by friends and relatives) [26,35,36,37]. In addition, tourists’ familiarity with the destination [32,38,39], visit frequency [40], travel experience [36,41], and geographical distance [42,43,44] also affect destination image to varying degrees.

2.3. Influence of Tourism Safety Perception on Destination Image

Existing viewpoints have shown that tourism safety perception has a significant impact on destination image. George argued that tourists would have a negative impression of the destination if they felt unsafe or threatened there [7]. Lepp et al. found that Uganda is perceived as a dangerous destination and that the perceived risks characterized by poverty, war, civil unrest, disease, and hunger severely affect its tourism image [45]. Scholars have further found in empirical studies that tourism safety perception has an impact on some dimensions of destination image. Lehto et al. explored the effect of tourists’ natural disaster perception on affections and travel intentions based on the pleasure arousal dominance (PAD) affection model, and found that natural disasters significantly affect PAD affections and travel intentions [46]. Chew and Jahari verified through their study that tourism risk perception has a certain impact on cognitive image and affective image, and that cognitive image and affective image play an intermediary role in the relationship between perceived risk and revisit intention [2]. Yang and Xie found that tourism safety perception has a significant positive impact on affective image, and that tourism safety perception and affective image have multiple mediating effects between hospitality and satisfaction [15]. Li et al. found that safety perception and overall image perception of tourists have a full mediating effect between negative public opinion and tourist loyalty [11]. These studies indicate that tourism safety perception may have a direct or indirect influence on destination image in different dimensions.
There is abundant research on tourism safety perception and destination image, but there is little research on the influence of tourism safety perception on destination image, and there are some deficiencies in research content and methodology. First of all, the existing empirical studies focus on the impact of tourism safety perception in one or two dimensions of destination image, for example, the impact of safety perception in one dimension of affective image or overall image [11,15,46], and the impact of risk perception in the two dimensions of cognitive and affective images [2]. There are no studies on the influence of other image dimensions such as stereotype image and conative image, and also no comparative studies on the influence of destination image in multiple dimensions. Second, there is a lack of diversity in research methods. Image measurement is conducted based on structured measures with structural equation modeling for impact path analysis in most studies [2,11,15,16], while in a few studies, destination image measurement is conducted based on a combination of structured and unstructured measures and a comprehensive impact study of destination image is carried out by quantitative and qualitative methods.
To address this research gap, this study is devoted to analyzing the following issues: Are there differences in stereotype, cognitive, affective, and conative images among different safety perception groups? Is there an influence of tourism safety perception on the above four aspects of dimension image? How is it best to respond to destination image dimensions and factors with different levels of influence in management practice? The study of the above issues helps to further reveal the formation and influence mechanism of destination image, enrich and deepen the theoretical study of destination image, and also provide a theoretical basis for destination image construction and destination precision marketing.

3. Materials and Methods

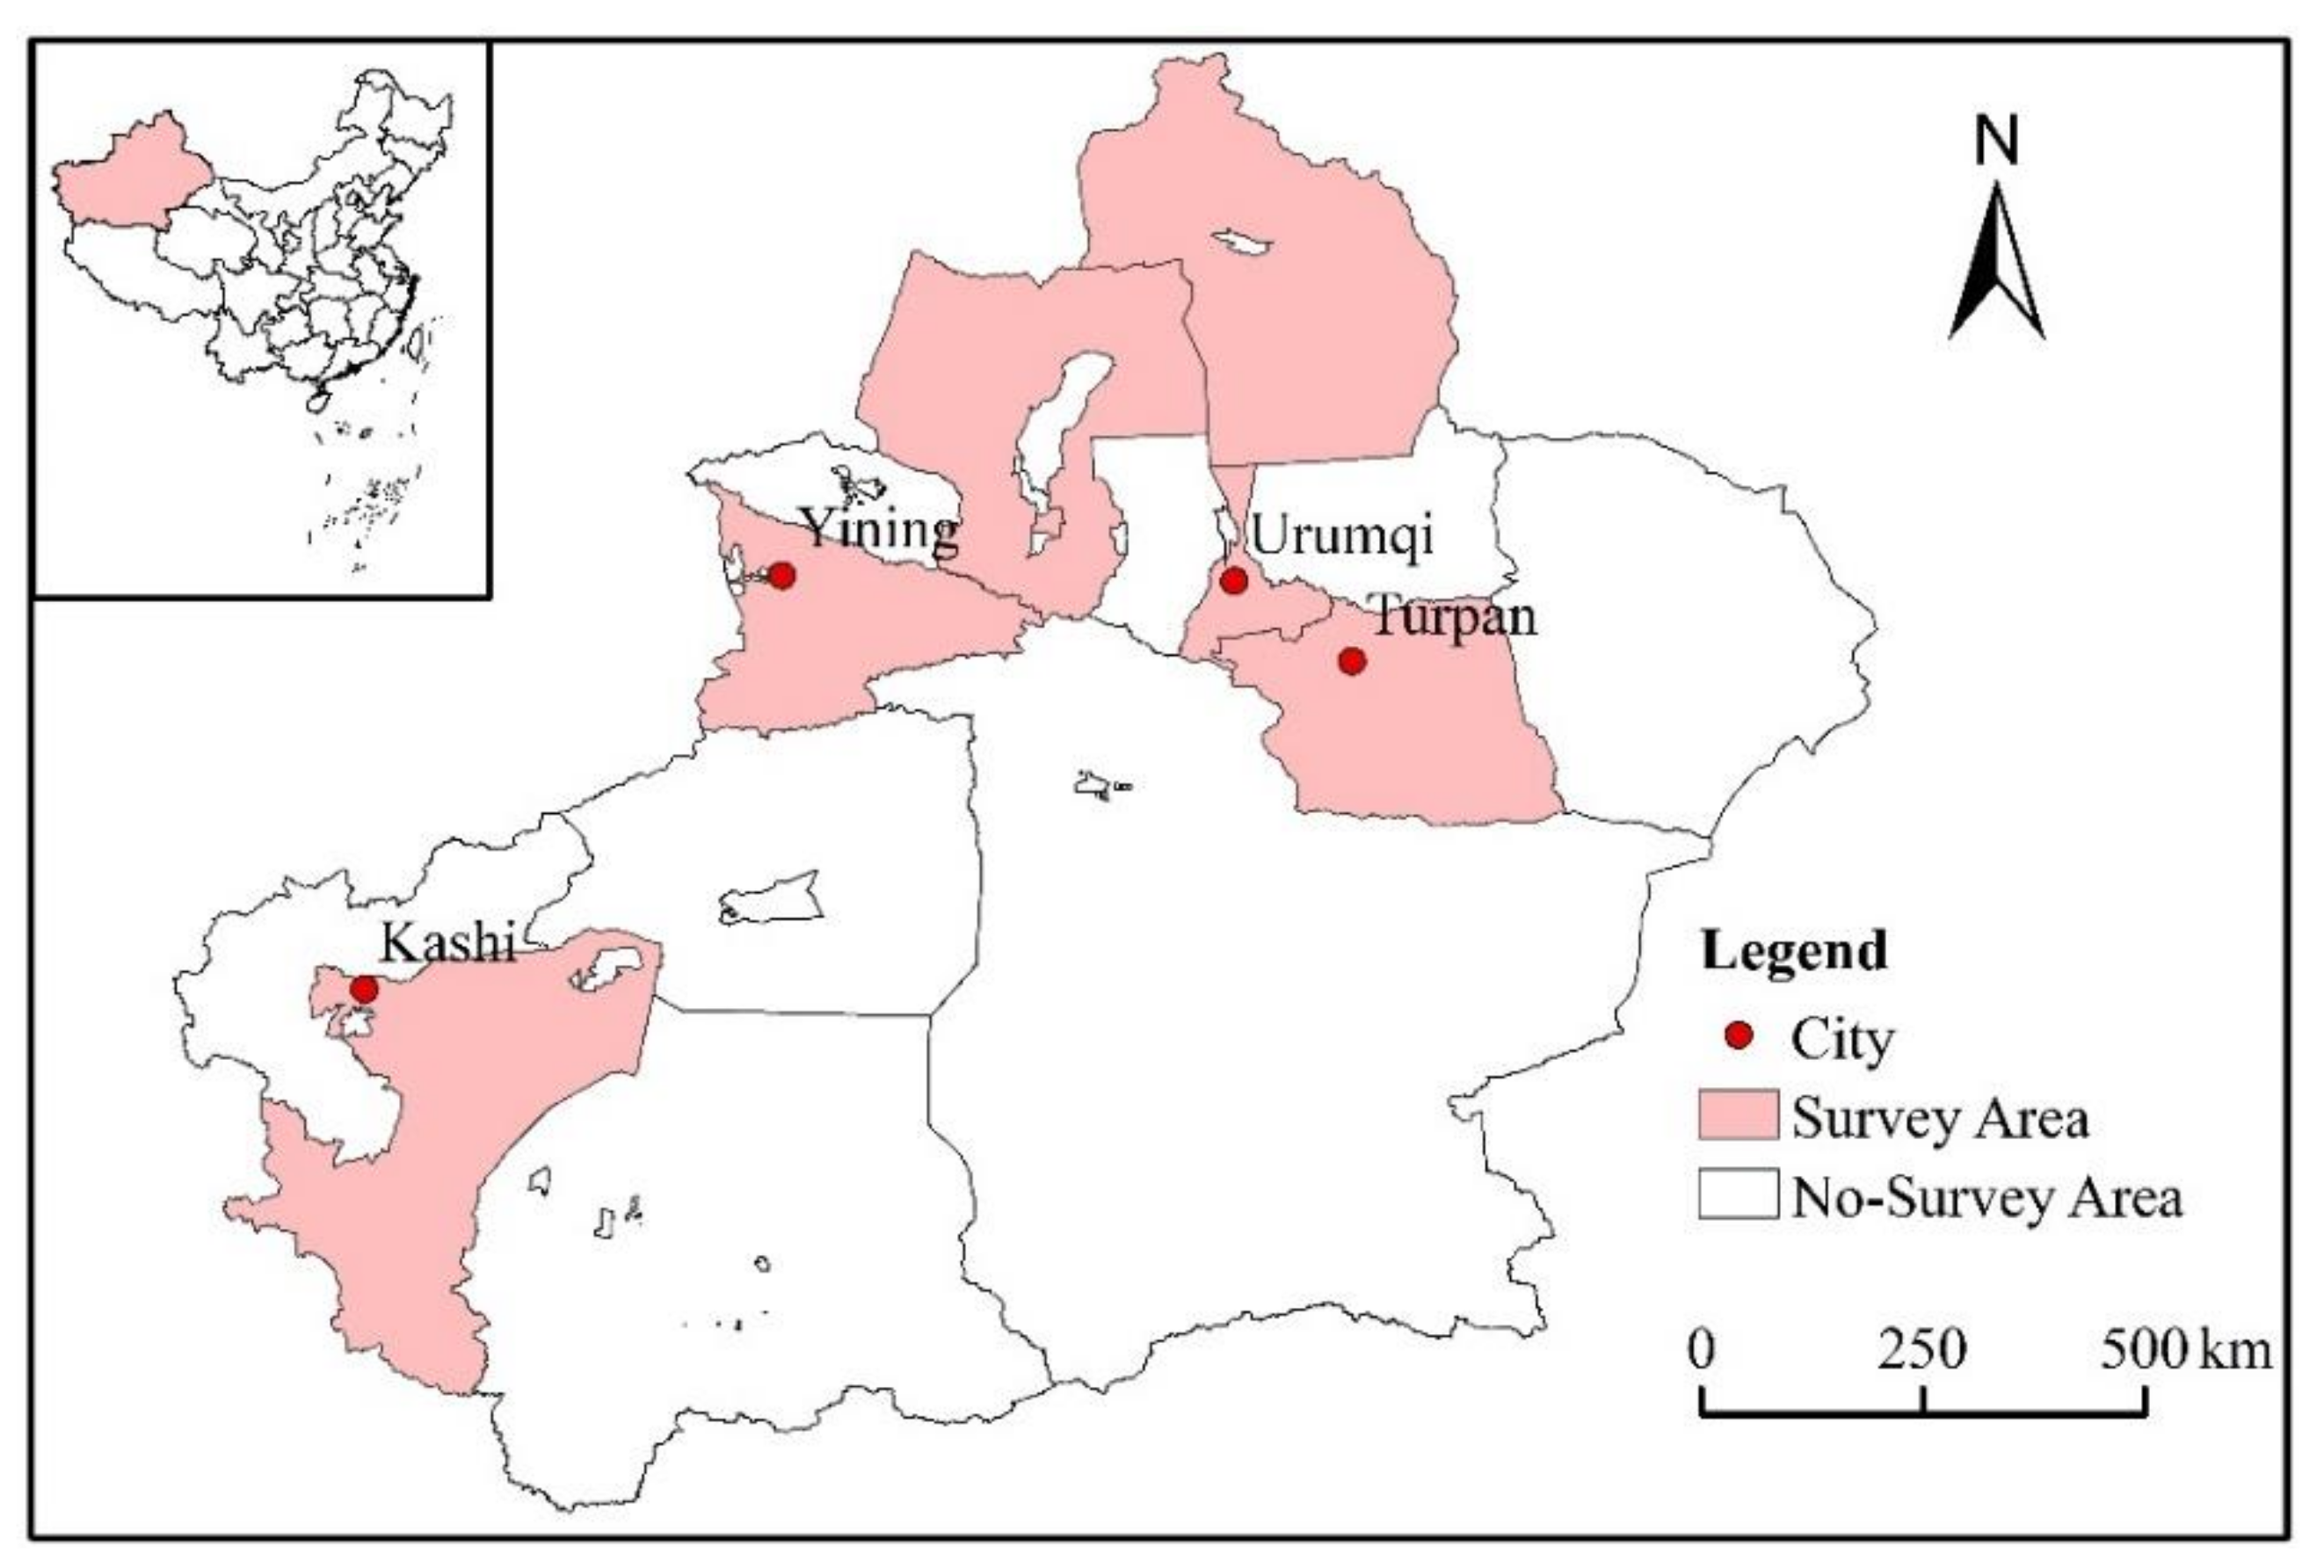
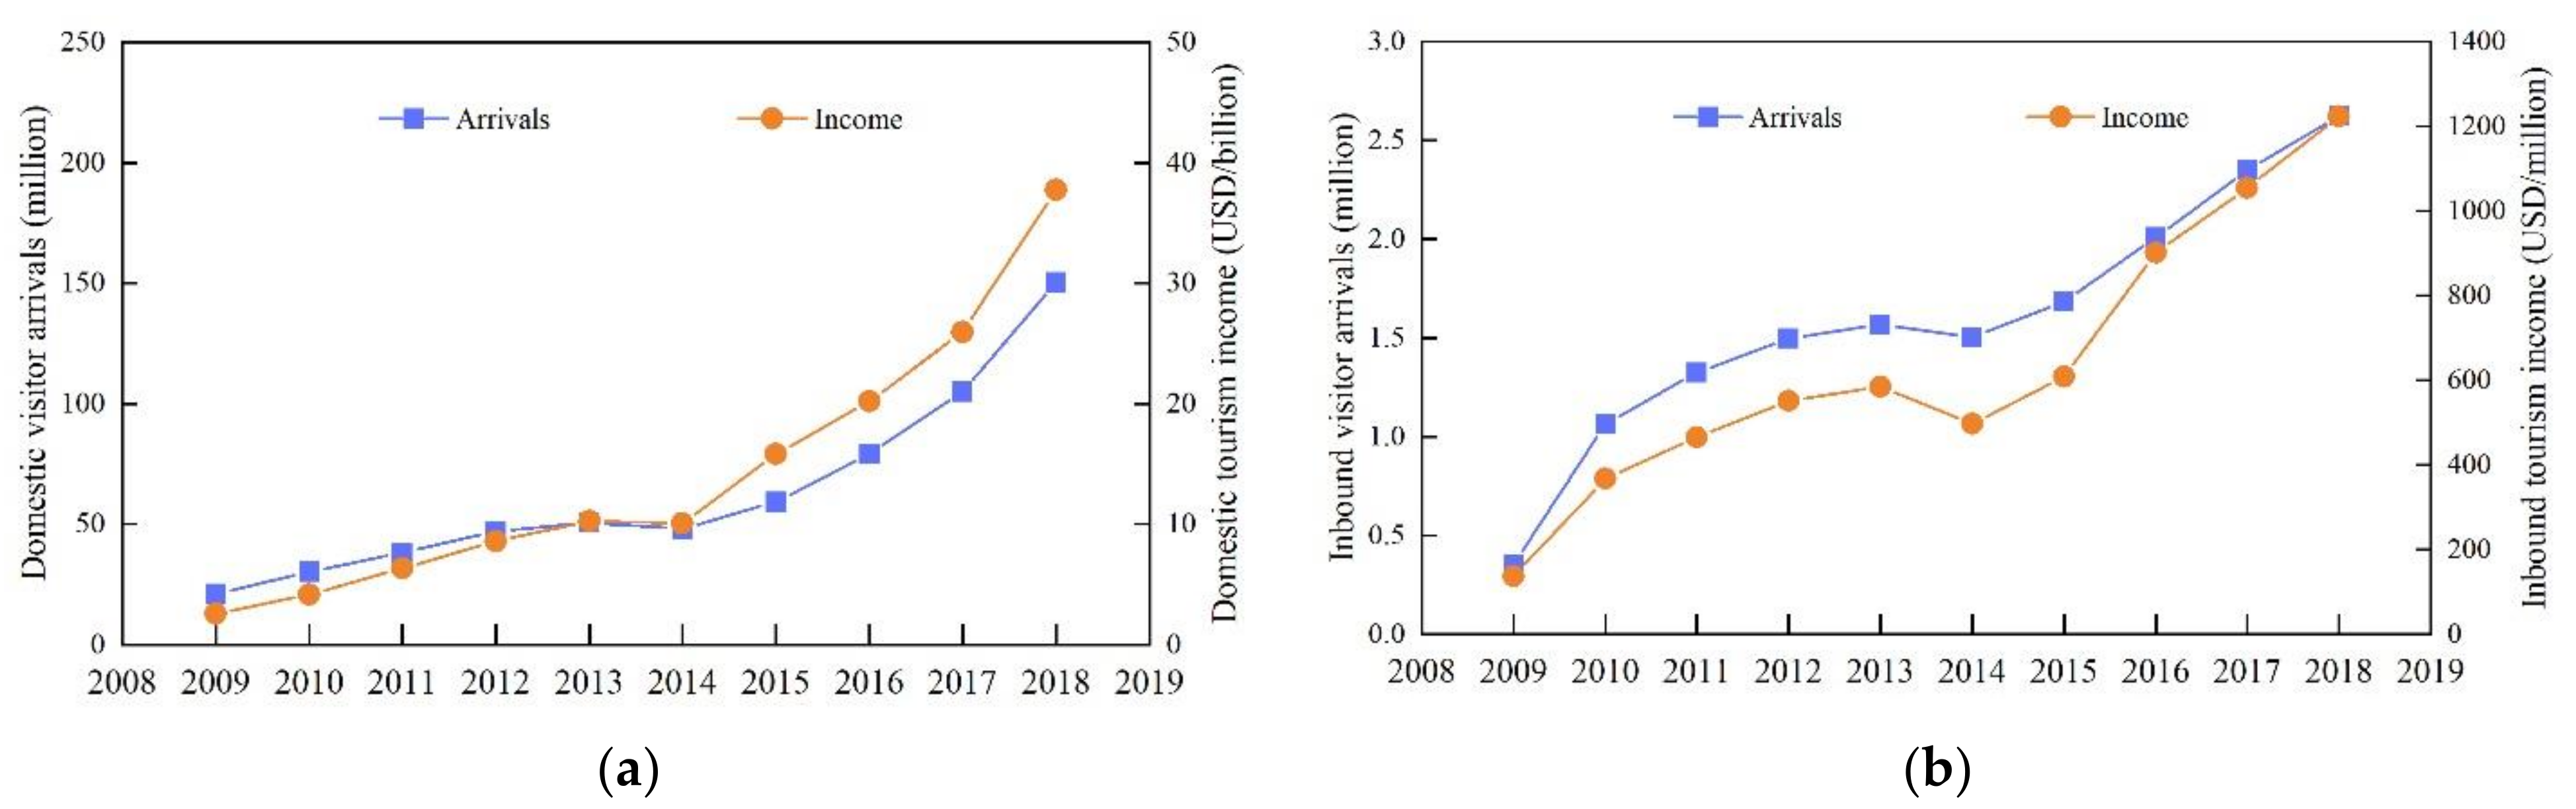
3.1. Study Area: Xinjiang

This study area was Xinjiang, officially called Xinjiang Uyghur Autonomous Region. Xinjiang is located in the northwest border of China, in the middle of Asia and Europe, between 73°40′~96°18′ E and 34°25′~48°10′ N. It covers an area of 1.66 million square kilometers, about one-sixth of the total land area of China (Figure 1). Xinjiang is the largest provincial administrative region in China, with the largest number of bordering countries and the longest land border. Xinjiang, with its unique geographical location, rich natural resources and diverse ethnic cultures, is famous for its numerous tourist attractions. For example, Tianshan Tianchi scenic area, Kanas scenic area, and Kashgar old town scenic area are unique tourist attractions that enjoy popularity in China and the world.
According to the statistical analysis report of Chinese culture and tourism development, the tourism in Xinjiang enjoyed rapid development from 2009 to 2018. Xinjiang received 147.623 million domestic tourists in 2018 and boosted domestic tourism income to USD 37.77 billion, an increase of 6.04 times and 13.13 times, respectively, compared with 2009; Xinjiang received 2.63 million inbound tourists in 2018 and boosted inbound tourism income to USD 1223 million, an increase of 6.4 times and 7.93 times, respectively, compared with 2009 (Figure 2). Domestic tourist source markets of Xinjiang mainly are, besides Xinjiang itself, Guangdong, Sichuan, Beijing, Jiangsu, Shanghai, and Henan, while inbound tourist source markets mainly include Kazakhstan, Mongolia, and Russia.
The investigation sites in this paper are Urumqi, Turpan, Ili Kazakh Autonomous Prefecture, and Kashgar (Figure 1). The above four regions were selected based on the following facts. (1) Geographically, north of the Tianshan Mountains is traditionally known as Northern Xinjiang, and south of the Tianshan Mountains is Southern Xinjiang. Urumqi, Turpan, and Ili Kazakh Autonomous Prefecture are the main tourist destinations in Northern Xinjiang, and Kashgar is the main tourist destination in Southern Xinjiang. These four regions cover the two major geographic areas in the north and south of Xinjiang. (2) In 2018, Xinjiang received 150.25 million tourists, while the four regions of Urumqi, Turpan, Ili Kazakh Autonomous Prefecture, and Kashgar accounted for 75.06%. Therefore, those traveling in the above four regions are representative as respondents.

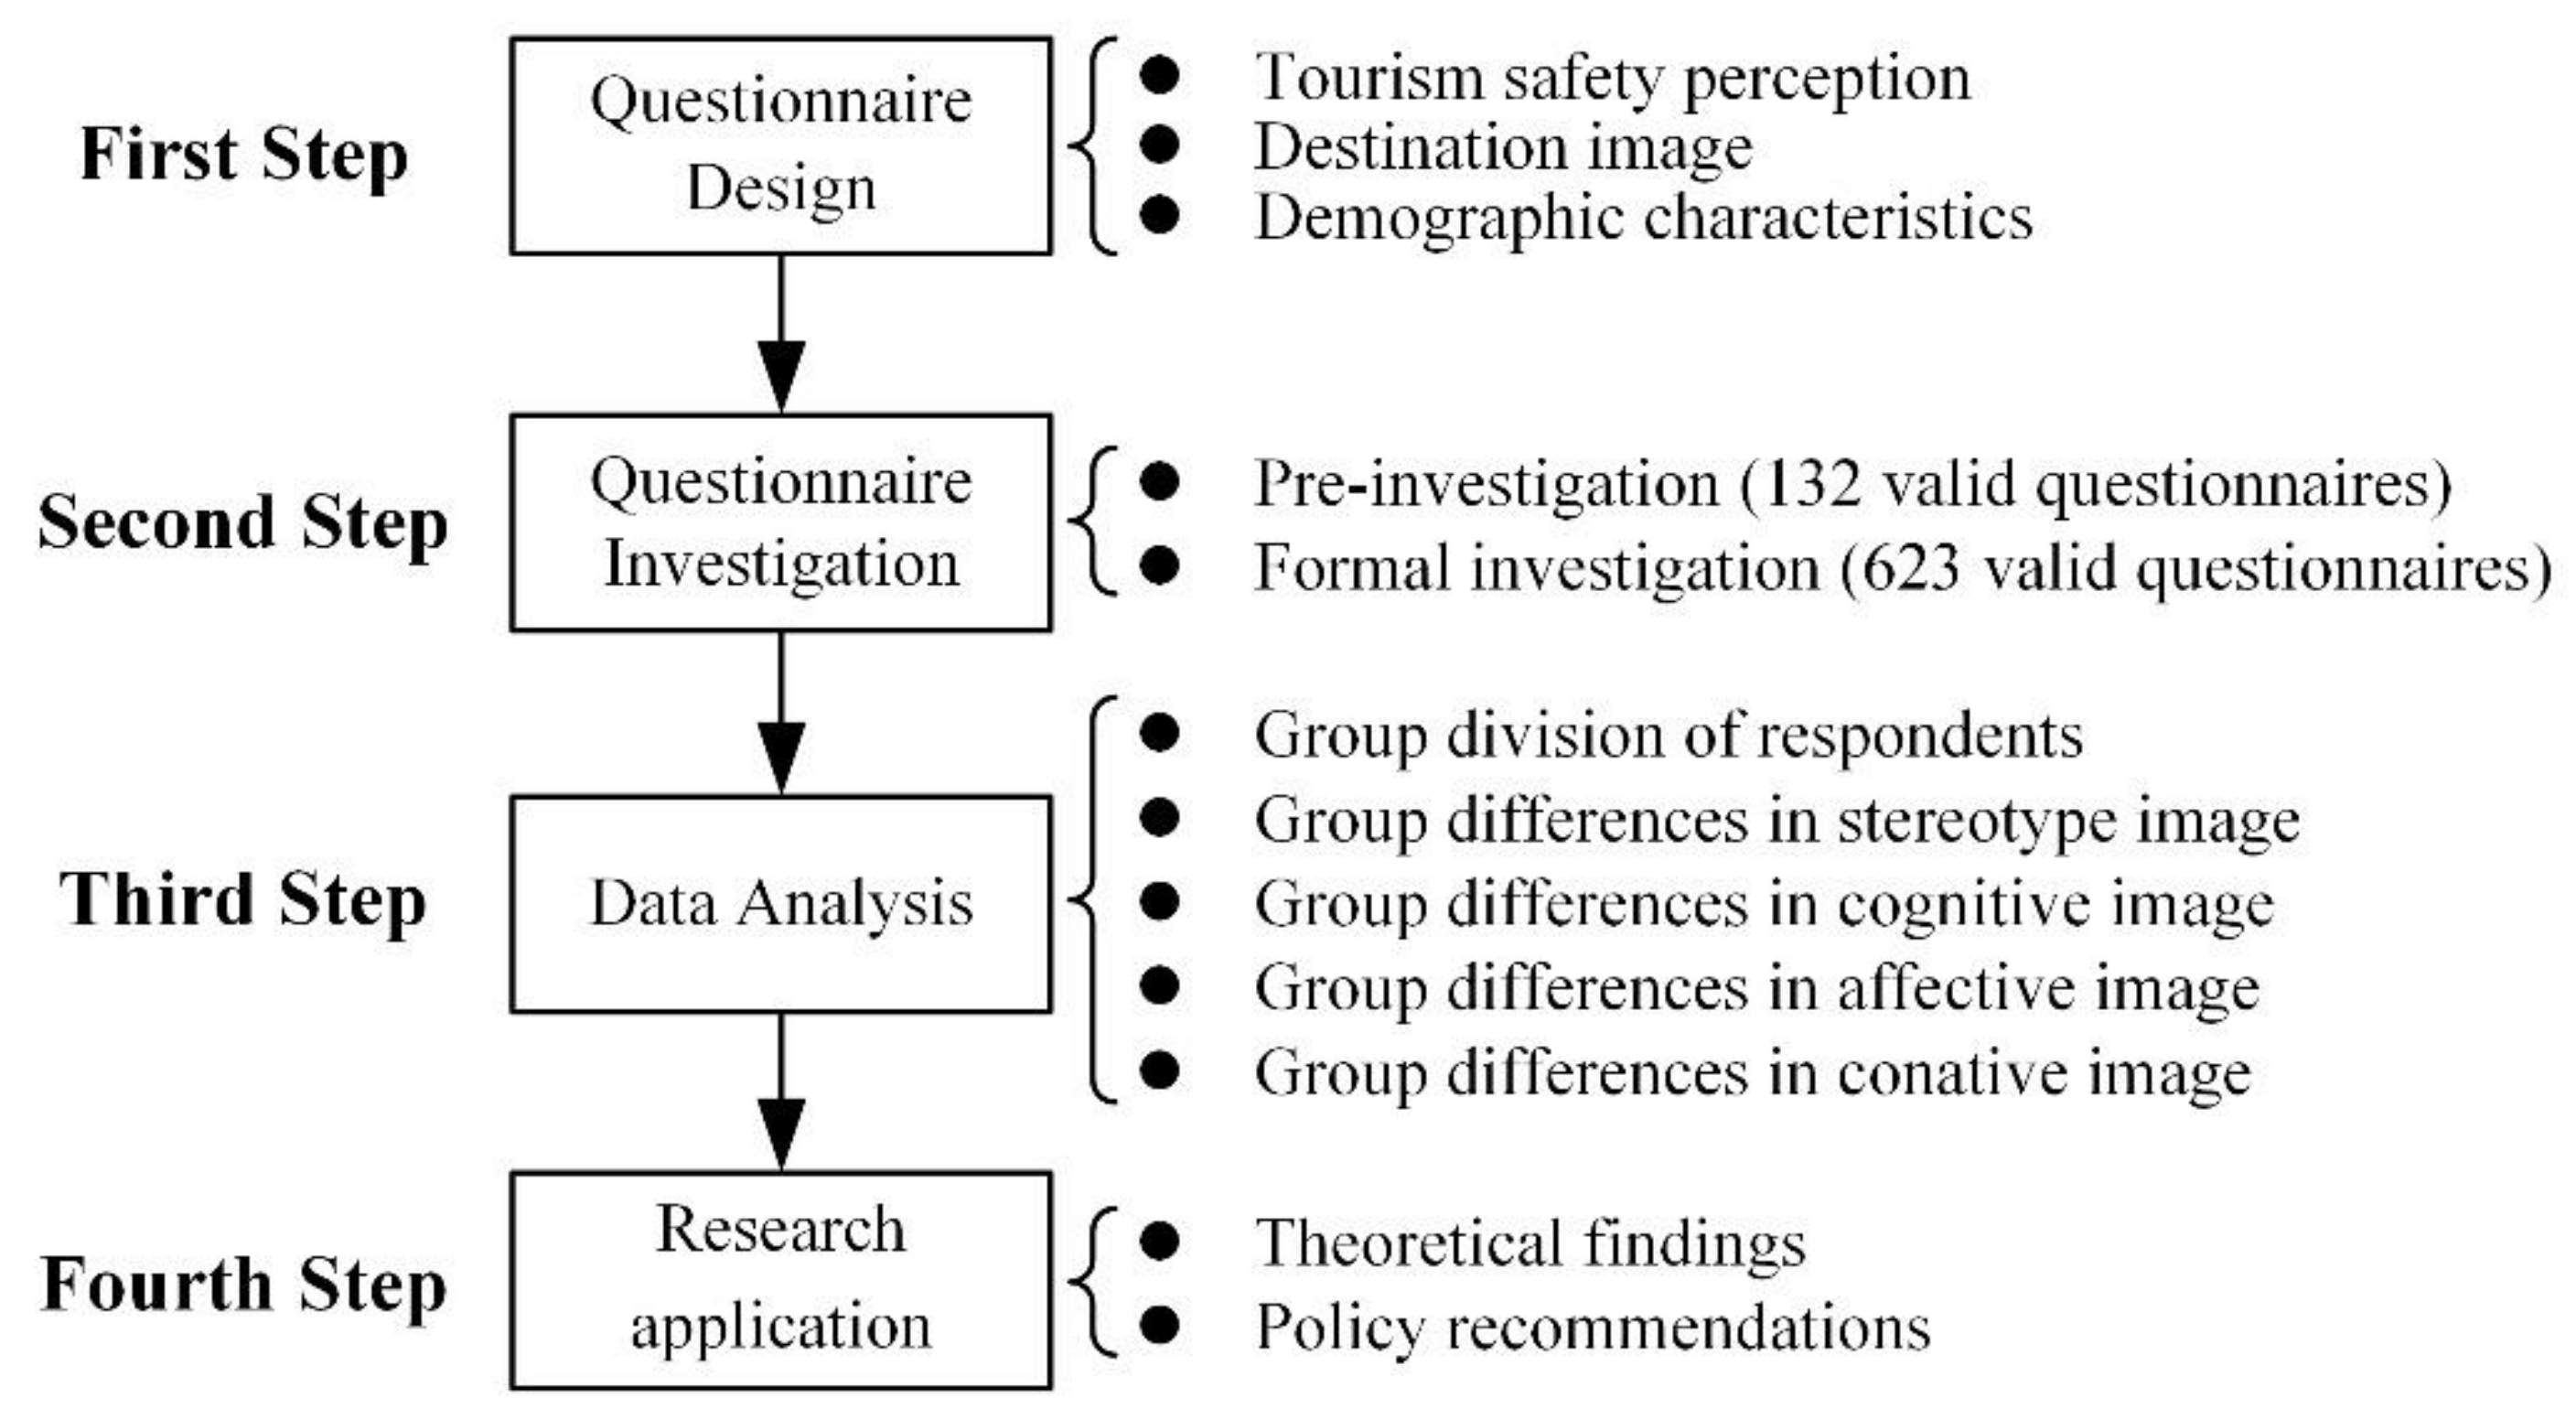
3.2. Research Steps and Data Sources

The study included 4 steps:
The first step was questionnaire design. The questionnaire was composed of three sections. The first section was the tourism safety perception measurement scale. For the measurement questions, reference was made to the research results of Wang et al. [17], Zou et al. [47], Qiao [48], and Rittichainuwat et al. [18], with appropriate adjustments and revisions based on the actual conditions in Xinjiang. There were a total of 22 questions. It was scored on 5-point Likert scale, with 1 representing “very worried” and 5 representing “not worried at all”. A higher score indicated a higher perception of safety. The second section was the measurement of destination image, to measure the image of the destination from 4 dimensions: stereotype image, cognitive image, affective image, and conative image. The stereotype image was measured by Echtner and Ritchie’s open-ended classic question, “What images or characteristics come to mind when you think of ××× as a vacation destination?” [32] (p. 3). The cognitive image measurement was designed with reference to the research results of Beerli et al. [36] and Wu et al. [49], with appropriate adjustments and revisions in accordance with the actual conditions in Xinjiang, containing a total of 44 questions; the affective image measurement questions were set based on 4 measurement factors proposed by Baloglu and Brinberg [8]; the conative image was measured by questions put forward by Chi and Qu [50]; the third section presents the demographic characteristics of the respondents, including gender, age, education, occupation, and monthly income.
The second step was questionnaire investigation. The investigators were composed of five trained graduate students, and the respondents were tourists traveling in Xinjiang. The questionnaire survey was conducted by random interception and convenient sampling. Questionnaires were distributed on site and filled in by tourists themselves. The investigation was conducted in two stages. In the first stage of pre-investigation, 150 questionnaires were distributed in Urumqi, Xinjiang in June 2019, and 132 were effectively received, with effective recovery of 88%. Pre-investigation aims to analyze the reliability and validity of the variables measured in the questionnaire, and make modifications and adjustments to the questions according to the analysis results. The second stage of formal investigation was conducted in August 2019 at railway stations, airports, and representative tourist attractions in Urumqi, Turpan, Ili Kazakh Autonomous Prefecture, and Kashgar. To ensure the samples were representative, the sample size was adjusted with reference to the proportion of tourists in the four regions in previous years, with 250 questionnaires distributed in Urumqi, 100 in Turpan, 230 in Ili, and 100 in Kashgar. A total of 680 questionnaires were distributed and 623 were effectively received, with effective recovery of 91.62%. Of the respondents, 60.77% were men compared with 39.23% women; young and middle-aged people aged 18–45 were the main group, accounting for 80.04%; those with bachelor’s degree or college education or above accounted for 78.29%; the income levels were evenly distributed, and all occupations were involved, with good representativeness. The sample characteristics are shown in Table 1.
The third step was data analysis. This paper first classifies travel safety perception groups of respondents based on clustering analysis, and then investigates whether there were differences in stereotype, cognitive, affective and conative images of destinations for different safety perception groups based on content analysis, diversity index, one-way ANOVA, and factor analysis, and further explores whether there was an influence of tourism safety perception on different dimensions of destination image.
The fourth step was research application. This section discusses the research findings and theoretical value of this paper, and proposes policy recommendations for destination safety management and destination image building (Figure 3).

3.3. Research Methods

3.3.1. Content Analysis

Content analysis is a research method used to classify texts or objects into predetermined classes for the purpose of comparing the basic composition of texts or research objects [51]. In tourism research, content analysis is a research method to provide an objective, quantitative, and systematic description of explicit content for measuring variables [52]. In this paper, we use ROSTCM content mining software to perform phrase segmentation and phrase frequency statistics on stereotype image phrases in stereotype image phrase documents, and then study the influence of tourism safety perception on stereotype image.

3.3.2. Diversity Index

The diversity index is used to quantify the degree of species diversity within a life community in ecology, and used to determine changes in life community structure or ecosystem stability [53,54,55]. This paper quantifies the degree of diversity of stereotype image phrases of different groups based on the indexes of richness, diversity, evenness, and dominance in ecology.
The richness index shows the number of image phrases in the group to reflect the richness of the phrases, and a larger value indicates a higher level of richness. In this paper, it is expressed by the Menhinick index, and the equation is as follows:
S M n = S / N
The diversity index shows the total number of phrases in the group and the proportion of each phrase to the total, and a higher value indicates a higher degree of diversity. It is expressed in this paper by the Shannon–Wiener index, and the equation is as follows:
H = i = 1 S P i l n P i
The evenness index shows the distribution of all phrases in the group, reflecting the uniformity of different phrases in phrases of number, and a larger value indicates a higher degree of evenness. It is expressed by the Pielou index in this paper, and the equation is as follows:
E = i = 1 S P i l n P i l n S
The dominance index shows the degree of concentration or dominance of one or several phrases in the group, and a larger value indicates a higher degree of dominance. It is expressed in this paper by the Simpson index, and the equation is as follows:
D = i = 1 S P i 2
In the above equations, S represents the number of non-repeating phrases, N represents the sum of all phrases, Pi represents the proportion of the i-th image phrase in the total phrases, SMn represents the Menhinick richness index, H represents the Shannon–Wiener diversity index, E represents the Pielou evenness index, and D represents the Simpson dominance index.

3.3.3. One-Way ANOVA

One-way ANOVA is used to test whether there are significant differences between the mean values of three or more groups of samples on a certain variable. This paper tests whether there are statistically significant differences in the factors of cognitive image, affective image, and conative image of different safety perception groups respectively based on one-way ANOVA.

3.3.4. Factor Analysis

In this paper, SPSS 21.0 is used in the exploratory factor analysis of the destination cognitive image questions. First, the reliability of the cognitive image scale is tested using Cronbach’s α; second, the feasibility of factor analysis is tested using KMO values and Bartlett’s sphericity test; third, the principal component extraction method and the maximum variance rotation method are used to extract the common factors, and the common factors are named according to the questions explained by each common factor to determine the dimensions of cognitive image.

4. Results

4.1. Classification of Tourism Safety Perception Groups

Based on the respondents’ scores on 22 factors of tourism safety perception, fast clustering was performed by means of SPSS 21.0 software K-Means Cluster. After many trials, it was found appropriate to classify the respondents into three types, and the final clustering centers are shown in Table 2.
As shown in Table 2, cluster “1” has the highest factor score and it can be named as high safety perception group, cluster “3” has the lowest factor score and it can be named as low safety perception group, cluster “2” has a factor score in between the first two and it can be named as a medium safety perception group. There were 213 people in the group with high safety perception, 273 in the group with medium safety perception, and 137 in the group with low safety perception. Respondents in general scored tourism safety perception in Xinjiang highly, with all 22 factors in the high and medium safety perception groups above the median value 3, and 4 factors in the low safety perception groups above the median value 3.
Table 2 also shows that the 3 factors with the lowest scores for the high safety perception group were “language barriers”, “accommodation hygiene”, and “cab service”; the 3 factors with the lowest scores for the medium safety perception group were “defrauding tourists”, “language barriers”, and “accommodation hygiene”; and the 3 factors with the lowest scores for the low safety perception group were “defrauding tourists”, “tourism complaints”, and “cab service”. The 3 factors with the lowest scores for each of the three groups were all in connection with tourism services, while the factors related to social security such as “violent and terrorist events”, “theft and robbery”, “pornography”, “gambling and drugs”, “going out at 11:00”, and “police presence” were not the lowest, in contrast to some previous studies that have shown that potential tourists’ concerns about safety in Xinjiang are mainly focused on social security [56].

4.2. Influence of Safety Perception on Stereotype Image

4.2.1. Content Differences in Image Phrases between Different Safety Perception Groups

According to statistics, there were 283 non-repeating stereotype image phrases in all samples, with a total of 1570 appearances. There were 150 stereotype image phrases in the high safety perception group with a total of 485 appearances, 170 stereotype image phrases in the medium safety perception group with a total of 676 appearances, and 110 stereotype image phrases in the low safety perception group with a total of 409 appearances. There were 54 repeating phrases in the three groups’ stereotype image phrases, and the cumulative phrase frequencies in the three groups were 74.64%, 78.55%, and 82.88%, respectively, indicating a high consistency in the three groups’ stereotype images of Xinjiang.
To further compare the differences in the content of stereotype image phrases between the three groups, we counted the top 20 stereotype image phrases in the three groups (Table 3). The cumulative frequency of the top 20 phrases in the three groups was 54.02%, 57.99%, and 62.35%, respectively, so we used them as the core phrases of stereotype image for further analysis.
Table 3 shows that there were 14 repeating phrases in the core phrases of the stereotype images of the three groups, which were “beautiful”, “large”, “gourmet food”, “deserts”, “far away”, “mutton kebabs”, “vast”, “Tianshan Tianchi”, “grapes”, “grasslands”, “Hami melon”, “beautiful girls”, “mutton”, “vast size and resources”. In the repeating phrases, there were phrases regarding general characteristic such as “beautiful”, “greatness”, “far away”, “vast”, “vast size and resources”, phrases regarding food such as “gourmet food”, “mutton kebabs”, “grapes”, “Hami melon”, and “mutton”, and phrases regarding natural landscape such as “deserts”, “Tianshan Tianchi”, and “grasslands”, fully reflecting the attributes of Xinjiang and the characteristics of its image as a tourist destination.
The core phrases in the three groups’ stereotype images were, on the whole, dominated by concrete things such as “mutton kebabs”, “grapes and fruits” representing food, as well as “deserts”, “grasslands”, and “Tianshan Tianchi” representing natural landscapes. The core phrases also contained some positive ones such as “beautiful”, “gourmet food”, and “beautiful girls”. The only negative phrase, “violent terrorist events”, in the core phrases came from the low safety perception group, while the other two groups had no negative phrases. It shows once again that the three groups had high consistency in their stereotype image of Xinjiang. The influence of safety perception on stereotype image is limited by the content of core phrases.

4.2.2. Affection Differences in Image Phrases between Different Safety Perception Groups

The stereotype image phrases in the three groups were coded and classified by affection bias (positive or negative). For example, “beautiful”, “gourmet food”, “beautiful girls”, “beautiful scenery”, “hospitality”, “safety and yearning” are coded as positive phrases; “desolation”, “violent terrorist events”, “backwardness”, “unsafety”, “social chaos”, and “fear” were coded as negative phrases. Other phrases without affection bias such as “large”, “deserts”, “mutton kebabs”, “vast”, “Tianshan Tianchi”, “far away”, and “ethnic minorities” were not used for affection analysis.
Table 4 shows that the high safety perception group had the highest cumulative frequency of positive phrases (22.68%), followed by the medium safety perception group, (17.16%) and the low safety perception group had the lowest (15.16%); the low safety perception group had the highest cumulative frequency of negative phrases (4.89%), followed by the medium safety perception group (2.07%), and the high safety perception group had the lowest (1.65%). It can be seen that the proportion of positive phrases increased as the safety perception rose, while the proportion of negative phrases decreased as the safety perception rose. Although the phrases with affection bias did not constitute a high proportion of the stereotype image phrases of each group, to some extent they reflect the differences in the stereotype images held by the three groups. High safety perception contributes to the formation of positive stereotype image, while low safety perception leads to a negative stereotype image. There is a certain influence of safety perception on stereotype image by the affection of image phrases.

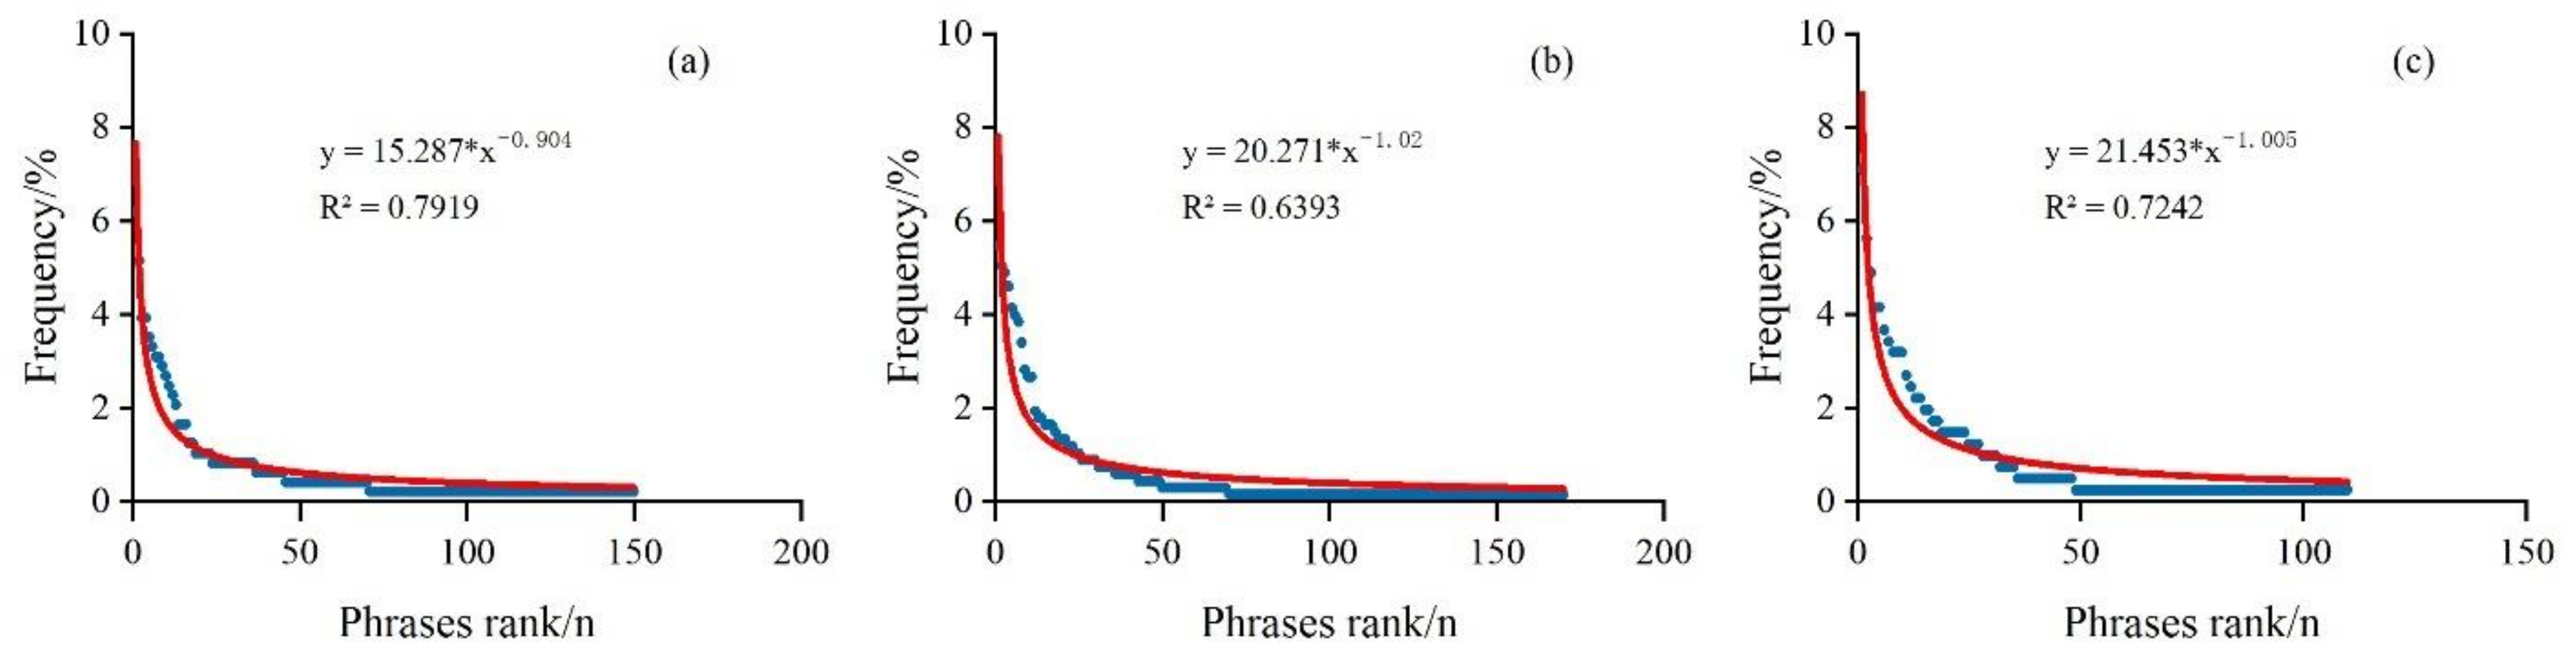
4.2.3. Image Phrase Frequency Distribution of Different Safety Perception Groups

The stereotype image phrases in the three groups were ranked according to phrase frequency, and curve fitting was performed for the phrase frequency distribution (Figure 4). In Figure 4, the X-axis represents stereotype image phrases (1 for the first ranked phrase, and n for the n-th ranked phrase) and the Y-axis represents the frequency corresponding to the stereotype image phrases.
Figure 4 shows that the distribution of all stereotype image phrases in the three groups conforms to the power-law decay law (y = axk), and accords with the 80–20 rule and the long tail phenomenon of destination image phrases distribution proposed by Pan et al. [57]. The cumulative frequencies of the top 20% phrases in the three groups were 62.89%, 71.15%, and 65.28%, all lower than 80%, indicating that the head phrases regarding stereotype image are not very concentrated, especially in the high safety perception group. Tourists’ perception of Xinjiang’s tourism image is similar to that of most destinations, with a tendency to stereotype and fragmentation.
According to the principle that a smaller k value in the power law function indicates a faster decay of the fitted curve, the medium safety perception group has the fastest decay of stereotype image phrase frequency, followed by the low safety perception group, and the high safety perception group has the lowest. The differences in k-values between the medium and low safety perception groups are small, and their phrase frequency decay rates are extremely close. Faster decay of phrase frequency indicates that stereotype image phrases are more concentrated in the group. From the perspective of image phrase frequency distribution, groups with low safety perception have a more concentrated distribution of stereotype image phrases than those with high safety perception, indicating that there is a certain influence of safety perception on stereotype image.

4.2.4. Diversity Differences in Image Phrases between Different Safety Perception Groups

The richness index, diversity index, evenness index, and dominance index of stereotype image phrases were calculated respectively according to the diversity index calculation equation (Table 5). According to the calculation results, the richness index is the highest in the high safety perception group (6.811), followed by the medium safety perception group (6.538), and the lowest in the low safety perception group (5.439). The richness indexes of high and medium safety perception groups are close to each other, while there is a great difference between medium and low safety perception groups. The diversity index is the highest in the high safety perception group (4.412), followed by the medium safety perception group (4.337), and the lowest in the low safety perception group (4.084). The diversity indexes of high and medium safety perception groups are close, while there is a great difference between medium and low safety perception groups. The evenness index is the highest in the group with high safety perception (0.881), followed by the group with low safety perception (0.869), and the lowest in the group with medium safety perception (0.844). Numerically, the evenness index values of the three groups are close, with a difference of less than 5%; the dominance index value is the highest in the low safety perception group (0.026), followed by the medium safety perception group (0.023), and the lowest in the high safety perception group (0.021).
Overall, the high safety perception group has higher richness and diversity of stereotype image phrases and lower dominance, while the low safety perception group has lower richness and diversity of stereotype image phrases and higher dominance. In other words, tourists with higher safety perception have richer and more comprehensive perceptions of stereotype images of destinations and a lower concentration of the stereotype image. In contrast, tourists with lower safety perception have a more homogeneous cognition of the stereotype image of the destination and a higher concentration of the stereotype image. There is a certain influence of safety perception on stereotype image by diversity in image phrases.

4.3. Influence of Safety Perception on Cognitive Image

4.3.1. Influence of Safety Perception on Cognitive Image Factors

To examine whether there were differences between cognitive image factors in statistical significance, a one-way ANOVA was conducted on the cognitive image factors in different safety perception groups. Table 6 shows that among the 44 cognitive image factors, five factors of “Xinjiang is very large”, “mystery”, “dry climate”, “great temperature difference”, and “many deserts” had no significant difference (Sig. > 0.05), while the remaining 39 differed significantly (Sig. < 0.05).
Multiple comparisons showed that the mean values of 15 factors of “convenient transportation”, “ecological environment”, “city modernization”, “hotel accommodation”, “tourist center”, “many grasslands”, “beautiful Kanas”, “hotel service”, “dutiful tour guide”, “Xinjiang cuisine”, “social security”, “hospitable locals”, “honest ethnic minorities”, “tourist souvenirs”, and “rich gourmet food” are significantly different from each other, and are higher in the high safety perception group than in the medium safety perception group, and higher in the medium safety perception group than in the low safety perception group. The mean values of 21 factors of “many mountains and lakes”, “local culture”, “long history”, “many airports”, “architectural features”, “cab service”, “special tourist routes”, “numerous attractions”, “attractive scenery”, “natural scenery”, “Yili scenery”, “Dokku Highway”, “suitable for self-drive”, “ancient Silk Road”, “cheap accommodation”, “diverse ethnic minorities”, “Islamic culture”, “mutton with special features”, “hometown of melons and fruits”, “hometown of songs and dances”, “rich night life” are significantly different between the high and medium safety perception groups, and the former is higher than the latter. There is also a significant difference between the high and low safety perception groups, and the former is higher than the latter, with no significant difference in the remaining group. The mean values of two factors of “glacier and snow mountains” and “Tianshan Tianchi” are significantly different between the high and low safety perception groups, and the former is higher than the latter, with no significant difference between the remaining two groups. The mean value of 1 factor of “Xinjiang is far away” is significantly different between the high and low safety perception groups, and the former is lower than the latter, with no significant difference between the remaining two groups. Therefore, there is a significant influence of safety perception on the cognitive image factor.

4.3.2. Influence of Safety Perception on the Cognitive Image Dimension

A Cronbach’s α test of 44 questions on the cognitive image scale yielded a result of 0.939, and it indicates good consistency and high reliability of the questionnaire. The KMO sampling measure and Bartlett’s sphericity test were performed next on the 44 questions, and the results show the KMO value is 0.933, greater than 0.800; the Bartlett’s sphericity test value is 10,944.888, significant at the level of 0.000, indicating that the 44 questions are strongly correlated and they are suitable for factor analysis.
In the analysis, items that met one of the following criteria were removed: (1) factors with commonality values less than 0.5, (2) factors with loadings less than 0.4 after factor rotation, and (3) factors with cross-loadings, i.e., loadings greater than 0.4 on both factors at the same time [58]. To improve the factor analysis, unqualified variables were eliminated and the scale was finally retained with 24 measures. The 24 cognitive image factors were again tested and analyzed, and the results show that the Cronbach’s α value is 0.906, the KMO value is 0.915, and the Bartlett’s sphericity test value is 5614.290, significant at the level of 0.000. Five cognitive image dimensions were extracted based on the destination attributes, and they are named as “service facilities”, “tourist attractions”, “local cuisine”, “local culture”, and “climate environment” (Table 7). The cumulative contribution of the five dimensions is 60.061%, higher than the extraction threshold of 60% [59].
Table 8 shows that the dimension of “local culture” rated the highest, followed by “local cuisine”, “tourist attractions”, and “climate environment”, while the dimension of “service facility” rated the lowest in the three groups. The results of one-way ANOVA show that among the five dimensions of cognitive image for different safety perception groups, there are significant differences in four, that is, “service facilities”, “tourist attractions”, “local cuisine”, and “local culture” (Sig. < 0.05), but there is no significant difference in “climate environment” (Sig. > 0.05). According to the mean value and F value in Table 8, the most significantly different cognitive image dimension is “service facilities”, followed by “tourist attractions”, “local cuisine”, and “local culture”.
The multiple comparisons show that there is a significant difference in mean values of the three dimensions of “service facilities”, “tourist attractions”, and “local cuisine” between groups. The high safety perception group has a higher value than the medium safety perception group, and the medium safety perception group has a higher value than the low safety perception group. For the mean value in the “local culture” dimension, there is a significant difference between the high and medium safety perception groups, and the former is higher than the latter; there is also a significant difference between the high and low safety perception groups, and the former is higher than the latter, with no significant difference in the remaining group. Therefore, there is a significant influence of safety perception on the cognitive image dimension.

4.4. Influence of Safety Perception on Affective Image

To compare the differences in statistical significance of the affective image factors, a one-way ANOVA was done on the affective image factors of different safety perception groups. Table 9 shows that the four affective image factors of “pleasant”, “exciting”, “relaxing”, and “arousing” are significantly different (Sig. < 0.05). The image factor with the most significant difference, according to the mean values in Table 9, is “exciting”, followed by “relaxing”, “pleasing”, and “arousing”.
The multiple comparisons show that the mean values of the four affective image factors of “pleasant”, “exciting”, “relaxing”, and “arousing” are significantly different between groups, with a higher value in the high safety perception group than in the medium safety perception group, and a higher value in the medium safety perception group than in the low safety perception group. Therefore, there is a significant influence of safety perception on the affective image factor.

4.5. Influence of Safety Perception on Conative Image

To compare the differences in statistical significance of the conative image factors, a one-way ANOVA was performed on the conative image factors between different safety perception groups. Table 10 shows that there are significant differences in the four conative image factors of “whether satisfied”, “whether willing to revisit”, “whether to revisit”, and “whether to recommend” (Sig. < 0.05). According to the mean value and F value in Table 10, the image factor with the most significant difference is “whether willing to revisit”, “followed by whether to revisit”, “whether to recommend”, and “whether satisfied”.
Multiple comparisons show that there are significant differences in the mean values of the two conative image factors of “whether willing to revisit” and “whether to revisit” between groups, with the high safety perception group higher than the medium safety perception group, and the medium safety perception group higher than the low safety perception group. There is a significant difference in the mean value of the factor of “whether satisfied” between the high and low safety perception groups, and the former is lower than the latter, with no significant difference between the remaining two groups. There is a significant difference in the mean value of the factor of “whether to recommend” between the groups with high safety perception and low safety perception, and the former is higher than the latter; there is also a significant difference between the groups with medium safety perception and low safety perception, and the former is higher than the latter; there is no significant difference in the remaining group. Therefore, there is a significant influence of safety perception on the conative image factor.

5. Discussion

5.1. Theoretical Implications

According to the analysis of destination image of different safety perception groups, tourism safety perception significantly affects cognitive image, affective image, and conative image. The findings of this paper corroborate some viewpoints of previous studies. Yang and Xie found that tourism safety perception has a significant positive effect on affective image [15]. Li et al. found that tourism safety perception has a significant positive effect on tourist loyalty (willingness to revisit, willingness to recommend, and positive word-of-mouth advertising) [11]. Chew and Jahari also confirmed that tourism risk perception has a certain influence on cognitive image and affective image, but they found differences in the effect of different tourism risk perception dimensions on cognitive and affective images, i.e., that psychosocial and financial risks significantly affect cognitive and affective images, while physical risks have no significant impact on cognitive image and affective image [2].
Since the cognitive image scale is constructed on the basis of existing literature and previous interviews, it contains both the common parts and the individual characteristics of destination image. This study differs from previous ones in the five image dimensions of service facilities, tourist attractions, local cuisine, local culture, and climate environment extracted through factor analysis. Much has been discussed on the topics of service facilities, tourism attractions, local culture, and climate environment in the existing literature [36,49,60,61,62,63]. However, local cuisine, as a separate image dimension, is less involved [41], and it is also an image dimension specific to Xinjiang. Data from the 2018 China culture and tourism development statistical analysis report show that the top three attractions for tourists to Xinjiang are natural scenery (41.42%), humanities and folklore (24.80%), and Xinjiang cuisine (18.20%). It is evident that local cuisine is a major image dimension of Xinjiang and also one of its significant tourism attractions.
This study further reveals that safety perception has different influences on different dimensions and factors of destination image. Safety perception has a significant impact on the cognitive image in four dimensions of service facilities, tourist attractions, local cuisine, and local culture, with the greatest impact on service facilities in the image dimension, but no significant impact in the climate environment dimension. Safety perception has a significant impact on the four factors of affective image, with the greatest impact on the factor of “excited”. Safety perception has a significant impact on the four factors of conative image, with the greatest impact on the image factor of willingness to revisit. These research results can be a supplement to theoretical research, and also help managers to make effective policies by identifying the magnitude of influencing factors.
Another new finding of this paper is that there is a certain influence of tourism safety perception on the stereotype image of the destination, concretely shown as the consistency and variability of the stereotype image of different safety perception groups. When describing the stereotype image of Xinjiang, travelers first think of its vast size, or deserts, or local cuisine. These are representative of the long-established regional characteristics of Xinjiang, and the inherent impressions people hold of Xinjiang, showing a high consistency among different safety perception groups. Social psychologists believe that stereotype image offers an important cognitive function to simplify information processing and response generation [64,65]. Stereotype images have a high stability and are hard to change once they are cultivated [66,67]. Tourists’ stereotype images of the destination are formed over time, and when they are asked to describe the stereotype images, they tend to simplify the information processing based on destination-related information that can be easily extracted from their minds.
However, there were differences in the stereotype images of Xinjiang among different safety perception groups. The affection analysis of some phrases shows that the proportion of positive phrases went up with the increase of safety perception, while the proportion of negative phrases decreased with the increase of safety perception. The diversity analysis of stereotype image phrases reveals that the high safety perception group had higher stereotype image phrase richness and diversity and lower dominance, while the low safety perception group had lower stereotype image phrase richness and diversity and higher dominance.

5.2. Practical Implications

Although it was found in the survey that tourists have a high perception of safety in Xinjiang in actuality, some potential tourists still have some concerns about the tourism safety there. Given the influence of tourism safety perception on destination image, we put forward some suggestions for DMOs.
First, it was found in the study that there is an influence of tourism safety perception on destination image, which ultimately affects tourists’ satisfaction, willingness to revisit, and willingness to recommend. Therefore, DMOs should be oriented to improve tourist satisfaction and loyalty by regulating destination tourism safety perception factors, especially in phrases of tourism services with low safety perceptions. In destination advertising and marketing, it is important to conduct precise marketing based on tourism safety perception, pay more attention to tourists with lower safety perception, deliver timely and accurate tourism information, and improve their awareness of the destination safety.
Second, it was also found in the investigation that most tourists have a higher safety perception and a more positive image perception after their visit to Xinjiang. Indeed, Xinjiang provides tourists with a good sense of safety and tourism experience, and at the same time prevents the psychological gap caused by the high image positioning [68]. DMOs should focus on destination image promotion to improve tourists’ perception of safety and image of Xinjiang and convert more prospects into actual tourists. It is also important to create a better reputation for the destination through proper tourism evaluation and feedback work by tourists to identify and improve on problems in a timely manner.
Third, tourism is vulnerable and sensitive to a certain extent and it is vulnerable to natural disasters, accidents, public health, social security issues, and other safety events [2]. A safety incident in a destination is enough to hit hard the elaborate tourism image and tourism brand that has been built for years. Therefore, DMOs should “nip in the bud” these issues in the construction of destination image, and invest more efforts to monitor and manage aspects of tourism that are prone to problems. For destinations affected by tourism safety incidents, crisis management should be incorporated into the destination management system and marketing strategy [69]. The construction of destination image is a long-term project, and DMOs should devote themselves to the creation and improvement of destination image, regardless of any negative events in the destination.

6. Conclusions

This paper investigated the impact of tourism safety perception on multiple dimensions of destination image. First, it found tourism safety perception significantly affects the cognitive image, affective image, and conative image of the destination. Tourists with a high safety perception evaluate and affectively experience destination attributes more positively with higher satisfaction and stronger willingness to revisit and recommend. Second, the perception of tourism safety affects stereotype image of the destination to a certain extent. Tourists in general produce a broadly homogeneous stereotype image, but there are differences in diversity and emotions. Tourists with a high safety perception have a richer and more positive stereotype image.
Theoretically, this study explores the impact of tourism safety perceptions on destination image based on unstructured and structured measures as well as quantitative and qualitative methods, expanding the research methodology for the influence relation between the two. The influence of safety perception on the stereotype image dimension, which is absent in previous studies, is a theoretical contribution of this paper. The comparison of the multidimensional influence of tourism safety perception on destination image helps researchers to better grasp the formation pattern and influence mechanism of destination image. Practically, since Xinjiang as the study area is a land border province of China and a medium-scale tourism destination, the investigation and study of tourism safety perception and destination image there will not only provide a theoretical basis for the study area in tourism safety management and destination image construction, but also provide a policy reference for sustainable tourism development in the same type of destinations such as Tibet and Inner Mongolia in China and other countries.
However, there are some shortcomings and limitations in this study. For example, respondents were simply divided into three groups with high, medium, and low safety perception by K-means cluster, and only the impact of tourism safety perception as a whole on destination image in all dimensions was explored. In future research, we will reclassify respondents by different dimensions of safety perception based on other clustering methods, such as the hierarchical clustering method borrowed from Rudež et al. in their tourism market positioning study, where they subdivided tourists into groups according to different dimensions of tourism motivation [70,71]. By further exploring the influence of each dimension of tourism safety perception on destination image through subdivision of the dimension, we can deepen the study of the influence mechanism of tourism safety perception on destination image. This study also analyzed the impact of tourism safety perception on destination image from the perspective of domestic tourists only. Previous studies have proved that tourism safety perception and destination image vary across groups. Therefore, comparisons can be made from different perspectives, such as potential tourists, international tourists, local residents, and tour operators, to explore the similarities and differences in the mechanisms of the influence of tourism safety perception on destination image among different groups in subsequent study, to reach more scientific, accurate, and practical research conclusions.

Author Contributions

Conceptualization, G.D. and J.W.; methodology, G.D. and J.W.; software, G.D.; validation, G.D. and J.W.; formal analysis, G.D.; investigation, G.D.; resources, G.D.; data curation, G.D.; writing—original draft preparation, G.D.; writing—review and editing, G.D. and J.W.; visualization, G.D.; supervision, J.W.; project administration, J.W.; funding acquisition, J.W. All authors have read and agreed to the published version of the manuscript.

Funding

This research was funded by the National Natural Science Foundation of China, grant number 41671135 and the Fundamental Research Funds for the Central Universities, grant number 2017TS113.

Institutional Review Board Statement

Not applicable.

Informed Consent Statement

Not applicable.

Data Availability Statement

Not applicable.

Conflicts of Interest

The authors declare no conflict of interest.

References

  1. Zheng, X.M.; Zou, Y.G.; Yin, J.; Pi, C.L. Tourism Security Research in the Last Decade in China: Review and Analysis. Tour. Hosp. Prospect. 2017, 1, 89–105. [Google Scholar] [CrossRef]
  2. Chew, E.; Jahari, S.A. Destination Image as a Mediator between Perceived Risks and Revisit Intention: A Case of Post-disaster Japan. Tour. Manag. 2014, 40, 382–393. [Google Scholar] [CrossRef]
  3. Song, H.; Livat, F.; Ye, S. Effects of terrorist attacks on tourist flows to France: Is wine tourism a substitute for urban tourism? J. Destin. Mark. Manag. 2019, 14, 100385. [Google Scholar] [CrossRef]
  4. Yang, Q.Q.; Xie, C.W. The Effect of Interaction between Tourists’ Micro-Macro Safety Perceptions and Micro-macro Travelling Intentions under the Background of Terrorist Attacks. Tour. Trib. 2018, 33, 68–78. [Google Scholar] [CrossRef]
  5. Taecharungroj, V.; Mathayomchan, B. Analysing TripAdvisor Reviews of Tourist Attractions in Phuket, Thailand. J. Tour. Manag. 2019, 75, 550–568. [Google Scholar] [CrossRef]
  6. Wan, H.L.; Zhang, M.; Song, H.L.; Shi, W.J. Review on Domestic Tourist Safety Studies from 1990 to 2016. Econ. Geogr. 2018, 38, 213–219. [Google Scholar] [CrossRef]
  7. George, R. Tourist’s Perceptions of Safety and Security while Visiting Cape Town. Tour. Manag. 2003, 24, 575–585. [Google Scholar] [CrossRef]
  8. Baloglu, S.; Brinberg, D. Affective Images of Tourism Destinations. J. Travel Res. 1997, 35, 11–15. [Google Scholar] [CrossRef]
  9. Chon, K.S. The Role of Destination Image in Tourism: An Extension. Tour. Rev. 1992, 47, 2–8. [Google Scholar] [CrossRef]
  10. Roehl, W.S.; Fesenmaier, D.R. Risk Perceptions and Pleasure Travel: An Exploratory Analysis. J. Travel Res. 1992, 30, 17–26. [Google Scholar] [CrossRef]
  11. Li, Y.T.; Huang, Q.; Zhang, J.C. Mechanisms of Negative Public Opinion on Tourist Loyalty as Mediated by Tourist Safety Perceptions and Destination Image. Tour. Trib. 2019, 34, 105–116. [Google Scholar] [CrossRef]
  12. Wang, J.J. Study on the Effect of Perception of Tourism Safety on the Intention of Travelling to Taiwan—Taking Residents in Fujian Province for Example. Master’ Thesis, Huaqiao University, Quanzhou, China, 2012. [Google Scholar]
  13. He, Y.M.; Zou, Y.G.; Mo, Y.Q. Safety Perception of Chinese Outbound Tourists in Malaysia—Based on Web Text Analysis. World Reg. Stud. 2019, 28, 200–210. [Google Scholar] [CrossRef]
  14. George, R.; George, R. Visitor Perceptions of Crime-Safety and Attitudes towards Risk: The Case of Table Mountain National Park, Cape Town. Tour. Manag. 2010, 31, 806–815. [Google Scholar] [CrossRef]
  15. Yang, Q.Q.; Xie, C.W. The Mechanism of Tourism Safety Perception in Conflict Situation: The Antecedent Influence of Hospitality and the Moderating Effect of Tourism Experience. Naikai Bus. Rev. 2019, 22, 148–158. [Google Scholar]
  16. Chen, N.; Qiao, G.H.; Liu, L. A Study on the Preferred Travel Behaviors of Outbound Tourists based on Perception of Travel Risks—Case on Beijing Tourist. Hum. Geogr. 2009, 24, 97–102. [Google Scholar]
  17. Wang, J.J.; Zheng, X.M. Empirical Study on the Impact of Tourists’ Safety Perception to the Travel Intention of Urban Residents: A Case Study of Urban Residents in Representative Cities in China. J. Leshan Norm. Univ. 2015, 30, 61–68. [Google Scholar]
  18. Rittichainuwat, B.N.; Chakraborty, G. Perceived Travel Risks Regarding Terrorism and Disease: The case of Thailand. Tour. Manag. 2009, 30, 410–418. [Google Scholar] [CrossRef]
  19. Xie, C.; Huang, Q.; Lin, Z.; Chen, Y.Y. Destination Risk Perception, Image and Satisfaction: The Moderating Effects of Public Opinion Climate of Risk. J. Hosp. Tour. Manag. 2020, 44, 122–130. [Google Scholar] [CrossRef]
  20. Zou, Y.G. Study on Tourism Safety and Security Assessment in Tourism Destination. Ph.D. Thesis, Huaqiao University, Quanzhou, China, 2015. [Google Scholar]
  21. Sönmez, S.F.; Graefe, A.R. Determining Future Travel Behavior from Past Travel Experience and Perceptions of Risk and Safety. J. Travel Res. 1998, 37, 171–177. [Google Scholar] [CrossRef]
  22. Sönmez, S.F.; Graefe, A.R. Influence of Terrorism Risk on Foreign Tourism Decisions. Ann. Tour. Res. 1998, 25, 112–144. [Google Scholar] [CrossRef] [Green Version]
  23. Pizam, A.; Mansfeld, Y. Towards a Theory of Tourism Security. In Tourism, Security and Safety: From Theory to Practice; Mansfeld, Y., Pizam, A., Eds.; Butterworth-Heinemann, Elsevier: Oxford, UK, 2006; pp. 1–27. [Google Scholar]
  24. Barker, M.; Page, S.J.; Meyer, D. Urban Visitor Perceptions of Safety during a Special Event. J. Travel Res. 2003, 41, 355–361. [Google Scholar] [CrossRef]
  25. Crompton, J.L. An Assessment of the Image of Mexico as a Vacation Destination and the Influence of Geographical Location Upon That Image. J. Travel Res. 1979, 17, 18–23. [Google Scholar] [CrossRef]
  26. Baloglu, S.; Mccleary, K.W. A Model of Destination Image Formation. Ann. Tour. Res. 1999, 26, 868–897. [Google Scholar] [CrossRef]
  27. Pike, S.; Ryan, C. Destination Positioning Analysis through a Comparison of Cognitive, Affective, and Conative Perceptions. J. Travel Res. 2004, 42, 5–16. [Google Scholar] [CrossRef] [Green Version]
  28. Tasci, A.; Gartner, W.C.; Cavusgil, S.T. Conceptualization and Operationalization of Destination Image. J. Hosp. Tour. Res. 2007, 31, 194–223. [Google Scholar] [CrossRef]
  29. Bigné, E.; Sánchez, I.; Sanz, S. The Functional-psychological Continuum in the Cognitive Image of a Destination: A Confirmatory Analysis. Tour. Manag. 2009, 30, 715–723. [Google Scholar] [CrossRef]
  30. Baker, D.; Crompton, J. Quality, Satisfaction and Behavioral Intentions. Ann. Tour. Res. 2000, 27, 785–804. [Google Scholar] [CrossRef]
  31. Echtner, C.M.; Ritchie, J.R.B. The Meaning and Measurement of Destination Image. J. Tour. Stud. 1991, 2, 2–12. [Google Scholar]
  32. Echtner, C.M.; Ritchie, J.R.B. The Measurement of Destination Image: An Empirical Assessment. J. Travel Res. 1993, 31, 3–13. [Google Scholar] [CrossRef]
  33. Hilton, J.L.; Hippel, W.V. Stereotypes. Annu. Rev. Psychol. 1996, 47, 237–271. [Google Scholar] [CrossRef]
  34. Judd, C.; Park, B. Definition and Assessment of Accuracy in Social Stereotypes. Psychol. Rev. 1993, 100, 109–128. [Google Scholar] [CrossRef] [PubMed]
  35. Martin, H.S.; Bosque, I.R.D. Exploring the Cognitive-affective Nature of Destination Image and the Role of Psychological Factors in Its Formation. Tour. Manag. 2008, 29, 263–277. [Google Scholar] [CrossRef]
  36. Beerli, A.; Martín, J.D. Factors Influencing Destination Image. Ann. Tour. Res. 2004, 31, 657–681. [Google Scholar] [CrossRef]
  37. Wang, C.Y.; Huang, F.C. A Study on Factors Influencing Tourism Destination Image based on SEM: A Case Study of Zhangjiajie. Econ. Manag. 2010, 32, 92–100. [Google Scholar] [CrossRef]
  38. Milman, A.; Pizam, A. The Role of Awareness and Familiarity with a Destination: The Central Florida Case. J. Travel Res. 1995, 33, 21–27. [Google Scholar] [CrossRef]
  39. Ma, M. A Research on the Effects of Familiarity Index on Tourism Destination Image: A Case Study of Mount Taishan. Tour. Sci. 2011, 25, 30–38. [Google Scholar] [CrossRef]
  40. Phelps, A. Holiday Destination Image—The Problem of Assessment. Tour. Manag. 1986, 7, 168–180. [Google Scholar] [CrossRef]
  41. Wang, A.M.; Wu, J.F.; Wang, J.Y. Influence of Nonspecific Destination Vacation Experience on Tourism Destination Image. Tour. Trib. 2018, 33, 79–90. [Google Scholar] [CrossRef]
  42. Hunt, J.D. Image as a Factor in Tourism Development. J. Travel Res. 1975, 13, 1–7. [Google Scholar] [CrossRef]
  43. Scott, D.R.; Schewe, C.D.; Frederick, D.G. A Multi-Brand/Multi-Attribute Model of Tourist State Choice. J. Travel Res. 1978, 17, 23–29. [Google Scholar] [CrossRef]
  44. Xu, F.; Li, S.S. Destination Image of Southern Sinkiang and Tourist Intention: Mediating Effects of Perceived Value and Psychological Distance. Econ. Manag. 2018, 40, 156–171. [Google Scholar] [CrossRef]
  45. Lepp, A.; Gibson, H.; Lane, C. Image and Perceived risk: A Study of Uganda and Its Official Tourism Website. Tour. Manag. 2011, 32, 675–684. [Google Scholar] [CrossRef]
  46. Lehto, X.; Douglas, A.C.; Park, J. Mediating the Effects of Natural Disasters on Travel Intention. J. Travel Tour. Mark. 2008, 23, 29–43. [Google Scholar] [CrossRef]
  47. Zou, Y.G.; Zheng, X.M. Safety Evaluation Model and Empirical Study of Tourist Attractions. Chin. J. Saf. Sci. 2011, 21, 156–162. [Google Scholar] [CrossRef]
  48. Qiao, X.Y. Empirical Study on the Influencing Factors of Female Tourists’ Safety Perception: A Case Study of Tianjin Female Tourists. Bus. Manag. 2018, 12, 139–143. [Google Scholar] [CrossRef]
  49. Wu, J.F.; Wang, A.M.; Wang, J.Y. Exploring Destination Image Differences among Locals, Tourists and Prospective Tourists. Econ. Manag. 2017, 39, 130–145. [Google Scholar] [CrossRef]
  50. Chi, G.Q.; Qu, H. Examining the Structural Relationships of Destination Image, Tourist Satisfaction and Destination Loyalty: An Integrated Approach. Tour. Manag. 2008, 29, 624–636. [Google Scholar] [CrossRef]
  51. Shelley, M. Content Analysis: An Introduction to Methodology. by Klaus Krippendorff. J. Am. Stat. Assoc. 1984, 79, 240. [Google Scholar] [CrossRef] [Green Version]
  52. Wang, J.Y.; Wu, J.F.; Wang, A.M. Research on the Connective Relationship between Destination Unique Image and Stereotype Image: A Case Study of Hangzhou. Tour. Trib. 2019, 34, 58–72. [Google Scholar] [CrossRef]
  53. Magurran, A.E. Ecological Diversity and Its Measurement; Princeton University Press: Princeton, NJ, USA, 1988. [Google Scholar]
  54. Tuomisto, H. Defining, Measuring, and Partitioning Species Diversity. In Reference Module in Life Sciences; Elsevier: Amsterdam, The Netherlands, 2017. [Google Scholar] [CrossRef]
  55. Roswell, M.; Dushoff, J.; Winfree, R. A Conceptual Guide to Measuring Species Diversity. Oikos 2021, 130, 321–338. [Google Scholar] [CrossRef]
  56. Zhao, W.J. A Probe into the Tourist Safety in Xinjiang. J. Xinjiang Educ. Inst. 2009, 25, 104–108. [Google Scholar]
  57. Pan, B.; Li, X. The Long Tail of Destination Image and Online Marketing. Ann. Tour. Res. 2011, 38, 132–152. [Google Scholar] [CrossRef]
  58. Pan, Y.; Gao, L.; Zhang, X.; Wan, Y. A Study on Consumers’ Concept of Value under China’s Cultural Background: The Development of the Measurement Table and Comparison. Manag. World 2014, 4, 90–106. [Google Scholar] [CrossRef]
  59. Chen, N. Tourism Statistics & Application of SPSS; China Social Sciences Press: Beijing, China, 2015. [Google Scholar]
  60. Fakeye, P.C.; Crompton, J.L. Image Differences between Prospective, First-Time, and Repeat Visitors to the Lower Rio Grande Valley. J. Travel Res. 1991, 30, 10–16. [Google Scholar] [CrossRef]
  61. Chen, P.J.; Hua, N.; Wang, Y. Mediating Perceived Travel Constraints: The Role of Destination Image. J. Travel Tour. Mark. 2013, 30, 201–221. [Google Scholar] [CrossRef]
  62. Stylos, N.; Vassiliadis, C.A.; Bellou, V.; Andronikidis, A. Destination images, holistic images and personal normative beliefs: Predictors of intention to revisit a destination. Tour. Manag. 2016, 53, 40–60. [Google Scholar] [CrossRef] [Green Version]
  63. Wang, C.Y.; Qu, H.L. Empirical Study on Relationships of Travel Motivation, Destination Image and Tourist Expectation. Tour. Trib. 2013, 28, 26–37. [Google Scholar] [CrossRef]
  64. Macrae, C.N.; Milne, A.B.; Bodenhausen, G.V. Stereotypes as Energy-saving Devices: A peek inside the Cognitive Toolbox. J. Personal. Soc. Psychol. 1994, 66, 37–47. [Google Scholar] [CrossRef]
  65. Chen, N.; Hsu, C.H.C. Tourist Stereotype Content: Dimensions and Accessibility. Ann. Tour. Res. 2021, 89, 103212. [Google Scholar] [CrossRef]
  66. Fedor, C.G. Stereotypes and Prejudice in the Perception of the “Other”. Procedia Soc. Behav. Sci. 2014, 149, 321–326. [Google Scholar] [CrossRef] [Green Version]
  67. Tung, V.W.S.; King, B.E.M.; Tse, S. The Tourist Stereotype Model: Positive and Negative Dimensions. J. Travel Res. 2020, 59, 37–51. [Google Scholar] [CrossRef]
  68. Song, S.N.; Chang, G.X. Research on Negative Image of Scenic Spots and Related Strategies based on Network Comments—A Case of Dalian Sunasia Ocean World. J. Cap. Norm. Univ. 2020, 41, 47–52+83. [Google Scholar] [CrossRef]
  69. Sönmez, S.F.; Apostolopoulos, Y.; Tarlow, P. Tourism in Crisis: Managing the Effects of Terrorism. J. Travel Res. 1999, 38, 13–18. [Google Scholar] [CrossRef] [Green Version]
  70. Rudež, H.N.; Sedmak, G.; Bojnec, S. Benefit Segmentation of Seaside Destination in the Phase of Market Repositioning: The Case of Portoroz. Int. J. Tour. Res. 2013, 15, 138–151. [Google Scholar] [CrossRef]
  71. Rudež, H.N.; Sedmak, G.; Vodeb, K.; Bojnec, Š. Visitor Structure as a Basis for Destination Repositioning-the Case of a North Mediterranean Destination. Annu. J. Hist. 2014, 24, 53–66. [Google Scholar]
Figure 1. Study area map.
Sustainability 14 01663 g001
Figure 2. Development of domestic tourism from 2009 to 2018 (a), and development of inbound tourism from 2009 to 2018 (b).
Sustainability 14 01663 g002
Figure 3. Research steps.
Sustainability 14 01663 g003
Figure 4. The distribution of stereotype image phrases’ frequency and their fitting curves where (a) represents the high safety perception group, (b) represents the medium safety perception group, and (c) represents the low safety perception group.
Sustainability 14 01663 g004
Table 1. Demographic characteristics of the respondents.
CategoryFrequencyPercentage/%CategoryFrequencyPercentage/%
GenderMale34760.77EducationJunior high school and below335.78
Female22339.05Senior high school8715.24
Null10.18College and university38968.13
Age≤18 years264.55Graduate school5810.16
18–25 years20335.55Null40.7
26–35 years15727.5OccupationStudent15026.27
36–45 years9716.99Teacher6210.86
46–60 years7412.96Civil servant8114.19
≥60 years132.28Enterprise staff11620.32
Null10.18Business people305.25
Monthly income≤2000 RMB14625.57Soldier91.58
2001–5000 RMB14625.57Farmer132.28
5001–10,000 RMB15927.85Self-employed6411.21
10,001–15,000 RMB447.71Retired people152.63
15,001–20,000 RMB244.2Others284.9
≥20,000 RMB305.25Null30.53
Null223.85
Table 2. Cluster center of tourism safety perception.
Safety Factors1
n = 213
2
n = 273
3
n = 137
Safety Factors1
n = 213
2
n = 273
3
n = 137
Earthquake4.864.354.26Traffic Accident4.693.652.68
Snow Disaster4.854.294.05Fire and Explosion4.913.902.80
Landslides4.713.843.51Tourist Facilities4.833.712.85
Theft and Robbery4.804.122.74Crowding and Trampling4.883.832.83
Pornography, Gambling and Drugs4.924.162.85Language Barriers4.473.422.54
Violent and Terrorist Events4.823.822.43Cab Service4.673.622.23
Going Out At 11:004.853.882.66Scenic Spot Service4.683.572.50
Police Presence4.924.123.02Shopping Scams4.733.532.29
Food Hygiene4.773.662.67Defrauding Tourists4.763.422.15
Accommodation Hygiene4.633.432.46Tourism Complaints4.713.462.23
Infectious Diseases4.803.712.78Rescue Ability4.823.532.34
Table 3. The top 20 stereotype image phrases and their frequency.
No.High Safety Perception GroupMedium Safety Perception GroupLow Safety Perception Group
PhrasesFrequency/%PhrasesFrequency/%PhrasesFrequency/%
1Beautiful6.19Large5.47Mutton Kebabs7.09
2Large5.15Vast5.03Deserts5.62
3Gourmet Food3.92Tianshan Tianchi4.88Large4.89
4Deserts3.92Gourmet Food4.59Hami Melon4.16
5Far Away3.51Deserts4.14Grapes4.16
6Fruits3.30Beautiful3.99Tianshan Tianchi3.67
7Mutton Kebabs3.09Mutton Kebabs3.85Beautiful3.42
8Vast3.09Grapes3.40Vast3.18
9Ethnic Minorities2.89Fruits2.81Beautiful Girls3.18
10Tianshan Tianchi2.68Grasslands2.66Far Away3.18
11Grapes2.47Far Away2.66Gourmet Food2.69
12Grasslands2.27Gobi1.92Raisins2.44
13Beautiful Scenery2.06Hami Melon1.78Grasslands2.20
14Hami Melon1.65Mutton1.78Chicken with Big Dish2.20
15Roast Meat1.65Vast Size and Resources1.63Gobi1.96
16Beautiful Girls1.65Melons and Fruits1.63Uyghur1.96
17Landscape1.24Uyghur1.63Ethnic Minorities1.71
18Mutton1.24Beautiful Girls1.48Mutton1.71
19Vast Size and Resources1.03Beautiful Scenery1.33Violent Terrorist Events1.47
20Songs and Dances1.03Raisins1.33Vast size and Resources1.47
TotalCumulative Frequency54.02Cumulative Frequency57.99Cumulative Frequency62.35
Table 4. Sentiment classification of stereotype image phrases.
Positive Phrases/%Negative Phrases/%
High Safety Perception Group22.681.65
Medium Safety Perception Group17.162.07
Low Safety Perception Group15.164.89
Table 5. Diversity index of stereotype image phrases.
123Index to Compare
Richness Index, Mn6.8116.5385.4391 > 2 > 3
Diversity Index, H4.4124.3374.0841 > 2 > 3
Uniformity Index, E0.8810.8440.8691 > 2, 1 > 3
Dominance Index, D0.0210.0230.0261 < 2 < 3
Where “1” represents the high safety perception group, “2” represents the medium safety perception group, and “3” represents the low safety perception group.
Table 6. One-way ANOVA results of cognitive image items.
No.Image FactorsFSig.Multiple ComparisonsNo.Image FactorsFSig.Multiple Comparisons
1Xinjiang is very Large1.4680.231 23Many Grasslands9.7890.0001 > 2 > 3
2Xinjiang is Far Away3.3860.0353 > 224Tianshan Tianchi7.0040.0011 > 3
3Convenient Transportation15.3220.0001 > 2 > 325Beautiful Kanas19.5220.0001 > 2 > 3
4Mystery0.6630.516 26Yili Scenery18.3650.0001 > 2, 1 > 3
5Dry Climate1.3260.266 27Dokku Highway8.3010.0001 > 2, 1 > 3
6Great Temperature Difference1.0880.338 28Suitable for Self-drive8.5570.0001 > 2, 1 > 3
7Many Deserts1.3170.269 29Ancient Silk Road8.4910.0001 > 2, 1 > 3
8Glacier and Snow Mountains3.8000.0231 > 330Cheap Accommodation14.7460.0001 > 2, 1 > 3
9Many Mountains and Lakes8.9730.0001 > 2, 1 > 331Hotel Service24.8180.0001 > 2 > 3
10Local Culture10.9080.0001 > 2, 1 > 332Dutiful Tour Guide20.7250.0001 > 2 > 3
11Long History9.1960.0001 > 2, 1 > 333Diverse Ethnic Minorities15.6620.0001 > 2, 1 > 3
12Many Airports8.7310.0001 > 2, 1 > 334Islamic Culture8.0620.0001 > 2, 1 > 3
13Ecological Environment14.5890.0001 > 2 > 335Xinjiang Cuisine21.1080.0001 > 2 > 3
14Architectural Features13.1550.0001 > 2, 1 > 336Mutton with Special Features15.5450.0001 > 2, 1 > 3
15City Modernization21.0450.0001 > 2 > 337Hometown of Melons and Fruits11.0490.0001 > 2, 1 > 3
16Cab service22.4610.0001 > 2, 1 > 338Hometown of Songs and Dances8.7840.0001 > 2, 1 > 3
17Convenient Accommodation31.3640.0001 > 2 > 339Social Security25.6630.0001 > 2 > 3
18Special Tourist Routes22.2980.0001 > 2, 1 > 340Hospitable Locals30.3220.0001 > 2 > 3
19Numerous Attractions11.0360.0001 > 2, 1 > 341Honest Ethnic Minorities34.7870.0001 > 2 > 3
20Tourist Center33.7530.0001 > 2 > 342Rich Nightlife20.1570.0001 > 2, 1 > 3
21Attractive Scenery17.1080.0001 > 2, 1 > 343Tourist Souvenirs22.6460.0001 > 2 > 3
22Natural Scenery16.2170.0001 > 2, 1 > 344Rich Gourmet Food20.8350.0001 > 2 > 3
Where “1” represents the high safety perception group, “2” represents the medium safety perception group, and “3” represents the low safety perception group.
Table 7. Factorial analysis results of cognitive image items.
Image DimensionsImage FactorsFactor LoadingImage DimensionsImage FactorsFactor Loading
Service Facilities (16.630%)Special Tourist Routes0.737Local Cuisine (11.608%)Mutton with Special Features0.739
Tourist Center0.736Xinjiang Cuisine0.737
City Modernization0.726Rich Gourmet Food0.664
Hotel Service0.697Hometown of Melons and Fruits0.602
Cab Service0.679Hometown of Songs and Dances0.563
Dutiful Tour Guide0.634Local Culture (8.141%)Long History0.786
Rich Nightlife0.628Local Culture0.771
Tourist Attraction (15.753%)Natural Scenery0.739Ancient Silk Road0.448
Attractive Scenery0.726Climate Environment (7.930%)Dry Climate0.798
Many Grasslands0.703Great Temperature Difference0.748
Yili Scenery0.690Many Deserts0.715
Beautiful Kanas0.660
Dokku Highway0.619
Table 8. The mean of cognitive image dimensions and their one-way ANOVA results.
Image DimensionsMean ValueFSig.Multiple Comparisons
123
Service Facilities4.0823.6203.38847.0410.0001 > 2 > 3
Tourist Attractions4.6654.4014.23324.8990.0001 > 2 > 3
Local Cuisine4.6724.4274.25925.1490.0001 > 2 > 3
Local Culture4.7054.4564.43714.0460.0001 > 2, 1 > 3
Climate Environment4.4504.3394.4191.9120.149
Where “1” represents the high safety perception group, “2” represents the medium safety perception group, and “3” represents the low safety perception group.
Table 9. Affective image factor means and one-way ANOVA results.
Image FactorMean ValueFSig.Multiple Comparisons
123
Pleasant4.6764.4514.11023.3560.0001 > 2 > 3
Exciting4.4924.0873.76630.4720.0001 > 2 > 3
Relaxing4.5914.1803.89424.4530.0001 > 2 > 3
Arousing4.3984.1253.91210.8870.0001 > 2 > 3
Where “1” represents the high safety perception group, “2” represents the medium safety perception group, and “3” represents the low safety perception group.
Table 10. The mean of conative image items and their one-way ANOVA results.
Image FactorMean ValueFSig.Multiple Comparisons
123
Whether Satisfied4.1633.9483.9104.3910.0131 > 3
Whether Willing to Revisit4.2863.8923.65928.7800.0001 > 2 > 3
Whether to Revisit4.4754.2493.95113.4850.0001 > 2 > 3
Whether to Recommend4.7114.5544.31910.3770.0001 > 3, 2 > 3
Where “1” represents the high safety perception group, “2” represents the medium safety perception group, and “3” represents the low safety perception group.
Publisher’s Note: MDPI stays neutral with regard to jurisdictional claims in published maps and institutional affiliations.

