Article

Qinghai-Tibetan Plateau Greening and Human Well-Being Improving: The Role of Ecological Policies

1
Yulong Snow Mountain Cryosphere and Sustainable Development Observation and Research Station/State Key Laboratory of Cryospheric Sciences, Northwest Institute of Eco-Environment and Resources, Chinese Academy of Sciences, Lanzhou 730000, China
2
Key Laboratory of Remote Sensing of Gansu Province, Northwest Institute of Eco-Environment and Resources, Chinese Academy of Sciences, Lanzhou 730000, China
*
Authors to whom correspondence should be addressed.
Sustainability 2022, 14(3), 1652; https://doi.org/10.3390/su14031652
Submission received: 6 January 2022 / Revised: 27 January 2022 / Accepted: 29 January 2022 / Published: 31 January 2022

Abstract

:
Appropriate human activities can have significantly positive effects on vegetation dynamics. In the past 50 years, various ecological policies have improved both ecological change and human well-being in the Qinghai–Tibetan Plateau (QTP), efficiently achieving multiple Sustainable Development Goals (SDGs) of the United Nations’ 2030 Agenda for Sustainable Development. During 1981–2017, the annual mean normalized difference vegetation index (NDVI) of the protected areas (PAs) tended to increase significantly at a rate of 2.93 × 10⁻⁴/a (p < 0.01), while non-PAs only increased by 0.6 × 10⁻⁴/a (p < 0.5). Improvement in the NDVI of the PAs is more obvious than that of non-PAs. Specifically, the earlier the establishment of the Pas is, the more significant the greening effect will be. Moreover, ecological protection has not slowed improvements in human welfare; on the contrary, the Human Development Index (HDI) has nearly doubled in the past 40 years. In terms of global ecological construction, the Chinese government has demonstrated the responsibilities of a large country in global ecological governance. Chinese initiatives can guide other nations in contributing to the global sustainability aspirations embodied in the 2030 SDGs Agenda. This study can be used as a reference for other countries in the world to coordinate the development of ecological protection and well-being.

1. Introduction

Vegetation is not only the main part of the earth’s ecosystems but also the important medium for energy exchange, water cycles, and biogeochemical cycles on terrestrial surfaces [1,2]. Globally, vegetation plays a vital role in regulating carbon balance, reducing greenhouse gases, and maintaining climate stability [3,4,5,6]. As the world’s largest and highest Cenozoic plateau, the Qinghai–Tibetan Plateau (QTP) covers about 2.50 million km2 with an average elevation of 4500 m a.s.l [7]. The same latitude area is mostly desert, but the uplift of the QTP blocks the westerly belt from the north and south, causing the formation or enhancement of the Asian southeast and southwest monsoons, making rich and fertile eastern China [8] and forming an important alpine ecosystem in Asia. The QTP is the starting and regulating area for climate change in the northern hemisphere and is called the climate source and ecological source [9,10,11,12,13,14]. Surface snow and vegetation directly affect the reflectivity of surfaces, changing the heating conditions of the ground and the atmosphere. In the spring and winter, when there is a lot of vegetation cover, sensible heat increases, and air temperatures at the surface and in the troposphere also increase. In the summer and autumn, vegetation cools the atmosphere. The QTP’s vegetation greening has been observed in response to recent warming and increased growing season vegetation activity may have attenuated surface warming [1,15].
Although sparsely populated and contributing little to China’s overall economy, the QTP plays an important environmental role throughout Asia. As a global water tower [16], the QTP is also the water source and conservation area for the Yangtze, Yellow, Indus, Mekong, and Salween Rivers, affecting the livelihoods and food security of the high Asian (i.e., Central, South, and East Asia) population of more than three billion (Figure 1). The QTP has unique ecosystem types and unique animal and plant species, with more than 62,000 km2 of forest and 1.5 million km2 of natural grassland, similar to the Arctic Tundra and Taiga Belts, and is an important carbon sink that plays a significant role in the ecological security of both China and the world (Figure 1). The QTP thus bears a greater environmental protection responsibility for China, and even the global ecological barrier, than other surrounding areas. In theory, the high-latitude, high-altitude ecology system is fragile, and the degradation risk is higher than in low-latitude, low-altitude areas; thus, the impact is greater. Given its simple, fragile ecological structure and low productivity, the QTP is highly sensitive to human activity. In the 1980s, because of dry weather, overgrazing, and urbanization, various ecological and environmental problems were triggered, such as grassland degradation, desertification, wetland atrophy, and biodiversity loss [17,18]. Similar to the Arctic and the Antarctic, the QTP contributes little to global warming but is extremely sensitive to climate change. Its processes have been accompanied by an integrated interaction between the earth’s surfaces (upper crust, atmosphere, hydrosphere, cryosphere, and biosphere) and its deeper layers (mantle and crust), specifically between the lithosphere, hydrosphere, cryosphere, biosphere, atmosphere, and anthroposphere [19].
Ecological degradation at the high latitudes and altitudes of the QTP is more rapid than in other regions, its impact is greater, and adaptation is more difficult. However, because of various national ecological protection policies and projects implemented since 1978, areas of the QTP with serious ecological degradation have shown overall improvements. Such policies and projects include the Three Norths Shelter Forest System Project, Natural Forest Conservation Program, Returning Grazing Land to No Grazing Land, and Sanjiangyuan Ecological Protection and Construction Project; China has also explored forms of ecosystem compensation for farmers in the region (Figure 1; Appendix A: Table A1). For the period 2000–2017, China alone accounted for 25% of the global net increase in leaf area, with only 6.6% of the global vegetated area [20]. Researchers have found that the ecological programs and policies China has implemented over the last 40 years have greatly improved both the ecological security barrier function and people’s levels of well-being. As such, these policies are invaluable for balancing the global climate, and they provide a regional paradigm for addressing the effects of global climate change. To maintain both national and regional ecological security, China has upgraded its “ecological red line” system and “ecological civilization” to a national strategy [21,22].
Under the national and even regional ecological policies, how the fragile ecosystem of the Qinghai-Tibet Plateau changes, whether the effects of the ecological policy appear, and whether human welfare has been improved while protecting the ecology are the main contents of this study. Based on this, the study systematically reviewed the environmental protection policies for the QTP and compared the changes of ecological vegetation in the national protected areas with that of unprotected areas, revealing the effect of national policies on restoring the ecosystem and promoting the improvement of people’s well-being on the QTP, and enhancing the awareness of the benefits of national policies on ecological environment protection. Therefore, this study can be used as a reference for other countries in the world to coordinate the development of ecological protection and well-being.

2. Methods

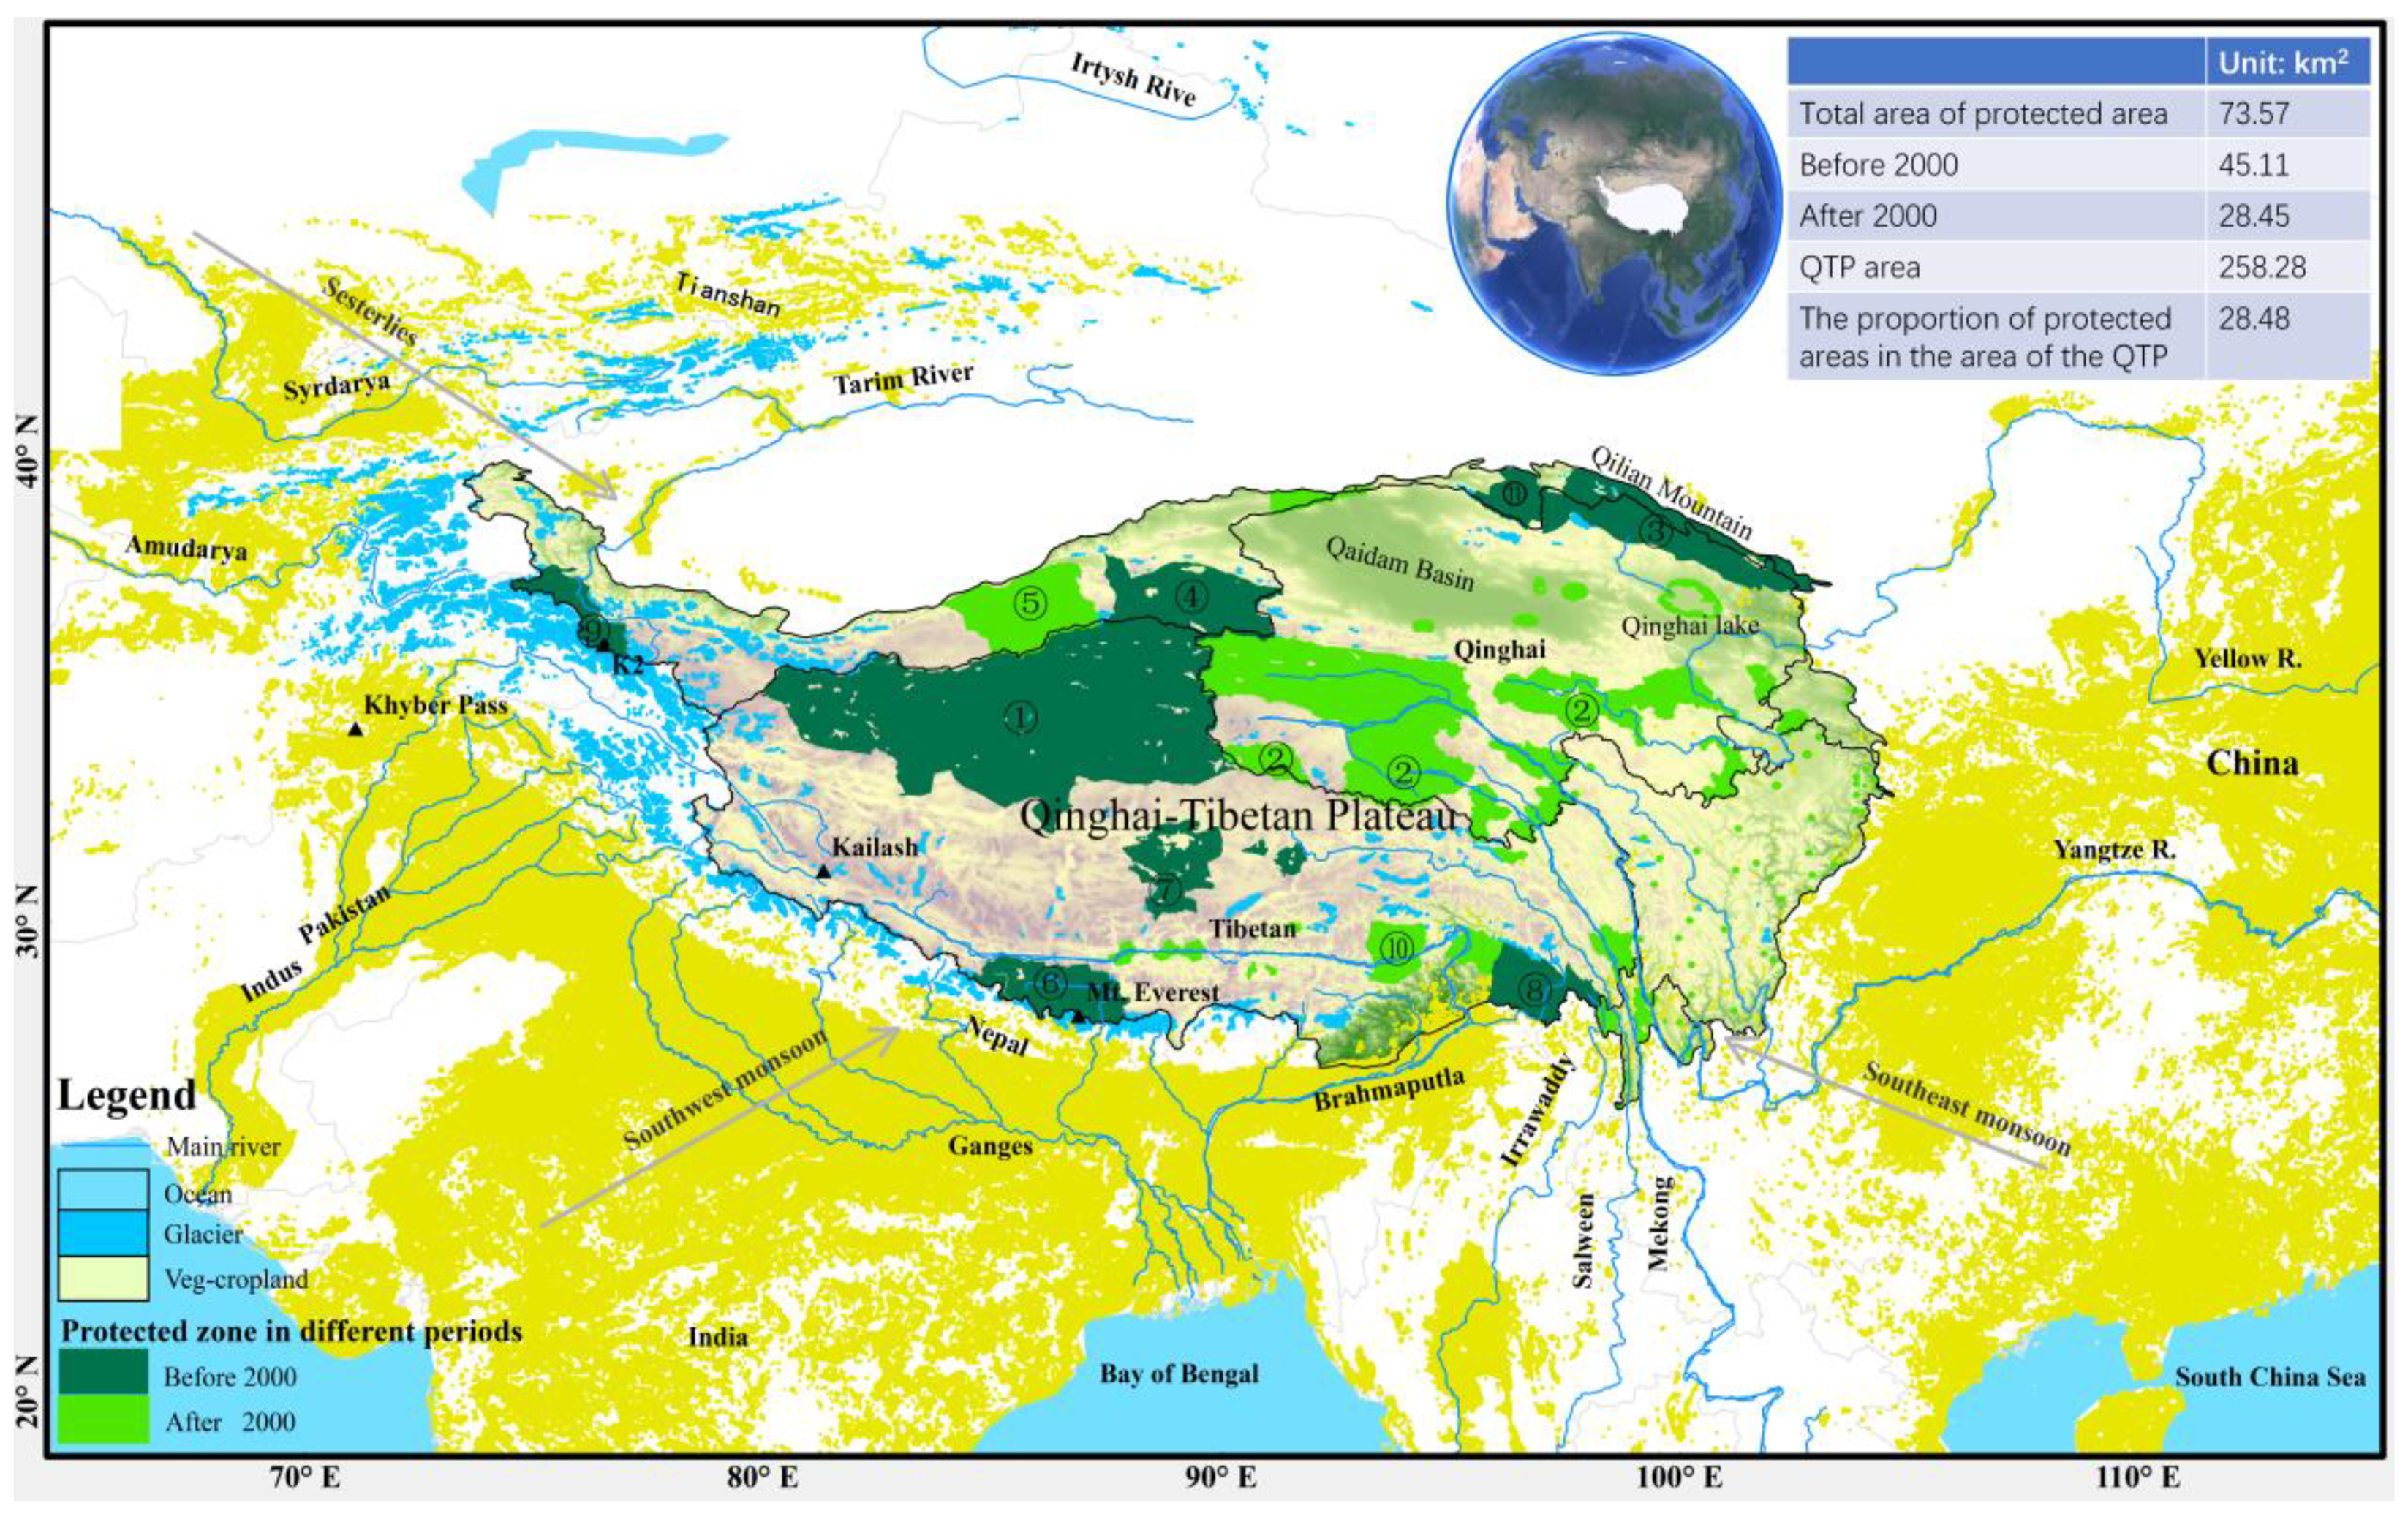
2.1. Protected Areas (Pas)

The Pas dominate conservation efforts and have long been the dominant tool for conserving land cover and regulating climate and ecosystems services [23]. In China, the Pas mainly exist in the form of National nature reserves (NNRs). NNRs were established to protect some of our most important habitats, species, and geology and to provide ‘outdoor laboratories’ for science research. Most NNRs offer great opportunities for schools, special interest groups, and the public to experience wildlife firsthand and learn more about nature conservation. NNRs are also an important object for Sustainable Development Goal (SDG) implementation. The NNRs lists and boundaries are based on the atlas of the China National Nature Reserves until 2015; recently updated lists and boundaries are from the Ministry of Ecology and Environment of the PRC (http://www.mee.gov.cn/ (accessed on 4 August 2021)). The boundary of the QTP is based on Zhang et al., 2002 [7]. The area is approximately 2.58 million km2 (http://www.data.ac.cn/info/93c87 (accessed on 4 August 2021)). The average altitude is 4390 m a.s.l. The longitude is between 70–105° E, and the latitude is between 25° N and 40° N (Figure 1).

2.2. Vegetation Trend Analysis

The normalized difference vegetation index (NDVI) is derived from reflectance in red and near-infrared wavebands. Many studies have found NDVI to be strongly correlated with above-ground biomass (AGB) [6]. AGB, meanwhile, is closely related to animal husbandry development and human welfare. Numerous studies have explored the relationship between NDVI, AGB, and well-being in the QTP and have analyzed their change trends [6,24,25,26]. The QTP has poor vegetation coverage (the Qaidam Basin and the northern Tibetan Plateau, for example, are close to bare land), a shorter growing season, and lower biomass; thus, the overall mean NDVI value is relatively low.
The NDVI is widely recognized as a good indicator of vegetation coverage and productivity. This study used the GIMMS NDVI-3g V1.0 dataset from the Global Inventory Monitoring and Modeling Systems (GIMMS) group from 1 July 1981 to 31 December 2015 (https://climatedataguide.ucar.edu/climate-data/ndvi-normalized-difference-vegetation-index-3rd-generation-nasagfsc-gimms (accessed on 4 August 2020)) [27,28,29]. Since the vegetation coverage in the QTP is relatively low, and most parts are alpine steppes or meadows, bare land is defined as an NDVI below 0.10 [30]. Additionally, the growing season in the QTP is relatively short, but as a usual statistic, this study defined spring as March to May, summer as June to August, autumn as September to November, and winter as December to February.
To clearly depict trends in the vegetation growth, per-pixel analysis was used since it can reflect the dynamics of spatiotemporal changes. At present, the most popular trend-monitoring method is the greenness rate of change (GRC) [31,32]. Although the GRC algorithm is based on ordinary least squares (OLS) and can be calculated within a reasonable time duration, the influence of outliers was found to be prominent and could not be removed. Therefore, Theil–Sen trend analysis was adopted. This is a nonparametric estimator that can effectively eliminate the influence of outliers in longtime series trend analysis [33,34]. The Theil–Sen slope is shown in Equation (1):
s l o p e = m e d i a n N D V I j N D V I i j i ,   i < j n
where i, j is the serial number of year, that is, i, j = 1, 2, …, n, n = 35; NDVIi is the mean NDVI in the i year. The slope reflects the sensitivity of vegetation change. Slope > 0 means the growth status of vegetation is becoming better, and slope < 0 means the vegetation is deteriorating. The linear slope was calculated using Python 3.7.4 on the PyCharm platform.
In this study, ArcGIS software was used to classify different vegetation types on the QTP, and spatial analysis of NDVI trends in protected and unprotected areas was carried out.

2.3. Human Development Index

The Human Development Index (HDI), introduced by the United Nations Development Programme (UNDP) in 1990, is considered the central indicator of the human development (HD) paradigm and is widely recognized as having a relevant role in the development arena vis-à-vis Gross Domestic Product (GDP) and GDP per capita [35]. The HDI is defined as the arithmetic average of normalized indices in the dimensions of health, education, and income [36]:
HDI = (1/3) ∗ (Hh + He + Hls)
where Hi denotes the subindex for dimension i, with i = {h, e, ls} denoting the health, education, and living standard dimensions, respectively. Each of these indices was, in turn, estimated as (or derived from) normalized indicators of achievements in each dimension. Life expectancy (le) and GDP per capita (gdp) were the proxies for health and living standards, respectively, whereas the education dimension used two indicators: literacy (lit) and the gross enrolment ratio (ger). The indices were normalized using the given upper and lower bounds. Thus,
Hh = (lelemin)/(lemaxlemin)
He = 1/3 ∗ (gergermin)/(germaxgermin) + 2/3∗ (litlitmin)/(litmaxlitmin)
Hls = ((ln (gdp) − ln(gdpmin))/((ln(gdpmax) − ln(gdpmin))
The reason for normalizing each dimension was to allow each of the subindices Hi to vary between 0 and 1, thus allowing the arithmetic sum of the indices to give equal relevance to each dimension.

3. Results and Analysis

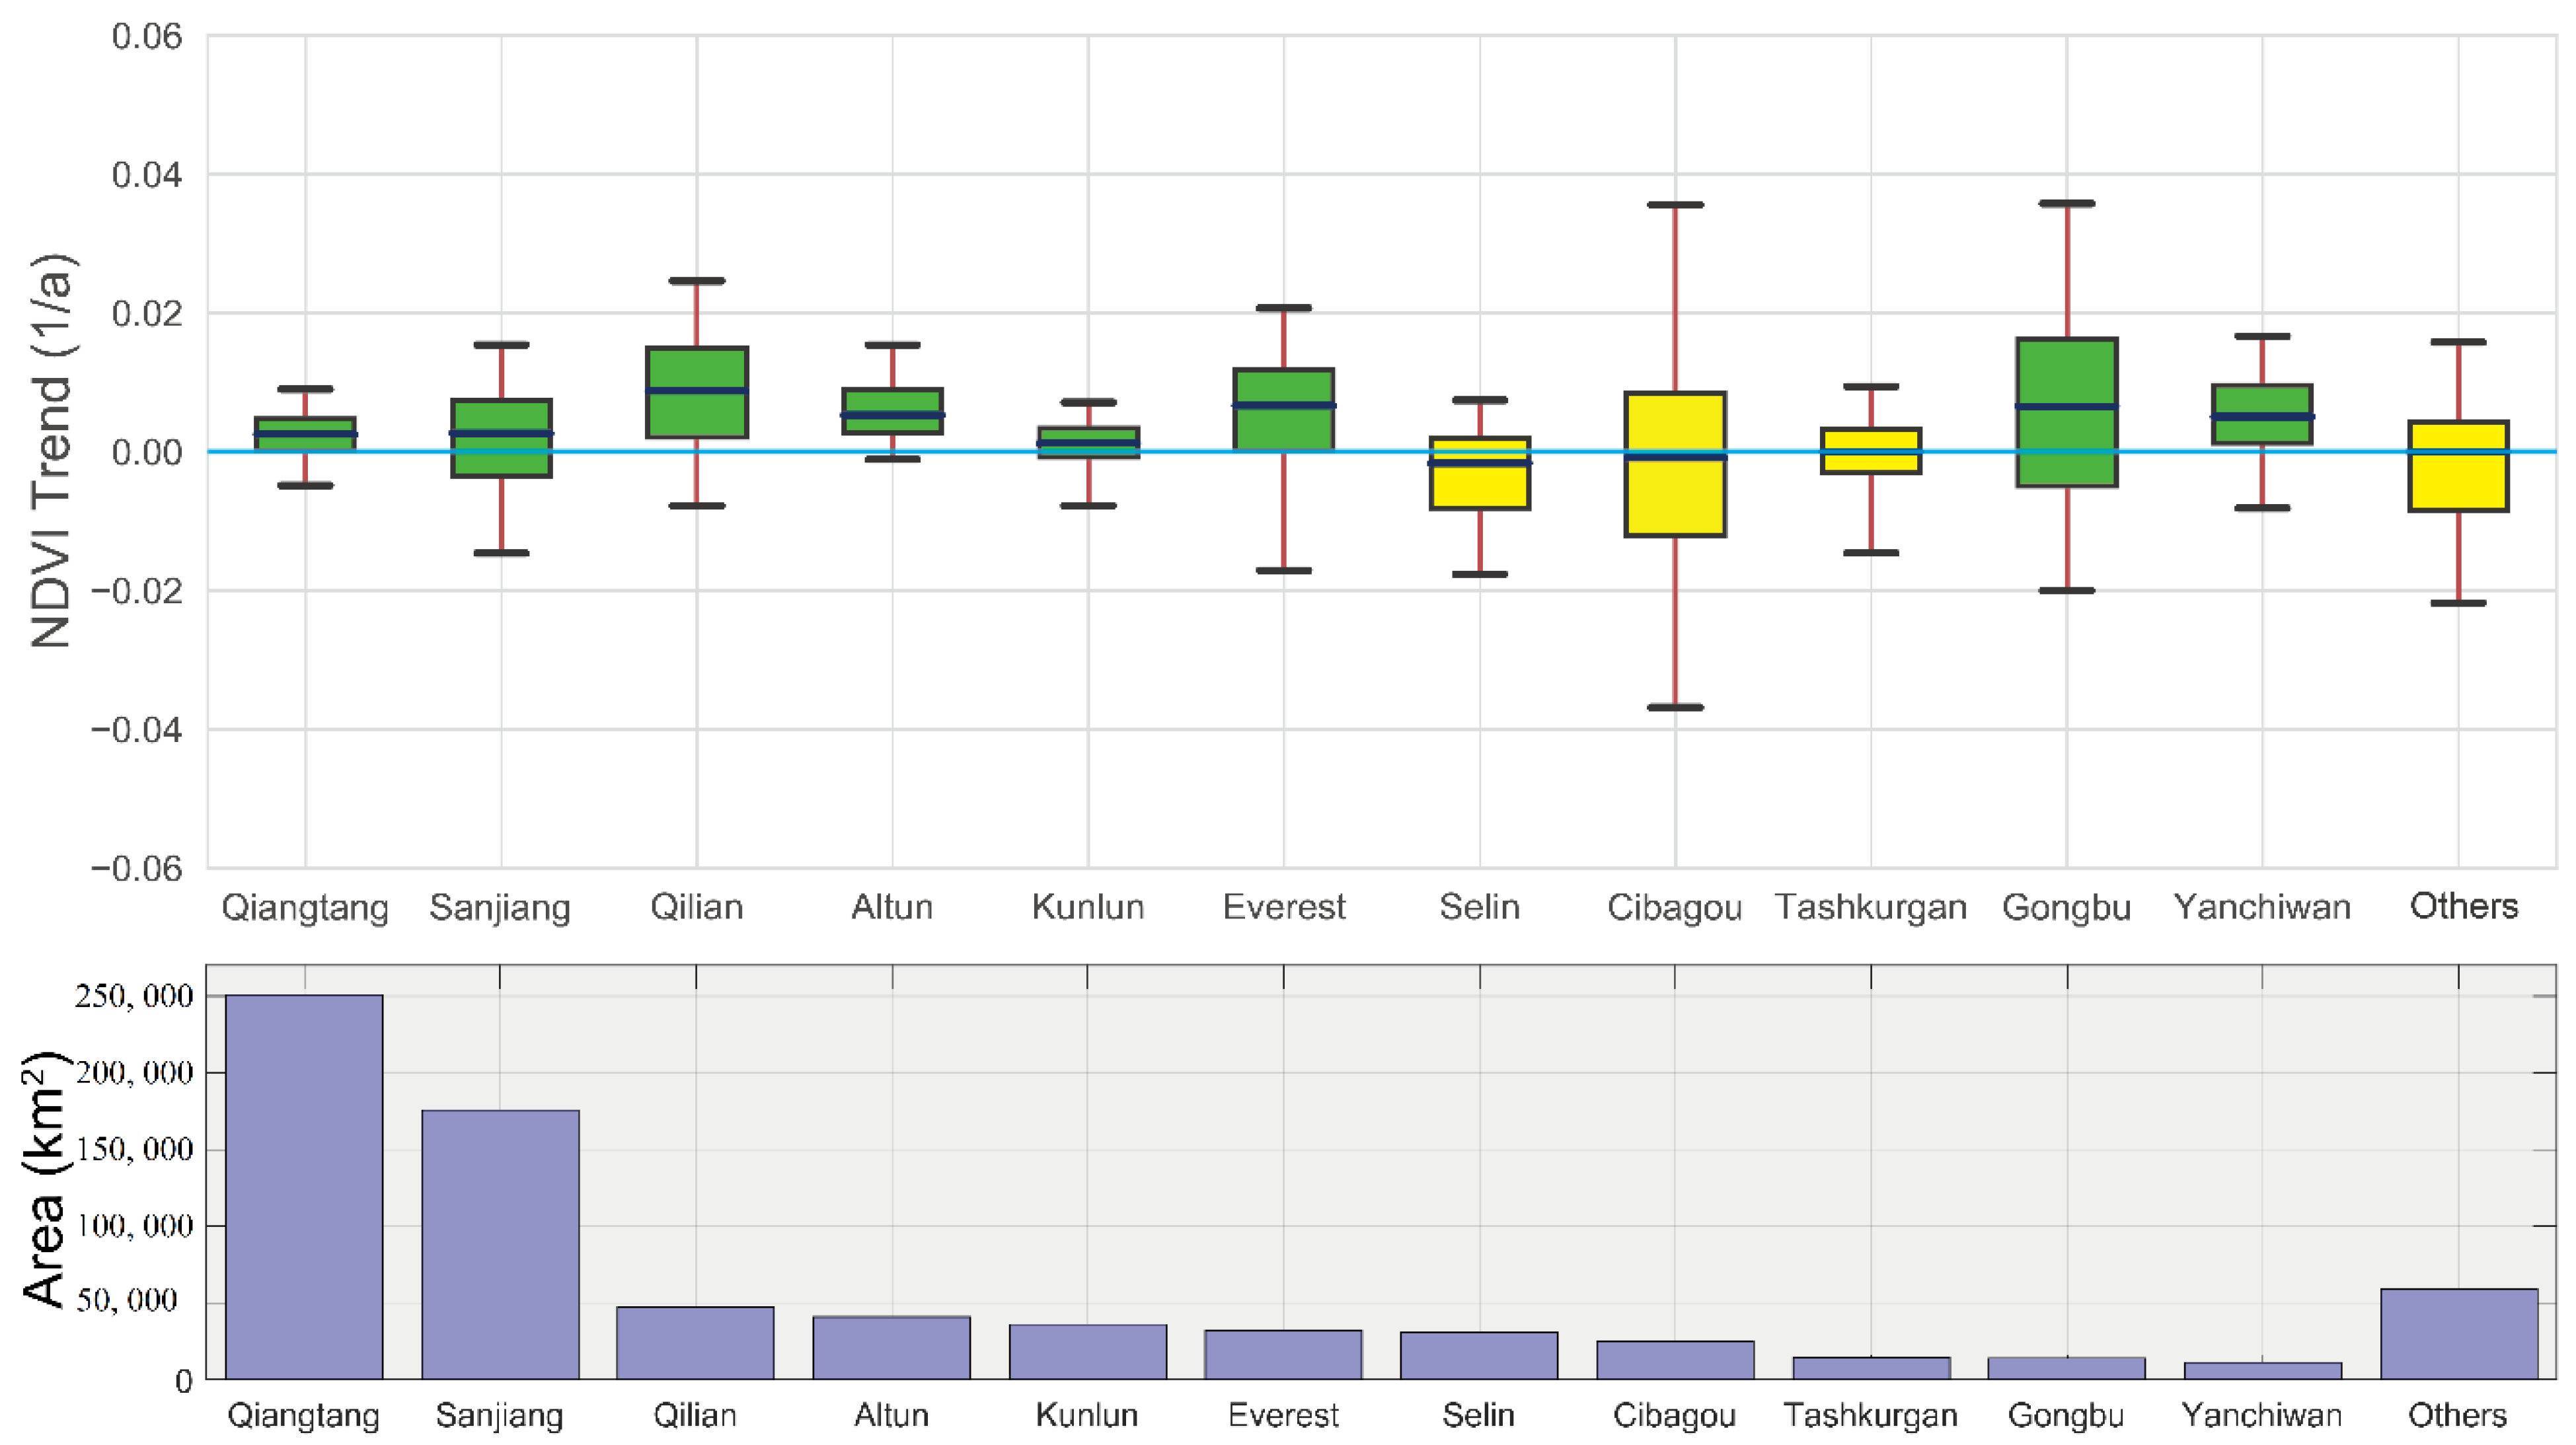
3.1. Spatiotemporal Patterns of NDVI Change

In the past 30 years, vegetation coverage has shown a spatial pattern of overall improvement. Spatially, the NDVI tendency has shown great heterogeneity, with significant NDVI increases in the mid-northern QTP, which is dominated by alpine meadows, accounting for 26.0% (p < 0.05) of the QTP. NDVI was found to be unchanged for the desert/gobi ecosystem, which is consistent with the actual situation; there are significant decreases in the southeast part, which is dominated by grassland and forest, accounting for 4.7% (p < 0.05) (Figure 2A). These findings are consistent with those of other studies [5]. In the different ecoclimatic zones, the vegetation of the northeastern, southwestern, and central QTP, and around the vast areas of the Qaidam Basin and Qinghai lake basin, has obviously improved, especially in the H1C1, H1C2, H1B1, H2C2, H2D1, and H2D2 grassland areas. In contrast, the average growth of the growth belt has tended to degenerate in the H2AB1, H2C1, H2D3, and H3 forest areas with relatively high temperatures and relatively low altitudes in the northeast, the eastern edge, and the southeastern QTP (Figure 2B).

3.2. Protected Area Change

Temperature and precipitation, as well as the intensity and spatial pattern of livestock grazing, differed between the periods prior to and after the year 2000, creating different vegetation dynamics [38]. Overall, increased temperature, enhanced precipitation, and prohibitive grazing policy favored vegetation growth.
In 1963, the first National Nature Reserve of the QTP-Baishuijiang was established. Since 1994, the establishment of nature reserves on the QTP has entered a stage of rapid and stable development. Up to now, 155 nature reserves of various types have been constructed in the QTP with an area of 82.24 km2, accounting for 31.63% of the Plateau land area and 57.56% of the total area of China’s terrestrial nature reserves (Figure 1). PA is a recognized way for conserving nature and halting the loss of biodiversity, and its types mainly include wildlife and desert ecosystems, wildlife and ecosystems, and wildlife, accounting for 36.84%, 33.35%, and 6.80%, respectively, of the total area of nature reserves [39]. The protected natural areas in the QTP are increasingly composed of national parks instead of nature reserves. In 2016, China ratified the Plan for the Trial Run of the State Park at Sanjiangyuan (literally, “source of three large rivers”), the first pilot reform program to introduce state parks in China. The Sanjiangyuan National Park will be officially established in 2020 and will become the first national park in China. The aim is to ensure that the ecological resources of the Sanjiangyuan area, where the headwaters of the Yangtze, Yellow, and Lancang Rivers converge, are owned by the state, shared by the people, and passed down to future generations [40]. Nearly 38.80% of the total grassland area underwent degradation, while 61.20% experienced restoration. As such, the climate was the principal driving force of grassland degradation, whereas human activity was the dominant factor in grassland restoration [41].

3.3. NDVI Change between Protected and Unprotected Zones

The annual mean NDVI of protected areas (PAs) ranged from 0.26 to 0.30, which is slightly lower than that of non-PAs (0.36–0.40). However, the improvement in the NDVI of the PAs is more obvious than that of non-PAs. During 1981–2017, the annual mean NDVI of the PAs tended to increase significantly at a rate of 2.93 × 10⁻⁴/a (p < 0.01), while non-PAs only increased by 0.6 × 10⁻⁴/a (p < 0.5). In particular, the NDVI change of 0.004/10a of the PAs established before 2000 is significantly better than that of the PAs after 2000 (0.0025/10a), whereas NDVI changes in non-PAs were small before and after 2000 (Figure 3). Among the 11 largest nature reserves, the vegetation of the Gongbu reserve, established in 1982, was evidently improved, followed by the Qilian Mountain Reserve (1980) and the Everest Reserve (1988). Other apparently better PAs are the Sanjiangyuan (2000), Yanchiwan (1982), Alutun (1983), Qiangtang (1993), and Kunlun (1988) reserves (Figure 4).
Among them, Qiangtang and Kunlun, with extremely large areas, comprise an alpine desert ecosystem; thus, the NDVI change is not very significant. The significant expansion by 43% of Selin lake area 2389 km2 (2017) from 1976 to 2017 has led to a significant downward trend in NDVI change [42]. In the Tashkurgan (1982) reserve (a protected desert area), NDVI change showed a downward trend, and protection effectiveness was not evident, which is closely related to overload. In the Cibagou forest reserve (2002), NDVI showed a downward trend, which is highly correlated with deforestation, forest fires [43,44], and increases in tree mortality from climate warming [45,46,47,48]. These findings are consistent with prior studies [5,49,50] (Figure 4).

4. Discussion

4.1. Ecological Policies and NDVI Change

Appropriate human activities have a significant positive effect on vegetation improvement [51,52,53,54,55]. To help reduce the ecological degradation of the QTP and improve human well-being, the state has been implementing various forest, grass, and comprehensive ecological protection plans and construction projects since the 1980s (Figure 5). Examples include the Overall Plan for Ecological Protection and Construction of Qinghai Sanjiangyuan Nature Reserve (2005), Tibet Ecological Protection Barrier Protection and Construction Plan (2008–2030) (2009), and Regional Ecological Construction and Environmental Protection Plan for the QTP (2011–2030) (2011). From 2007 to 2014, the implementation of the Returning Grazing Land to No-Grazing Land policy, along with ecological compensation policies, has led to a decline in grazing and significant restoration of grassland.
In the Yellow River headwaters of the QTP, nomadic herder resettlement, protection from livestock, and various restoration interventions slowed or reversed alpine meadow degradation during 2005–2012 [25]. From 2008 to 2014, the carbon fixation of alpine grassland in Tibet showed a clear upward trend, and soil carbon fixation increased by 16.5 million tons [56]. As of 2015, the grassland yield of all types of grassland in Sanjiangyuan had increased by 30%, and water resources increased by nearly eight billion cubic meters. In the past 30 years, the total net primary productivity (NPP) of alpine grassland in the QTP has increased by 8.1–20%, and the area increased by 32% [21,51,57]. Therefore, it can be said that various policies have driven the ecological security barrier function of the QTP.
If the weak ecological improvements in non-PAs are attributable to climate warming and humidity changes, then the significant ecological improvements in the PAs are mainly driven by national ecological policies [58]. In the QTP, regional vegetation greening has also been observed in response to recent warming. Here, we found that in contrast to Arctic regions, increased growing season vegetation activity in the QTP may have attenuated surface warming [15]. The practice has shown that establishing nature reserves and implementing ecological policies are not only the best way to protect biodiversity but also effective measures for building an ecological environment and maintaining regional ecological security.

4.2. Ecological Policies and Human Well-Being

Above ecological policies have greatly enhanced the Plateau ecological barrier function and promoted the implementation of the United Nations SDG targets on the QTP. Because of the QTP’s special geographic characteristics, grazing and animal husbandry are its main industries. Thus, local communities are highly dependent on grassland resources. Ecological protection zones and various policies have restricted the use of grassland resources by communities and have thus been implemented at the expense of animal husbandry development. The overgrazing that accompanies high-intensity human activity is considered a main driving factor of alpine grassland degradation in the QTP [51,59].
Following the reforms and development of 1978, China implemented a household contract responsibility system with the dual contracting of grass and livestock. At this time, livestock increased, which led to overgrazing [60]. Before 2005, the number of livestock in the QTP had remained at a level of 30 million sheep units (except for the snowstorm of 1985, which sharply decreased livestock). The Returning Grazing Land to No-Grazing Land policy was established in 2002, and Sanjiangyuan ecological protection and construction projects began to be implemented in 2005. Despite such policies, because of inertia, the number of livestock in the QTP in 2005 was as high as 34.64 million sheep units. After that, livestock started to show a downward trend. In 2016, livestock fell to an all-time low of 25.21 million sheep units (Figure 6). From 1961 to 2015, the frequency of livestock deaths from snowstorms has fallen sharply [61]. In 2018, the beef, mutton, and milk products of the six major grassland provinces dominating the QTP had increased by 150, 95, and 30 times, respectively, compared to 1978.
In 2011, grassland ecological protection subsidies and rewards were implemented in the QTP. Since then, 760,000 herders in Qinghai Province have benefitted from this policy, with average annual incomes of CNY 1600. In the Tibet Autonomous Region, such rewards have accounted for more than 60% of herders’ disposable income. During 2008–2017, China made transfer payments of CNY 16.29 billion and CNY 8.35 billion to key ecological function zones in Qinghai and Tibet, respectively, covering 77 counties and all areas prohibited for development [40]. In 2016, the GDP reached CNY 372.25 billion, or CNY 40,286 per capita; compared with 2000, the GDP had increased by 9.76 times and 8.20 times (Figure 6).
Human welfare improvement pertains to not only income but also health and education. The HDI, an average of normalized indices in the dimensions of health, education, and income, can reflect human welfare levels [55]. From 1978 to 2017, the QTP’s HDI increased by 0.095 (R = 0.989)/10a, reaching 0.696 in 2017, a near-double increase compared with 1978. Nevertheless, it is still lower than China’s overall HDI of 0.752 and the global level of 0.728 [62] (Figure 4). In terms of the SDGs, improved the QTP’s HDI has contributed to SDG 1 (no poverty), SDG 2 (zero hunger), SDG 3 (good health and well-being), and SDG 4 (quality education). For example, from 2010 to 2015, the state invested CNY 25.31 billion in the construction of rural drinking water, soil and water conservation, and water conservancy in pastoral areas, solving the drinking water safety problem for 4.57 million farmers and herders and effectively supporting the SDG 6.4. Since various policies were characterized by synergies and cobenefits across multiple SDGs, they addressed several other SDGs, including SDG 8 (decent work and economic growth), SDG11 (sustainable cities and communities), SDG 13 (climate action), and SDG 15 (life on land) [62]. Especially, ecological policies have supported herders’ investment in forage for breeding and eased pressure on grassland caused by overgrazing. Incomes, medical care, education, consumer spending, and overall welfare have been enhanced as well. The completion rate of nine-year compulsory education in the QTP has reached more than 90%, and life expectancy has increased from 35 in the 1950s to over 70 at present. It can be said, therefore, that the QTP has achieved important breakthroughs in SDG 1-13, 15 [63].

5. Conclusions

Over the last 40 years, ecosystem improvement throughout the QTP represents a remarkable achievement of governance, policy, and human effort, in which the annual mean NDVI of the protected areas (PAs) tended to increase significantly at a rate of 2.93 × 10⁻⁴/a (p < 0.01) while non-PAs only increased by 0.6 × 10⁻⁴/a (p < 0.5). The earlier the establishment of the Pas is, the more significant the greening effect will be. This is attributable not only to climate warming and increased precipitation but also to various ecological policies. Significantly, ecological protection has not slowed improvements in human welfare; on the contrary, the HDI has nearly doubled in the past 40 years.
Ecological progress is important for both regional sustainable growth and global environmental protection. The QTP’s function as an eco-safety barrier has been further consolidated, with increased levels of regional sustainability and public well-being [40]. It can be said that, in terms of global ecological construction, the Chinese government has demonstrated the responsibilities of a large country. China is currently establishing a system of natural protection sites with national parks as the main body. These national park areas, comprising more than 300,000 km2, will have distinctive ecological characteristics and provide research value in terms of recreation and tourism [63]. Some PAs around the world had achieved significant management effectiveness, yet some human-induced pressures on the PAs and conflict between biodiversity conservation and the needs of local people, or the unbalance between human needs and conservation goals, are predicted to increase [64,65,66]. We also believe that China’s policy on the environmental protection of the QTP and the whole country [67], together with other PAs around the world [68,69,70,71,72], will continue to make it deserved contribution to the building of a global ecological security barrier and sustainable human development.

Author Contributions

Conceptualization, Formal analysis, methodology, Writing—review & editing, S.W.; Data curation, Visualization, Y.W. All authors have read and agreed to the published version of the manuscript.

Funding

This research was funded by Strategic Priority Research Program of Chinese Academy of Sciences (grant no. XDA19040500, XDA19070503), the 2020 Joint Research Project of Three-River National Park of the Chinese Academy of Sciences and the People’s Government of Qinghai Province (grant no. LHZX-2020-03) and Applied Technology Research and Development Fund Project of Aba Prefecture, China (20YYJSYJ0076).

Institutional Review Board Statement

Not applicable.

Informed Consent Statement

Not applicable.

Data Availability Statement

The data presented in this study are available on request from the corresponding author.

Conflicts of Interest

The authors declare no conflict of interest.

Appendix A

Table A1. Ecological policies or projects on the Qinghai–Tibet Plateau.
YearEcological Security PolicyPeriodMain AreasArea (104km2)Objective
1978–2011Three Norths Shelter Forest System Project, Natural Forest Conservation Program (1–5 period projects)1978–2020Qilian Mountain
Altun Mountain
Yanchi Bay
406.9Effectively control sandstorm damage and soil erosion
1998National Natural Forest Resources Protection Project1998–1999Qilian Mountain101.7Prevent the deterioration of the ecological environment and protect biodiversity
2002Return Farmland to Forest or Grasslands Project (started)2006–2010QTP30.00Steep sloping farmland returns farmland to forests, and severe desertification of cultivated land is treated
2003Returning Grazing Land to No-Grazing Land2003–2007QTP66.67Strengthen grassland protection and construction
2005Overall Plan for the Ecological Protection and Construction of Qinghai Sanjiangyuan Nature Reserve (1 period project)2005–2020Sanjiangyuan39.5Grass vegetation is protected, and the trend of land desertification is curbed
2007Ecological Protection and Construction Planning of Important Water Source Supply Area in Gannan Yellow River2006–2020Gannan Plateau3.38Curb ecological destruction and grassland degradation, restore and improve ecological capacity
2008Qinghai Lake Basin Ecological Environment Protection and Comprehensive Treatment Project2008–2018Qinghai Lake Basin and surrounding areas2.96Protect and restore forest and grass vegetation in the basin, curb the trend of land degradation, and maintain the stability of the alpine ecosystem
2008Tibet Ecological Protection Barrier Protection and Construction Plan2008–2030Tibet Autonomous Region120Protect and restore forest and grass vegetation in the basin, curb the trend of land degradation, and maintain the stability of the alpine ecosystem
2011National Natural Forest Resources Protection Project (2nd period) 2011–2020Qilian Mountain Soil and water loss in the project area are reduced, and biodiversity is increased
2012Qilian Mountain Ecological Protection and Construction Comprehensive Management Plan2012–2020Qilian Mountain15.95Protect and restore forest and grass vegetation
2014Sanjiangyuan Nature Reserve (2 period project)
Return Farmland to Forest or Grasslands Project (second round)
2013-2020
2014–2020
Sanjiangyuan
QTP
39.5
2440
Forest and grass vegetation are effectively protected, and the trend of land desertification is effectively curbed;
Steep sloping farmland returns farmland to forests, and severe desertification of cultivated land is treated
2016Regional Ecological Construction and Environmental Protection Plan for the QTP2011–2030QTP Focus on solving ecological degradation and environmental pollution problems in key areas, and further improve the ecological environment
2017Qilianshan National Park System Pilot Program2018-2025Qianlian mountain5.02Overall ecosystem protection and system restoration
2020China’s first national park2020-Sanjiangyuan
Natural Park
12.31Implement the most stringent ecological protection and its residents’ welfare improvement strategy

References

  1. Piao, S.L.; Nan, H.J.; Huntingford, C.; Ciais, P.; Friedlingstein, P.; Sitch, S.; Peng, S.S.; AhlstrÖm, A.; Canadell, J.G.; Cong, N.; et al. Evidence for a weakening relationship between interannual temperature variability and northern vegetation activity. Nat. Commun. 2014, 5, 5018. [Google Scholar] [CrossRef] [PubMed] [Green Version]
  2. Piao, S.L.; Wang, X.H.; Park, T.J.; Chen, C.; Lian, X.; He, H.; Bjerke, J.W.; Chen, A.P.; Ciais, P.; Tømmervik, H.; et al. Characteristics, drivers and feedbacks of global greening. Nat. Rev. Earth Environ. 2020, 1, 14–27. [Google Scholar] [CrossRef]
  3. Fu, B.J.; Li, S.G.; Yu, X.B.; Yang, P.; Yu, G.R.; Feng, R.G.; Zhang, X.L. Chinese ecosystem research network: Progress and perspectives. Ecol. Complex. 2014, 7, 225–233. [Google Scholar] [CrossRef]
  4. Harris, R.B. Rangeland degradation on the Qinghai-Tibetan plateau: A review of the evidence of its magnitude and causes. J. Arid Environ. 2010, 74, 1–12. [Google Scholar] [CrossRef]
  5. Peng, J.; Liu, Z.H.; Liu, Y.H.; Wu, J.S.; Han, Y.N. Trend analysis of vegetation dynamics in Qinghai–Tibet Plateau using Hurst Exponent. Ecol. Indic. 2012, 14, 28–39. [Google Scholar] [CrossRef]
  6. Chu, D.; Deji, Y.Z.; Pubu, C.R.; Ji, Q.M.; Tang, H. Aboveground biomass in the North Tibet and estimate model using remote sensing data. J. Nat. Resour. 2013, 28, 2000–2011. [Google Scholar]
  7. Zhang, Y.L.; Li, B.Y.; Zheng, D. A discussion on the boundary and area of the Tibetan Plateau in China. Geogr. Res. 2002, 21, 1–8. (In Chinese) [Google Scholar]
  8. Qin, D.H.; Yao, T.D.; Chen, F.H.; Zhang, T.J.; Meng, X.M. Uplift of the Tibetan Plateau and its environmental impacts. Quaternary Res. 2014, 81, 397–399. [Google Scholar] [CrossRef]
  9. Ye, D. Some characteristics of the summer circulation over the Qinghai-Xizang (Tibet) Plateau and its neighborhood. Bull. Am. Meteorol. Soc. 1981, 62, 14–19. [Google Scholar] [CrossRef] [Green Version]
  10. Wu, G.X.; Zhang, Y.S. Tibetan Plateau Forcing and monsoon onset in South Asia and Southern China Sea. Mon. Wea. Rev. 1998, 126, 913–927. [Google Scholar] [CrossRef]
  11. Hsu, H.H.; Liu, X. Relationship between the Tibetan plateau heating and east Asian summer monsoon rainfall. Geophys. Res. Lett. 2003, 30, 2066. [Google Scholar] [CrossRef] [Green Version]
  12. Duan, A.M.; Wu, G.X. Role of the Tibetan Plateau thermal forcing in the summer climate patterns over subtropical Asia. Clim. Dyn. 2005, 24, 783–807. [Google Scholar] [CrossRef]
  13. Wang, Y.X.; Zhao, P.; Yu, R.C.; Rasul, G. Inter-decadal variability of Tibetan spring vegetation and its associations with eastern China spring rainfall. Int. J. Climatol. 2010, 30, 856–865. [Google Scholar] [CrossRef]
  14. Chen, F.H.; Yu, Z.C.; Yang, M.L.; Ito, E.; Wang, S.M.; Madsen, D.B.; Huang, X.Z.; Zhao, Y.; Sato, T.; Birks, H.J.B.; et al. Holocene moisture evolution in arid central Asia and its out-of-phase relationship with Asian monsoon history. Quaternary Sci. Rev. 2018, 27, 351–364. [Google Scholar] [CrossRef]
  15. Shen, M.G.; Piao, S.L.; Jeong, S.J.; Zhou, L.M.; Zeng, Z.Z.; Ciais, P.; Chen, D.L.; Huang, M.T.; Jin, C.S.; Li, L.Z.; et al. Evaporative cooling over the Tibetan Plateau induced by vegetation growth. Proc. Natl Acad. Sci. USA 2015, 112, 9299–9304. [Google Scholar] [CrossRef] [Green Version]
  16. Immerzeel, W.W.; Lutz, A.F.; Andrade, M.; Bahl, A.; Biemans, H.; Bolch, T.; Hyde, S.; Brumby, S.; Davies, B.J.; Elmore, A.C.; et al. Importance and vulnerability of the world’s water towers. Nature 2020, 577, 364–369. [Google Scholar] [CrossRef]
  17. Li, B. The rangeland degradation in North China and its preventive strategy. Sci. Agr. Sin. 1997, 30, 1–9. (In Chinese) [Google Scholar]
  18. Zhou, H.; Zhao, X.Q.; Tang, Y.L.; Gu, S.; Zhou, L. Alpine rangeland degradation and its control in the source region of the Yangtze and Yellow Rivers, China. Jpn. Soc. Range Sci. 2005, 51, 191–203. [Google Scholar]
  19. Yao, T.D.; Wu, F.Y.; Ding, L.; Sun, J.M.; Zhu, L.P.; Piao, S.L.; Deng, T.; Ni, X.J.; Zheng, H.B.; Ouyang, H. Multispherical interactions and their effects on the Tibetan Plateau’s earth system: A review of the recent researches. Nat. Sci. Rev. 2015, 2, 468–488. [Google Scholar] [CrossRef] [Green Version]
  20. Chen, C.; Park, T.; Wang, X.H.; Piao, S.L.; Xu, B.D.; Chaturvedi, R.K.; Fuchs, R.; Brovkin, V.; Ciais, P.; Fensholt, R.; et al. China and India lead in greening of the world through land-use management. Nat. Sustain. 2019, 2, 122–129. [Google Scholar] [CrossRef]
  21. Gao, Q.; Wan, Y.F.; Li, Y.; Guo, Y.Q.; Ganjurjav, H.; Qin, X.B.; Jiangcun, W.Z.; Wang, B.S. Effects of topography and human activity on the net primary productivity (NPP) of alpine grassland in northern Tibet from 1981 to 2004. Int. J. Remote Sen. 2013, 34, 2057–2069. [Google Scholar] [CrossRef]
  22. Zhang, B.H.; Zhang, L.; Xie, D.; Yin, X.L.; Liu, C.J.; Liu, G. Application of Synthetic NDVI Time Series Blended from Landsat and MODIS Data for Grassland Biomass Estimation. Remote Sen. 2014, 8, 10. [Google Scholar] [CrossRef] [Green Version]
  23. Joppa, L.N.; Pfaff, A. Global protected area impacts. Proc. R Soc. B. 2011, 278, 1633–1638. [Google Scholar] [CrossRef] [PubMed] [Green Version]
  24. Zhao, M.; Running, S.W. Drought-induced reduction in global terrestrial net primary production from 2000 through 2009. Science 2010, 329, 940–943. [Google Scholar] [CrossRef] [PubMed] [Green Version]
  25. Cai, H.; Yang, X.; Xu, X. Human-induced grassland degradation/restoration in the central Tibetan Plateau: The effects of ecological protection and restoration projects. Ecol. Eng. 2015, 83, 112–119. [Google Scholar] [CrossRef]
  26. Liu, L.H.; Zhang, Y.L.; Liu, L.S.; Wu, J.S.; Li, S.C.; Zhang, H.Y.; Zhang, B.H.; Ding, M.J.; Wang, Z.F.; Paudel, B. Current challenges in distinguishing climatic and anthropogenic contributions to alpine grassland variation on the Tibetan Plateau. Ecol. Evol. 2018, 8, 5949–5963. [Google Scholar] [CrossRef]
  27. Leverington, F.; Costa, K.L.; Pavese, H.; Lisle, A.; Hockings, M. A global analysis of protected area management effectiveness. Environ. Manag. 2010, 46, 685–698. [Google Scholar] [CrossRef] [PubMed]
  28. Slayback, D.A.; Pinzon, J.E.; Los, S.O.; Tucker, C.J. Northern Hemisphere photosynthetic trends 1982–99. Glob. Change Biol. 2003, 9, 1–15. [Google Scholar] [CrossRef]
  29. Sobrino, J.; Julien, Y. Global trends in NDVI-derived parameters obtained from GIMMS data. Int. J. Remote Sens. 2011, 32, 4267–4279. [Google Scholar] [CrossRef]
  30. Wang, X.F.; Xiao, J.F.; Li, X.; Cheng, G.D.; Ma, M.G.; Che, T.; Dai, L.Y.; Wang, S.Y.; Wu, J.K. No Consistent Evidence for Advancing or Delaying Trends in Spring Phenology on the Tibetan Plateau. J. Geophys. Res. Bio. 2017, 122, 3288–3305. [Google Scholar] [CrossRef]
  31. Stow, D.; Daeschner, S.; Hope, A.; Douglas, D.; Petersen, A.; Myneni, R.; Zhou, L.; Oechel, W. Variability of the seasonally integrated normalized difference vegetation index across the north slope of Alaska in the 1990s. Int. J. Remote Sen. 2003, 24, 1111–1117. [Google Scholar] [CrossRef]
  32. Stow, D.; Daeschner, S.; Hope, A.; Douglas, D.; Petersen, A.; Myneni, R.; Zhou, L.; Oechel, W. Greenness trend of Arctic tundra vegetation in the 1990: Comparison of two NDVI data sets from NOAA AVHRR systems. Int. J. Remote Sen. 2007, 28, 4807–4822. [Google Scholar] [CrossRef]
  33. Fernandes, R.; Leblanc, S. Parametric (modified least squares) and non-parametric (Theil–Sen) linear regressions for predicting biophysical parameters in the presence of measurement errors. Remote Sens. Environ. 2005, 95, 303–316. [Google Scholar] [CrossRef]
  34. Ahmed, O.S.; Franklin, S.E.; Wulder, M.A. Interpretation of forest disturbance using a time series of Landsat imagery and canopy structure from airborne lidar. Can J. Remote Sens. 2014, 39, 521–542. [Google Scholar] [CrossRef]
  35. Klugman, J.; Rodríguez, F.; Choi, H.-J. The HDI 2010: New controversies, old critiques. J. Econ. Inequal. 2011, 9, 249–288. [Google Scholar] [CrossRef]
  36. UNSPECIFIED. Human Development Report, 1990—UN-DEV-Program. Ind. Labor Relat. Rev. 1993, 46, 430–431. [Google Scholar] [CrossRef]
  37. Zheng, D. The systematic study on the natural regions of the Qinghai-Tibet Plateau. Sci China Ser D-Earth Sci. 1996, 26, 336–341. (In Chinese) [Google Scholar]
  38. Huang, K.; Zhang, Y.J.; Zhu, J.T.; Liu, Y.J.; Zu, J.X.; Zhang, J. The Influences of Climate Change and Human Activities on Vegetation Dynamics in the Qinghai-Tibet Plateau. Remote Sens. 2016, 8, 876. [Google Scholar] [CrossRef] [Green Version]
  39. Zhang, Y.L.; Wu, X.; Qi, W.; Li, S.C.; Bai, W.Q. Characteristics and protection effectiveness of nature reserves on the Tibetan Plateau. Chin. Resour. Sci. 2015, 37, 1455–1464. (In Chinese) [Google Scholar]
  40. State Council of the PRC. Ecological Progress on the Qinghai-Tibet Plateau (White Paper). 2018. Available online: hppt://www.english.scio.gov.cn/2018-07/18/content_57787663.htm (accessed on 6 January 2022).
  41. Wang, Z.Q.; Zhang, Y.Z.; Yang, Y.; Zhou, W.; Gang, C.C.; Zhang, Y.; Li, J.L.; An, R.; Wang, K.; Odeh, I.; et al. Quantitative assess the driving forces on the grassland degradation in the Qinghai–Tibet Plateau, in China. Ecol. Inform. 2016, 33, 32–44. [Google Scholar] [CrossRef]
  42. Zhu, L.P.; Wang, J.B.; Ju, J.T.; Ma, N.; Zhang, Y.S.; Liu, C.; Han, B.P.; Liu, L.S.; Wang, M.D.; Ma, Q.F. Climatic and lake environmental changes in the Serling Co region of Tibet over a variety of timescales. Sci. Bull. 2019, 64, 422–424. [Google Scholar] [CrossRef] [Green Version]
  43. Bao, W.K.; Zhang, Y.L.; Wang, Q.; Bai, W.Q.; Zheng, D. Plant diversity along a time sequence (1–30 years) of artificial forest rehabilitation on subalpine cut land in the eastern Qinghai-Tibetan Plateau. Chin. J. Plant Ecol. 2002, 26, 330–338. (In Chinese) [Google Scholar]
  44. Tian, X.R.; Shu, L.F.; Wang, M.Y.; Zhao, F.J. Study on the spatial and temporal distribution of forest fire in Tibet. Fire Saf. Sci. 2007, 16, 10–14. (In Chinese) [Google Scholar]
  45. Allen, C.D.; Macalady, A.K.; Chenchouni, H.; Bachelet, D.; Dowell, N.M.; Vennetier, M.; Kitzberger, T.; Rigling, A.; Breshears, D.D.; Hogg, E.H.; et al. A global overview of drought and heat-induced tree mortality reveals emerging climate change risks for forests. For. Ecol. Manag. 2010, 259, 660–684. [Google Scholar] [CrossRef] [Green Version]
  46. Allen, C.D.; Breshears, D.D.; McDowell, N.G. On underestimation of global vulnerability to tree mortality and forest die-off from hotter drought in the anthropocene. Ecosphere. 2015, 6, art129. [Google Scholar] [CrossRef]
  47. Lu, R.L.; Du, Y.; Yan, L.M.; Xia, J.Y. A methodological review on identification of tree mortality and their applications. Chin. Sci. Bull. 2019, 64, 2395–2409. (In Chinese) [Google Scholar] [CrossRef] [Green Version]
  48. Lu, X.M.; Fu, T.; Du, Q.Q.; Zhang, L.; Wang, Y.F.; Liang, E.Y. Tree regeneration after fire and logging in sub-alpine forest on the southeastern Tibetan Plateau (in Chinese). Chin. Sci. Bull. 2019, 64, 2907–2914. [Google Scholar]
  49. McDowell, N.G.; Allen, C.D. Darcy’s law predicts widespread forest mortality under climate warming. Nat. Clim. Chang. 2015, 5, 669–672. [Google Scholar] [CrossRef]
  50. Taccoen, A.; Piedallu, C.; Seynave, I.; Perez, V.; Gégout-Petit, A.; Nageleisen, L.M.; Bontemps, J.D.; Gégout, J.C. Background mortality drivers of European tree species: Climate change matters. P Roy Soc. B. 2019, 286, 1900. [Google Scholar] [CrossRef] [Green Version]
  51. Bai, W.; Zhang, Y.; Xie, G.; Shen, Z. Analysis of formation causes of rangeland degradation in Maduo County in the source region of Yellow River. Chin. J. Applied Ecol. 2002, 13, 823–826. [Google Scholar]
  52. Chen, B.X.; Zhang, X.Z.; Tao, J.; Wu, J.S.; Wang, J.S.; Shi, P.L.; Zhang, Y.J.; Yu, C.Q. The impact of climate change and anthropogenic activities on alpine grassland over the Qinghai-Tibet Plateau. Agr. For. Meteol. 2014, 189, 11–18. [Google Scholar] [CrossRef]
  53. Pan, Y.; Yu, C.Q.; Zhang, X.Z.; Chen, B.X.; Wu, J.X.; Tu, X.L.; Miao, Y.J.; Luo, L.M. A modified framework for the regional assessment of climate and human impacts on net primary productivity. Ecol. Indic. 2016, 60, 184–191. [Google Scholar] [CrossRef]
  54. Pan, T.; Zou, X.T.; Liu, Y.J.; Wu, S.H.; He, G.M. Contributions of climatic and non-climatic drivers to grassland variations on the Tibetan Plateau. Ecol. Eng. 2017, 108, 307–317. [Google Scholar] [CrossRef]
  55. Wang, H.; Liu, G.H.; Li, Z.S.; Wang, P.T.; Wang, Z.Z. Comparative Assessment of Vegetation Dynamics under the Influence of Climate Change and Human Activities in Five Ecologically Vulnerable Regions of China from 2000 to 2015. Forests 2019, 10, 317. [Google Scholar] [CrossRef] [Green Version]
  56. Wang, X.H.; Piao, S.L.; Ciais, P.; Friedlingstein, P.; Myneni, R.B.; Cox, P.; Heimann, M.; Miller, J.; Peng, S.S.; Wang, T.; et al. A two-fold increase of carbon cycle sensitivity to tropical temperature variations. Nature 2014, 506, 212–215. [Google Scholar] [CrossRef] [PubMed]
  57. Wang, S.J.; Zhou, L.Y.; Wei, Y.Q. Integrated Risk Assessment of Snow Disaster (SD) over the Qinghai-Tibetan Plateau (QTP). Geomat. Nat. Haz. Risk. 2019, 10, 740–757. [Google Scholar]
  58. Cao, S.X. Impact of China’s Large-Scale Ecological Restoration Program on the Environment and Society in Arid and Semiarid Areas of China: Achievements, Problems, Synthesis, and Applications. Critical Rev. Environ. Sci. Technol. 2011, 41, 317–335. [Google Scholar] [CrossRef]
  59. Ouyang, Z.Y.; Zheng, H.; Xiao, Y.; Polasky, S.; Liu, J.G.; Xu, W.H.; Wang, Q.; Zhang, L.; Xiao, Y.; Rao, E.M.; et al. Improvements in ecosystem services from investments in natural capital. Science 2016, 352, 1455–1459. [Google Scholar] [CrossRef]
  60. Gao, J.; Li, X.L. Degradation of frigid swampy meadow on the Qinghai-Tibet Plateau—Current status and future directions of research. Prog. Phys. Geog. 2016, 40, 794–810. [Google Scholar] [CrossRef]
  61. Hua, L.M.; Squires, V.R. Managing China’s pastoral lands: Current problems and future prospects. Land Use Policy 2015, 43, 129–137. [Google Scholar] [CrossRef]
  62. UNDP. Human Development Index Trends, 1990–2017; UNDP: Geneva, Switzerland, 2018.
  63. Bryan, B.A.; Gao, L.; Ye, Y. China’s response to a national land-system sustainability emergency. Nature 2018, 559, 193–204. [Google Scholar] [CrossRef] [PubMed]
  64. Joppa, L.N.; Loarie, S.R.; Pimm, S.L. On the protection of “protected areas”. Proc. Natl. Acad. Sci. USA 2008, 105, 6673–6678. [Google Scholar] [CrossRef] [PubMed] [Green Version]
  65. Oldekop, J.A.; Holmes, G.; Harris, W.E.; Evans, K.L. A global assessment of the social and conservation outcomes of protected areas. Conser. Biol. 2016, 30, 133–141. [Google Scholar] [CrossRef] [PubMed] [Green Version]
  66. Fan, J.; Zhong, L.S.; Huang, B.R.; Yu, H.; Wang, Y.F.; Chen, D.; Guo, R.; Liu, B.Y. Territorial function and feasibility of the Earth’s Third Pole National Park Cluster (in Chinese). Chin. Sci. Bull. 2019, 64, 2938–2948. [Google Scholar]
  67. Holmes, G. Exploring the relationship between local support and the success of protected areas. Conser. Soci. 2013, 11, 72–82. [Google Scholar] [CrossRef]
  68. Geldmann, J.; Barnes, M.; Coad, L.; Craigie, I.D.; Hockings, M.; Burgess, N.D. Effectiveness of terrestrial protected areas in reducing habitat loss and population declines. Biol. Conser. 2013, 161, 230–238. [Google Scholar] [CrossRef]
  69. Geldmann, J.; Joppa, L.; Burgess, N.D. Mapping change in human pressure globally on land and within protected areas. Conserv. Biol. 2014, 28, 1604–1616. [Google Scholar] [CrossRef]
  70. Geldmann, J.; Coad, L.; Barnes, M.; Craigie, I.D.; Hockings, M.; Knights, K.; Leverington, F.; Cuadros, I.C.; Zamora, C.; Woodley, S.; et al. Changes in protected area Management Effectiveness over time a global analysis. Biol. Conser. 2015, 191, 692–699. [Google Scholar] [CrossRef] [Green Version]
  71. Xu, W.H.; Li, X.S.; Pimm, S.L.; Hull, V.; Zhang, J.J.; Zhang, L.; Xiao, Y.; Zheng, H.; Ouyang, Z.Y. The effectiveness of the zoning of China’s protected areas. Biol. Conser. 2016, 204, 231–236. [Google Scholar] [CrossRef]
  72. Geldmann, J.; Manica, A.; Burgess, N.D.; Coad, L.; Balmford, A. A global-level assessment of the effectiveness of protected areas at resisting anthropogenic pressures. Proc. Natl. Acad. Sci. USA 2019, 116, 23209–23215. [Google Scholar] [CrossRef]
Figure 1. Distribution of protected natural zones in the QTP and main river and cropland in the neighboring areas (1–11 represent the Qiangtang, Sanjiangyuan, Qilian, Altun, Kunlun, Everest, Selin, Cibagou, Tashkurgan, Gongbu, and Yanchiwan nature reserves; smaller protected areas are not shown).
Sustainability 14 01652 g001
Figure 2. Spatial distribution of annual NDVI and protected natural areas in the QTP during 1981–2017 (A) and ecoclimatic zones [37] in the QTP (B) (H1, H2, H3, B, C, and D represent the subfrigid, temperate, subtropical broadleaf evergreen forest, semihumid, semiarid, and arid regions).
Sustainability 14 01652 g002
Figure 3. Annual mean NDVI for protected and unprotected areas during 1982−2017 (left) and the NDVI trend for protected and no −protected areas before 2000 and after 2000 (right).
Sustainability 14 01652 g003
Figure 4. The 11 largest nature reserves, other small nature reserves, and their NDVI trends on the QTP during 1982–2017.
Sustainability 14 01652 g004
Figure 5. Forest and grassland protection projects and 10 major nature reserves over the QTP in different periods.
Sustainability 14 01652 g005
Figure 6. Trends in livestock, NDVI (a) and GDP, HDI (b) change in the QTP.
Sustainability 14 01652 g006
Publisher’s Note: MDPI stays neutral with regard to jurisdictional claims in published maps and institutional affiliations.

